Embed Size (px)
Citation preview
Graph-theoretic algorithms for cyber-physical vulnerabilityanalysis of power grid with incomplete information
Anurag K. SRIVASTAVA1 , Timothy A. ERNSTER2,
Ren LIU3, Vignesh G. KRISHNAN1
Abstract A key focus recently has been in assessing the
risk of a coordinated cyber-physical attack and minimizing
the impact of a successful attack. Most of the cyber-
attackers will have limited system information and con-
ventional power grid N - 1 security analysis cannot be
extended to assess the risk. Centrality measures are widely
used in the network science and an attacker with incom-
plete information can use it to identify power system vul-
nerabilities by defining the system as a complex network
but without real-time system measurements. This paper
presents a graph theory based centrality indices for vul-
nerability assessment of the power system due to various
bus and branch contingencies using limited system infor-
mation and provides a preliminary defense mechanism to
prevent such an attack. Proposed work answers the fun-
damental question of possible attack scenarios by balanc-
ing risk (limited information with low risk to get caught or
high risk attack to access more system information) and
impact (identifying contingencies with maximal impact on
system operation). Statistical comparisons are made
between the graph theory measures compared to the cor-
responding DC power flow based N - X linear sensitivity
measures. A unified N - X centrality based performance
index is proposed and validated against the AC power flow
based performance index by doing the real-time simula-
tions of an N - 3 attack scenario. Defensive mechanisms
using topology-based performance indices are also
presented.
Keywords Cyber-physical security, Graph theory,
Transmission system, Contingency, Defense mechanism,
Incomplete information
1 Introduction
Given the exposure of the electric power grid to cyber
threats, the U.S. Department of Energy facilitated the
development of roadmaps to develop, deploy, and maintain
energy delivery systems capable of maintaining critical
functions during a cyber assault [1]. Specifically, devel-
opment of scenario-based analysis tools and credible attack
exercises has been proposed to test the response pre-
paredness of the electricity sector to a coordinated cyber
attack [2]. This requires coming up with a possible strategy
that an attacker can take to find a list of credible
contingencies.
Assume an attacker can perform conventional power
flow based security studies to select targets [3–8]. Here,
conventional contingency screening refers to procedures
using complete network information with voltage, gener-
ation, and load data being acquired at all buses [9]. One of
CrossCheck date: 1 August 2018
Received: 3 December 2017 / Accepted: 1 August 2018 / Published
online: 17 September 2018
� The Author(s) 2018
& Anurag K. SRIVASTAVA
Timothy A. ERNSTER
Ren LIU
Vignesh G. KRISHNAN
1 Department of Electrical Engineering and Computer Science,
Washington State University, Pullman, WA 99163, USA
2 U.S. Army Corps of Engineers, Eugene, OR, USA
3 Dominion Power, Richmond, VA, USA
123
J. Mod. Power Syst. Clean Energy (2018) 6(5):887–899
https://doi.org/10.1007/s40565-018-0448-7
the examples for using all the information is a maximum
network flow approach, an attack model for coordinated
attack scenario as a series of branch outages with the
objective of disrupting the maximum power flow between
energy sources and loads [3]. In [10], a new extended
topological approach for the power system vulnerability
analysis is presented. This approach also considers the
transmission line impedance and line flow limits as the
character of each transmission line. Contingency scenarios
can also be understood through a min-max bi-level model,
where the interactions of both attacker and operator actions
can be simulated. In the bilevel model, attackers are
assumed to have the objective of maximizing load shed by
critical branch outages, and the system operator reacts to
minimize the load shed by re-dispatching generators and
strategic loads shedding [4]. In order to solve the vulner-
ability analysis over a time horizon, a new time-phased
vulnerability analysis method is developed as a bi-level
model [11]. In [12], betweenness centrality computation
for the electric grid is discussed. In [13], several methods
of spectral graph theory to rank substations in the power
grid have been introduced. Some new measures of cen-
trality based on graph theory, specifically for the power
grid are defined in [14], although not defined for multiple
contingencies and not validated with AC power flow. In
[15], a new method is presented to assess the vulnerability
of power system by utilizing limited system information,
which are system topology information, electrical distance,
power transfer distribution factors and line flow limits.
Another structural vulnerability assessment is developed
based on the improved maximum flow approach [16]. In
this method, system topology information, transmission
line capacities, generation & load information, and maxi-
mum flow are utilized to analyse the vulnerability of the
power system. However, since the generation & load
information is dynamically changing, this method is hard to
be utilized by the attacker due to high risk in accessing this
information. In [17], authors develop a purely topological
metrics to analyse the vulnerability of power system. In
this method, electrical distance, power transfer distribution,
and line flow limits are also required to create the pure
topological metrics. Structural characteristics of the net-
work were used to compute important nodes for analysing
susceptibility to voltage instability in [18]. Concept of
hybrid flow betweenness was developed in [19] instead of
assuming the shortest path power flow for computing
topology betweenness. However, some of this information
are very hard to be obtained by the attacker.
A resource constrained attacker will generally plan
attack scenarios based on the static system topology and
take advantage of sensitivities of a power system to
topology changes in order to ensure the greatest chance a
malicious objective is met. Graph theory based centrality
measures require only system topology and branch impe-
dance information to rank contingencies, which are easier
to obtain than system dependent changing measurement
information. Also, the attacker can get the system topology
information from satellite picture and estimate the branch
impedance information based on branch length and branch
materials. For a detail power system security/vulnerability
analysis, power system engineer will need following
‘complete’ information:
1) system topology updated in time based on breaker
status;
2) estimated impedance of the lines;
3) SCADA/ PMU measurements;
4) State estimation solution;
5) list of top contingencies based on the planning
studies.
To analyse the impact of a possible attack by an external
attacker, one need to make assumption about possible
information that an external attacker may have. It is a fair
assumption that system topology information can be easily
accessed and impedance can be estimated. Accessing real
time SCADA and sensor measurements will be challenging
without compromising the control center and hence gaining
access to state estimation solutions will be difficult too
without taking high risk by the attacker. Hence attacker can
get access to only ‘incomplete information’ with minimal
risk, which includes 1), 2) and 3) set of information. In the
proposed work, focus is to answer this question: can
attacker use limited information to identify critical con-
tingencies to cause maximal impact on the system opera-
tion while taking minimal risk?
Earlier work by authors presented vulnerability analysis
with limited information in [20, 21]. Electric grid is sys-
tems of system and has been modelled as a complex net-
work using graph theory and degree, eigenvector,
closeness, vertex betweenness, and edge betweenness
centrality measures was developed. Previous work in
[20, 21] by authors relates to conventional DC power flow
based linear sensitivity factor and comparing with graph
based indices only for N - 1 contingency. DCPF based
N - 1 line outage indices and centrality indices was
developed and compared to observe that a significant
relationship exist between the closeness and edge
betweenness centrality measures. Cyber-physical attack
metric for a protection devices based on ability to discover,
access, attack vector and associated impact was developed
in [21] for N - 1 generator contingencies. Work in [20]
and [21] was further extended in this work by proposing:
a) A new N - X graph theory based bus and branch
vulnerability analysis measures. Subsequent statistical
comparisons are then made between the graph theory
888 Anurag K. SRIVASTAVA et al.
123
measures and the corresponding DC power flow based
N - X linear sensitivity measures.
b) In an attempt to develop a unified centrality perfor-
mance index for ranking N - X contingencies, a
method to combine the closeness and edge between-
ness based N - X contingency algorithms are
proposed.
c) Additionally, real-time digital simulator (RTDS) is
used to test the performance of the unified centrality
performance index for time-series data as expected in
the real power system.
d) Possible defensive mechanisms have also been dis-
cussed to offer guidance for future research
activities.
The contribution of this paper is to develop a technique
to answer following questions:
i) What can a cyber-attacker do to impact power grid
operation given limited information, which is system
topology information and branch impedance informa-
tion, but no real changing measurement information?
ii) To check whether a vulnerability analysis based on
centrality measures can indicate the most critical
nodes/links of the system by comparing with DC and
AC power flow based true ranking.
iii) Suggest defense mechanism to system operator
against that, if the nodes/links with the highest
centrality are attacked.
A new centrality based tool has been developed capable
of ranking at least three concurrent contingencies such that
the top five percent of ranked N - X contingencies have a
higher than average mean AC power flow (ACPF) based
performance index.
2 DC power flow based linear sensitivity factors
In order to set the reference of graph theory based
centrality measures, the centrality algorithm can be vali-
dated against the DC power flow based linear sensitivity
factors (LSF), which commonly have two types – genera-
tion shift factor (GSF) and the line outage distribution
factor (LODF) [9]. GSF and LODF are generally used to
estimate the changes in different line flows for possible line
outages or a given change in bus injection. To meet the
requirement of N - X contingency, LSF needs to be
extended to accommodate multiple changes in bus injec-
tions and multiple line outage, since the LSF for
N - X contingency is multiple bus injection impact factor
(MBIIF) and multiple line outage impact factor (MLOIF).
2.1 Multiple bus injection impact factor (MBIIF)
The GSF al,i represents the change in branch flow on
line l due to an incremental injection at a generator bus i:
al;i ¼DflDPi
ð1Þ
where Dfl is the change in active power flow on line l when
a change in generation or load DPi occurs at bus i.
To compare the sensitivity of the power system to higher
order contingencies, the MBIIF can be generalized. If k is
defined as a set of numbers relating to those buses where
there are changes in bus injections, Dfl,k, can be defined as
the resulting change in real power flow along line l from
the simultaneous change of injections at buses included in k
as:
Dfl;k ¼X
i2kal;iDPi ð2Þ
The linear combination of BIIF terms is weighted accord-
ing to the change in bus injection DPi at multiple buses,
and given two buses A and B, it is not necessarily true that
DPA = DPB. However, for purposes of computing MBIIF,
we need to only ensure similar assumptions are applied
consistently to all contingency cases. In this case, it is
effectively being assumed that given two buses A and B,
DPA & DPB for all A, B , N and A = B. Also, note that
BIIF will change with selection of slack bus, but ranking of
contingencies given different generator outages should not
change, which is important to compare with graph theoretic
based ranking.
For a power system with a set of buses N, and a set of
branches M, the MBIIF can be defined as ak, where k , N,
as:
ak ¼X
l2M
X
i2kal;i ð3Þ
where ak represents the impact of k buses injection changes
on the power system.
2.2 Multiple line outage impact factor (MLOIF)
Similar to the GSF, the LODF dl,k represents a linear
estimate of the proportionate effect a loss of a line k has on
the real power flow on line l of the power system, and is
defined as follows:
dl;k ¼Dfl
fð0Þk
ð4Þ
where Dfl is defined the same as shown for the GSF; and
fð0Þk is the pre-outage active power flow on line k.
Generation of a MLODF matrix for a contingency
involving multiple line outages requires computation of
Graph-theoretic algorithms for cyber-physical vulnerability analysis of power grid… 889
123
LODF matrices [22, 23]. For example, MLODF matrix for
a contingency case involving the outage of lines k1, k2 and
k3, the sum of three separate LODF expressions are pre-
sented in (5):
Dfl ¼ dl;k1� �
f 0k1 þ dl;k2� �
f 0k2 þ dl;k3� �
f 0k3 ð5Þ
Converting (5) into the matrix-vector multiplication yields
(6).
Dfl ¼ dl;k1 dl;k2 dl;k3½ �fð0Þk1
fð0Þk2
fð0Þk3
264
375
¼ MLODFl; k1; k2; k3� �
fð0Þk1
fð0Þk2
fð0Þk3
264
375 ð6Þ
So MLODF factor of a line l for contingencies involving
the outage of lines k1, k2 and k3 can be defined as the
augmentation of three LODFs, expressed in (7).
MLODFl; k1; k2; k3� � ¼ dl;k1 dl;k2 dl;k3½ � ð7Þ
The MLOIF can be defined for a power system with line
outage contingency case c, which contains multiple line
outages, as given by (8):
MLOIFc ¼X
l2M
X
k2cdl;k ð8Þ
where MLOIFc represents the impact of c lines outage on
the whole power system. MLOIF provide a rough manner
in which to assess the sensitivity of line flows to multiple
line outages. Note that if the system is already islanded
after multiple contingencies, islanding detection techniques
need to be used and MLOIF needs to be computed for each
island.
3 AC power flow based performance index
In order to assess the effect of outages on the power
system, the voltage violation and overload performance
indices can be used for a unified AC power flow perfor-
mance index PIACPF [9]:
PIACPF ¼X
L
Pflow;l
Pmaxl
� �2n
þX
I
D Eij jD Ej jmax
� �2m
ð9Þ
where L represents all branches; I represents all buses;
Pflow,l is the calculated MVA flow on line l from the power
flow solution with outages; Pmaxl is the MVA capacity of
line l; n is just a design constant; The variable D Ej jmax
reflects the maximum allowable change in bus voltage; The
change in bus voltage D Eij j is found by taking the
magnitude of the difference between bus voltage magni-
tudes from a solved power flow with no outages and the
power flow solution with outages. While values of n can
theoretically be as large or small as desired, in practice n is
a finite number. This results in some of the branches that
are not overloaded contributing numerical values less than
one to the performance index, and overloaded lines con-
tributing finite values greater than one assuming n C 1/2.
So it is not always the case where the contingency resulting
in the most overloads is given the highest performance
index. Depending on the number of lines overloaded and
the margin from the capacity limit, the performance index
ranking of a contingency will change for different values of
n similar to the variable n for the overload performance
index, m is an another design constant in the performance
index to represent the emphasis given to the number of bus
voltage violation and margin from the maximum specified
voltage variation.
Once PIACPF values are calculated for all contingencies,
credible contingences with severe performance impacts can
be determined with possible system protection
scheme [24].
4 Power system centrality measures
A graph G = {V, E} consists of an ordered pair of
vertices V and edges E. The buses in a power system can be
considered as the set of vertices V, and the transmission
lines and transformers can be treated as the edges
E [14, 24, 25]. Weights x(e) are assigned to each edge
based on the estimated impedance (Z = R ? jX) of corre-
sponding power system branch. However, since the reac-
tive component of a branch impedance is usually much
greater than the resistive component (i.e. X � R), the
weights x(e) can simply use the reactance of a branch as
the edge weight such that x(e) = X.
In our previous work [20, 21], correlation and non-
parametric statistical tests indicated the closeness centrality
measure was most suited to identifying generator contin-
gencies, and the edge betweenness centrality measure for
line outage contingencies. The centrality measures must be
integrated such that bus and branch ranking techniques can
be evaluated simultaneously.
4.1 Closeness centrality
Given an n bus power system, the closeness centrality
measure CC(i) applied to power system defines the
importance of a bus i as the mean geodesic electrical dis-
tance from the bus i to all other buses shown below:
890 Anurag K. SRIVASTAVA et al.
123
CC við Þ ¼ n� 1Pj2Vni
dG i; jð Þ ð10Þ
where vi represents the bus i in the power system; The dG(i,
j) term consists of the entries of the shortest electrical
distance matrix DG, denoting the length of the shortest
electrical distance between bus i and bus j, which is
determined by using a shortest path algorithm, such as the
Floyd-Warshall [26, 27], Dijkstra [28], Bellman–Ford
[29, 30], or Johnson’s algorithm [31].
An N bus power system is modeled as a graph G, and the
set of vertices V 2 RN correspond to the power system
buses. An N - X contingency cases is defined as k 2 RX ,
where k , V. A new closeness centrality impact measure
CIC can then be developed reflecting a collective topology
assessment of multiple generator outages, defined as:
CIC kð Þ ¼X
i2kCC við Þj j ð11Þ
In effect, the closeness centrality impact factor (CCIF) is
the sum of the closeness centrality of the X buses.
4.2 Edge betweenness centrality
The edge betweenness centrality measure defines the
relative importance of each transmission line and trans-
formers as shown below:
CBe eið Þ ¼X
j 6¼k2V
rjk ið Þrjk
ð12Þ
where rjk is the total number of unique shortest paths
between bus j and bus k. The definition of rjk(i) is:
rjk ið Þ¼1 if transmission line i lies on the shortest
electrical path between bus j and bus k
0 otherwise
8<
:
ð13Þ
For extending the edge betweenness centrality toN - X line
outage contingency k 2 RX , all combinations of edges in a
N - X contingency case k are taken X - 1 at a time,
expressed as CX�1X in combinatorics notation. The list E0 2
RX� X�1ð Þ is defined as having unique row entries containing
all but one of the edges E(k). Within a row c of E0, the edgeeo,c from contingency k not appearing inE0(c) will be definedas eo;c ¼ e 2 kð Þ 62 E0 cð Þ. After defining a subgraph
Hc ¼ G� E0 cð Þ. The edge betweenness of eo,c can be now
taken from CBe E Hcð Þð Þ. The collective edge betweenness
impact for contingency kis:
CIBe kð Þ ¼XX
c¼1
CBe eo;c� �
ð14Þ
The edge betweenness centrality impact factor (EBCIF) for
an N - X contingency is the sum of the edge betweenness
centralities for each outage edge.
4.3 Combining closeness centrality and edge
betweenness centrality
Using the closeness and edge betweenness centrality
impact measures, we can develop a centrality based per-
formance index for ranking bus injection and line outage
contingencies:
PICENT kð Þ ¼X
c2k
CBe e0;c� �
CmaxBe
� �2n
þX
i2k
CC við Þ�1
CminC
!2m
ð15Þ
This centrality performance index is structurally similar to
the ACPF performance index. Note that (15) can be mod-
ified to fit with performance indices generally used by
vendors and utilities. Relatively change in PI for ranking is
more important instead of absolute number generated by
(15). However, since it is based on the branch and bus
structural topology of a power system, the resulting ranking
of line and bus injection contingencies is unlikely to reflect
the ACPF performance index in all cases. This reflects a
ranking scheme with limited information and without
knowing real-time power flow or SCADA
measurements.
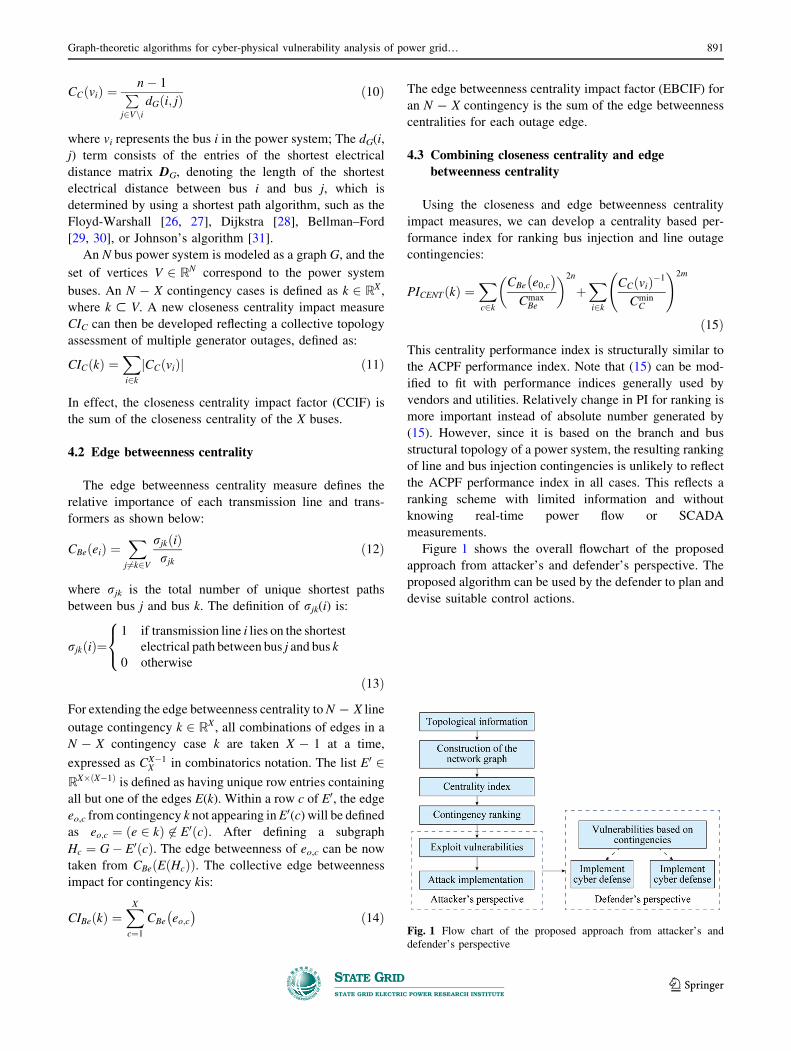
Figure 1 shows the overall flowchart of the proposed
approach from attacker’s and defender’s perspective. The
proposed algorithm can be used by the defender to plan and
devise suitable control actions.
Fig. 1 Flow chart of the proposed approach from attacker’s and
defender’s perspective
Graph-theoretic algorithms for cyber-physical vulnerability analysis of power grid… 891
123
5 Simulation results
Correlating the MLOIF with an edge betweenness cen-
trality measure, or the MBIIF with a closeness centrality
measure, a correlation coefficient R ranging from - 1 to 1
will reflect the degree of similarity between the two mea-
sures [30, 31]. These statistical tests were performed for
both N - 2 and N - 3 results on the IEEE-14, IEEE-30,
IEEE-57 bus systems, and for N - 2 contingencies on the
IEEE-118 bus system.
5.1 Multiple generator contingencies
The correlation results for the closeness centrality
impact factor measure and multiple bus injection impact
factor are presented in Table 1 below with the p-value level
of significance test statistics [32, 33]. It is notable that the
closeness centrality measure appears to have a moderately
strong negative linear relationship with the MBIIF
index.
The Wilcoxon signed rank test [34] was used to calcu-
late the difference between two rankings. To eliminate the
risk of over-biasing the results in a specific high-impact bus
that frequently appears, it is appropriate to select the top
5% of contingencies identified by the CCIF and compare
these ranks to the corresponding MBIIF rank for the con-
tingency. For the smaller N - 2 case of the IEEE-14 bus
system, the sample size is fixed at 10 to maintain a sta-
tistically relevant sample size. The Wilcoxon signed rank
tests for N - 2 and N - 3 contingency cases are summa-
rized in Tables 2 and 3.
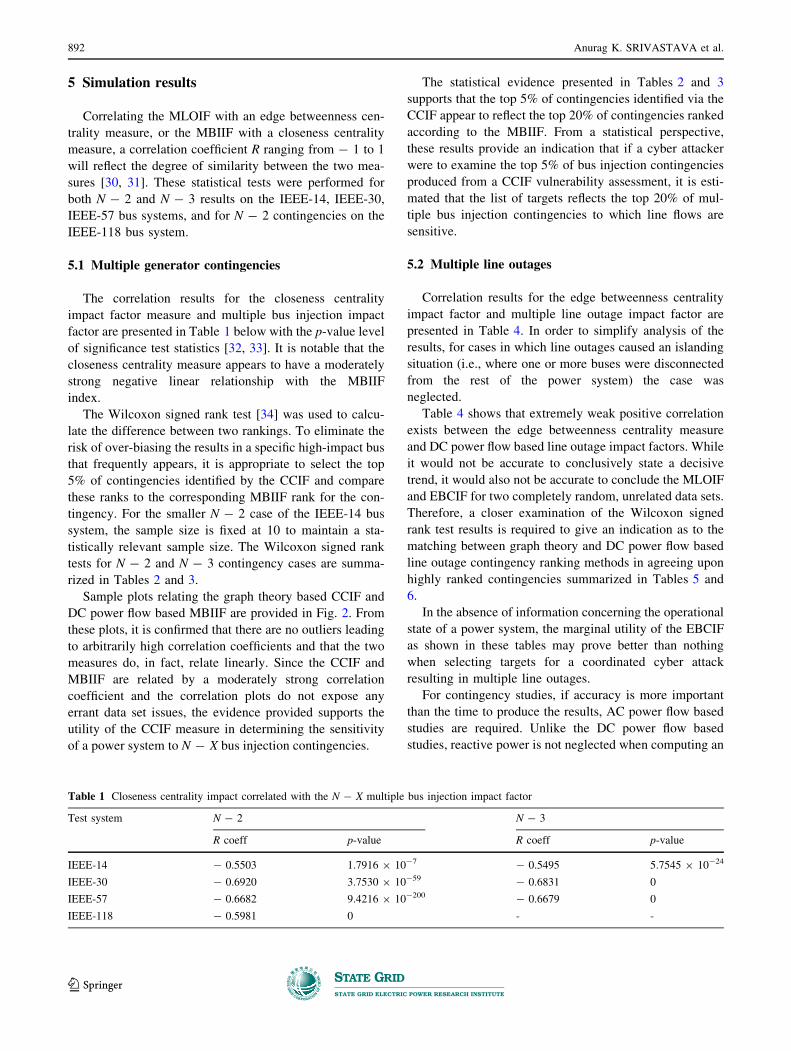
Sample plots relating the graph theory based CCIF and
DC power flow based MBIIF are provided in Fig. 2. From
these plots, it is confirmed that there are no outliers leading
to arbitrarily high correlation coefficients and that the two
measures do, in fact, relate linearly. Since the CCIF and
MBIIF are related by a moderately strong correlation
coefficient and the correlation plots do not expose any
errant data set issues, the evidence provided supports the
utility of the CCIF measure in determining the sensitivity
of a power system to N - X bus injection contingencies.
The statistical evidence presented in Tables 2 and 3
supports that the top 5% of contingencies identified via the
CCIF appear to reflect the top 20% of contingencies ranked
according to the MBIIF. From a statistical perspective,
these results provide an indication that if a cyber attacker
were to examine the top 5% of bus injection contingencies
produced from a CCIF vulnerability assessment, it is esti-
mated that the list of targets reflects the top 20% of mul-
tiple bus injection contingencies to which line flows are
sensitive.
5.2 Multiple line outages
Correlation results for the edge betweenness centrality
impact factor and multiple line outage impact factor are
presented in Table 4. In order to simplify analysis of the
results, for cases in which line outages caused an islanding
situation (i.e., where one or more buses were disconnected
from the rest of the power system) the case was
neglected.
Table 4 shows that extremely weak positive correlation
exists between the edge betweenness centrality measure
and DC power flow based line outage impact factors. While
it would not be accurate to conclusively state a decisive
trend, it would also not be accurate to conclude the MLOIF
and EBCIF for two completely random, unrelated data sets.
Therefore, a closer examination of the Wilcoxon signed
rank test results is required to give an indication as to the
matching between graph theory and DC power flow based
line outage contingency ranking methods in agreeing upon
highly ranked contingencies summarized in Tables 5 and
6.
In the absence of information concerning the operational
state of a power system, the marginal utility of the EBCIF
as shown in these tables may prove better than nothing
when selecting targets for a coordinated cyber attack
resulting in multiple line outages.
For contingency studies, if accuracy is more important
than the time to produce the results, AC power flow based
studies are required. Unlike the DC power flow based
studies, reactive power is not neglected when computing an
Table 1 Closeness centrality impact correlated with the N - X multiple bus injection impact factor
Test system N - 2 N - 3
R coeff p-value R coeff p-value
IEEE-14 - 0.5503 1.7916 9 10-7 - 0.5495 5.7545 9 10-24
IEEE-30 - 0.6920 3.7530 9 10-59 - 0.6831 0
IEEE-57 - 0.6682 9.4216 9 10-200 - 0.6679 0
IEEE-118 - 0.5981 0 - -
892 Anurag K. SRIVASTAVA et al.
123
AC power flow based solution. Therefore, AC power flow
based contingency studies not only allow analysis of steady
state MVA line flows, but bus voltages can be determined
and checked for under/over voltage conditions.
5.3 Comparison of topology and unified AC power
flow performance index
In this section, the measures for a modified IEEE-14 bus
system was compared to provide some basis for analyzing
how a topology based graph theoretic performance index
relates to ACPF based performance indices. Since there is
not a direct mathematical derivation relating the power
flow and centrality analyses, the comparisons performed in
this section are statistical in nature. In order to validate
whether or not there is evidence in support of the centrality
based performance index in selecting higher ranked critical
contingencies as identified through an ACPF performance
index, investigation of this issue is examined by perform-
ing statistical comparisons for an N - 3 contingency
analysis on a modified IEEE-14 bus system.
Larger test systems were not studied since the results
presented in this section will be utilized for real time digital
simulator (RTDS) modeling in the following sections [35].
RTDS was used to generate time series data to simulate test
case scenarios as expected in the real power system. Given
computational hardware limitations of the available test
bed, larger test systems are not possible to simulate in
RTDS in our lab. The IEEE-14 bus system did not specify
MVA ratings for branches, so it was assumed that all lines
were at 75% capacity (rounded up to the nearest whole
number) during the base case with all components in ser-
vice. Simulated N - 3 contingency cases involved all
combinations of one generator outage and two line outages,
with cases resulting in an islanding condition neglected in
order to simplify the analysis. Under such conditions, 652
contingency cases on the modified IEEE-14 bus system
were generated for analysis.
Table 2 Wilcoxon signed rank test for top N - 2 vulnerabilities—closeness centrality impact matched to the multiple bus injection impact
factor
Test system Cases Sample size Achieved confidence (%) Ranking difference (%)
IEEE-14 78 10 94.7 19.2
IEEE-30 406 20 95.0 2.1
IEEE-57 1540 77 95.0 5.0
IEEE-118 6786 339 95.0 11.3
Table 3 Wilcoxon signed rank test for top N - 3 vulnerabilities—closeness centrality impact matched to the multiple bus injection impact
factor
Test system Cases Sample size Achieved confidence (%) Ranking difference (%)
IEEE-14 286 14 94.8 17.5
IEEE-30 3654 183 95.0 5.0
IEEE-57 27720 1386 95.0 5.0
Fig. 2 Closeness centrality impact correlations with the multiple bus
injection impact factor
Table 4 Edge betweenness centrality impact correlated with the
N - X multiple line outage impact factor
Test
system
N - 2 N - 3
R coeff p-value R coeff p-value
IEEE-14 0.2838 2.4163 9 10-4 0.2685 4.6602 9 10-15
IEEE-30 0.1817 1.9418 9 10-6 0.1993 4.5385 9 10-68
IEEE-57 0.0461 0.0114 0.0394 7.4171 9 10-27
IEEE-118 0.2693 9.3170 9 10-256 - -
Graph-theoretic algorithms for cyber-physical vulnerability analysis of power grid… 893
123
In order to calculate performance indices, several design
constants had to be set in the performance index equations.
The exponential constants were set to be m = 1/2 and
n = 1/2 in order to ensure a linear comparison of index
terms and preserve consistency with the analysis method-
ologies performed thus far. Further, setting D Ej jmax¼ 0:1
was assumed since WECC reliability standards limit post
transient bus voltage variations to 10% for N - 2 contin-
gencies, and permissible threshold limits are not specified
for contingencies higher than the N - 2 case [36]. The
Pmaxi values for each line are the MVA capacities in the
IEEE-14 bus system. Design constants for the centrality
performance index were set to give equal weight to the
generator outage and two line outages. Since the lowest
generator centrality value occurred at bus 8, we let CminC
equal the centrality value at bus 8. The value of CmaxBe was
set to be the maximum edge betweenness centrality impact
value for two lines taken simultaneously.
Performing ACPFs on all 652 contingency cases resul-
ted in seven cases where the ACPF diverged. Since no
power flow solution exists on a divergent case, indicating a
possible voltage collapse scenario, it is standard to assign
divergent power flow cases the highest ranking of all
contingencies [37]. However, the lack of a power flow
solution means a performance index cannot be directly
calculated. In order to preserve the ranking importance of
divergent power flow cases, the performance index for the
seven divergent cases was set to be 10% higher than the
largest performance index value for all 645 of the con-
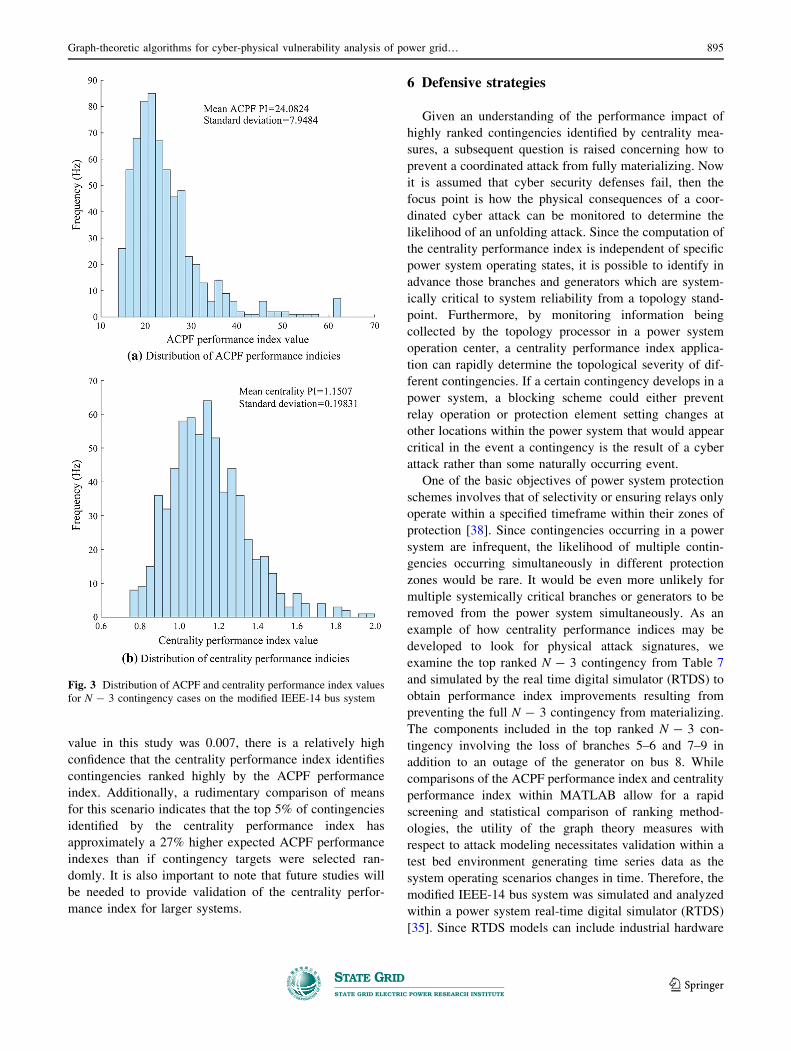
vergent indices. Histograms showing the distribution of
ACPF and centrality performance indices are shown in
Fig. 2.
From the histograms in Fig. 3, it is noticed that for both
centrality and ACPF performance indices the distribution
of performance indices is near normal distribution.
Therefore, we can utilize parametric statistical analysis
techniques when relating the two performance indices [33].
In order to assess whether the top contingencies identified
by the centrality performance index are actually more
critical than N - 3 contingencies selected at random, we
test the following null hypothesis.
H0: The top 5% of contingencies identified by the
centrality performance index has a mean ACPF perfor-
mance index that is indistinct from the mean ACPF per-
formance index for all N - 3 contingencies studied.
As an intermediary process in determining whether or
not the null hypothesis can be rejected, the top 5% of
contingencies identified through the centrality performance
index must be matched to the corresponding ACPF per-
formance index. While the top 5% of contingencies total 33
cases, the first 15 cases are presented in Table 7 for ref-
erence to indicate the data sets being compared.
Since the data set is suited to parametric statistical
techniques, we utilize a T-test [33] to test the null
hypothesis. Basically, the mean ACPF performance index
is calculated for the top 5% of N - 3 contingencies iden-
tified by the centrality performance index, and the mean is
compared to the mean ACPF performance index of all
N - 3 contingencies. The T-test will indicate whether the
two means are distinct, and provide a statistical basis for
assessing the difference between means if the means are
indistinct. The T-test results for the N - 3 contingencies
performed on the modified IEEE-14 bus system are pre-
sented in Table 8.
From the results in Table 8, the evidence is presented in
support of a conclusion to reject the null hypothesis. The
threshold for concluding means to be distinct is commonly
drawn for a p-value less than 0.05 [33], and since the p-
Table 5 Wilcoxon signed rank test for top N - 2 vulnerabilities—multiple line outage impact factor
Test system Cases Sample size Achieved confidence (%) Ranking difference (%)
IEEE-14 163 10 94.7 31.0
IEEE-30 677 34 95.0 46.4
IEEE-57 3014 151 95.0 42.6
IEEE-118 15500 775 95.0 16.4
Table 6 Wilcoxon signed rank test for top N - 3 vulnerabilities—multiple line outage impact factor
Test system Cases Sample size Achieved confidence (%) Ranking difference (%)
IEEE-14 823 41 95.0 34.4
IEEE-30 7504 375 95.0 33.3
IEEE-57 73930 3697 95.0 44.1
894 Anurag K. SRIVASTAVA et al.
123
value in this study was 0.007, there is a relatively high
confidence that the centrality performance index identifies
contingencies ranked highly by the ACPF performance
index. Additionally, a rudimentary comparison of means
for this scenario indicates that the top 5% of contingencies
identified by the centrality performance index has
approximately a 27% higher expected ACPF performance
indexes than if contingency targets were selected ran-
domly. It is also important to note that future studies will
be needed to provide validation of the centrality perfor-
mance index for larger systems.
6 Defensive strategies
Given an understanding of the performance impact of
highly ranked contingencies identified by centrality mea-
sures, a subsequent question is raised concerning how to
prevent a coordinated attack from fully materializing. Now
it is assumed that cyber security defenses fail, then the
focus point is how the physical consequences of a coor-
dinated cyber attack can be monitored to determine the
likelihood of an unfolding attack. Since the computation of
the centrality performance index is independent of specific
power system operating states, it is possible to identify in
advance those branches and generators which are system-
ically critical to system reliability from a topology stand-
point. Furthermore, by monitoring information being
collected by the topology processor in a power system
operation center, a centrality performance index applica-
tion can rapidly determine the topological severity of dif-
ferent contingencies. If a certain contingency develops in a
power system, a blocking scheme could either prevent
relay operation or protection element setting changes at
other locations within the power system that would appear
critical in the event a contingency is the result of a cyber
attack rather than some naturally occurring event.
One of the basic objectives of power system protection
schemes involves that of selectivity or ensuring relays only
operate within a specified timeframe within their zones of
protection [38]. Since contingencies occurring in a power
system are infrequent, the likelihood of multiple contin-
gencies occurring simultaneously in different protection
zones would be rare. It would be even more unlikely for
multiple systemically critical branches or generators to be
removed from the power system simultaneously. As an
example of how centrality performance indices may be
developed to look for physical attack signatures, we
examine the top ranked N - 3 contingency from Table 7
and simulated by the real time digital simulator (RTDS) to
obtain performance index improvements resulting from
preventing the full N - 3 contingency from materializing.
The components included in the top ranked N - 3 con-
tingency involving the loss of branches 5–6 and 7–9 in
addition to an outage of the generator on bus 8. While
comparisons of the ACPF performance index and centrality
performance index within MATLAB allow for a rapid
screening and statistical comparison of ranking method-
ologies, the utility of the graph theory measures with
respect to attack modeling necessitates validation within a
test bed environment generating time series data as the
system operating scenarios changes in time. Therefore, the
modified IEEE-14 bus system was simulated and analyzed
within a power system real-time digital simulator (RTDS)
[35]. Since RTDS models can include industrial hardware
Fig. 3 Distribution of ACPF and centrality performance index values
for N - 3 contingency cases on the modified IEEE-14 bus system
Graph-theoretic algorithms for cyber-physical vulnerability analysis of power grid… 895
123
in the loop, the system-wide effects of compromising an
actual cyber asset in the power system can be observed in a
test bed environment. In order to simulate the cyber attack
in the power system, the attacker is assumed to compro-
mise the substation devices and have the ability to control
the circuit breaker. Thus, the attacker can control the cir-
cuit to remove the transmission line and generator out of
the power grid. If the modern protection system can be
deployed on these vulnerable components, the resiliency of
future smart grids will increase and attacker will move
down the contingency list to cause a maximum possible
impact.
For the purposes of this simulation, we assume that a
cyber attacker is able to exploit some vulnerability in a
power system cyber asset resulting in an N - 3 contin-
gency on the modified IEEE-14 bus system. The top five
N - 3 contingencies identified by the centrality perfor-
mance index measure (presented in Table 7) are carried out
in RTDS, and the ACPF performance index is calculated
directly from the RTDS measurements to assess the
physical consequences of the cyber attack scenario. In
Table 9, RTDS measured performance index results are
compared to the power flow results calculated in MAT-
POWER for the top five contingencies ranked by the
centrality performance index. From Table 9 it is
notable that the impact of an N - 3 contingency modeled
in the test bed is similar to what was expected from the
power flow solution, as the difference between models does
not exceed 7%.
Disparities between performance indices are likely due
to fundamental differences between the Newton-Raphson
power flow solution and the detailed RTDS model with the
different mathematical solver. The values obtained from
RTDS were obtained by measuring the power system for
the steady state condition. However, the component models
in RTDS are considerably more complex than the common
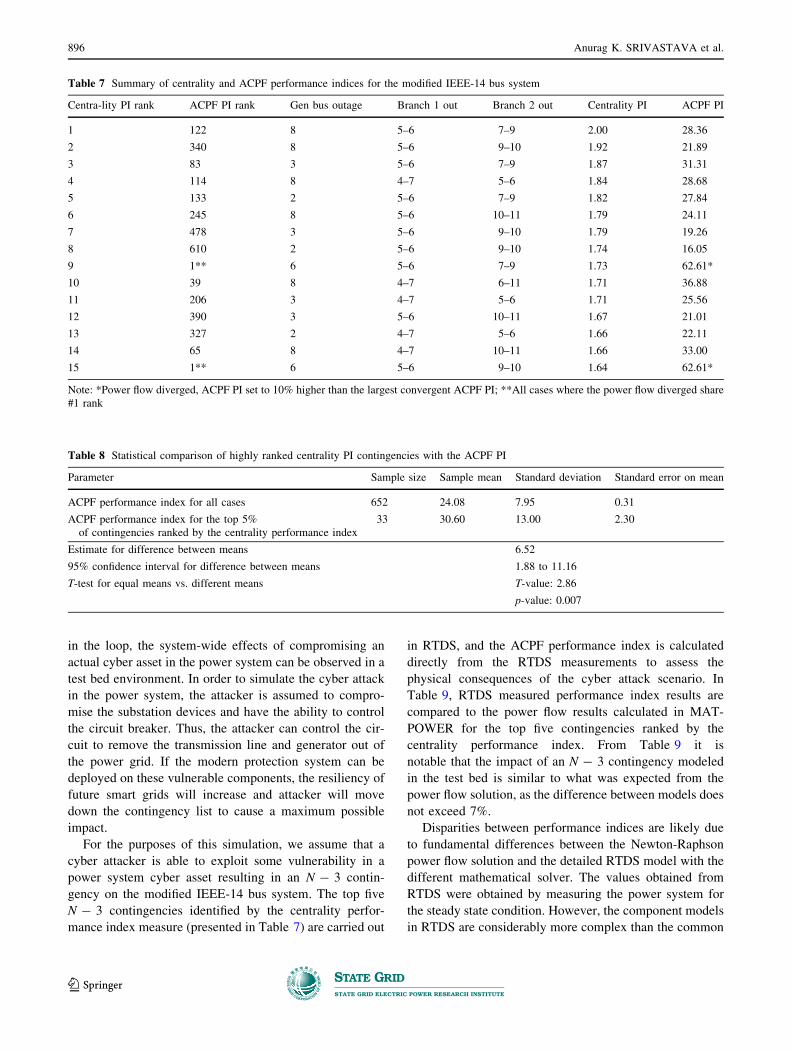
Table 7 Summary of centrality and ACPF performance indices for the modified IEEE-14 bus system
Centra-lity PI rank ACPF PI rank Gen bus outage Branch 1 out Branch 2 out Centrality PI ACPF PI
1 122 8 5–6 7–9 2.00 28.36
2 340 8 5–6 9–10 1.92 21.89
3 83 3 5–6 7–9 1.87 31.31
4 114 8 4–7 5–6 1.84 28.68
5 133 2 5–6 7–9 1.82 27.84
6 245 8 5–6 10–11 1.79 24.11
7 478 3 5–6 9–10 1.79 19.26
8 610 2 5–6 9–10 1.74 16.05
9 1** 6 5–6 7–9 1.73 62.61*
10 39 8 4–7 6–11 1.71 36.88
11 206 3 4–7 5–6 1.71 25.56
12 390 3 5–6 10–11 1.67 21.01
13 327 2 4–7 5–6 1.66 22.11
14 65 8 4–7 10–11 1.66 33.00
15 1** 6 5–6 9–10 1.64 62.61*
Note: *Power flow diverged, ACPF PI set to 10% higher than the largest convergent ACPF PI; **All cases where the power flow diverged share
#1 rank
Table 8 Statistical comparison of highly ranked centrality PI contingencies with the ACPF PI
Parameter Sample size Sample mean Standard deviation Standard error on mean
ACPF performance index for all cases 652 24.08 7.95 0.31
ACPF performance index for the top 5%
of contingencies ranked by the centrality performance index
33 30.60 13.00 2.30
Estimate for difference between means 6.52
95% confidence interval for difference between means 1.88 to 11.16
T-test for equal means vs. different means T-value: 2.86
p-value: 0.007
896 Anurag K. SRIVASTAVA et al.
123
data format input used in a MATPOWER power flow
solution. The detailed component properties taken into
account in the RTDS model are approximated by a more
simplistic equivalent impedance for the Newton-Raphson
power flow model. However, the performance index dis-
parities are subtle enough that we can assume attacks
planned from a centrality based vulnerability assessment
does, in fact, reflect the consequences observed in an actual
power system. Accordingly, the statistical comparisons
made throughout this research provide a basis for assessing
the relative observed performance impact a coordinated
attack planned by centrality measures can achieve on an
actual power system.
In IEEE 14 bus system, it is notable that the bus 8
generator and the branch 7–9 are only separated by a single
bus. Therefore, backup protection schemes would likely
place the two components within one another’s backup
overreach area of protection, and we may risk preventing a
legitimate protection action by blocking protection of
generation on bus 8 if line 7–9 is lost. However, we would
not expect contingency conditions and protection decisions
involving branch 5–6 and branch 7–9 or bus 8 to be related
since there are intermediary components that would be
expected to have more directly associated protective rela-
tionships and contingencies only have a limited geo-
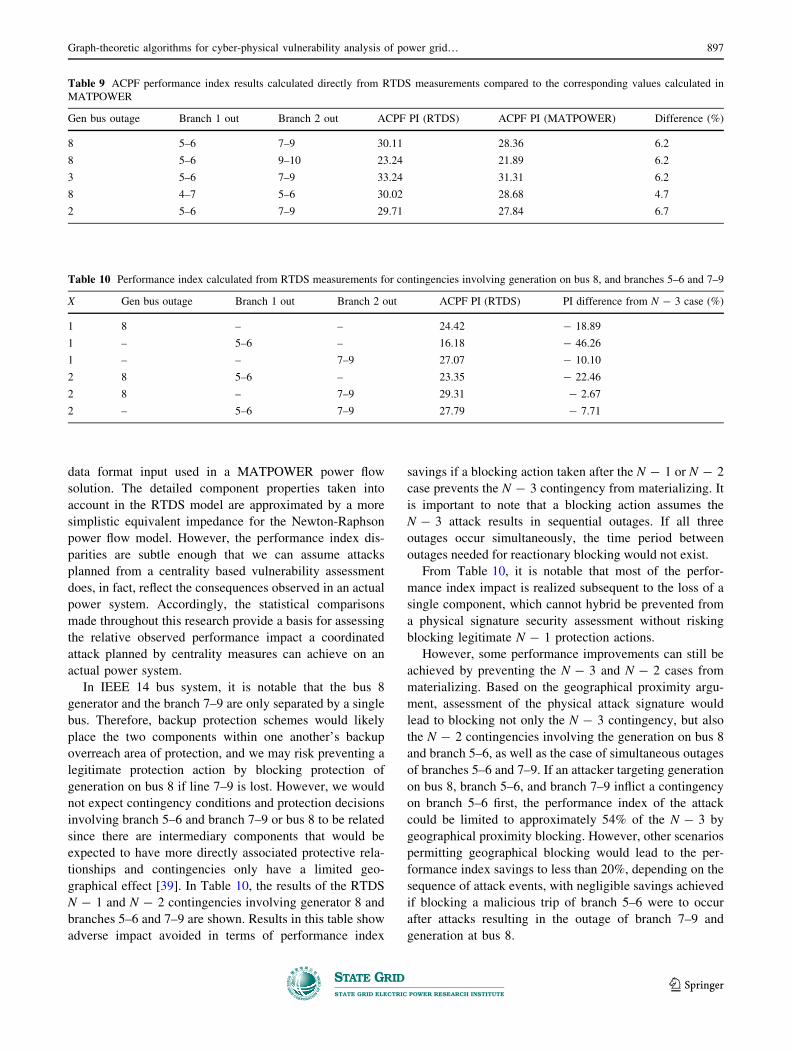
graphical effect [39]. In Table 10, the results of the RTDS
N - 1 and N - 2 contingencies involving generator 8 and
branches 5–6 and 7–9 are shown. Results in this table show
adverse impact avoided in terms of performance index
savings if a blocking action taken after the N - 1 or N - 2
case prevents the N - 3 contingency from materializing. It
is important to note that a blocking action assumes the
N - 3 attack results in sequential outages. If all three
outages occur simultaneously, the time period between
outages needed for reactionary blocking would not exist.
From Table 10, it is notable that most of the perfor-
mance index impact is realized subsequent to the loss of a
single component, which cannot hybrid be prevented from
a physical signature security assessment without risking
blocking legitimate N - 1 protection actions.
However, some performance improvements can still be
achieved by preventing the N - 3 and N - 2 cases from
materializing. Based on the geographical proximity argu-
ment, assessment of the physical attack signature would
lead to blocking not only the N - 3 contingency, but also
the N - 2 contingencies involving the generation on bus 8
and branch 5–6, as well as the case of simultaneous outages
of branches 5–6 and 7–9. If an attacker targeting generation
on bus 8, branch 5–6, and branch 7–9 inflict a contingency
on branch 5–6 first, the performance index of the attack
could be limited to approximately 54% of the N - 3 by
geographical proximity blocking. However, other scenarios
permitting geographical blocking would lead to the per-
formance index savings to less than 20%, depending on the
sequence of attack events, with negligible savings achieved
if blocking a malicious trip of branch 5–6 were to occur
after attacks resulting in the outage of branch 7–9 and
generation at bus 8.
Table 10 Performance index calculated from RTDS measurements for contingencies involving generation on bus 8, and branches 5–6 and 7–9
X Gen bus outage Branch 1 out Branch 2 out ACPF PI (RTDS) PI difference from N - 3 case (%)
1 8 – – 24.42 - 18.89
1 – 5–6 – 16.18 - 46.26
1 – – 7–9 27.07 - 10.10
2 8 5–6 – 23.35 - 22.46
2 8 – 7–9 29.31 - 2.67
2 – 5–6 7–9 27.79 - 7.71
Table 9 ACPF performance index results calculated directly from RTDS measurements compared to the corresponding values calculated in
MATPOWER
Gen bus outage Branch 1 out Branch 2 out ACPF PI (RTDS) ACPF PI (MATPOWER) Difference (%)
8 5–6 7–9 30.11 28.36 6.2
8 5–6 9–10 23.24 21.89 6.2
3 5–6 7–9 33.24 31.31 6.2
8 4–7 5–6 30.02 28.68 4.7
2 5–6 7–9 29.71 27.84 6.7
Graph-theoretic algorithms for cyber-physical vulnerability analysis of power grid… 897
123
While the potential for geographical proximity blocking
of protection actions would require significantly more
study to determine if the preventive action yields a net
benefit to power system security, the purpose of this dis-
cussion is principal to highlight how centrality perfor-
mance indices may be used in interdicting an unfolding
cyber attack in the event information security measures
fail. By modelling how an attacker may target assets for a
coordinated attack and the resulting power system perfor-
mance impact, it can provide the understanding of attack
models and the benefits of potential responses. Yet if the
tradeoffs associated with merging cyber security defensive
mechanisms with power system control and protection
decisions present a significant risk in reacting to false
positives, centrality measures could still be utilized as a
risk assessment index that offers operators an assessment of
the degree to which a contingency situation aligns with a
coordinated attack signature profile based on topological
vulnerabilities.
7 Conclusion
In this paper, the ability of an attacker to do vulnera-
bility analysis of power grid using incomplete information
with minimal risk has been analyzed and possible remedial
solutions have been proposed. A novel algorithm was
proposed for generalizing the closeness and edge
betweenness centrality measures to rank N - X contingen-
cies with limited information. Statistical comparisons with
an N - X DC power flow sensitivity measure for assessing
the loss of bus injection indicated a close relationship with
the developed closeness centrality N - X algorithm.
However, the edge betweenness centrality N - X algo-
rithm was weakly related to the respective DC power flow
based measure for assessing multiple line outages.
It is therefore concluded that the proposed closeness
centrality impact factor method for identifying high impact
bus injection outages is the most promising topology based
vulnerability assessment tool for assessing the physical
vulnerability of a power system to a coordinated attack
based on limited information. This paper also proposed a
unified centrality performance index, and statistical evi-
dence was provided in support of the centrality perfor-
mance index to select N - X contingencies that are
expected to have a higher adverse impact compared to
contingencies selected at random. However, the results also
indicate limitations in the ability of centrality based indices
to capture top contingencies.
In order to lay some foundational groundwork for the
application of centrality performance index measures to
modelling a coordinated attack on an actual power system,
a modified IEEE-14 bus system was developed in real-time
digital simulator (RTDS) for use in attack scenario
modelling.
Using RTDS, the performance impact of highly ranked
contingencies identified by the centrality performance
index was confirmed using simulator measurements.
Additionally, the adverse impact avoided based on per-
formance index savings associated with blocking a coor-
dinated cyber attack using the physical system information
after a contingency and associated cyber information was
studied as a defense mechanism. It was then postulated that
graph theory can assist in thwarting cyber attacks by
assessing changes in the topology state of a power system
for physical attack signatures that have the potential for
leading to high impact contingencies.
Open Access This article is distributed under the terms of the Creative
Commons Attribution 4.0 International License (http://
creativecommons.org/licenses/by/4.0/), which permits unrestricted
use, distribution, and reproduction in any medium, provided you give
appropriate credit to the original author(s) and the source, provide a link
to the Creative Commons license, and indicate if changes were made.
References
[1] US Department of Energy, Energy Sector Control Systems
Working Group (2010) Roadmap to achieve energy delivery
systems cyber security. September
[2] North American Electric Reliability Corporation (NERC) and
U.S. Department of Energy (DOE) (2010) High-impact, low-
frequency event risk to the North American bulk power system.
http://www.nerc.com/files/HILF.pdf. Accessed June 2010
[3] Rocco CM, Ramirez-Marquez JE, Salazar DE et al (2011)
Assessing the vulnerability of a power system through a mul-
tiple objective contingency screening approach. IEEE Trans
Reliab 60(2):394–403
[4] Arroyo JM (2010) Bilevel programming applied to power sys-
tem vulnerability analysis under multiple contingencies. IET
Gener Transm Distrib 4(2):178–190
[5] Kundur D, Feng X, Liu S et al (2010) Towards a framework for
cyber attack impact analysis of the electric smart grid. In:
Proceedings of the 1st IEEE international conference on smart
grid communications (SmartGridComm), Gaithersburg, USA,
4–6 October 2010, pp 244–249
[6] Ten CW, Govindarasu M, Liu CC (2010) Cybersecurity for
critical infrastructures: attack and defense modeling. IEEE
Trans Syst Man Cybern A Syst Hum 40(4):853–865
[7] Hashemi-Dezaki H, Askarian-Abyaneh H, Haeri-Khiavi H
(2016) Impacts of direct cyber-power interdependencies on
smart grid reliability under various penetration levels of
microturbine/wind/solar distributed generations. IET Gener
Transm Distrib 10(4):928–937
[8] Yasinzadeh M, Seyedi H (2015) Fake measurement identifica-
tion in power substations based on correlation between data and
distance of the evidence. IET Gener Transm Distrib
9(5):503–512
[9] Wood AJ, Wollenberg BF (1996) Power generation operation
and control, 2nd edn. Wiley, New York, pp 410–432
[10] Bompard E, Napoli R, Xue F (2010) Extended topological
approach for the assessment of structural vulnerability in
transmission networks. IET Gener Transm Distrib 4(6):716–724
898 Anurag K. SRIVASTAVA et al.
123
[11] Sayyadipour S, Yousefi GR, Latify MA (2016) Mid-term vul-
nerability analysis of power systems under intentional attacks.
IET Gener Transm Distrib 10(15):3745–3755
[12] Rajasingh I, Rajan B, Isido F (2009) Betweenness-centrality of
grid networks. In: Proceedings of international conference on
computer technology and development (ICCTD), Kota Kina-
balu, Malaysia, 13–15 November 2009, pp 407–410
[13] Cuffe P, Keane A (2015) Visualizing the electrical structure of
power systems. IEEE Syst J 11(3):1810–1821
[14] Wang Z, Scaglione A, Thomas R (2010) Electrical centrality
measures for electric power grid vulnerability analysis. In: 49th
IEEE conference on decision and control (CDC), Atlanta, USA,
15–17 December 2010, pp 5792–5797
[15] Fang J, Su C, Chen Z et al (2016) Power system structural
vulnerability assessment based on an improved maximum flow
approach. IEEE Trans Smart Grid 9(2):777–785
[16] Bompard E, Wu D, Xue F (2011) Structural vulnerability of
power systems: a topological approach. Electr Power Syst Res
81(7):1334–1340
[17] Bompard E, Pons E, Wu D (2012) Extended topological metrics
for the analysis of power grid vulnerability. IEEE Syst J
6(3):481–487
[18] Adebayo I, Jimoh A, Yusuff A (2017) Voltage stability
assessment and identification of important nodes in power
transmission network through network response structural
characteristics. IET Gener Transm Distrib 11(6):1398–1408
[19] Bai H, Miao S (2015) Hybrid flow betweenness approach for
identification of vulnerable line in power system. IET Gener
Transm Distrib 9(12):1324–1331
[20] Ernster TA, Srivastava AK (2012) Power system vulnerability
analysis—towards validation of centrality measures. In: IEEE
T&D conference and exposition, Orlando, USA, 7–10 May
2012, pp 1–6
[21] Srivastava A, Morris T, Ernster T et al (2013) Modeling cyber-
physical vulnerability of the smart grid with incomplete infor-
mation. IEEE Trans Smart Grid 4(1):235–244
[22] Guo J, Fu Y, Li Z et al (2009) Direct calculation of line outage
distribution factors. IEEE Trans Power Syst 24(3):1633–1634
[23] Guler T, Gross G, Liu M (2007) Generalized line outage dis-
tribution factors. IEEE Trans Power Syst 22(2):879–881
[24] Amraee T, Ranjbar AM, Feuillet R et al (2009) System pro-
tection scheme for mitigation of cascaded voltage collapses. IET
Gener Transm Distrib 3(3):242–256
[25] Cotilla-Sanchez E, Hines P, Barrows C et al (2012) Comparing
the topological and electrical structure of the North American
electric power infrastructure. IEEE Syst J 6(4):616–626
[26] Floyd RW (1962) Algorithm 97: shortest path. Commun ACM
5(6):345
[27] Warshall S (1962) A theorem on boolean matrices. J ACM
9(1):11–12
[28] Dijkstra EW (1959) A note on two problems in connection with
graphs. Numerishe Matematik 1(1):269–271
[29] Bellman R (1958) On a routing problem. Q Appl Math
16(1):87–90
[30] Ford LR, Fulkerson DR (1954) Maximal flow through a net-
work. Can J Math 8(3):399–404
[31] Johnson DB (1977) Efficient algorithms for shortest paths in
sparse networks. J ACM 24(1):1–13
[32] Rumsey D (2009) Statistics II for dummies. Wiley, Indianapolis,
pp 275–279
[33] Lyman Ott R, Longnecker M (2010) An introduction to statis-
tical methods and data analysis, 6th edn. Brooks/Cole CEN-
GAGE Learning, Belmont, pp 293–305
[34] Rumsey D (2009) Statistics II for dummies. Wiley, Indianapolis,
pp 296–301
[35] Real-Time Digital Simulator Tutorial Manual (2006) RTDS
Technologies Inc., May 2006
[36] WECC Western electricity coordinating council. Reliability
standards and criterion. http://www.wecc.biz. Accessed 29
February 2016
[37] Liu H, Bose A, Venkatasubramanian V (2000) A fast voltage
security assessment method using adaptive bounding. IEEE
Trans Power Syst 15(3):1137–1141
[38] Blackburn JL, Domin TJ (2007) Protective relaying principles
and applications, 3rd edn. CRC Press, Boca Raton, pp 20
[39] Zaborsky J, Whang KW, Prasad K (1980) Fast contingency
evaluation using concentric relaxation. IEEE Trans Power
Appar Syst 99(1):28–36
Anurag K. SRIVASTAVA is an associate professor of electric
power engineering at Washington State University and the director of
the Smart Grid Demonstration and Research Investigation Lab
(SGDRIL) within the Energy System Innovation Center (ESIC). He
received his Ph.D. degree in electrical engineering from the Illinois
Institute of Technology in 2005. His research interest includes data-
driven algorithms for power system operation and control. Dr.
SRIVASTAVA is an editor of the IEEE Transactions on Smart Grid,
IET Generation, Transmission and Distribution, SUSCOM, IEEE
Transactions on Power System and an IEEE distinguished lecturer,
and the author of more than 250 technical publications including a
book on power system security.
Timothy A. ERNSTER received the B.S. degree from Gonzaga
University in 2006, and M.S. degree in 2011 from Washington State
University. He works with the U.S. Army Corps of Engineers, with
notable awards for service in support of the U.S. reconstruction
mission in Baghdad, Iraq during Operation Iraqi Freedom. His
interests include power system operation and security.
Ren LIU received his M.S. degree in electrical engineering from
Arizona State University in 2012 and his Ph.D. degree in electrical
engineering from Washington State University in 2017. He currently
works in Dominion Energy. His research interest includes cyber-
physical security of power system, synchrophasor application, and
blackstart analysis.
Vignesh G. KRISHNAN received his B.S. degree in electrical and
electronics engineering from PSG College of Technology, Coimbat-
ore in 2010 and his Ph.D. degree in electrical engineering from Indian
Institute of Technology, Kanpur in 2016. He is an assistant research
professor at Washington State University, Pullman. His research
interests include cyber-physical security of power system, power
system modeling and control, and transactive energy systems.
Graph-theoretic algorithms for cyber-physical vulnerability analysis of power grid… 899
123


![Brochure - LanguageCourse.Net · 9lghr%urfkxuh zzz lodf frp ydqfrxyhu zzz lodf frp ydqfrxyhufdpsxv,/$&9dqfrxyhu /hduqlqjodqjxdjhlvqrwphprul]lqjzrugv /dqjxdjhohduqlqjlvolnh ... brochure](https://img.pdfslide.net/doc/110x75/5c0281b609d3f2983b8bf741/brochure-9lghrurfkxuh-zzz-lodf-frp-ydqfrxyhu-zzz-lodf-frp-ydqfrxyhufdpsxv9dqfrxyhu.jpg)


![pppppppppppppppppppppppppppppppppppppppppppppppppppppppppp ...unitaryplan.aucklandcouncil.govt.nz/Images/Printable PDFs... · 3huvldq/lodf 0holdd]hgdudfk 6w/xnhv 5rdg /rw '3 3huvldq/lodf](https://img.pdfslide.net/doc/110x75/5be29d3409d3f288328c7a1b/pppppppppppppppppppppppppppppppppppppppppppppppppppppppppp-pdfs-3huvldqlodf.jpg)