Embed Size (px)
Citation preview
Grapheme Monitoring in Picture Naming: AnElectrophysiological Study of Language Production
Olaf Hauk*, Brigitte Rockstroh^, and Carsten Eulitz^
Summary: Electrocortical correlates of language production were examined in two picture naming tasks that involved grapheme monitoring. In bothtasks subjects (N=12) had to detect target letters in picture names, the target letter being positioned either at the beginning or at the end of the picturename. Between tasks, the target letter was shown either before (target-picture, TP) or after (picture-target, PT) the presentation of the object pictures.In both tasks, subjects responded faster, whenever the target letter appeared at the beginning of the picture name than at its end. The EEG, recordedfrom 64 electrodes, was analyzed in the signal and in the source space (using the Minimum Norm estimate). Differences in the event-related potential(ERP) following the second stimulus became evident earlier in the PT (at 320 ms) than the TP (456 ms) task. This onset of diverging ERPs was called the"point of divergence" (POD). The ERP following the POD was characterized by a positive deflection in the "begin" condition in both tasks. In the "end"condition, the sources of brain activity were focused over the left hemisphere in the TP, while a bilateral distribution characterized the PT task. Perfor-mance and electrocortical indices support the hypothesis of serial "left-to-right" processing of a representation of the picture name. Theleft-hemispheric activity focus in the TP task is assumed to indicate the encoding of the picture name, while frontal symmetrical activity in the PT taskmight indicate the involvement of working memory processes.
Key words: Event-related potentials; Picture naming; Grapheme monitoring; Minimum-norm estimates.
IntroductionPicture naming has been well established as a para-
digm for the investigation of language production. It is anatural task, easy to perform, and involves most of the pro-cessing stages of language production (e.g., Levelt et al.1998; Snodgrass and Vanderwart 1980; Theios andAmrhein 1989; Glaser 1992; Johnson et al. 1996). The studyof brain processes involved in picture naming by means ofneuroimaging methods, however, is less easy. Functionalmagnetic resonance (fMRI) or positron emission tomogra-phy (PET) imaging hardly reflect brain activity in the sub
second time range. However, such a high temporal resolu-tion is necessary for the description of different processingstages during picture naming lasting all together abouthalf a second (Levelt et al. 1998, 1999). Methods with ade-quate time resolution in this respect, such as electroen-cephalography (EEG) or magnetoencephalography(MEG) are susceptible to muscle artifacts inherent in artic-ulation or mouth movements that may precede overt nam-ing. Silent articulation may not allow sufficient control ofthe subject's performance, although EEG (Eulitz et al. 2000)and MEG (Levelt et al. 1998; Salmelin et al. 1994) studiesfound brain activation components before 400 ms not to beaffected by articulatory muscle activity. Usinghigh-resolution MEG, Levelt and colleagues (1998) distin-guished visual processing and accessing of the lexical con-cept (0-150 ms), lemma selection (150-275 ms),phonological encoding (275-400 ms) and phonetic andarticulatory processing (400-600 ms) as serial stages of pro-cessing in picture naming. Still, it may be assumed that theonset and duration of these distinct processing stagesmight vary between tasks or subjects, so that it should beadvantageous to determine further indicators for the"chronometry" of processing by a data driven procedure.
With this purpose the present study evaluatedgrapheme monitoring in a picture naming task. In an ear-lier study Wheeldon and Levelt (1995) used a pho-neme-monitoring task to test for serial processing in picturenaming, specifically serial "left-to-right" generation of a
* Cognition and Brain Sciences Unit, Medical Research Council,Cambridge, UK.
^ Department of Psychology, University of Konstanz, FRG.Accepted for publication: June 10, 2001.We are grateful to Valerie Zitzlsperger, Michaela Schlichtling and
Marcus Meinzer for technical assistance, and Sabine Heim, ChristianDobel, Elvira Zobel, Andreas Keil, Friedemann Pulvermüller, HenningReetz for helpful advice and inspiring discussions. We also especiallyappreciate the critical advice and comments from Prof. Aditi Lahiri.Work was supported by grants of the DeutscheForschungsgemeinschaft.
Correspondence and reprint requests should be addressed to: OlafHauk, Medical Research Council, Cognition and Brain Sciences Unit, 15Chaucer Road, Cambridge, CB2 2EF, UK.
Fax: +44 (0) 1223 359062E-mail: [email protected] © 2001 Human Sciences Press, Inc.
Brain Topography, Volume 14, Number 1, Fall 2001 (© 2001) 3
phonological representation of the to-be-monitored word.Subjects had to decide whether an acoustically presentedtarget phoneme was present or absent in a two-syllabicword that had to be produced in a word translation task.Reaction times varied with the position of the target pho-neme in the word, being shorter by about 123 ms when thetarget appeared with the onset of the first syllable thanwhen it was positioned at the second syllable’s onset. Thisparadigm was adapted in the present study, in which agrapheme monitoring task was embedded into a picturenaming task. The hypothesis about the serial "left-to-right"encoding of the picture was examined by presenting pic-tures with the target grapheme being positioned either atthe beginning ("begin" condition) or at the end ("end" con-dition) of the picture name. It was hypothesized that thedecision time should be shorter for the "begin" than for the"end" condition if serial "left-to-right" information process-ing accomplishes grapheme monitoring. In addition to theperformance indices, the brain responses should distin-guish the onset of the encoding of the picture name that isthe point in time when subjects start to access informationabout the picture name. Therefore, the "point of diver-gence" (POD) was determined from the difference in theevent-related brain responses between the "begin" and the"end" condition. In the "end" condition, the time intervalfollowing this POD should reflect the incremental encod-ing and monitoring of this representation. Regardless of itsposition, the target grapheme was supposed to elicit aP300-like response, if it was considered a relevant targetwithin the stream of irrelevant stimuli.
If the POD appears due to earlier target detection inthe "begin" condition, it should elicit a P3-like deflectionin this condition in the time range thereafter (see, for in-stance, van Turennout et al. 1997, who described P300 insemantic classification or phoneme detection tasks). Inthe "end" condition, however, incremental encoding andmonitoring should still take place.
Moreover, performance and electrocortical re-sponses of grapheme monitoring were compared be-tween two different tasks. In one task, the targetgrapheme was presented before the picture ("tar-get-picture" task, TP). This should provoke – and there-fore test for – "on-line" monitoring according toWheeldon and Levelt (1995). In the other task, the targetgrapheme was presented following the picture ("pic-ture-target" task, PT), thereby requiring the retrieval ofthe picture name from short-term memory for graphememonitoring. A comparison of performance and brain re-sponses between these tasks should provide evidencewhich process might be active in grapheme monitoring.
1) If the monitoring process is based on the retrievalof the name's code, the latency difference between the de-tection of a target at the beginning and at the end of the
picture's name in the PT task should be smaller than dur-ing "on-line" monitoring in the TP task.
2) If serial encoding is at the basis of the monitoringprocess, a left temporal focus of brain activity was ex-pected in the TP task after the POD in the end condition.(Since serial encoding could start only around the POD,no left-lateralized distribution of brain activity was ex-pected before the POD.)
3) If picture naming and grapheme monitoring arebased on the retrieval of the picture name from workingmemory, a left-frontal focus of brain activity was ex-pected in the PT task before the POD. The PT task re-quires that the picture name is encoded and that aphonological representation of the object's name is heldin the phonological loop (Baddeley 1992) until the moni-toring process has been finished.
Verbal working memory has been associated withactivity in the left hemisphere (e.g. Cabeza and Nyberg2000), and imaging studies indicate left-hemispheric ac-tivity for phonological encoding as well. Regions consis-tently involved in tasks requiring naming, as determinedfrom imaging studies, include the left fusiform/inferiortemporal-occipital gyrus and the superior/middle occip-ital gyrus (Murtha et al 1999). Price et al (1996) reportedactivity mainly in the left hemisphere, specifically the in-ferior occipital gyrus, the lingual gyrus, the mid fusiformgyrus and a mid frontal area during object naming (com-pared to object viewing) and color naming (compared tocolor viewing). Damasio and colleagues (1996) found cat-egory specific activity changes for picture naming in theleft temporal pole and in left inferior-temporal regions.They suggested that these regions play an intermediaryrole between the conceptual and the phonemic process-ing stage of picture naming. This might correspond to theretrieval of a lemma and/or a phonological code inLevelt's model (Levelt et al 1999). Electromagnetic stud-ies support the left-hemispheric activity in different pic-ture naming tasks (e.g., Stuss et al. 1983; Stuss et al. 1984;Eulitz et al. 2000; Levelt et al. 1998; Salmelin et al. 1994).
Based on this evidence, the present study should pro-vide additional evidence on the nature and time course ofthe particular processes in picture naming and monitor-ing by comparing the asymmetry of brain activation be-fore and after the POD in the two tasks. We expected thechange of processing stages around the POD in both tasksto be indicated by a change in the lateralisation of brain ac-tivity. Thus, retrieval of phonologically encoded namesfrom verbal working memory processes was to be con-cluded from left-lateralised activity before and bilateralactivation after the POD in the PT task. Serial on-line mon-itoring and encoding was expected to show up in bilateralactivity before and left-lateralised activity after the POD inthe "end" condition of the TP task.
4 Hauk et al.
Methods
Subjects
Twelve healthy subjects with normal or cor-rected-to-normal vision (7 female, 5 male, mean age:28±5.6 years) were recruited for the present study. All sub-jects were monolingual native speakers of German. Meanhandedness score assessed by the Oldfield handedness in-ventory (Oldfield 1971) was 81 on average for the sample.Subjects received a financial bonus for participation in theexperimental session, which lasted about 2 hours.
Design and Material
A series of sixty line drawings of objects (selectedfrom the Snodgrass and Vanderwart (1980) picture seriesand completed from a collection of pictures of the Depart-ment) and 14 capital letters served as stimuli. Letters andobject pictures were presented in white on black back-ground. Object names were selected to be monosyllabicwith consonants at their beginning and end, to have amean word length of 4.15 letters, and a mean word fre-quency of 200.4 per million according to the CELEX database. Target letters were consonants (vowels are known tohave a longer production time than consonants, and con-sonants and vowels seem to be represented differently inthe brain (Caramazza et al. 2000)) and were arranged tooccur a) at least twice as often at the beginning of a namethan at the end (K, B, F, M), b) at least twice as often at the
end than at the beginning (N, L, D), and c) approximatelybalanced at beginning and end (S, T, H, F, R, G, Z). Ac-cording to these criteria K, B, F, and M could be presented28 times in the "begin" condition, N, L, and D were pre-sented 21 times in the "end" condition, and S, T, H, F, R, G,Z were presented on 31 trials at the beginning and on 33trials at the end of a word. Stimuli were selected to achievea high number of object names. This could only be accom-plished taking into account an unbalanced distribution oftarget consonants at the beginning and end of the objectnames. t-tests compared mean reaction times for trials inwhich targets from the "begin" and from the "balanced"class were actually present at the beginning of a picturename, and trials in which targets from the "end" and fromthe "balanced" class were actually present at the end of apicture name. These comparisons did not reveal any sig-nificant behavioural effect, suggesting that these charac-teristics of the stimulus material did not substantiallyaffect our results. The correlation between word frequen-cies of picture names taken from the CELEX data basewith reaction times in the conditions "begin" and "end"was computed for both tasks. For the "begin" conditionscorrelations approached significance (TP: r=-0.23, p>0.08;PT: r=-0.22, p>0.09), but not for the "end" conditions(p>0.25 for TP and PT), and neither did the correlations ofword frequencies with the corresponding differences inreaction times ("end" minus "begin", p>0.5 for both tasks).
Stimulus presentation and timing was controlled bythe "Experimental Run Time System V3.25" (ERTS) soft-ware, which was also used for the recording of perfor-mance indices (error rate and reaction time).
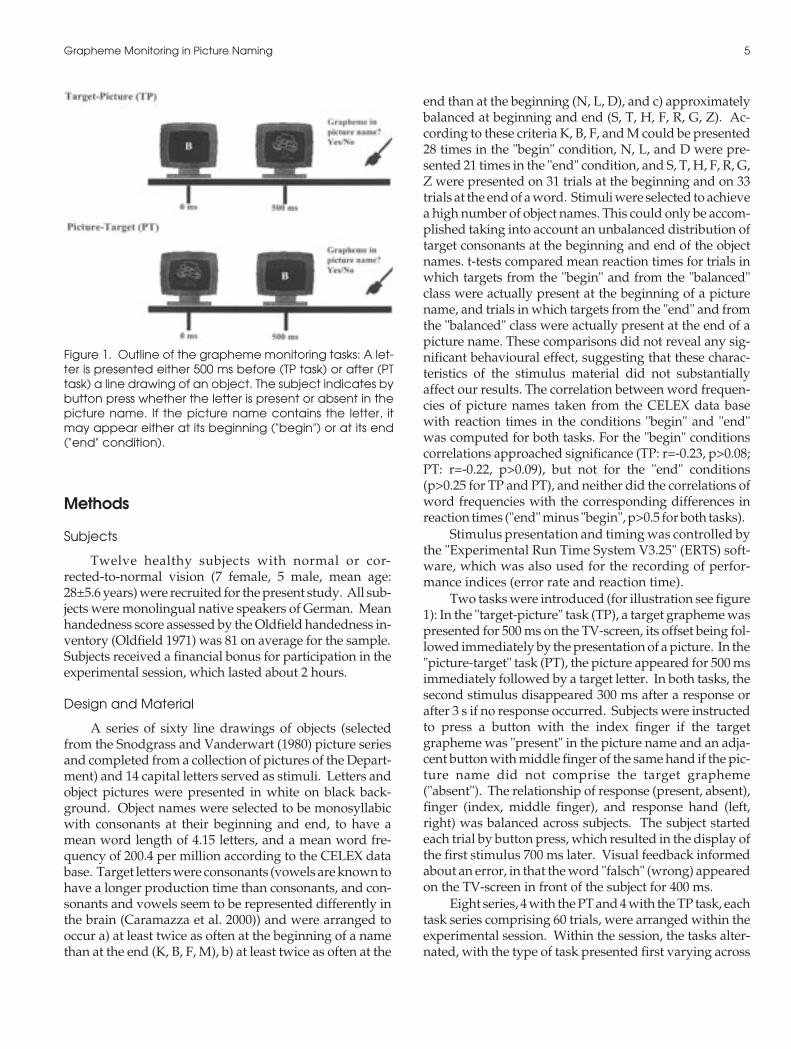
Two tasks were introduced (for illustration see figure1): In the "target-picture" task (TP), a target grapheme waspresented for 500 ms on the TV-screen, its offset being fol-lowed immediately by the presentation of a picture. In the"picture-target" task (PT), the picture appeared for 500 msimmediately followed by a target letter. In both tasks, thesecond stimulus disappeared 300 ms after a response orafter 3 s if no response occurred. Subjects were instructedto press a button with the index finger if the targetgrapheme was "present" in the picture name and an adja-cent button with middle finger of the same hand if the pic-ture name did not comprise the target grapheme("absent"). The relationship of response (present, absent),finger (index, middle finger), and response hand (left,right) was balanced across subjects. The subject startedeach trial by button press, which resulted in the display ofthe first stimulus 700 ms later. Visual feedback informedabout an error, in that the word "falsch" (wrong) appearedon the TV-screen in front of the subject for 400 ms.
Eight series, 4 with the PT and 4 with the TP task, eachtask series comprising 60 trials, were arranged within theexperimental session. Within the session, the tasks alter-nated, with the type of task presented first varying across
Grapheme Monitoring in Picture Naming 5
Figure 1. Outline of the grapheme monitoring tasks: A let-ter is presented either 500 ms before (TP task) or after (PTtask) a line drawing of an object. The subject indicates bybutton press whether the letter is present or absent in thepicture name. If the picture name contains the letter, itmay appear either at its beginning ("begin") or at its end("end" condition).
subjects. Within each trial series the target grapheme waspresent in the picture name on 30 trials and not present inanother 30 trials. Every grapheme required equally oftena "present" and an "absent" decision. On 50% of the "pres-ent" trials, a target letter appeared at the beginning of thepicture name and in the other 50% at its end. This resultedin 60 trials for the "begin", 60 trials for the "end", and 120trials for the "absent" condition. Within series, trials of thedifferent conditions varied pseudorandomly. Each blocklasted approximately 6 minutes.
Subjects were sitting approximately 1 m in front of ablack TV-screen, on which stimuli appeared, within a vi-sual angle of 5º. Prior to the experiment, subjects weremade familiar with the stimulus material. It was ascer-tained that every picture was named correctly. In addi-tion, two series of practice trials, one for each task, ensuredthat the subjects had understood the instructions.
Data acquisition and analysis
The EEG was recorded from 64 electrodes with theEasycap montage using SynAmps amplifiers (Neuroscan).The Cz electrode served as recording reference. For eachsubject, electrode positions were digitized at the end of theexperimental session using the Polhemus digitizer.
Data were recorded with a rate of 500 Hz (bandpassDC to 70 Hz) and then high-pass filtered at 1 Hz to com-pensate for slow drifts. Offline data reduction includedfurther down sampling to 250 Hz (40 Hz low-pass filter).Eye movement artifacts were corrected using the multiplesource eye correction procedure by Berg and Scherg (1994).
In addition, trials were visually inspected, and trialscontaminated by electrode drifts or high alpha-activitywere excluded from further data processing. Trials withthe difference between maximum and minimum ampli-tude exceeding 120 µV in any one channel were automat-ically rejected. Only trials with correct responses andreaction times below 2 s were considered for the analysis.
For the TP task 47 trials on average per subject wereaccepted in the "begin", 43 in the "end", and 86 in the "ab-sent" condition. In the PT task the respective number ofaccepted trials was 50 trials in the "begin", 46 in the "end",and 94 in the "absent" condition.
For baseline correction the scalp distribution of theaverage event-related potential during a 200-ms epochbefore the onset of the first stimulus was subtracted fromeach individual average. The ERP at each electrode wasthen referenced to the average potential (average refer-ence). Inter-individual variation in electrode positionswas corrected by spline-interpolation of the data setsfrom the individually digitized electrode positions on astandardized electrode montage.
Performance differences between tasks and condi-tions were evaluated for reaction times (RT) by means of
repeated measurement analyses of variance with thewithin-subject factors TASK (comparing TP and PT) andCONDITION (comparing "begin", "end" and "absent").For post-hoc analyses, differences between the condi-tions were evaluated by Scheffé-tests.
The event-related potential between the onset of thefirst and the offset of the second stimulus was examinedwith respect to the encoding of the picture name. As indi-cator the "point of divergence" (POD) was determined forboth tasks as the point in time, at which the ERP betweenthe "begin" and "end" condition started to differ. The PODwas calculated by 1) determining the root-mean-square(RMS, square root of the sum of squares of voltages at allelectrodes) of the difference waveform between "begin"and "end", 2) subtracting a baseline of –200 ms before theonset of the first stimulus to 100 ms after the second stimu-lus from these RMS curves, 3) computing significant vari-ations of these baseline-corrected RMS-values from zeroby paired t-tests for each time point over subjects. As de-scribed in the results section, the reaction time differencebetween the "begin" and "end" conditions was about150ms. The divergence of the ERP curves should thereforebe obvious for this time. The POD was defined as the firstof successive (5-ms) time points with t-value of p< 0.05 (aminimum of five was required to account for potential40-Hz filter smearing). The topography was evaluatedfor 100 ms following the POD, assuming the cognitiveprocess during this interval to be responsible for the reac-tion time difference between the "begin" and "end" condi-tions. Moreover, the mean amplitude is less influenced byvariations on a shorter time scale, so that noise or brain ac-tivity not related to the process of interest, was reduced.This topography was compared with the mean topogra-phy from –100 ms to –50 ms prior to the POD. The POD isdefined as the point in time, when the majority of the sub-jects exhibit differences in the ERP topography betweenthe "begin" and the "end" condition. It may therefore con-stitute the starting point for the analysis. In the "end" con-dition, the topography after this POD should thenrepresent the grapheme monitoring. However,interindividual variability of onset and duration of themonitoring process has to be assumed, so that the PODmay be earlier for some subjects than the mean POD forthe sample. Therefore, a time window of 50 ms before thePOD was excluded when calculating the mean topogra-phy for the time segment.
Separately for the two tasks, the differences in ERPtopographies between conditions ("begin" – "end") andtime range (before and after POD) were evaluated for av-erages of nine electrode groups (anterior left (FC3, F1,FC5, F3, F7, AF7, F9), anterior central (Fz, FP2, FP1, Nz,AF1, AF2), anterior right (F2, FC4, F4, FC6, AF8, F8, F10),medial left (CP3, CP5, C5, TP7, FT7, FT9), medial central(FCz, FC2, CP2, CPz, CP1, FC1, Cz), medial right (CP4, C6,
6 Hauk et al.
CP6, FT8, TP8, FT10), posterior left (P1, P5, PO7, P7, PO9,TP9), posterior central (Pz, POz, O1, O2, Oz, PO3, PO4),and posterior right (P2, P6, P8, PO8, TP10, PO10) by meansof analyses of variance with the within-subjects factorsGRADIENT (anterior, medial and posterior clusters),LATERALITY (left, central, and right clusters), TIME(comparing the epoch 150 – 50 ms before and 0 – 100 ms af-ter the POD, and CONDITION ("begin" and "end"). Sinceamplitude differences can affect the topographical effects(McCarthy and Wood 1985), data were normalized, sub-tracting the mean over all electrode clusters and dividingthem by their Euclidean vector length. For df > 1, F-ratioswere corrected by the Greenhouse-Geisser epsilon.
In the source space, the distribution of current densi-ties before and after the POD was determined by means ofthe Minimum norm (MN, L2 - Norm) estimates accordingto Hauk et al. (1999). This approach yields an estimate of thecurrent density inside the head, projected on atwo-dimensional sphere (thus, without depth informa-tion). For a single point source the MN estimate indicates apeak of activity approximately above the real source posi-tion (Grave de Peralta Menendez et al. 1997), projecting themeasured data towards their neuronal generators. For thepresent purpose of describing lateralisation, it seems moreappropriate to analyze the source space than the potentialdistribution. For the present analysis, the second (0.6) offour concentric equidistant spheres (0.8-0.2 of electrode ra-dius) within a three-dimensional source space was chosenas a compromise between the lower depth sensitivity of su-
perficial shells and the lower spatial resolution of deepershells (Hauk et al. 1999). The influence of noise on MNEwas controlled by the Tikhonov regularization, such thatthe mean residual variance of our estimates over all datasets was 5%.
Hemispheric asymmetry of the MN estimate wasevaluated by calculating a laterality index (LI) as the dif-ference between the all left minus all right-hemisphericMN estimates divided by their sum. (A LI of 1 indicates
Grapheme Monitoring in Picture Naming 7
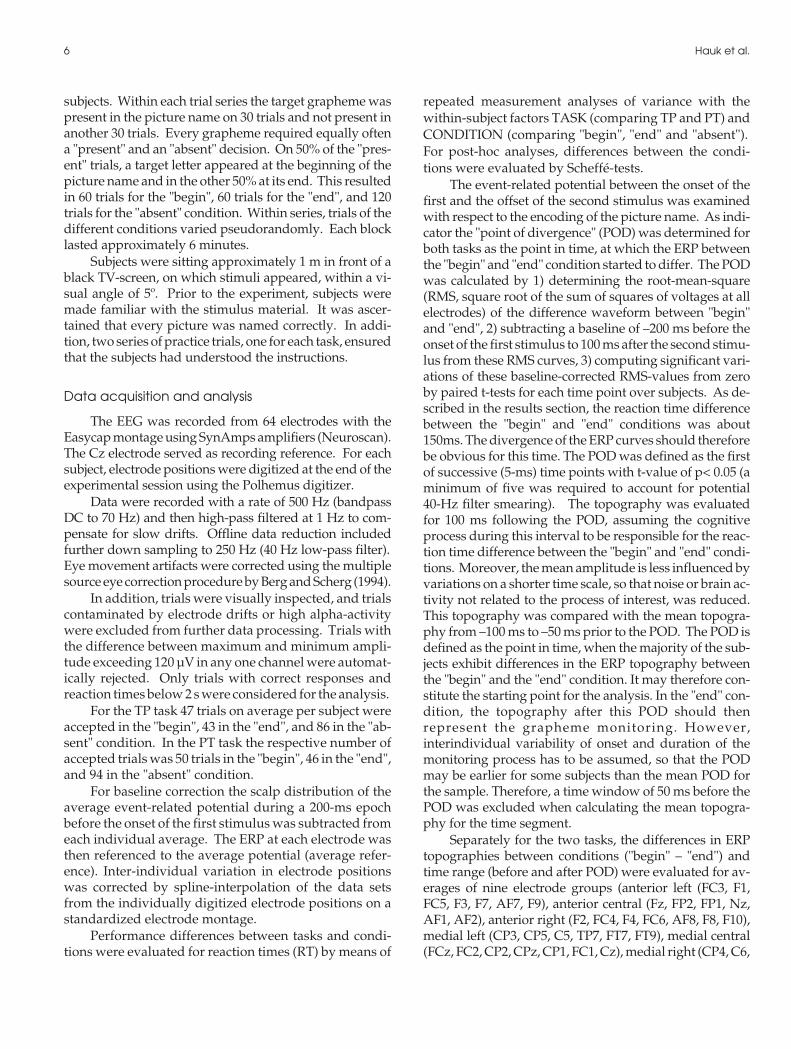
Figure 2. Mean Reaction Times (RT) from the onset of thesecond stimulus, averaged separately for the Target Pic-ture (solid lines) and the Picture Target (dashed lines) tasksfor the three conditions target grapheme positioned atthe beginning of the picture name (Begin), at the end ofthe picture name (End) and for the condition of targetgrapheme not occurring in the picture name (Not).Means and standard deviations are presented.
Figure 3. A) Average waveforms (referred to average ref-erence, negativity up) for the Target Picture task at se-lected electrodes. The target grapheme appeared at0ms, the picture after 500 ms. Thick lines: ERP averaged fortrials with the grapheme positioned at the beginning ofthe picture name. Thin lines: ERP averaged for trials withthe grapheme positioned at the end of the picture name.B) P-values at the successive time points following the sec-ond stimulus for the difference between the "begin" and"end" conditions. The beginning of a sequence of 5 suc-cessive time points with p< .05, meeting the criteria for thepoint of divergence is marked by the black triangle.
completely left-lateralised activity, -1 indicates com-pletely right-hemispheric activity.)
Results
Performance
Figure 2 illustrates the mean reaction times for theTP and PT task. Subjects were faster by 178 ms on aver-age in the PT than the TP task (TASK, F(1,11) = 110.26, p<.001). In order to demonstrate that the effects were robustagainst inhomogeneity in stimulus material, an addi-tional ANOVA was calculated across items for meansper item over subjects (see Wheeldon and Levelt, 1995).This resulted in a TASK effect of F(1,59) = 567.64 (p<.001), and a CONDITION effect of F(2,118) =144.16 (p<.001). In both tasks, subjects were faster in detecting a tar-get positioned at the beginning of a picture name, this RTdifference between the "begin" and "end" conditions be-ing almost identical for the two tasks (147 ms on average
for the TP and 148 ms for the PT task; CONDITION,F(2,22) = 32.20, p< .001). Post-hoc Scheffé-tests verifiedthe significant differences between the "begin" and the"end" conditions (p< .01) on both tasks, while "end" and"absent" did not differ (p>0.9).
Event-related brain activity:
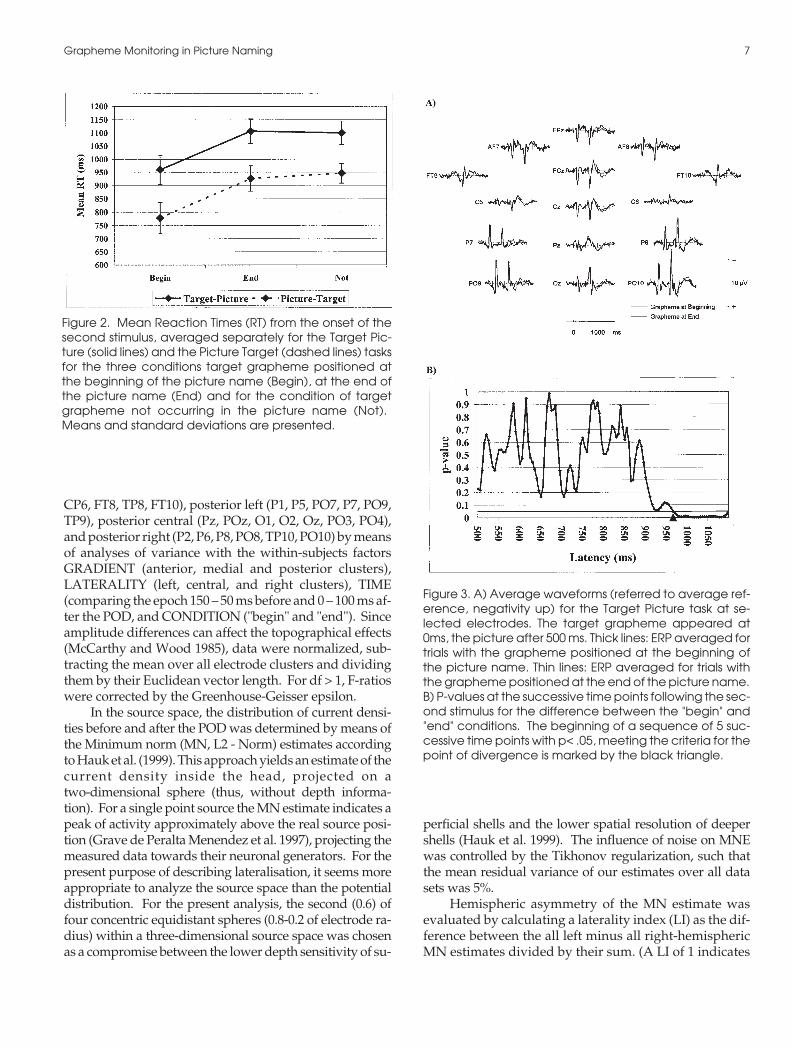
ERP waveforms averaged for the tasks and conditionsare displayed in figures 3A and 4A. ERPs evoked by the"begin" and "end" conditions were almost identical untilabout 300-400 ms after the onset of the second stimulus. Thep-values indicating the difference "begin" – "end" againstbaseline are presented in figures 3B and 4B. The POD in theERP was determined at 465 ms after picture onset for the TPtask and 320 ms after target onset for the PT task.
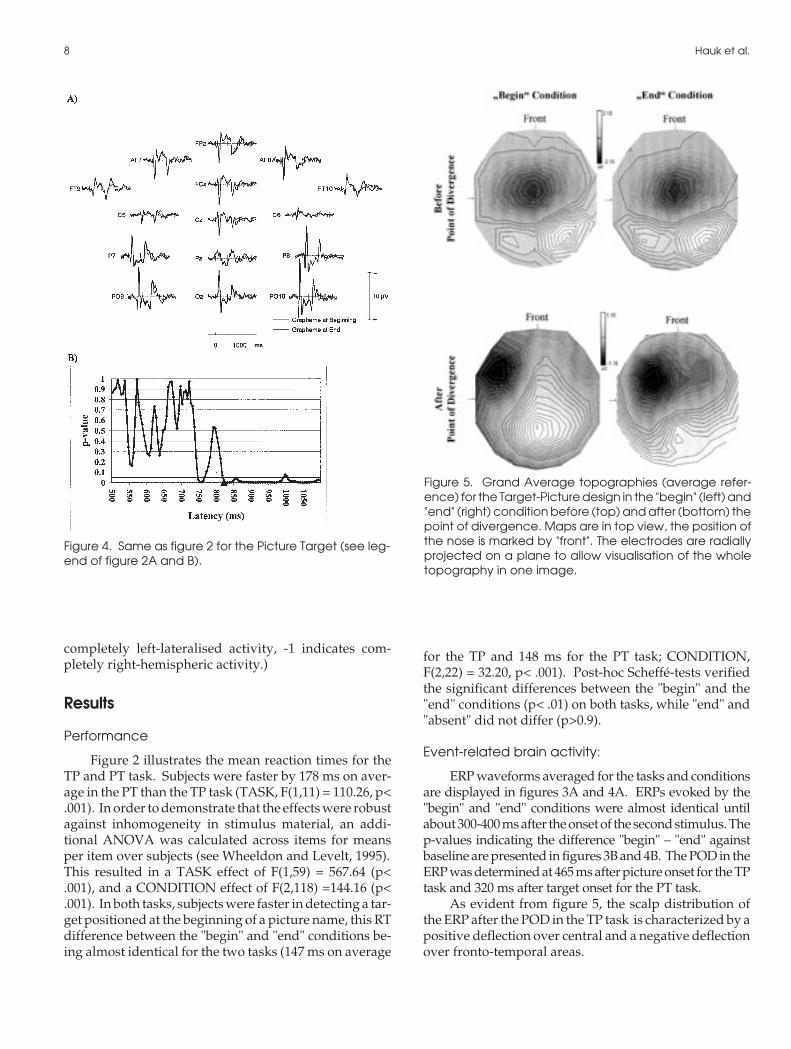
As evident from figure 5, the scalp distribution ofthe ERP after the POD in the TP task is characterized by apositive deflection over central and a negative deflectionover fronto-temporal areas.
8 Hauk et al.
Figure 4. Same as figure 2 for the Picture Target (see leg-end of figure 2A and B).
Figure 5. Grand Average topographies (average refer-ence) for the Target-Picture design in the "begin" (left) and"end" (right) condition before (top) and after (bottom) thepoint of divergence. Maps are in top view, the position ofthe nose is marked by "front". The electrodes are radiallyprojected on a plane to allow visualisation of the wholetopography in one image.
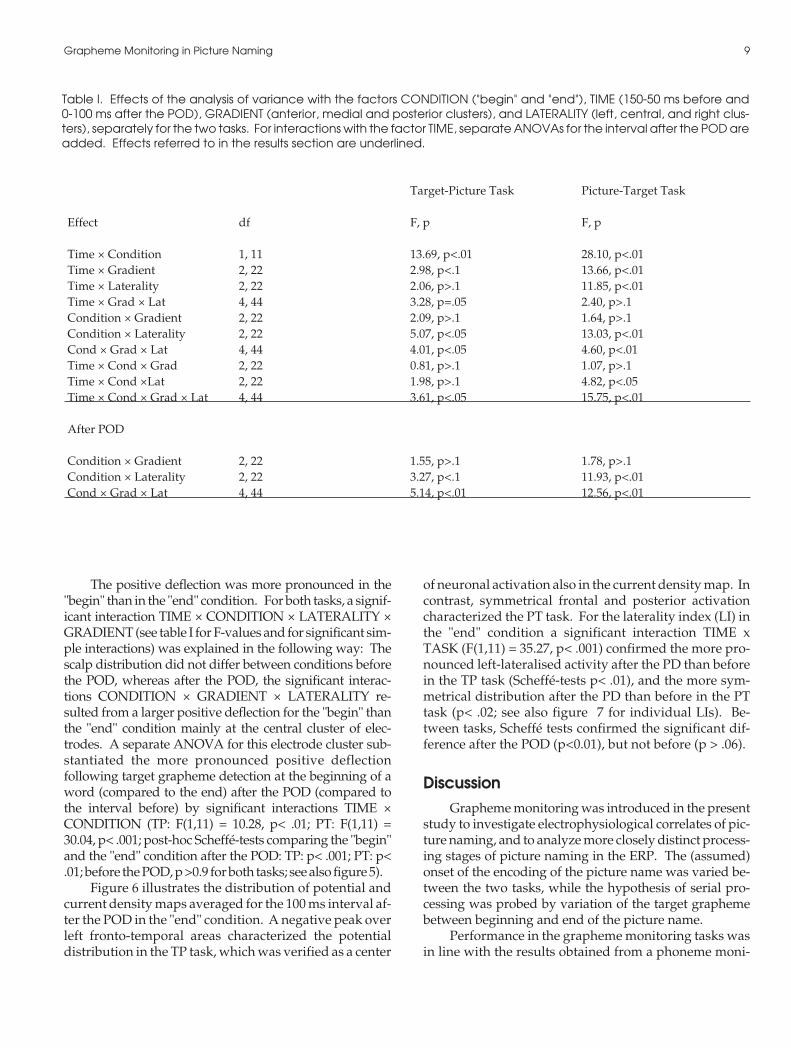
The positive deflection was more pronounced in the"begin" than in the "end" condition. For both tasks, a signif-icant interaction TIME × CONDITION × LATERALITY ×GRADIENT (see table I for F-values and for significant sim-ple interactions) was explained in the following way: Thescalp distribution did not differ between conditions beforethe POD, whereas after the POD, the significant interac-tions CONDITION × GRADIENT × LATERALITY re-sulted from a larger positive deflection for the "begin" thanthe "end" condition mainly at the central cluster of elec-trodes. A separate ANOVA for this electrode cluster sub-stantiated the more pronounced positive deflectionfollowing target grapheme detection at the beginning of aword (compared to the end) after the POD (compared tothe interval before) by significant interactions TIME ×CONDITION (TP: F(1,11) = 10.28, p< .01; PT: F(1,11) =30.04, p< .001; post-hoc Scheffé-tests comparing the "begin"and the "end" condition after the POD: TP: p< .001; PT: p<.01; before the POD, p >0.9 for both tasks; see also figure 5).
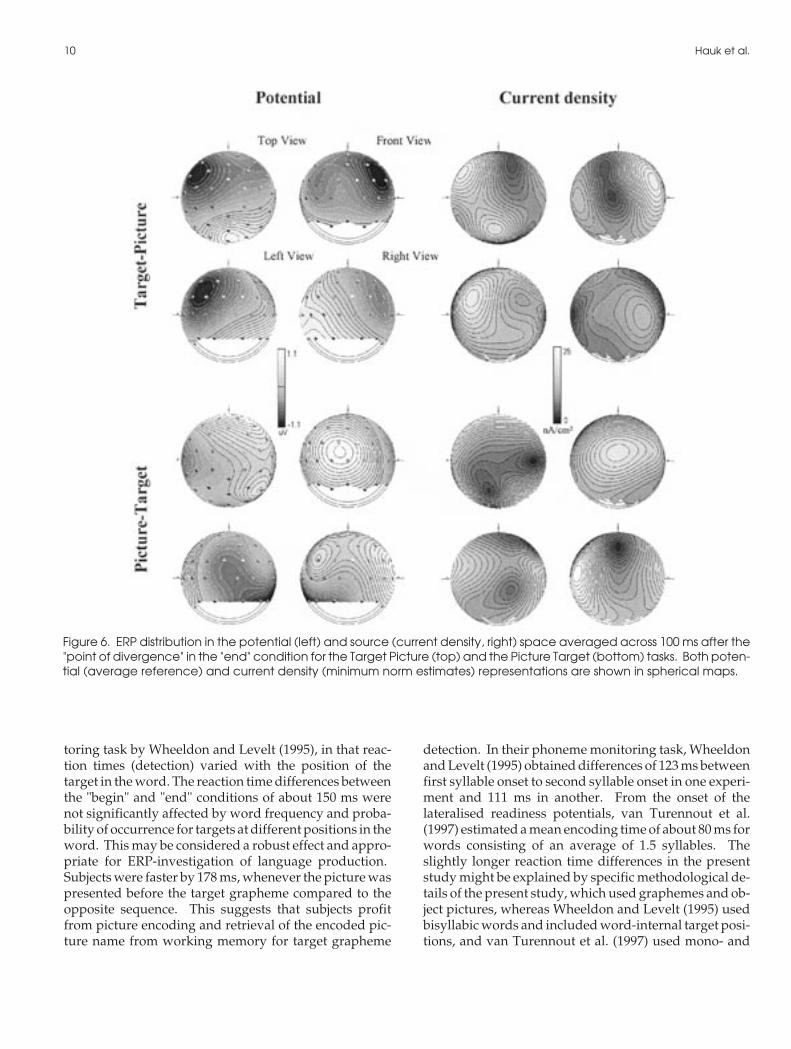
Figure 6 illustrates the distribution of potential andcurrent density maps averaged for the 100 ms interval af-ter the POD in the "end" condition. A negative peak overleft fronto-temporal areas characterized the potentialdistribution in the TP task, which was verified as a center
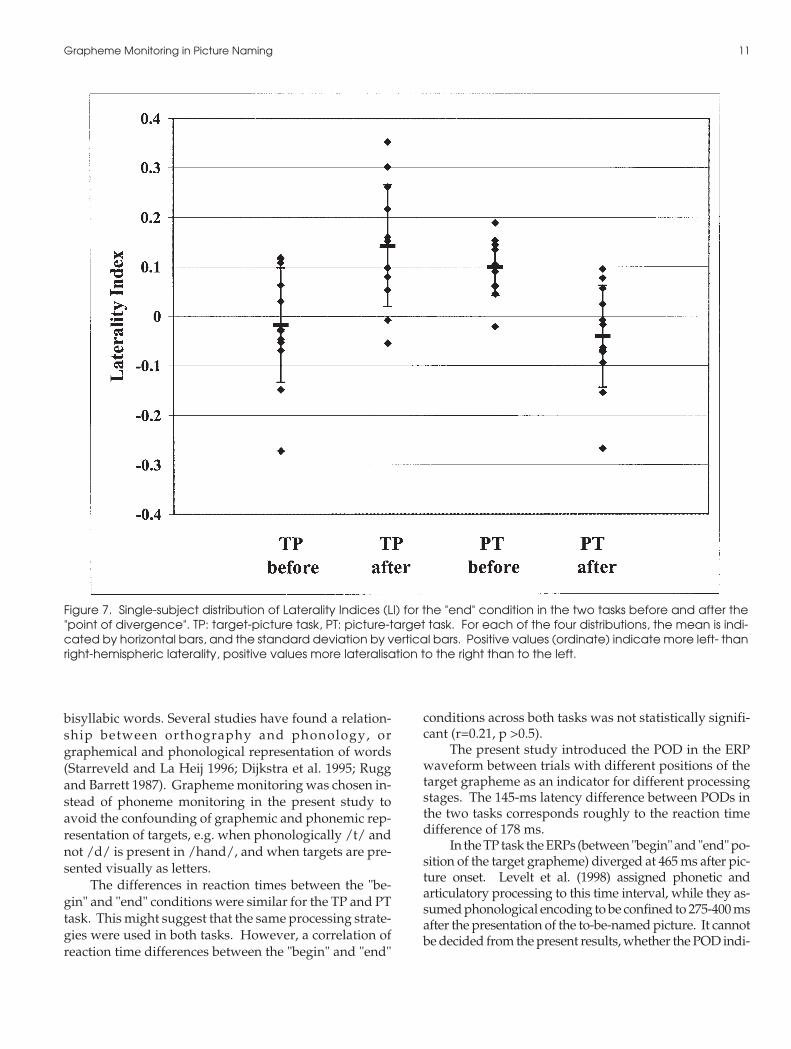
of neuronal activation also in the current density map. Incontrast, symmetrical frontal and posterior activationcharacterized the PT task. For the laterality index (LI) inthe "end" condition a significant interaction TIME xTASK (F(1,11) = 35.27, p< .001) confirmed the more pro-nounced left-lateralised activity after the PD than beforein the TP task (Scheffé-tests p< .01), and the more sym-metrical distribution after the PD than before in the PTtask (p< .02; see also figure 7 for individual LIs). Be-tween tasks, Scheffé tests confirmed the significant dif-ference after the POD (p<0.01), but not before (p > .06).
DiscussionGrapheme monitoring was introduced in the present
study to investigate electrophysiological correlates of pic-ture naming, and to analyze more closely distinct process-ing stages of picture naming in the ERP. The (assumed)onset of the encoding of the picture name was varied be-tween the two tasks, while the hypothesis of serial pro-cessing was probed by variation of the target graphemebetween beginning and end of the picture name.
Performance in the grapheme monitoring tasks wasin line with the results obtained from a phoneme moni-
Grapheme Monitoring in Picture Naming 9
Target-Picture Task Picture-Target Task
Effect df F, p F, p
Time × Condition 1, 11 13.69, p<.01 28.10, p<.01Time × Gradient 2, 22 2.98, p<.1 13.66, p<.01Time × Laterality 2, 22 2.06, p>.1 11.85, p<.01Time × Grad × Lat 4, 44 3.28, p=.05 2.40, p>.1Condition × Gradient 2, 22 2.09, p>.1 1.64, p>.1Condition × Laterality 2, 22 5.07, p<.05 13.03, p<.01Cond × Grad × Lat 4, 44 4.01, p<.05 4.60, p<.01Time × Cond × Grad 2, 22 0.81, p>.1 1.07, p>.1Time × Cond ×Lat 2, 22 1.98, p>.1 4.82, p<.05Time × Cond × Grad × Lat 4, 44 3.61, p<.05 15.75, p<.01
After POD
Condition × Gradient 2, 22 1.55, p>.1 1.78, p>.1Condition × Laterality 2, 22 3.27, p<.1 11.93, p<.01Cond × Grad × Lat 4, 44 5.14, p<.01 12.56, p<.01
Table I. Effects of the analysis of variance with the factors CONDITION ("begin" and "end"), TIME (150-50 ms before and0-100 ms after the POD), GRADIENT (anterior, medial and posterior clusters), and LATERALITY (left, central, and right clus-ters), separately for the two tasks. For interactions with the factor TIME, separate ANOVAs for the interval after the POD areadded. Effects referred to in the results section are underlined.
toring task by Wheeldon and Levelt (1995), in that reac-tion times (detection) varied with the position of thetarget in the word. The reaction time differences betweenthe "begin" and "end" conditions of about 150 ms werenot significantly affected by word frequency and proba-bility of occurrence for targets at different positions in theword. This may be considered a robust effect and appro-priate for ERP-investigation of language production.Subjects were faster by 178 ms, whenever the picture waspresented before the target grapheme compared to theopposite sequence. This suggests that subjects profitfrom picture encoding and retrieval of the encoded pic-ture name from working memory for target grapheme
detection. In their phoneme monitoring task, Wheeldonand Levelt (1995) obtained differences of 123 ms betweenfirst syllable onset to second syllable onset in one experi-ment and 111 ms in another. From the onset of thelateralised readiness potentials, van Turennout et al.(1997) estimated a mean encoding time of about 80 ms forwords consisting of an average of 1.5 syllables. Theslightly longer reaction time differences in the presentstudy might be explained by specific methodological de-tails of the present study, which used graphemes and ob-ject pictures, whereas Wheeldon and Levelt (1995) usedbisyllabic words and included word-internal target posi-tions, and van Turennout et al. (1997) used mono- and
10 Hauk et al.
Figure 6. ERP distribution in the potential (left) and source (current density, right) space averaged across 100 ms after the"point of divergence" in the "end" condition for the Target Picture (top) and the Picture Target (bottom) tasks. Both poten-tial (average reference) and current density (minimum norm estimates) representations are shown in spherical maps.
bisyllabic words. Several studies have found a relation-ship between orthography and phonology, orgraphemical and phonological representation of words(Starreveld and La Heij 1996; Dijkstra et al. 1995; Ruggand Barrett 1987). Grapheme monitoring was chosen in-stead of phoneme monitoring in the present study toavoid the confounding of graphemic and phonemic rep-resentation of targets, e.g. when phonologically /t/ andnot /d/ is present in /hand/, and when targets are pre-sented visually as letters.
The differences in reaction times between the "be-gin" and "end" conditions were similar for the TP and PTtask. This might suggest that the same processing strate-gies were used in both tasks. However, a correlation ofreaction time differences between the "begin" and "end"
conditions across both tasks was not statistically signifi-cant (r=0.21, p >0.5).
The present study introduced the POD in the ERPwaveform between trials with different positions of thetarget grapheme as an indicator for different processingstages. The 145-ms latency difference between PODs inthe two tasks corresponds roughly to the reaction timedifference of 178 ms.
In the TP task the ERPs (between "begin" and "end" po-sition of the target grapheme) diverged at 465 ms after pic-ture onset. Levelt et al. (1998) assigned phonetic andarticulatory processing to this time interval, while they as-sumed phonological encoding to be confined to 275-400 msafter the presentation of the to-be-named picture. It cannotbe decided from the present results, whether the POD indi-
Grapheme Monitoring in Picture Naming 11
Figure 7. Single-subject distribution of Laterality Indices (LI) for the "end" condition in the two tasks before and after the"point of divergence". TP: target-picture task, PT: picture-target task. For each of the four distributions, the mean is indi-cated by horizontal bars, and the standard deviation by vertical bars. Positive values (ordinate) indicate more left- thanright-hemispheric laterality, positive values more lateralisation to the right than to the left.
cates a change from phonological encoding to silent articu-lation rather than the onset of phonological encoding. Inthe PT task the POD was indeed found at an earlier latencyof 320 ms. Although the two tasks were designed to pro-voke different processes and processing strategies, it can-not be decided, whether this was indeed confirmed by thetask-specific latencies of the POD, or whether both tasks ac-tivated the same sequence of processes, but at differentspeed –resulting in different onset latencies of processingstages: TP is slower because the two tasks, grapheme moni-toring and phonological encoding, have to be accom-plished simultaneously, PT is faster, because thephonological encoding has been accomplished and thecode has only to be retrieved from working memory.
The hypothesis that the POD indicates phonologicalencoding is also supported by the ERP distribution in thepotential and in the source space. In both tasks, the posi-tive deflection following the POD was more pronouncedin the "begin" condition. Given its centro-parietal distri-bution, it may be compared with a P300 and consideredan indicator of target detection. More importantly, the"end" condition produced task-specific patterns of a neg-ative focus. A left-anterior negative deflection was pro-nounced in the TP task after the POD (relative to theinterval before), while the left-lateralised activity beforethe POD changed into symmetrical activity afterwards inthe PT task. Both patterns support the hypotheses, thattarget grapheme presentation started serial on-line mon-itoring in the TP task and retrieval of encoded names inthe PT task. While both processes (phonological encod-ing and verbal working memory) are associated withleft-fronto-temporal activity (e.g., Demonet et al. 1994;Price et al. 1998; Bookheimer et al. 1995; Thierry et al.1998; Levelt et al. 1998; Salmelin et al. 1994), thetask-specific change from bilateral to left-lateralised pat-terns (in TP) and vice versa (in PT) emphasize a sequenceof processing stages as suggested by Levelt et al. (1999).
The present design and analyses suggested an addi-tional indication for the investigation of the time courseand sequence (chronometry) of processes in languageproduction. The point of divergence seems suitable forthe detection of a change in stages of processing. This ap-proach offers a variety of new possibilities to investigatelanguage production with measurement techniquesshowing a high temporal resolution.
ReferencesBaddeley, A. Working memory. Science, 1992, 255: 556-559.Berg, P. and Scherg, M. A multiple source approach to the cor-
rection of eye artifacts. Electroencephalogr. Clin.Neurophysiol., 1994, 90: 229-241.
Bookheimer, S.Y., Zeffiro, T.A., Blaxton, T., Gaillard, W., andTheodore, W. Regional cerebral blood flow during object
naming and word reading. Human Brain Mapping, 1995,3: 93-106.
Cabeza, R. and Nyberg, L. Imaging cognition II: An empiricalreview of 275 PET and fMRI studies. J. Cogn. Neurosc.2000, 12(1): 1-47.
Caramazza, A., Chialant, D., Capasso, R., and Miceli, G. Sepa-rable processing of consonants and vowels. Nature, 2000,403: 428-430.
Damasio, H., Grabowski, T.J., Tranel, D., Hichwa, R.D., andDamasio, A.R. A neural basis for lexical retrieval. Nature,1996, 380: 499-505.
Demonet, J.F., Price, C., Wise, R., and Frackowiak, R.S.J. A PETstudy of cognitive strategies in normal subjects during lan-guage tasks: Influence of phonetic ambiguity and se-quence processing on phoneme monitoring. Brain, 1994,117: 671-682.
Dijkstra, T., Roelofs, A., and Fieuws, S. Orthographic effects onphoneme monitoring. Can. J. Exp. Psychol., 1995, 49(2):264-271.
Eulitz, C., Hauk, O., and Cohen, R. Electroencephalographic ac-tivity over temporal brain areas during phonological en-coding in picture naming. Clin. Neurophysiol., 2000, 111:2088-2097.
Glaser, W.R. Picture naming. Cognition, 1992, 42: 61-105.Grave de Peralta Menendez, R., Hauk, O., Gonzalez Andino,
S.L., Vogt, H., and Michel, C. Linear inverse solutions withoptimal resolution kernels applied to the electromagnetictomography. Hum. Brain Mapp., 1997, 5(6): 454-467.
Hauk, O., Berg, P., Wienbruch, C., Rockstroh, B., and Elbert, T.The minimum norm method as an effective mapping toolfor MEG analysis. In: T. Yoshimoto, M. Kotani, S. Kuriki,H. Karibe, N. Nakasato (Eds.), Recent Advances inBiomagnetism. Tohoku University Press, Sendai, 1999:213-216.
Johnson, C.J., Paivio, A. and Clark, J.M.. Cognitive componentsof picture naming. Psychol. Bull., 1996, 120(1): 113-139.
Levelt, W.J.M., Praamstra, P., Meyer, A.S., Helenius, P. andSalmelin, R. An MEG study of picture naming. J. Cogn.Neurosci., 1998, 10(5): 553-567.
Levelt, W.J.M. A theory of lexical access in speech production.Behav. Brain Sci., 1999, 22: 1-75.
McCarthy, G. and Wood, C.C. Scalp distributions ofevent-related potentials: An ambiguity associated withanalysis of variance models. Electroencephalogr. Clin.Neurophysiol., 1985, 62(3): 203-208.
Murtha, S., Chertkow, H., Beauregard, M. and Evans, A. Theneural substrate of picture naming. J. Cogn. Neurosci.,1999,11(4): 399-423.
Oldfield, R.C. The assessment and analysis of handedness: TheEdinburgh inventory. Neuropsychologia, 1971, 9: 97-113.
Price, C.J., Moore, C.J., Humphreys, G.W., Frackowiak, R.S.J.and Friston, K.J. The neural regions sustaining object rec-ognition and naming. Proc. R. Soc. Lond. B Biol. Sci., 1996:1501-1507.
Price, C.J. The functional anatomy of word comprehension andproduction. Trends Cogn. Neurosci., 1998, 2(8): 281-288.
Rugg, M.D. and Barrett, S.E. Event-related potentials and theinteraction between orthographic and phonological infor-mation in a rhyme-judgement task. Brain Lang, 1987, 32:
12 Hauk et al.
336-361.Salmelin, R., Hari, R., Lounasmaa, O.V. and Sams, M. Dynam-
ics of brain activation during picture naming. Nature,1994, 368: 463-465.
Snodgrass, J.G. and Vanderwart, M. A standardized set of 260pictures: Norms for name agreement, image agreement,familiarity, and visual complexity. Journal of Experimen-tal Psychology: Human Learning and Memory, 1980, 6(2):174-215.
Starreveld, P.A. and La Heij, W. Time-course analysis of seman-tic and orthographic effects in picture naming. J. Exp.Psychol. Learn. Mem. Cogn., 1996, 22(4): 896-918.
Stuss, D.T., Sarazin, F.F., Leech, E.E. and Picton, T.W.Event-related potentials during naming and mental rotation.Electroencephalogr. Clin. Neurophysiol., 1983, 56: 133-146.
Stuss, D.T., Leech, E.E., Sarazin, F.F. and Picton, T.W.
Event-related potentials during naming. Ann. N. Y. Acad.Sci., 1984, 425: 278-282.
Theios, J. and Amrhein, PC. Theoretical analysis of the cogni-tive processing of lexical and pictorial stimuli: Reading,naming and visual and conceptual comparisons. Psychol.Rev., 1989, 96(1): 5-24.
Thierry, G., Doyon, B. and Demonet, J.F. ERP mapping in pho-nological and lexical semantic monitoring tasks: A studycomplementing previous PET results. Neuroimage, 1998,8(4): 391-408.
van Turennout, M., Hagoort , P. and Brown, C.M.Electrophysiological evidence on the time course of se-mantic and phonological processes in speech production.J. Exp. Psychol. Learn. Mem. Cogn., 1997, 23(4): 787-806.
Wheeldon, L.R. and Levelt, W.J.M. Monitoring the time courseof phonolocial encoding. J. Mem. Lang., 1995, 34: 11-334.
Grapheme Monitoring in Picture Naming 13