Embed Size (px)
Citation preview
1
This paper has been accepted for publication in Qualitative Research andthe final (edited, revised and typeset) version of this paper will be publishedin Qualitative Research, Volume 6, 2006 by Sage Publications Ltd, Allrights reserved. © Sage Publications Ltd, 2006. www.sagepublications.com.
Graphic elicitation: using research diagrams asinterview stimuli
NATHAN CRILLY, ALAN F BLACKWELL and P JOHN CLARKSONUniversity of Cambridge
Diagrams are effective instruments of thought and a valuable tool in conveyingthose thoughts to others. As such, they can be usefully employed asrepresentations of a research domain and act as stimulus materials ininterviews. This process of graphic elicitation may encourage contributions frominterviewees that are difficult to obtain by other means. By representingconcepts and relationships that other visual artefacts cannot depict, diagramsprovide a complementary addition to conventional interview stimuli. Thispaper discusses the application of graphic elicitation within the broader contextof the diagramming process. Consideration is given to the unique characteristicsof diagrams and the ways in which they are interpreted. Thus, the specificbenefits that diagrams offer as interview stimuli may be understood. Followingthis, an example study is described in which the graphic elicitation process wasemployed in interviews with industrial designers. Reporting on a study inwhich the interviewees possessed a well-developed graphic sensibility allows abroad range of graphic elicitation’s potential benefits to be illustrated. In closingthe paper, a discussion is held on the range of methodological issues that mustbe addressed when employing diagrams in a research study.
Keywords: diagrams, interviewing, stimulus material, data collection, data analysis,grounded theory, theory building, member validation, respondent validation, industrialdesign
Introduction
Visual elicitation stimuli are artefacts employed during interviews where thesubject matter defies the use of a strictly verbal approach. Such stimuli mighttypically include physical specimens, maps, drawings, photographs and video-clips (Banks, 2001; Johnson and Weller, 2001: 510). This approach may yieldcontributions from interviewees that are difficult to achieve by verbal
2
transactions alone. For example, allowing interviewees to sort through word-,phrase- or picture-cards may elicit ideas that would otherwise remainunarticulated and promote general discussion (Gaskell, 2000: 50). This isbecause such stimuli bring factors external to the interview situation into view,prompting response to ‘“not now” moments, “not here” events and “notpresent” actors’ (Törrönen, 2002: 348).
Despite the variety of possible stimulus materials the majority of literature onvisual elicitation research has focused on the use of photography (Harper, 2002:13). Photo elicitation involves introducing photographs into research interviewsto invoke comments and discussion. Such images may be created by theresearcher (see Collier, 1967), created by the interviewee (e.g. Clark, 1999;Samuels, 2004), or collected from existing sources (see Banks, 2001: 87, 99).Whatever the source of the images, Harper suggests that ‘photo elicitationmines deeper shafts into a different part of human consciousness than dowords-alone interviews’ (Harper, 2002: 22).
In comparison with photographs, the use of diagrams in interview scenarios isless well established. There are however a small number of studies in whichtheir use is reported. Interviewing with diagrams is considered to beparticularly useful where cross-cultural language barriers or illiteracy limit theeffectiveness of textual and verbal communication (Mayoux, 2003). Similarly,where the topics discussed are of a sensitive nature the use of participatorydiagramming may be especially effective in providing rich and nuanced data onsubjects’ experiences (Kesby, 2000). However, even without such challenges tocommunication, diagrams can be used to elicit knowledge from experts (Cheng,1996), and it may be beneficial to focus discussion around the commonframework that a diagram provides (Ford and Sterman, 1998).
Whereas researchers employing photo elicitation have used images originatingfrom a variety of sources, the use of diagrammatic stimuli has, to date, focusedon representations produced by the interviewee. This is despite some implicitsuggestion in the literature that diagrams produced by researchers may provideuseful stimuli. For example, Padilla recommends that issues identified inpreliminary interviews might be codified as a sketch; presenting this insubsequent interviews may allow discussion to be focused around an artefactthat captures the essential aspects of a domain (Padilla, 1993: 156). Furthermore,Törrönen has specifically described the use of ‘microcosm’ stimuli that imitate,illustrate or exemplify the subject of study. Interviewees are thus encouraged to‘compare their own conceptions and experiences to the world constructed in thestimulus […which may be…] a picture, map or metaphorical outline’ (Törrönen,2002: 354).
Unlike other visual artefacts, diagrams may depict subject matter ranging fromthe conceptual to the physical by adopting various degrees of graphicabstraction. This affords an overview of the topic that is unavailable by other
3
means and elicits unique contributions accordingly. Thus, employingdiagrammatic representations of a domain in interviews offers a useful additionto the established array of elicitation stimuli. In this paper, the use of such atechnique is referred to as graphic elicitation. Diagrams may represent a broadrange of topics and may originate from a variety of sources. However, thispaper focuses on the use of representations of the research domain that havebeen produced by the researcher. This is because an account of how theserepresentations are produced and employed necessarily includes much ofrelevance to interviewing with diagrams in general.
There are a number of sources to which researchers may turn for advice on theapplication of photo elicitation techniques (e.g. Collier, 1967; Banks, 2001;Harper, 2002). These texts offer guidance on the preparation of images, theirinsertion into the interview process and the benefits that might thus be gained.Although such material provides a useful indication of how non-photographicvisual stimuli might be employed in interviews, they are of only limitedrelevance when considering the application of researcher-generated diagrams asan elicitation technique. This is because diagrams differ from photographs notonly in what they can depict but also in how they are created and how they areinterpreted.
Consequently, there is a lack of supportive structure for the use of graphicelicitation in research interviews. In particular, the following questions have notbeen adequately addressed. Firstly, what are the unique characteristics ofdiagrams in relation to other elicitation stimuli? Secondly, what specific benefitsmight be realised by employing diagrammatic stimuli in interviews? Thirdly,what are the practical and methodological issues that must be addressed whenconsidering the preparation of diagrams and their insertion into the interviewprocess? This paper seeks to address these questions by considering graphicelicitation in both theoretical context and practical application.
In the first part of the paper, graphic elicitation is discussed within thetheoretical context of research diagrams by drawing on literature from the fieldsof ‘Notation and Visual Representation’, ‘Diagrammatic Reasoning’ ‘MemberValidation’ and ‘Theory Building’. The application of diagrams as an instrumentof thought and as a tool for communication is described, as it is upon theseprocesses that graphic elicitation depends. The process of graphic elicitation isthen discussed in detail with reference to how this compares with the moreconventional process of obtaining the interviewees’ assessment of researchreports. The specific types of contribution that are obtained through graphicelicitation are described and the ways in which these contributions may be usedin subsequent research activities is illustrated. In closing this part of the paper,attention is given to the potential for diagramming in general, and graphicelicitation in particular, to assist in the activities of theory building frominterview data.
4
So as to provide an illustrative example of graphic elicitation in practice, thesecond part of the paper presents a study in which the technique wasextensively employed. The focus of this study was the activity of industrialdesign and a series of interviews with practising designers is described. Design isone industrial context in which visual representations enjoy a privileged statusand designers are especially adept at visual thinking and visual presentation.This was an important contributory factor to the successful use of diagrammaticstimuli in the study and allows a number of graphic elicitation’s potentialbenefits to be illustrated. Following a description of how diagrams wereemployed in the study attention is turned to the importance of assessing theinterviewees’ visual literacy when considering a graphic elicitation approach.
Having considered graphic elicitation in theoretical context and practicalapplication, a discussion is then held on a range of methodological issues thatmust be addressed when employing diagrammatic stimuli in a research study.The three research questions outlined above are addressed in both parts of thepaper and in the accompanying discussion. In concluding the paper, materialfrom the preceding sections are summarised thus offering specific answers toeach question in turn. Suggestions are then made for how future work ingraphic elicitation might address the issues raised in this paper when thetechnique is applied in a range of different interview contexts.
Part 1: graphic elicitation in context
A diagram is a visual representation that shares the properties of written textand representational images, but cannot be reduced to either (Blackwell, 2001:1). Familiar examples include public transport ‘maps’ such as the LondonUnderground diagram, economic graphs and charts, or the assembly drawingsand flowcharts included in instruction manuals. Diagrams are unlike text in thatwe cannot ‘speak’ them, but are also unlike images because that they do notcorrespond to our sense perceptions of any physical objects (Ittelson, 1996).Thus, rather than imitating the appearance of things, ‘diagrams are mostsuitable for visualisations of conceptual knowledge […] modelling reality as weunderstand it’ (Kazmierczak, 2001: 177).
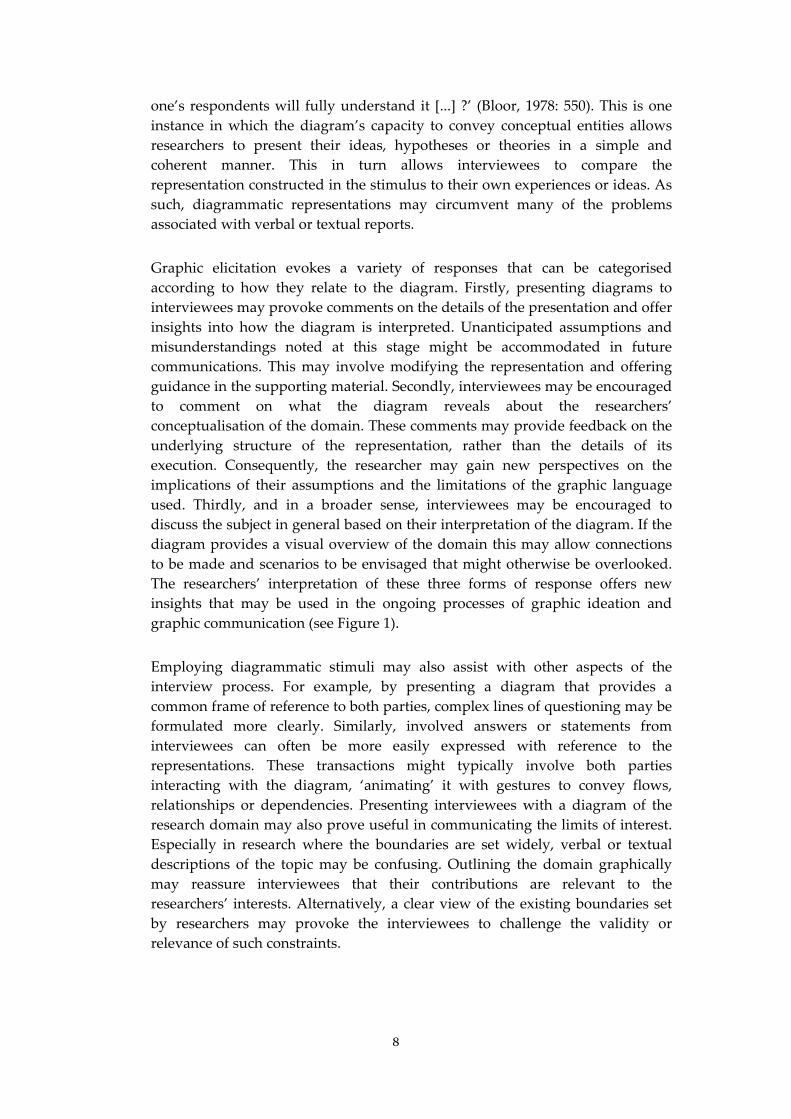
In representing the technical world of diagram use, McKim divides visualthinking into two distinct activities: graphic ideation and graphic communication.Graphic ideation typically involves quick freehand sketches to assist in theprocess of ‘visually talking to oneself’. In contrast, graphic communication ofteninvolves representations with increased clarity that assist in the process of‘visually talking to others’ (McKim, 1980: 12, 123). MacEachren draws a similardistinction between the private early stages of visualisation, which involve theexploration of unknowns, and the later public stages of communicating what isalready understood (MacEachren, 1994: 2).
5
Further to graphic ideation and graphic communication, graphic elicitationinvolves presenting interviewees with a diagrammatic representation of thedomain with which they are involved. This may provoke comment on thedetails of the diagram and the conceptualisation inferred from it, in addition toprompting further discussion of the domain in general. Graphic elicitationdraws upon and extends the graphic ideation and graphic communicationprocesses. Therefore, these processes are reviewed here before graphicelicitation is discussed in detail.
GRAPHIC IDEATION
Graphic ideation offers the opportunity to thoroughly examine a problem froma number of perspectives using visual representations to both record andstimulate thought. In particular, complex, intangible and non-linear conceptsmay often be thought about more rigorously through the application ofdiagramming (McKim, 1980). Graphic ideation involves both exploratory anddevelopmental phases. The exploratory phase is formative and requires theimagery of a new idea to be visualised and recorded. The subsequentdevelopmental phase requires the evolution of these ‘promising, though initiallyembryonic, concept[s] into mature form’ (McKim, 1980: 122).
Graphic ideation is described by both Enrick (1972: 4) and McKim (1980: 124) asan iterative process in which ideas are visually expressed, tested, and then fedback to the expressive stage (see Graphic ideation in Figure 1). The output of thisinitially cyclic activity is the eventual convergence on a graphic solution that isconsidered appropriate. Thus, diagramming is seldom the mere formality ofsetting down in graphic form what is already understood. On the contrary, theiterative process of structuring ideas and developing representations for thoseideas may trigger previously unconsidered notions (Albarn and Smith, 1977: 7).The ambiguity of these initial representations may be valued as an opportunityfor creative leaps in interpretation (Hewson, 1991). As a result, drawingdiagrams may lead to an improved understanding of the subject andconceptualisations that would not otherwise have been entertained.
One possible consequence of the new-found clarity that diagrams provide isthat the originator of the diagram is ‘tempted to treat [these] simplifiedconstructs as though they were reality itself’ (Arnheim, 1969: 307). However,diagrams are necessarily a radical simplification of a domain from a singleperspective and this leads to an emphasis of some aspects at the expense of de-emphasising others (Green et al., 1991). Thus, visual thinking can be enhanced ifthe graphic ideation process involves actively moving between different graphiclanguages (Cox and Brna, 1995). This includes exploring the different modes ofpresentation available and experimenting with various degrees of abstraction.The ongoing process of searching for different visual solutions helps in therefinement of conceptualisations as ‘every time visual thinkers change graphiclanguages, they submit an idea to a new set of built-in mental operations’
6
(McKim, 1980: 132). For valuable guidance in exploring the available modes ofpresentation Bertin (1967), Lockwood (1969), Harris (1999) and Engelhardt(2002) provide visual summaries of the varieties of diagrammatic possibility.
The opportunities presented by graphic ideation for continually re-examining aproblem lead to expansion and refinement of the entire thought processsurrounding that problem. Thus, the inconsistencies and imprecision of earlyideas are revealed because ‘your initial inability to prepare a meaningful[diagram] is the result of gaps in your original thought processes’ (Enrick, 1972:7). With a diagram available that accurately reflects the currentconceptualisation of the domain, the process of communicating on that domainmay be greatly improved.
GRAPHIC COMMUNICATION
Effective graphic representations are capable of providing concise visualsummaries of data, concepts and relationships (Enrick, 1972: 1). Consequently,communications on many subjects are clarified by presenting diagrams of thesubject matter involved (Dondis, 1973; Lowe, 1993). Diagrams are not inherentlyintuitive however, and if the reader of the diagram does not understand thevisual language of the representation then they will have difficulty accessing,interpreting and decoding its meaning (Bennett, 2002: 62). Thus, whendeveloping diagrams for communication, consideration must be given to howthe representation will be ‘read’ and what it will mean to its intended audience(see Graphic communication in Figure 1).
By combining the syntactic properties of linguistic symbols and pictorialrepresentations, diagrams can carry meaning in a variety of ways (Goodman,1969). Firstly, the separate graphical objects of which a diagram is composed (e.g.icons and pictograms) can hold significance almost independent of context.Secondly, the attributes of those objects (e.g. shape, size, and colour) can conveyinformation about the represented entities. Thirdly, the relative arrangement ofthe graphical objects (e.g. proximity, inclusion, and adjacency) can be used tocommunicate the relationships between these represented entities. Finally, thespace on which the graphical objects are arranged (e.g. political maps or buildingplans) can also hold associations that are meaningful. In each of these cases,correspondence from the visual representation to its interpretation can be literal,metaphorical, or based on arbitrary conventions (Blackwell and Engelhardt,2002; Engelhardt, 2002).
It is important to be aware that, to some people, diagrams may not be perceivedas neutral with regard to mechanisms of hierarchy and power. Indeed, diagramscan be regarded as closely implicated in processes of discipline and control.They fall within the class of phenomena that Foucault describes as technologiesof representation: sign systems that impose power structures upon knowledge
7
and experience by encoding relations (Sheridan, 1980). This can be especiallysalient to corporate contexts, where the organisation chart might be equatedwith architectures of discipline that Foucault calls the ‘Panopticon’ (fromBentham’s design for prisons constructed around an observation tower). Byreducing individual workers or managers to symbols, and then subjecting thewhole visible assemblage of relations within the diagram to an ‘incarcerating’administrative gaze, the organization chart becomes an emblem of corporatepower (McKinlay and Starkey, 1998).
Beyond considering the conventions of culture and media, attention should alsobe given to the preferences of the target audience. Craig distinguishes betweenthose who have a tendency to view and produce diagrams and those whoexhibit a preference for linear, textual presentations of information (Craig, 2000:3-4). To accommodate this variation in preference, diagrams are typicallysupported by textual or verbal explanations of what is being depicted, what thegraphic language implies, and how the visual material should be interpreted.This is because ‘even well-designed diagrams can be ineffective if the [reader] isgiven insufficient support in how to use them’ (Lowe, 1993: 11).
GRAPHIC ELICITATION
As discussed, the process of graphic ideation results in diagrammatic structuresthat are felt to represent the current conceptualisation of a domain. Thesubsequent process of graphic communication involves the development ofrepresentations that are meaningfully presented to others. In graphic elicitationthis presentation is performed so as to encourage contributions frominterviewees during the interview process. Where these diagrams represent theresearchers’ interpretation of the research domain, the interviewees’ responsemay offer some form of ‘member validation’ (Seale, 1999: 61). Taking Schutz’s‘postulate of adequacy’ (Schutz, 1970: 279) as a philosophical basis, such idea-sharing activities have conventionally involved presenting the subjects of astudy with the researchers’ report and seeking their appraisal (Schatzman andStrauss, 1973; Douglas, 1976).
Whilst this approach offers valuable insight into how the researchers’ findingsare interpreted, as a method of validation it is problematic. As Emerson (1988)and Bloor (1978; 1997) acknowledge, member validation is not free from theinterpersonal and political ambiguities that characterise all qualitativeinvestigation. Consequently, feedback from members may be viewed as justanother valuable source of data rather than as validation or refutation of theresearchers’ inferences (Fielding and Fielding, 1986: 43). One particular problemassociated with member validation is that members of the studied group do notnecessarily possess the skills or motivation required to analyse and comment onthe documents that they are provided with (Emerson and Pollner, 1988; Bloor,1997). Such issues prompted Bloor to ask, ‘how does one frame and presentone’s analysis in such a form and in such a setting that one can be confident that
8
one’s respondents will fully understand it [...] ?’ (Bloor, 1978: 550). This is oneinstance in which the diagram’s capacity to convey conceptual entities allowsresearchers to present their ideas, hypotheses or theories in a simple andcoherent manner. This in turn allows interviewees to compare therepresentation constructed in the stimulus to their own experiences or ideas. Assuch, diagrammatic representations may circumvent many of the problemsassociated with verbal or textual reports.
Graphic elicitation evokes a variety of responses that can be categorisedaccording to how they relate to the diagram. Firstly, presenting diagrams tointerviewees may provoke comments on the details of the presentation and offerinsights into how the diagram is interpreted. Unanticipated assumptions andmisunderstandings noted at this stage might be accommodated in futurecommunications. This may involve modifying the representation and offeringguidance in the supporting material. Secondly, interviewees may be encouragedto comment on what the diagram reveals about the researchers’conceptualisation of the domain. These comments may provide feedback on theunderlying structure of the representation, rather than the details of itsexecution. Consequently, the researcher may gain new perspectives on theimplications of their assumptions and the limitations of the graphic languageused. Thirdly, and in a broader sense, interviewees may be encouraged todiscuss the subject in general based on their interpretation of the diagram. If thediagram provides a visual overview of the domain this may allow connectionsto be made and scenarios to be envisaged that might otherwise be overlooked.The researchers’ interpretation of these three forms of response offers newinsights that may be used in the ongoing processes of graphic ideation andgraphic communication (see Figure 1).
Employing diagrammatic stimuli may also assist with other aspects of theinterview process. For example, by presenting a diagram that provides acommon frame of reference to both parties, complex lines of questioning may beformulated more clearly. Similarly, involved answers or statements frominterviewees can often be more easily expressed with reference to therepresentations. These transactions might typically involve both partiesinteracting with the diagram, ‘animating’ it with gestures to convey flows,relationships or dependencies. Presenting interviewees with a diagram of theresearch domain may also prove useful in communicating the limits of interest.Especially in research where the boundaries are set widely, verbal or textualdescriptions of the topic may be confusing. Outlining the domain graphicallymay reassure interviewees that their contributions are relevant to theresearchers’ interests. Alternatively, a clear view of the existing boundaries setby researchers may provoke the interviewees to challenge the validity orrelevance of such constraints.
9
10
The potential for diagrams to offer a holistic overview of the subject must beplaced in the context of other available visual stimuli. In particular, stimulusmaterials are often selected to be evocative, probing beyond the bounds ofverbal discourse. For example, Harper describes the use of aerial photographs asoffering a new and interesting perspective that can ‘break the frame’ of thesubject’s normal view (Harper, 2002: 20). By offering a gestalt perspective on thedomain, diagrams may achieve a similar effect but are freed from the constraintsof figurative representation. Through employing a range of graphicconventions, diagrams may represent conceptual matters (such as patterns ofbehaviour or organisational structures) in addition to the physical world. Assuch, diagrams are interpreted in a different manner to other stimuli andresearchers should consider this when preparing and implementingdiagrammatic stimuli.
INTERPRETATION IN GRAPHIC ELICITATION
The arrangement of diagrammatic elements can adopt the conventions ofcartography (MacEachren, 1995), newspaper infographics (Wurman, 1997), oreven typographic devices such as bullet points, tables and poster layouts (Kressand van Leeuwen, 1996). In addition to conveying information, these visualreferences to conventional systems provide an implicit social context. Like manysign systems, diagrams may be interpreted as carrying not only their primarymeanings but also secondary meanings that are attached to the mode in whichthe primary meanings are conveyed (Hervey, 1982: 136). For example, maps areoften associated with political boundaries and this association may extend tomaps, charts and plans that are without political content (Monmonier, 1991).Thus, researchers must consider not only what the diagram denotes but alsowhat it might connote, as this too will influence the interviewees’ response(Krampen et al., 1987: 217).
Verbal descriptions establish structure by defining linguistic labels forcomponents of the situation and then making references to those labels in orderto describe relational aspects of the situation. The structured nature of diagramsallows viewers to ‘read’ content both through such semiotic associations andthrough direct perceptual structures (Blackwell, 2002). Thus, when expressed indiagrammatic form, relationships between graphical elements can be suggestedby direct visual conventions (such as topological connection or adjacency)without the attentional costs of labelling either the represented elements or therelation itself (Larkin and Simon, 1987). This offers the benefit that diagramspermit the representation of relationships that are only vaguely understood.Diagrams may thus allow researchers to bring concepts into the interviewsituation that they would be unable to verbalise clearly. The interviewees’response to such ambiguous depictions may clarify vaguely understoodconcepts and hint at previously unconsidered ones.
11
Whilst researchers may employ this graphic ambiguity to their advantage, inother functions diagrams may be more explicit than linguistic constructs. Wherespoken language or texts can be underspecified, a visual representation oftenpresents a concrete view of a situation. To consider a simple example, we areable to say ‘A sat down beside B’ without specifying whether it was to the left orthe right. In contrast, a visual representation cannot avoid making a claim oneway or the other, even when the original information was uncertain (Shimojima,1996). The advantage of such concrete presentations is that interpretationbecomes simpler as the number of alternative readings decreases (Stenning andOberlander, 1995).
Such simplification may facilitate contributions from interviewees by reducing acomplex topic to a clear graphic abstraction around which discussion is based.Alternatively, the interviewee might object to the simplification as beingunrepresentative. Inappropriate assumptions that the researcher has made arethus highlighted, and unarticulated factors that the interviewee considersimportant are brought to the fore. Thus, even diagrams known to be inadequatemay still be of use in interview scenarios as interviewees strive to articulate theshortcomings of the representation through example or speculation. Thesecontributions may expand, modify or refute the researchers’ conceptualisationof the domain. As such, graphic elicitation offers a useful tool for data analysisand theory building.
GRAPHIC ELICITATION IN DATA ANALYSIS AND THEORYBUILDING
Many qualitative research texts advocate the use of visual representations in thedata analysis process (see Dey, 1993; Miles and Huberman, 1994; Ryan andBernard, 2003). In this capacity, diagrams are often regarded as a useful tool forgenerating, exploring and recording ideas. Despite this, there is rarely (if ever)any explicit description of how using these diagrams in data collection scenariosmight enhance researchers’ analysis and theorising activities. Even within amethodology such as (Straussarian) grounded theory, which advocates both theproduction of diagrams and the discussion of theories with interviewees(Strauss and Corbin, 1998: 45, 217), there is no suggestion that these twoactivities might be connected. On the contrary, diagrams are considered to beone of the private analytic tools of the researcher and ‘are rarely seen by anyonebut the analyst’ (Strauss and Corbin, 1998: 218). Whilst this approachacknowledges that diagrams are effective instruments of thought, it fails toexploit their potential for eliciting responses that can improve the accuracy,comprehensiveness and parsimony of the diagram used in theory buildingactivities.
The objective of theory building is to ‘find order in the booming, bustlingconfusion that is the realm of experience’ (Dubin, 1978: 5). To achieve this there
12
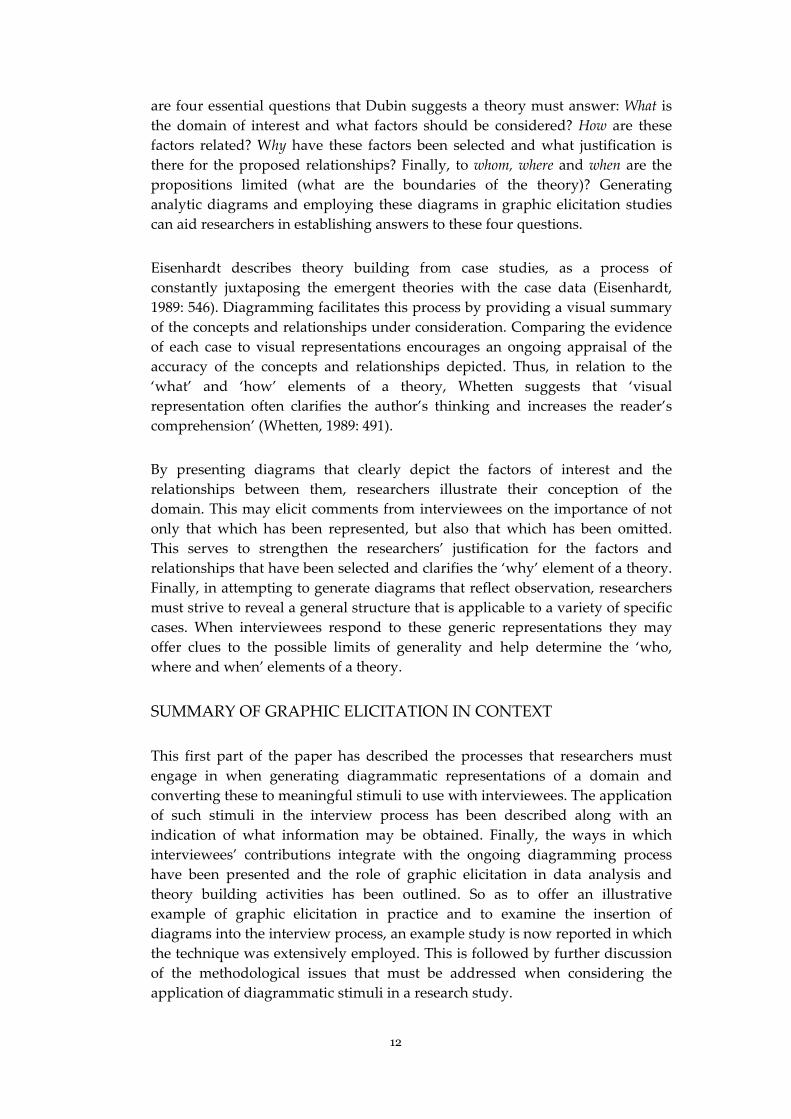
are four essential questions that Dubin suggests a theory must answer: What isthe domain of interest and what factors should be considered? How are thesefactors related? Why have these factors been selected and what justification isthere for the proposed relationships? Finally, to whom, where and when are thepropositions limited (what are the boundaries of the theory)? Generatinganalytic diagrams and employing these diagrams in graphic elicitation studiescan aid researchers in establishing answers to these four questions.
Eisenhardt describes theory building from case studies, as a process ofconstantly juxtaposing the emergent theories with the case data (Eisenhardt,1989: 546). Diagramming facilitates this process by providing a visual summaryof the concepts and relationships under consideration. Comparing the evidenceof each case to visual representations encourages an ongoing appraisal of theaccuracy of the concepts and relationships depicted. Thus, in relation to the‘what’ and ‘how’ elements of a theory, Whetten suggests that ‘visualrepresentation often clarifies the author’s thinking and increases the reader’scomprehension’ (Whetten, 1989: 491).
By presenting diagrams that clearly depict the factors of interest and therelationships between them, researchers illustrate their conception of thedomain. This may elicit comments from interviewees on the importance of notonly that which has been represented, but also that which has been omitted.This serves to strengthen the researchers’ justification for the factors andrelationships that have been selected and clarifies the ‘why’ element of a theory.Finally, in attempting to generate diagrams that reflect observation, researchersmust strive to reveal a general structure that is applicable to a variety of specificcases. When interviewees respond to these generic representations they mayoffer clues to the possible limits of generality and help determine the ‘who,where and when’ elements of a theory.
SUMMARY OF GRAPHIC ELICITATION IN CONTEXT
This first part of the paper has described the processes that researchers mustengage in when generating diagrammatic representations of a domain andconverting these to meaningful stimuli to use with interviewees. The applicationof such stimuli in the interview process has been described along with anindication of what information may be obtained. Finally, the ways in whichinterviewees’ contributions integrate with the ongoing diagramming processhave been presented and the role of graphic elicitation in data analysis andtheory building activities has been outlined. So as to offer an illustrativeexample of graphic elicitation in practice and to examine the insertion ofdiagrams into the interview process, an example study is now reported in whichthe technique was extensively employed. This is followed by further discussionof the methodological issues that must be addressed when considering theapplication of diagrammatic stimuli in a research study.
13
Part 2: graphic elicitation in practice
The objectives of this study were to assess the range of factors that influenceproduct appearance from the perspective of industrial designers and tounderstand the relationships between those factors. The profession of industrialdesign is variously defined, but for this paper it might be described as theactivity that ‘determines the form of a manufactured product, shaping it to fitthe people who use it and the industrial processes that produce it’ (IDSA, 2004).A grounded theory approach was adopted for the study as described by Straussand Corbin (1998). Whilst a number of research techniques were employed inthe study, only those aspects relevant to graphic elicitation are discussed here.
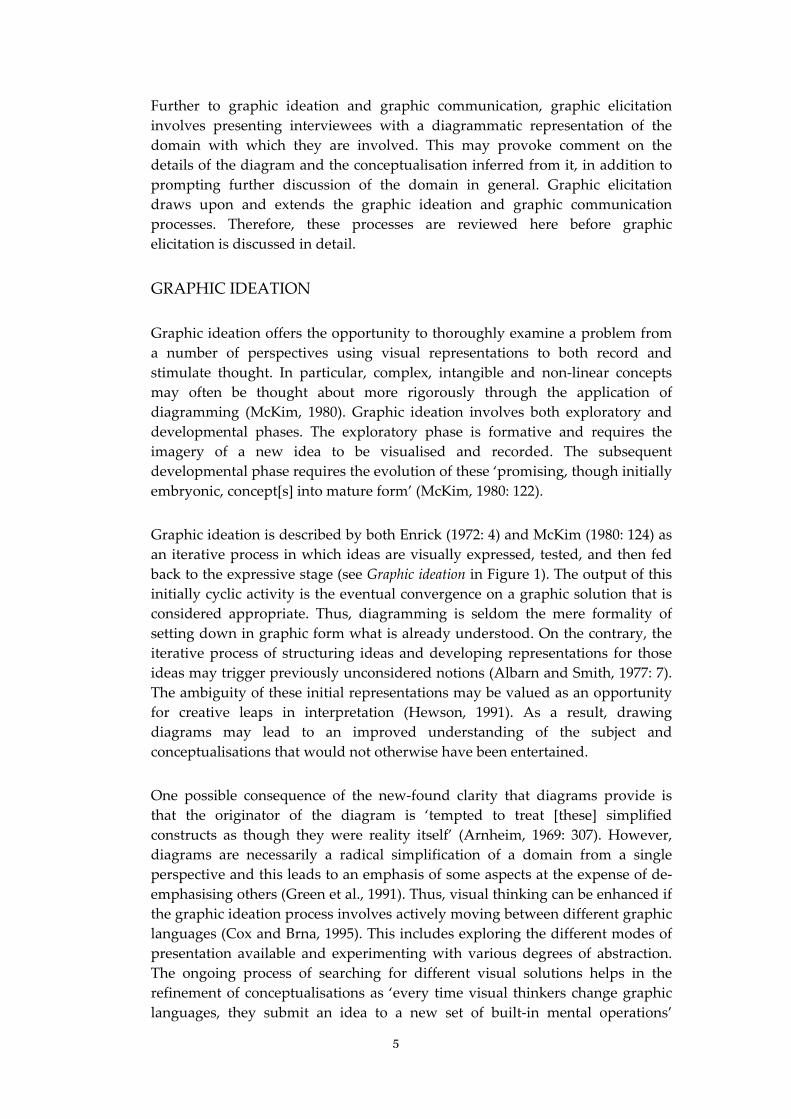
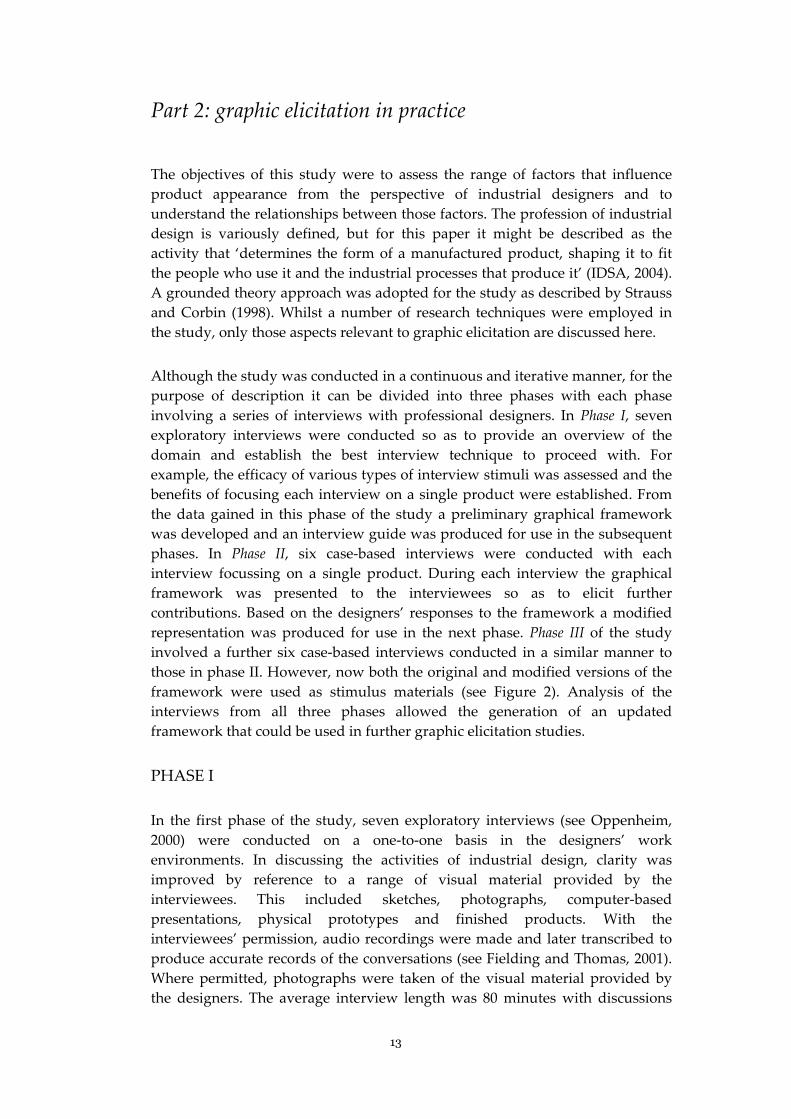
Although the study was conducted in a continuous and iterative manner, for thepurpose of description it can be divided into three phases with each phaseinvolving a series of interviews with professional designers. In Phase I, sevenexploratory interviews were conducted so as to provide an overview of thedomain and establish the best interview technique to proceed with. Forexample, the efficacy of various types of interview stimuli was assessed and thebenefits of focusing each interview on a single product were established. Fromthe data gained in this phase of the study a preliminary graphical frameworkwas developed and an interview guide was produced for use in the subsequentphases. In Phase II, six case-based interviews were conducted with eachinterview focussing on a single product. During each interview the graphicalframework was presented to the interviewees so as to elicit furthercontributions. Based on the designers’ responses to the framework a modifiedrepresentation was produced for use in the next phase. Phase III of the studyinvolved a further six case-based interviews conducted in a similar manner tothose in phase II. However, now both the original and modified versions of theframework were used as stimulus materials (see Figure 2). Analysis of theinterviews from all three phases allowed the generation of an updatedframework that could be used in further graphic elicitation studies.
PHASE I
In the first phase of the study, seven exploratory interviews (see Oppenheim,2000) were conducted on a one-to-one basis in the designers’ workenvironments. In discussing the activities of industrial design, clarity wasimproved by reference to a range of visual material provided by theinterviewees. This included sketches, photographs, computer-basedpresentations, physical prototypes and finished products. With theinterviewees’ permission, audio recordings were made and later transcribed toproduce accurate records of the conversations (see Fielding and Thomas, 2001).Where permitted, photographs were taken of the visual material provided bythe designers. The average interview length was 80 minutes with discussions
14
based around several themes that existing literature suggested would be ofrelevance (see Crilly et al., 2004).
FIGURE 2 Representation of how the data collected in each phase of the study was used to produce stimuli foruse in the subsequent phases.
Following the interviews, the transcripts were reviewed and coded to establishthemes, connections and contrasts within the data (see Glaser and Strauss, 1967;Strauss and Corbin, 1998). From this information sketches were made in anattempt to capture the essence of the subject in diagrammatic form. Iteratingthrough the graphic ideation process permitted the development of apreliminary graphical framework that was felt to adequately depict the factorsinvolved. This representation was refined and a presentation was generatedsuitable for communication with the next round of interviewees. An interviewguide for the second phase of the study was produced based on transcriptanalysis and the diagramming process.
15
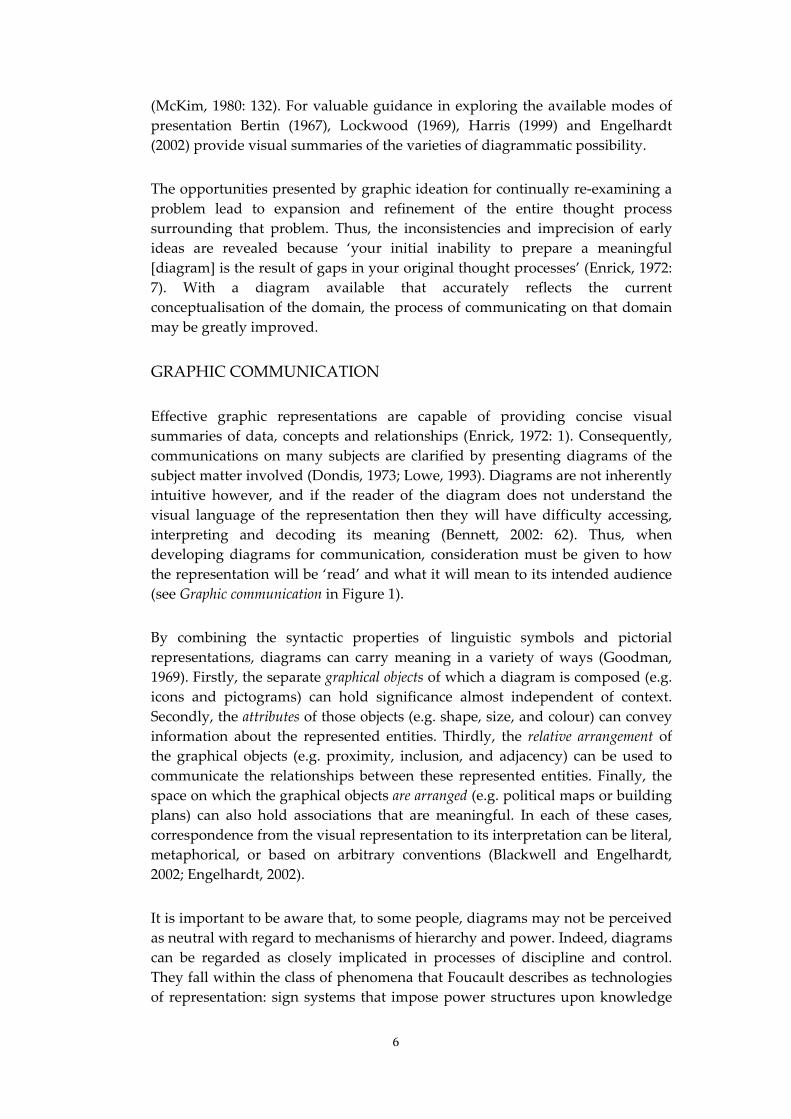
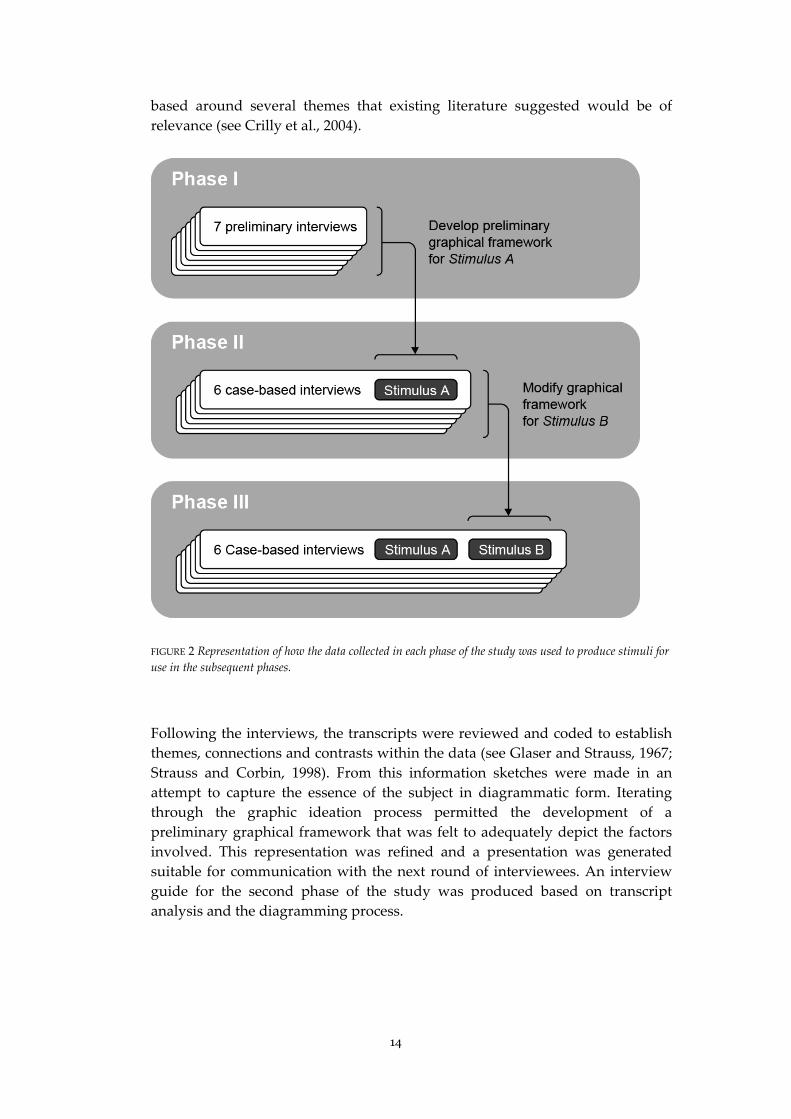
FIGURE 3 Illustration showing the general form of the preliminary graphical framework and the way inwhich the graphical layers were sequentially revealed. Although available elsewhere (Crilly et al., 2004), thestimuli used in this study are too involved to reproduce in detail here. Instead, Figure 4 shows simplifiedrepresentations of the stimuli’s basic structure, with Stimulus A corresponding to the linear arrangementshown above.
PHASE II
In the second phase of the study six case-based interviews were conductedunder similar conditions to those already described. Each interview was dividedinto two parts. Firstly, a general discussion was conducted on the factors
16
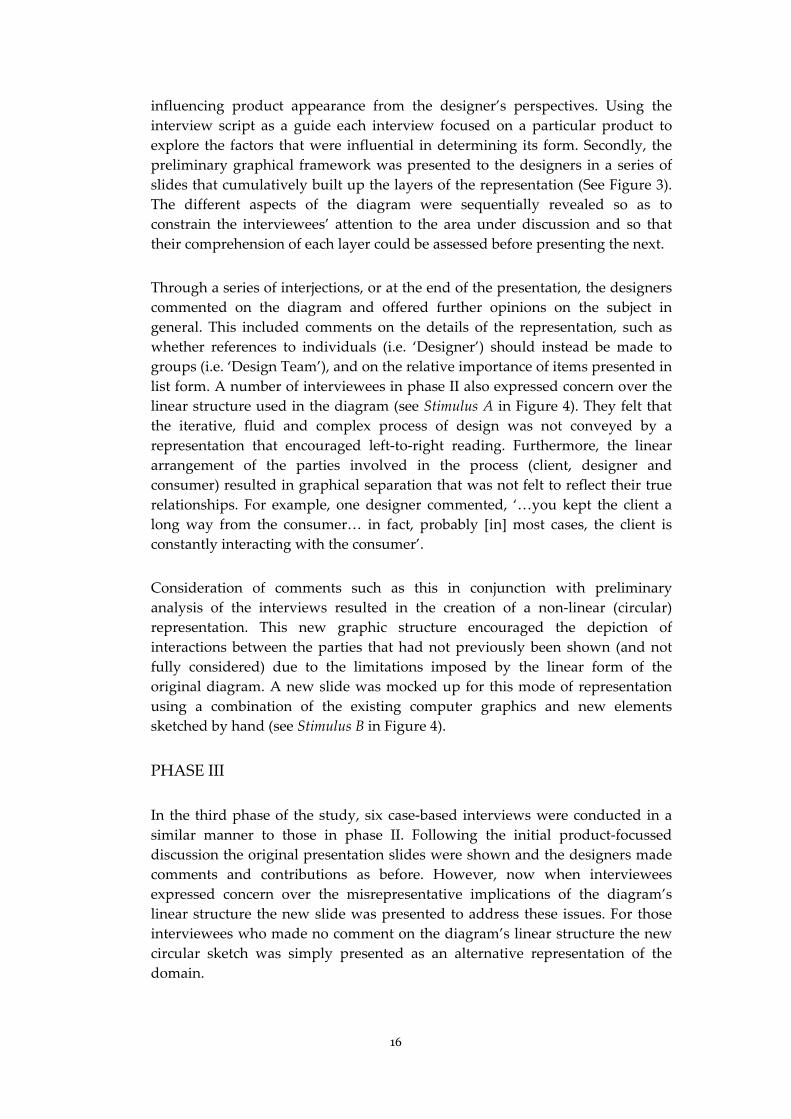
influencing product appearance from the designer’s perspectives. Using theinterview script as a guide each interview focused on a particular product toexplore the factors that were influential in determining its form. Secondly, thepreliminary graphical framework was presented to the designers in a series ofslides that cumulatively built up the layers of the representation (See Figure 3).The different aspects of the diagram were sequentially revealed so as toconstrain the interviewees’ attention to the area under discussion and so thattheir comprehension of each layer could be assessed before presenting the next.
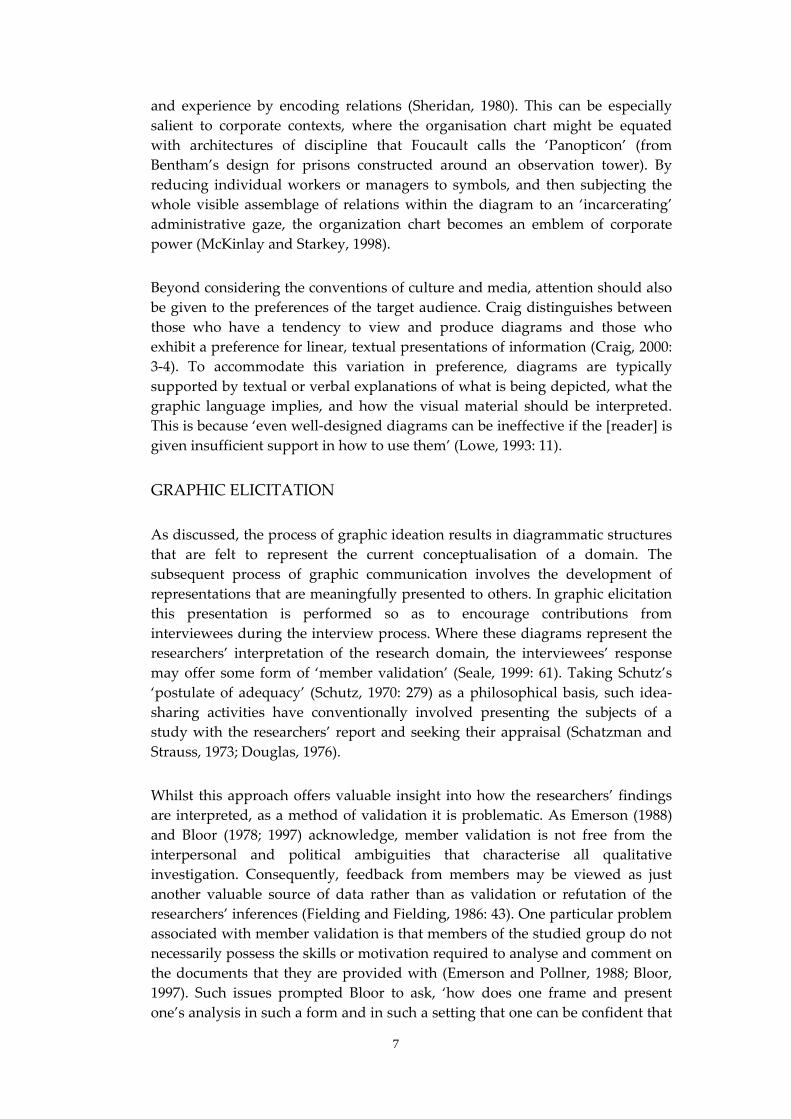
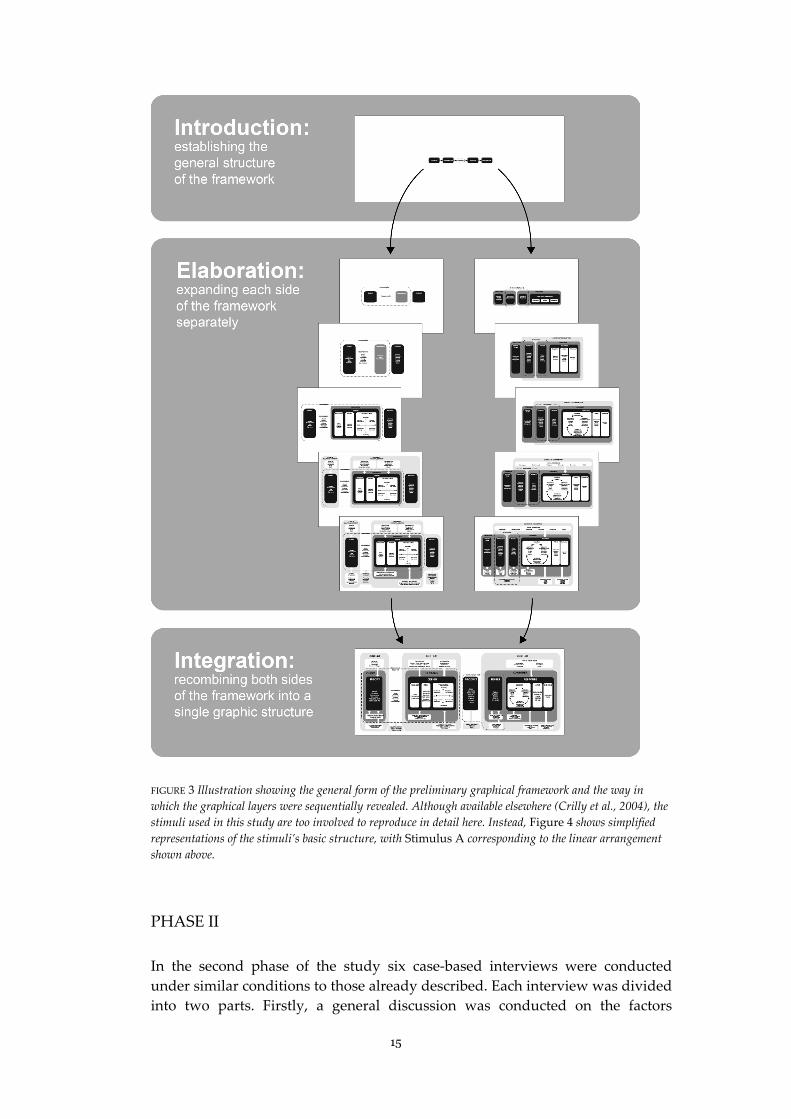
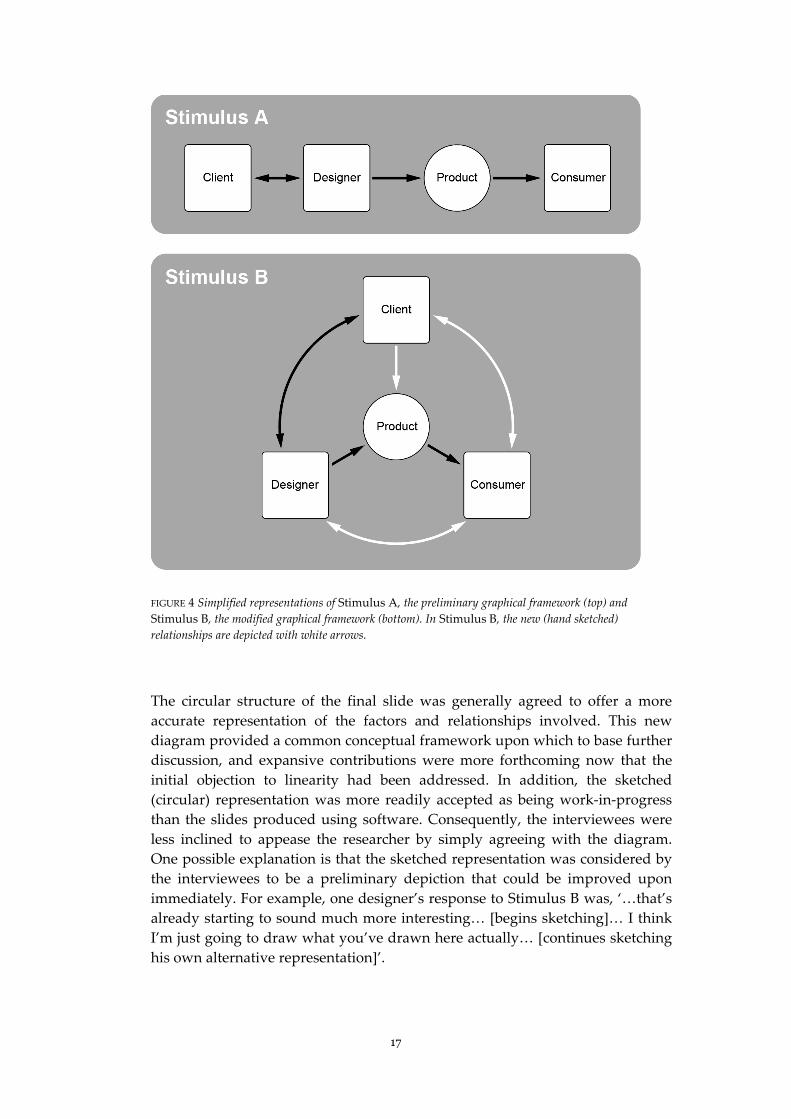
Through a series of interjections, or at the end of the presentation, the designerscommented on the diagram and offered further opinions on the subject ingeneral. This included comments on the details of the representation, such aswhether references to individuals (i.e. ‘Designer’) should instead be made togroups (i.e. ‘Design Team’), and on the relative importance of items presented inlist form. A number of interviewees in phase II also expressed concern over thelinear structure used in the diagram (see Stimulus A in Figure 4). They felt thatthe iterative, fluid and complex process of design was not conveyed by arepresentation that encouraged left-to-right reading. Furthermore, the lineararrangement of the parties involved in the process (client, designer andconsumer) resulted in graphical separation that was not felt to reflect their truerelationships. For example, one designer commented, ‘…you kept the client along way from the consumer… in fact, probably [in] most cases, the client isconstantly interacting with the consumer’.
Consideration of comments such as this in conjunction with preliminaryanalysis of the interviews resulted in the creation of a non-linear (circular)representation. This new graphic structure encouraged the depiction ofinteractions between the parties that had not previously been shown (and notfully considered) due to the limitations imposed by the linear form of theoriginal diagram. A new slide was mocked up for this mode of representationusing a combination of the existing computer graphics and new elementssketched by hand (see Stimulus B in Figure 4).
PHASE III
In the third phase of the study, six case-based interviews were conducted in asimilar manner to those in phase II. Following the initial product-focusseddiscussion the original presentation slides were shown and the designers madecomments and contributions as before. However, now when intervieweesexpressed concern over the misrepresentative implications of the diagram’slinear structure the new slide was presented to address these issues. For thoseinterviewees who made no comment on the diagram’s linear structure the newcircular sketch was simply presented as an alternative representation of thedomain.
17
FIGURE 4 Simplified representations of Stimulus A, the preliminary graphical framework (top) andStimulus B, the modified graphical framework (bottom). In Stimulus B, the new (hand sketched)relationships are depicted with white arrows.
The circular structure of the final slide was generally agreed to offer a moreaccurate representation of the factors and relationships involved. This newdiagram provided a common conceptual framework upon which to base furtherdiscussion, and expansive contributions were more forthcoming now that theinitial objection to linearity had been addressed. In addition, the sketched(circular) representation was more readily accepted as being work-in-progressthan the slides produced using software. Consequently, the interviewees wereless inclined to appease the researcher by simply agreeing with the diagram.One possible explanation is that the sketched representation was considered bythe interviewees to be a preliminary depiction that could be improved uponimmediately. For example, one designer’s response to Stimulus B was, ‘…that’salready starting to sound much more interesting… [begins sketching]… I thinkI’m just going to draw what you’ve drawn here actually… [continues sketchinghis own alternative representation]’.
18
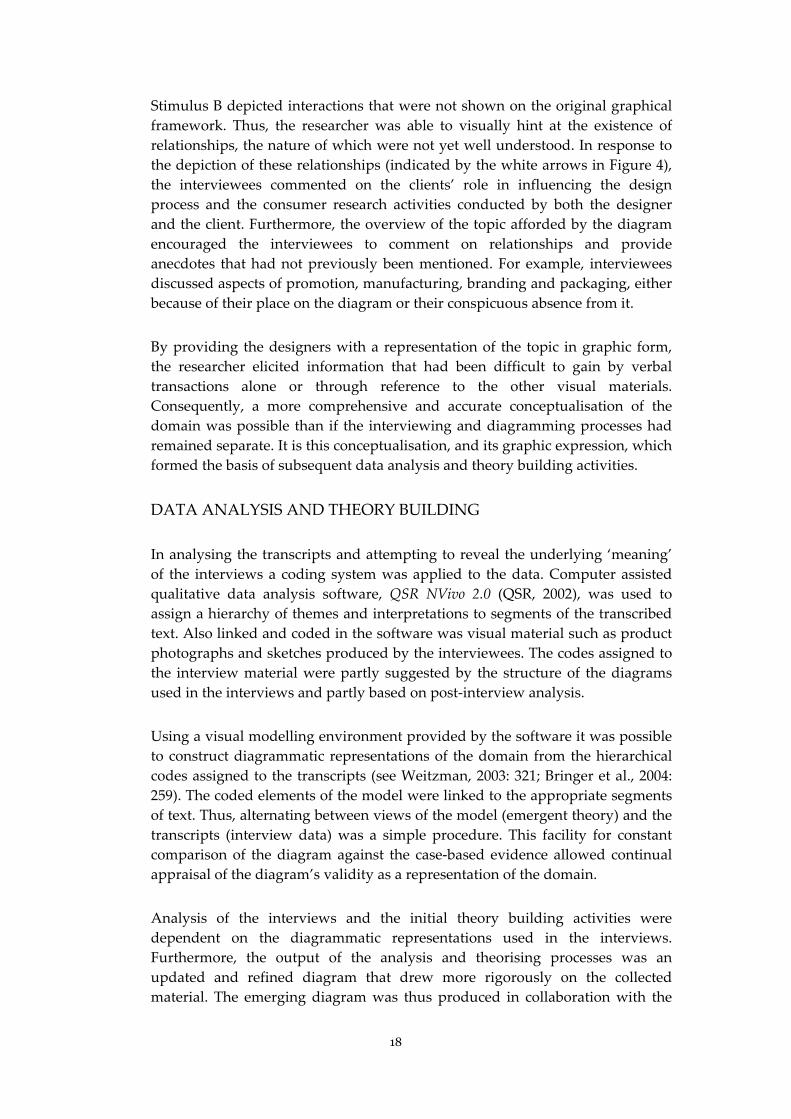
Stimulus B depicted interactions that were not shown on the original graphicalframework. Thus, the researcher was able to visually hint at the existence ofrelationships, the nature of which were not yet well understood. In response tothe depiction of these relationships (indicated by the white arrows in Figure 4),the interviewees commented on the clients’ role in influencing the designprocess and the consumer research activities conducted by both the designerand the client. Furthermore, the overview of the topic afforded by the diagramencouraged the interviewees to comment on relationships and provideanecdotes that had not previously been mentioned. For example, intervieweesdiscussed aspects of promotion, manufacturing, branding and packaging, eitherbecause of their place on the diagram or their conspicuous absence from it.
By providing the designers with a representation of the topic in graphic form,the researcher elicited information that had been difficult to gain by verbaltransactions alone or through reference to the other visual materials.Consequently, a more comprehensive and accurate conceptualisation of thedomain was possible than if the interviewing and diagramming processes hadremained separate. It is this conceptualisation, and its graphic expression, whichformed the basis of subsequent data analysis and theory building activities.
DATA ANALYSIS AND THEORY BUILDING
In analysing the transcripts and attempting to reveal the underlying ‘meaning’of the interviews a coding system was applied to the data. Computer assistedqualitative data analysis software, QSR NVivo 2.0 (QSR, 2002), was used toassign a hierarchy of themes and interpretations to segments of the transcribedtext. Also linked and coded in the software was visual material such as productphotographs and sketches produced by the interviewees. The codes assigned tothe interview material were partly suggested by the structure of the diagramsused in the interviews and partly based on post-interview analysis.
Using a visual modelling environment provided by the software it was possibleto construct diagrammatic representations of the domain from the hierarchicalcodes assigned to the transcripts (see Weitzman, 2003: 321; Bringer et al., 2004:259). The coded elements of the model were linked to the appropriate segmentsof text. Thus, alternating between views of the model (emergent theory) and thetranscripts (interview data) was a simple procedure. This facility for constantcomparison of the diagram against the case-based evidence allowed continualappraisal of the diagram’s validity as a representation of the domain.
Analysis of the interviews and the initial theory building activities weredependent on the diagrammatic representations used in the interviews.Furthermore, the output of the analysis and theorising processes was anupdated and refined diagram that drew more rigorously on the collectedmaterial. The emerging diagram was thus produced in collaboration with the
19
interviewees and was both an instrument and product of the research.Consequently, the designers’ ability to interpret and respond to graphicartefacts was highly influential in determining the effectiveness of diagrammaticstimuli.
THE VISUAL LITERACY OF INTERVIEWEES
Drawing is a central activity in design that facilitates the exploration of possiblesolutions to a problem by providing a medium for visual and spatial thinking(Dorst, 2003: 118). Whether or not the designer is creating graphical products,the process of design often involves constructing and sharing visualrepresentations in the form of sketches (Eckert et al., 2004). For example adesigner may make marks on paper in order to develop partly-formed visualconcepts and then observe and reflect on the appearance of these marks in orderto develop the design (Fish and Scrivener, 1990). Thus, designers are consideredto be engaged in ‘conversation’ with the drawing (Schön, 1991: 78), and theirsketching process may be considered as one form of graphic ideation.Consequently, there are a number of reasons why designers are a group wellsuited to the use of diagrams in interviews. Firstly, they are familiar andcomfortable with interpreting information presented visually. Secondly, theyare predisposed to viewing graphic artefacts as ‘designed products’ that may berevised and improved upon. Thirdly, they often have a well-developed graphicsensibility and are capable of commenting on their own response todiagrammatic stimuli.
These characteristics are certainly not the exclusive preserve of designers, asindividuals from a range of backgrounds are confident in producing andinterpreting diagrammatic representations. However, some groups are lesslikely than others to exhibit strong visual literacy and there may be limitedbenefit in using diagrammatic stimuli with all interviewees. For example, in theresearchers’ previous experience, many groups associate diagrams with thework of technology, in particular with professional practices where socialinterventions are achieved by technical means. This has the effect that diagramsmay be both alienating for those who feel disempowered by technologicalchange, and affirming for those who are engaged in the processes of change(McKinlay and Starkey, 1998). Thus, when considering graphic elicitation as apossible approach, the researcher must remain mindful of the interviewees’preferences and capabilities with regard to diagram use.
Further to the example study reported here, the evolving diagram has beenemployed in graphic elicitation studies with the professional researchers whoinvestigate user behaviour to inform industrial design. In future work, therepresentation might be adapted for studies with other stakeholders in theindustrial design process such as manufacturers, brand managers, marketers,retailers, and consumers. In each of these studies the visual literacy of the
20
respective groups would need to be assessed when considering the preparationand implementation of diagrammatic stimuli.
SUMMARY OF GRAPHIC ELICITATION IN PRACTICE
This second part of the paper has illustrated how graphic elicitation may beincorporated within a qualitative research study. The integration ofdiagramming with the interview process has been discussed, and the role ofdiagrams in subsequent analysis and theorising activities has been outlined.Examples of the ways in which interviewees interpreted the stimuli and theirsubsequent contributions were also reviewed. In addition, an exploration of thedesigners’ relationship with visual artefacts was offered as an indication of howthe interviewees’ familiarity with visual representations should be consideredwhen employing the graphic elicitation technique. Examination of these issueswithin one particular study suggests some of the broader methodologicalconsiderations relevant to the preparation and application of diagrams in theresearch process. Having now considered graphic elicitation within itstheoretical context and through in practical application, these methodologicalconsiderations are now discussed before conclusions are drawn.
Discussion: methodological considerations
Despite the potential benefits that diagrams offer researchers, care must betaken to ensure that they are used appropriately. There is the danger thatgraphical representations of a domain may be sufficiently persuasive so as todefine rather than reflect thinking. In particular, researchers may inadvertentlystrive to fit observations to the diagram, rather than modifying the diagram toreflect observations. Similarly, it is possible for concepts or relationshipssuggested by the data to not even be observed because the researcher’sconceptualisation of the domain is constrained by an inadequate representation.These problems stem from considering diagrams to be true reflections of thedomain rather than a temporary model that should be subject to evaluation andrevision. Constantly comparing case data against the representation andregularly experimenting with different graphic languages are effective ways tocombat these potential problems.
Just as the graphic ideation process may become too strongly aligned with aparticular representation, there is the danger that presenting interviewees with asingle graphic summary of the domain will constrain their thinking.Consequently, interviewees may be inclined to suggest only modifications to thediagram rather than offering new conceptualisations. Furthermore, well-finished diagrams may appear particularly convincing and interviewees maynot perceive substantial failings due to this ‘graphic seduction’. Such problemscan be alleviated (although probably not eliminated) by presenting the diagrams
21
as works-in-progress that depict possible representations of the domain. Thismight be achieved by verbal guidance or, perhaps more persuasively, bypresenting ambiguous sketches and alternative stimuli.
A further issue for consideration is that of when the stimuli should be introducedinto the interviews. Presenting the diagram at the outset may facilitate a concisedescription of the researchers’ interests and provide an immediately availablebasis for discussion. However, such an approach may also prejudice theinterviewees’ responses and strongly bias the material collected. A lessimposing approach may involve employing graphic elicitation after asubstantial period of discussion, or only in repeat interviews. Thus,interviewees’ perspectives might be revealed through verbal discourse (possiblywith reference to non-diagrammatic stimuli) before the researchers’interpretations are disclosed.
If the interviewees’ response to the diagram modifies the researchers’ evolvingconceptualisation of the subject new representations may be generated. Whetherthese are employed in future interviews will ultimately be determined by theresearch objectives and the methodological framework adopted. However, theremay be benefits to maintaining some consistency in the stimuli used in a study.For example, continually updating the diagram based on each interviewee’scomments may prevent the assessment of any consensus or variation inresponse.
In graphic elicitation studies, interviewees may indicate elements of the diagramby gesture as they talk. Consequently, an audio recording (and any subsequenttranscript) offers only an incomplete record of the interviewees’ contribution.For example, when responding to a representation, interviewees may makecomments such as, ‘this [indicating an element of the diagram] is sometimesalso over here [indicating an area on the page], next to this one [indicatinganother element of the diagram]’. Although listening to the recording, orreading the transcript, may allow the researcher to recollect the meaning of sucha vague statement, errors in interpretation are clearly possible.
One approach for overcoming this problem is for researchers to adopt aconfirmation strategy, verbally reiterating the interviewees’ (partially visual)messages. Thus, the recorded interactions include questions or comments fromresearchers that clarify the interviewees’ responses. Video recording may offer amore complete record of the interviewees’ interactions with the diagram bydocumenting the subtleties of gesture and expression. However, whilst thisapproach may aid analysis, it also presents attendant problems relating toaccess, behaviour and technique. As an alternative approach, the interviewees’comments might be sketched out either on the original diagram or elsewhere.Thus, the essential details of the interviewees’ visual ideas may be recorded forlater elaboration and analysis.
22
Conclusions
Graphic elicitation encourages contributions from interviewees that arerelatively inaccessible by other means. This is possible because diagramsprovide a common conceptual foundation upon which discussion can takeplace. Reference to (and interaction with) diagrammatic stimuli may improvecommunication between researchers and interviewees. This can lead researchersto improved conceptualisations of a domain and provide a strong foundationupon which to base future theorising activities. As such, graphic elicitationcomprises a valuable component in a wider qualitative research methodology.This paper has considered the graphic elicitation process within the broadercontext of diagramming and through examination of an example study. This hasafforded a comprehensive discussion of the technique and in particular, threespecific research questions have been addressed.
Firstly, it was asked, ‘What are the unique characteristics of diagrams in relation toother elicitation stimuli?’ We have seen that diagrams differ from other elicitationstimuli both in what they can represent and how they are interpreted. Byadopting various degrees of graphic abstraction, diagrams allow the depictionof subject matter ranging from the conceptual to the physical. They thereforepermit representation of the salient features of a domain in a single graphicoverview. By adopting literal, metaphorical and arbitrary conventions, diagramscan convey meaning in a variety of ways. The graphical objects of which adiagram is composed, the properties of those objects, the relationships betweenthem and the space on which they are arranged can all guide interpretation.Furthermore, diagrams differ from other stimuli in terms of their ambiguity. Insome instances diagrams permit very vague depictions yet still remain coherent,whilst in other instances they demand the concrete representation of anuncertain situation. These characteristics of diagrams facilitate both thedevelopment and presentation of the researcher’s emerging interpretations ortheories.
Secondly, it was asked, ‘What specific benefits might be realised by employingdiagrammatic stimuli in interviews?’ We have seen that employing diagrams asinterview stimuli elicits a range of contributions that can be classed according tothe extent to which they refer to the diagram. By referring to the details of thediagram, interviewees may comment on the specific presentation and theresearcher may thus gain insights into how the diagram was interpreted. Byreferring to the structure of the diagram, interviewees may comment on theconceptualisation which it implies including the accuracy of what is depictedand the relevance of what has been omitted. In addition, and withoutnecessarily referring to the diagram, interviewees may offer their perspectiveson the subject in general, as the stimuli prompts reflection on topics notpreviously discussed. These three forms of contribution may support those
23
gained by other methods and expand, modify or refute the researcher’semerging conceptualisation.
Thirdly, it was asked, ‘What are the practical and methodological issues that must beaddressed when considering the preparation of research diagrams and their insertioninto the interview process?’ We have seen that during the process of graphicideation, researchers should employ an iterative approach to sketching andevaluation and develop representations that correspond well with their ideas.Actively changing between different graphic languages will stimulate thoughtand submit the representations to increased scrutiny. The subsequent process ofgraphic communication requires consideration of the interviewees’ visualliteracy and anticipation of how the diagram might be interpreted. Theseprocesses inform the activity of converting the researcher’s initial sketches into aform suitable for use in graphic elicitation. Following this preparation of thestimuli, the issues of when and how they are to be used in the interview must beaddressed. Whilst the details of such considerations are likely to vary betweenstudies, the requirement to address the potential introduction of bias is everpresent. Finally, when recording the interviewees’ response to the stimuli,researchers should strive to preserve the full richness of the (often physical)interaction irrespective of the recording method chosen.
Through the presentation of an example study, integration of graphic elicitationinto the diagramming and interviewing processes has been demonstrated asparticularly applicable to a professional context in which visual representationsare culturally privileged. Exploration of graphic elicitation in this specificdomain has shown that it is both a feasible and effective research technique. Agreater understanding of the potential for graphic elicitation and thepracticalities of its implementation will require further studies across a range ofpopulations, domains and interview scenarios. Such work may reveal the waysin which graphic elicitation can be adapted to a variety of applications and offerguidance as to how the issues raised in this paper might be addressed indifferent contexts.
ACKNOWLEDGEMENTS
The authors wish to thank Professor Mike Ashby of the University ofCambridge, Marianne Guldbrandsen of Cranfield University and twoanonymous referees for providing constructive comments on earlier drafts ofthis paper. The authors are especially grateful to each of the designprofessionals who generously gave their time to participate in the examplestudy.
24
REFERENCES
Albarn, K. and Smith, J. M. (1977), Diagram: the instrument of thought, London,UK: Thames and Hudson.
Arnheim, R. (1969), Visual Thinking, Los Angeles, CA: University of CaliforniaPress.
Banks, M. (2001), Visual Methods in Social Research, London, UK: Sage.Bennett, A. (2002), ‘Interactive Aesthetics’, Design Issues, 18 (3): 62-69.Bertin, J. (1967), Semiologie graphique: les réseux les cartes, Paris, France: Mouton.Blackwell, A. and Engelhardt, Y. (2002), ‘A Meta-Taxonomy for Diagram
Research’, pp. 47-64. in Anderson, M., Meyer, B. and Olivier, P. (eds)Diagrammatic Representation and Reasoning. London, UK: Springer.
Blackwell, A. F. (2001), Thinking with Diagrams, Boston, MA: Kluwer Academic.Blackwell, A. F. (2002), ‘Psychological perspectives on diagrams and their users’,
pp. 109-123. in Anderson, M., Meyer, B. and Olivier, P. (eds)Diagrammatic representation and reasoning. London, UK: Springer-Verlag.
Bloor, M. (1978), ‘On the analysis of observational data: A discussion of theworth and uses of inductive techniques and respondent validation’,Sociology, 12 (545-557).
Bloor, M. (1997), ‘Techniques of validation in qualitative research: a criticalcommentary’, pp. 37-50. in Miller, G. and Dingwall, R. (eds) Context andmethod in qualitative research. London, UK: Sage.
Bringer, J. D., Johnston, L. H. and Brackenridge, C. H. (2004), ‘Maximisingtransparency in a doctoral thesis: the complexities of writing about theuse of QSR*NVIVO within a grounded theory study’, QualitativeResearch, 4 (2): 247-265.
Cheng, P. C.-H. (1996), ‘Diagrammatic knowledge aquisition: elicitation,analysis and issues’, pp. 179-194. in Shadbolt, N., O’Hara, K. andSchreiber, G. (eds) Advances in knowledge acquisition: 9th EuropeanKnowledge Acquisition Workshop (EKAW ‘96). Nottingham, UK: Springer.
Clark, C. D. (1999), ‘The autodriven interview: a photographic viewfinder intochildren’s experience’, Visual Sociology, 14 (1/2): 39-50.
Collier, J. (1967), Visual anthropology: photography as a research method, New York,NY: Holt Rinehart and Winston.
Cox, R. and Brna, P. (1995), ‘Supporting the use of external representations inproblem solving: the need for flexible learning environments’, Journal ofArtificial Intelligence in Education, 6 (2): 239-302.
Craig, M. (2000), Thinking visually: business applications of fourteen core diagrams,London, UK: Continuum.
Crilly, N., Moultrie, J. and Clarkson, P. J. (2004), ‘Seeing things: consumerresponse to the visual domain in product design’, Design Studies, 25 (6):547-577.
Dey, I. (1993), Qualitative data analysis: a user-friendly guide for social scientists,London, UK: Routledge.
Dondis, D. A. (1973), A primer of visual literacy, Cambridge, MA: MIT Press.Dorst, K. (2003), Understanding design: 150 reflections on being a designer,
Amsterdam, The Netherlands: BIS Publishers.
25
Douglas, J. D. (1976), Investigative social research: individual and team field research,Beverly Hills, CA: Sage Publications.
Dubin, R. (1978), Theory Building, New York, NY: The Free Press.Eckert, C. M., Blackwell, A. F., Stacey, M. K. and Earl, C. F. (2004), ‘Sketching
across design domains’, in Proceedings of the Third International Conferenceon Visual and Spatial Reasoning in Design (VR’04). MIT, Cambridge, MA:(In Press).
Eisenhardt, K. M. (1989), ‘Building Theories From Case Study Research’,Academy of Management Review, 14 (4): 532-550.
Emerson, R. M. and Pollner, M. (1988), ‘On the Use of Members’ Responses toResearchers’ Accounts’, Human Organization, 47 (3): 189-198.
Engelhardt, Y. (2002), ‘The language of graphics - a framework for the analysisof syntax and meaning in maps, charts and diagrams’, University ofAmsterdam, The Netherlands.
Enrick, N. L. (1972), Effective Graphic Communication, Princeton, NJ: Auerbach.Fielding, N. and Fielding, J. L. (1986), Linking data, Beverly Hills, CA: Sage.Fielding, N. and Thomas, H. (2001), ‘Qualitative Interviewing’, pp. 123-144. in
Gilbert, N. (ed) Researching Social Life. London, UK: SAGE Publications.Fish, J. and Scrivener, S. (1990), ‘Amplifying the mind’s eye: Sketching and
visual cognition’, Leonardo, 23 (1): 117-126.Ford, D. N. and Sterman, J. D. (1998), ‘Expert Knowledge Elicitation to Improve
Formal and Mental Models’, System Dynamics Review, 14 (4): 309-340.Gaskell, G. (2000), ‘Individual and group interviewing’, pp. 38-56. in Bauer, M.
W. and Gaskell, G. (eds) Qualitative researching with text, image and sound:a practical handbook. London, UK: Sage Publications.
Glaser, B. G. and Strauss, A. L. (1967), The discovery of grounded theory: strategiesfor qualitative research, Hawthorne, NY: Aldine de Gruyter.
Goodman, N. (1969), Languages of art: An approach to a theory of symbols, London,UK: Oxford University Press.
Green, T. R. G., Petre, M. and Bellamy, R. K. E. (1991), ‘Comprehensibility ofvisual and textual programs: A test of superlativism against the ‘match-mismatch’ conjecture’, pp. 121-146. in Koenemann-Belliveau, J., Moher,T. G. and Robertson, S. P. (eds) Empirical Studies of Programmers: FourthWorkshop. Norwood, NJ:
Harper, D. (2002), ‘Talking about pictures: a case for photo elicitation’, VisualStudies, 17 (1): 13-26.
Harris, R. L. (1999), Information graphics - a comprehensive illustrated reference:visual tools for analysing, managing and communicating, Atlanta, GA:Management Graphics.
Hervey, S. (1982), Semiotic perspectives, London, UK: Allen & Unwin.Hewson, R. (1991), ‘Deciding through doing: The role of sketching in
typographic design’, ACM SIGCHI Bulletin, 23 (4): 39-40.IDSA (2004), ‘What is ID?’ Careers Brochure (PDF), Industrial Designers Society of
America, Website (consulted 28/10/2004):http://www.idsa.org/webmodules/articles/articlefiles/id_brochure.pdf
Ittelson, W. H. (1996), ‘Visual perception of markings’, Psychonomic Bulletin &Review, 3 (2): 171-187.
26
Johnson, J. C. and Weller, S. C. (2001), ‘Elicitation techniques for interviewing’,pp. 491-514. in Gubrium, J. F. and Holstein., J. A. (eds) Handbook ofinterview research: context & method. London, UK: Sage.
Kazmierczak, E. T. (2001), ‘ A semiotic perspective on aesthetic preferences,visual literacy, and information design’, Information Design Journal, 10 (2):176-187.
Kesby, M. (2000), ‘Participatory Diagramming as a Means to ImproveCommunication about Sex in Rural Zimbabwe: a Pilot Study’, SocialScience and Medicine, 50: 1723-1741.
Krampen, M., Oehler, K., Posner, R., Sebeok, T. and von Uexküll, T. (1987),Classics of semiotics, New York, UK: Plenum.
Kress, G. and van Leeuwen, T. (1996), Reading images: the grammar of visualdesign, London, UK: Routledge.
Larkin, J. H. and Simon, H. A. (1987), ‘Why a diagram is (sometimes) worth tenthousand words’, Cognitive Science, 11: 65-99.
Lockwood, A. (1969), Diagrams, London, UK: Studio Vista.Lowe, R. (1993), Successful instructional diagrams, London, UK: Kogan Page.MacEachren, A. M. (1994), ‘Visualization in Modern Cartography: Setting the
Agenda’, pp. 1-12. in MacEachren, A. M. and Taylor, D. R. F. (eds)Visualization in Modern Cartography. Oxford, UK: Pergamon.
MacEachren, A. M. (1995), How maps work: representation, visualization, and design,New York, NY: Guildford Press.
Mayoux, L. (2003), ‘Using Diagrams’, Enterprise Impact News, 22 (August): 1-2.McKim, R. H. (1980), Experiences in Visual Thinking, Boston, MA: PWS Publishing
Company.McKinlay, A. and Starkey, K. (1998), ‘The velvety grip: managing managers in
the modern corporation’, pp. in McKinlay, A. and Starkey, K. (eds)Foucault, management and organization theory: from panopticon totechnologies of self. London, UK: Sage.
Miles, M. B. and Huberman, A. M. (1994), Qualitative data analysis: an expandedsourcebook, 2nd edition, Thousand Oaks, CA: Sage Publications.
Monmonier, M. (1991), How to lie with maps, 2nd edition, Chicago, IL: Universityof Chicago Press.
Oppenheim, A. N. (2000), Questionnaire Design, Interviewing and AttitudeMeasurement: New Edition, London, UK: Continuum.
Padilla, R. V. (1993), ‘Using dialogical research methods’, pp. 153-166. inMorgan, D. L. (ed) Successful focus groups: advancing the state of the art.London, UK: Sage Publications.
QSR (2002), QSR NVivo (v. 2.0), Melbourne, Australia: QSR International Pty.Ltd, Website: http://www.qsrinternational.com/
Ryan, G. W. and Bernard, H. R. (2003), ‘Data management and analysismethods’, pp. 259-309. in Denzin, N. K. and Lincoln, Y. S. (eds) Collectingand interpreting qualitative materials. London, UK: Sage.
Samuels, J. (2004), ‘Breaking the Ethnographer’s Frames: Reflections on the Useof Photo Elicitation in Understanding Sri Lankan Monastic Culture’,American Behavioral Scientist, 47 (12): 1528-1550.
27
Schatzman, L. and Strauss, A. L. (1973), Field research: strategies for a naturalsociology, Englewood Cliffs, NJ: Prentice-Hall.
Schön, D. A. (1991), The Reflective Practitioner: How Professionals Think In Action,Aldershot, UK: Ashgate.
Schutz, A. (1970), On phenomenology and social relations: selected writings, Chicago,IL: University of Chicago Press.
Seale, C. (1999), The quality of qualitative research, London, UK: Sage.Sheridan, A. (1980), Michel Foucault: the will to truth, London, UK: Sage.Shimojima, A. (1996), ‘Operational constraints in diagrammatic reasoning’, pp.
27-48. in Allwein, G. and Barwise, J. (eds) Logical reasoning with diagrams.Oxford, UK: Oxford University Press.
Stenning, K. and Oberlander, J. (1995), ‘A Cognitive Theory of Graphical andLinguistic Reasoning: Logic and Implementation’, Cognitive Science, 19(1): 97-140.
Strauss, A. and Corbin, J. (1998), Basics of Qualitative Research: Techniques andProcedures for Developing Grounded Theory, 2nd Edition, London, UK: SagePublications.
Törrönen, J. (2002), ‘Semiotic theory on qualitative interviewing using stimulustexts’, Qualitative Research, 2 (3): 343-362.
Weitzman, E. A. (2003), ‘Software and qualitative research’, pp. 310-339. inDenzin, N. K. and Lincoln, Y. S. (eds) Collecting and interpreting qualitativematerials. London, UK: Sage.
Whetten, D. A. (1989), ‘What Constitutes a Theoretical Contribution’, Academy ofManagement Review, 14 (4): 490-495.
Wurman, R. S. (1997), Information architects, New York, NY: GraphisPublications.