Embed Size (px)
Citation preview
Title Page
Contents
JJ II
J I
Page 1 of 39
Go Back
Full Screen
Close
Quit
Graphical Models for Data Mining
NLP-AI Seminar
aManoj Kumar Chinnakotla
Title Page
Contents
JJ II
J I
Page 2 of 39
Go Back
Full Screen
Close
Quit
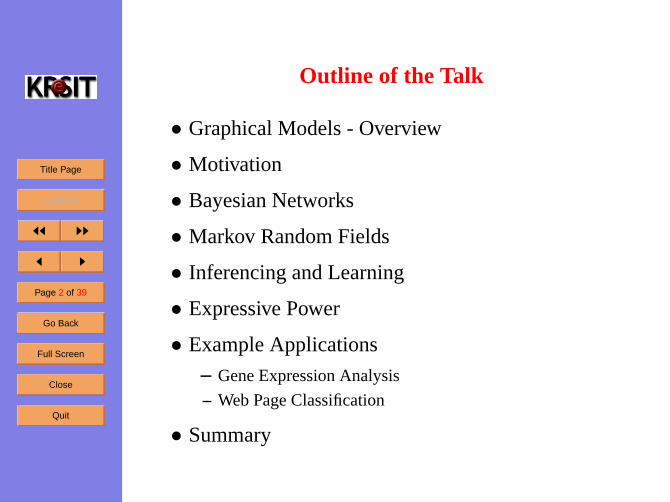
Outline of the Talk
• Graphical Models - Overview
• Motivation
• Bayesian Networks
• Markov Random Fields
• Inferencing and Learning
• Expressive Power
• Example Applications
– Gene Expression Analysis
– Web Page Classification
• Summary
Title Page
Contents
JJ II
J I
Page 3 of 39
Go Back
Full Screen
Close
Quit
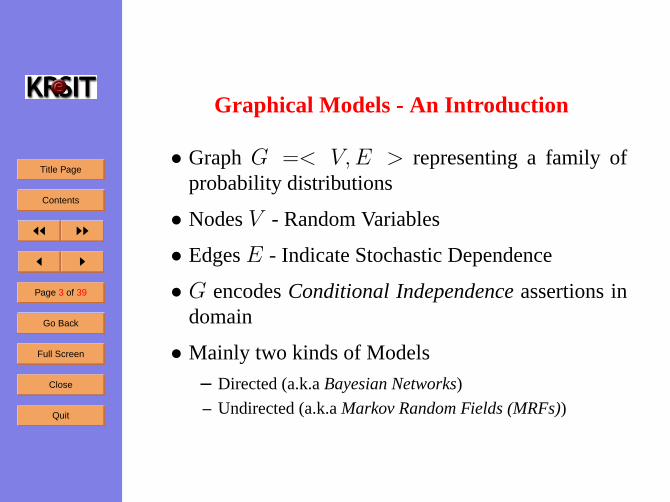
Graphical Models - An Introduction
• GraphG =< V,E > representing a family ofprobability distributions
• NodesV - Random Variables
• EdgesE - Indicate Stochastic Dependence
• G encodesConditional Independenceassertions indomain
• Mainly two kinds of Models
– Directed (a.k.aBayesian Networks)
– Undirected (a.k.aMarkov Random Fields (MRFs))
Title Page
Contents
JJ II
J I
Page 4 of 39
Go Back
Full Screen
Close
Quit
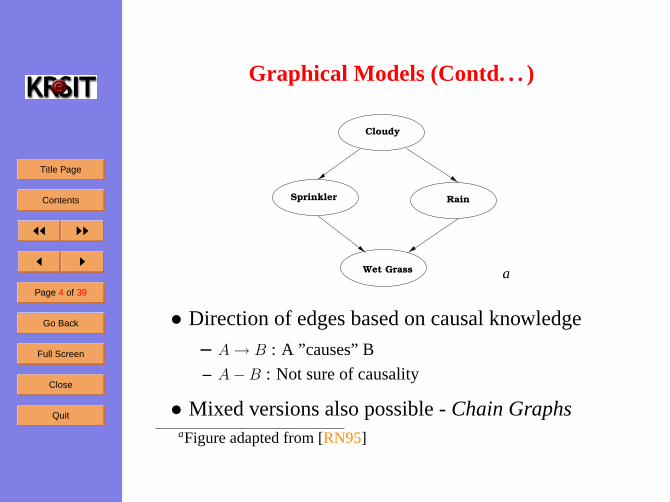
Graphical Models (Contd. . . )
Cloudy
RainSprinkler
Wet Grass a
• Direction of edges based on causal knowledge
– A→ B : A ”causes” B
– A−B : Not sure of causality
• Mixed versions also possible -Chain GraphsaFigure adapted from [RN95]
Title Page
Contents
JJ II
J I
Page 5 of 39
Go Back
Full Screen
Close
Quit
Why Graphical Models?
• Framework for modeling and effeciently reasoningabout multiple correlated random variables
• Provides insights into the assumptions of existingmodels
• Allows qualitative specification of independence as-sumptions

Title Page
Contents
JJ II
J I
Page 6 of 39
Go Back
Full Screen
Close
Quit
Why Graphical Models?Recent Trends in Data Mining
• Traditional learning algorithms assume
– Data available in record format
– Instances arei.i.d samples
• Recent domains like Web, Biology, Marketing havemorerichly structured data
• Examples : DNA Sequences, Social Networks, Hy-perlink structure of Web, Phylogeny Trees
• Relational Data Mining - Data spread across multi-ple tables
• Relational Structure helps significantly in enhancingaccuracy [CDI98,LG03]
• Graphical Models offer a natural formalism tomodel such data
Title Page
Contents
JJ II
J I
Page 7 of 39
Go Back
Full Screen
Close
Quit
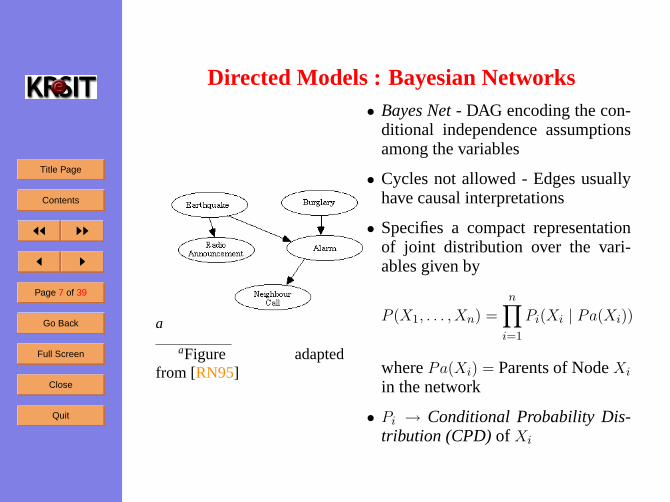
Directed Models : Bayesian Networks
a
aFigure adaptedfrom [RN95]
• Bayes Net- DAG encoding the con-ditional independence assumptionsamong the variables
• Cycles not allowed - Edges usuallyhave causal interpretations
• Specifies a compact representationof joint distribution over the vari-ables given by
P (X1, . . . , Xn) =n∏
i=1
Pi(Xi | Pa(Xi))
wherePa(Xi) = Parents of NodeXi
in the network
• Pi → Conditional Probability Dis-tribution (CPD)of Xi
Title Page
Contents
JJ II
J I
Page 8 of 39
Go Back
Full Screen
Close
Quit
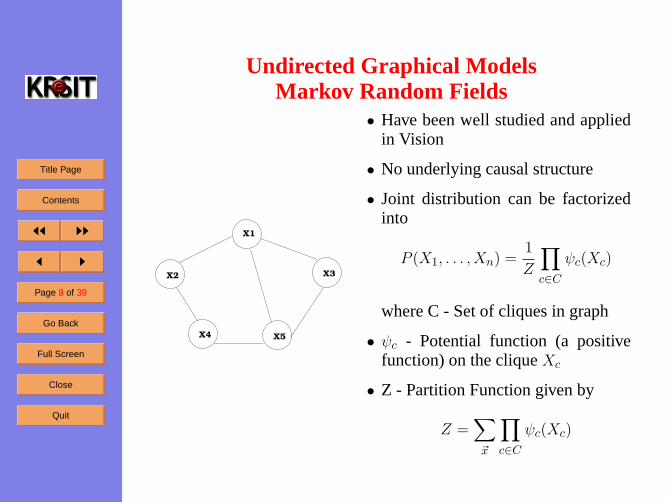
Undirected Graphical ModelsMarkov Random Fields
X4 X5
X3X2
X1
• Have been well studied and appliedin Vision
• No underlying causal structure
• Joint distribution can be factorizedinto
P (X1, . . . , Xn) =1
Z
∏c∈C
ψc(Xc)
where C - Set of cliques in graph
• ψc - Potential function (a positivefunction) on the cliqueXc
• Z - Partition Function given by
Z =∑~x
∏c∈C
ψc(Xc)
Title Page
Contents
JJ II
J I
Page 9 of 39
Go Back
Full Screen
Close
Quit
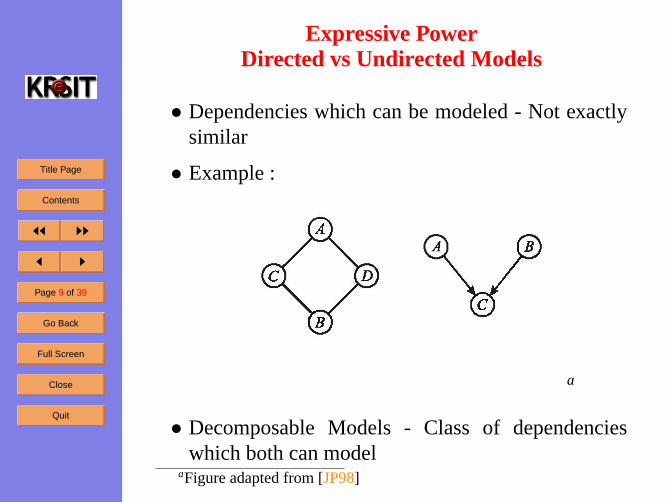
Expressive PowerDirected vs Undirected Models
• Dependencies which can be modeled - Not exactlysimilar
• Example :
a
• Decomposable Models - Class of dependencieswhich both can model
aFigure adapted from [JP98]
Title Page
Contents
JJ II
J I
Page 10 of 39
Go Back
Full Screen
Close
Quit
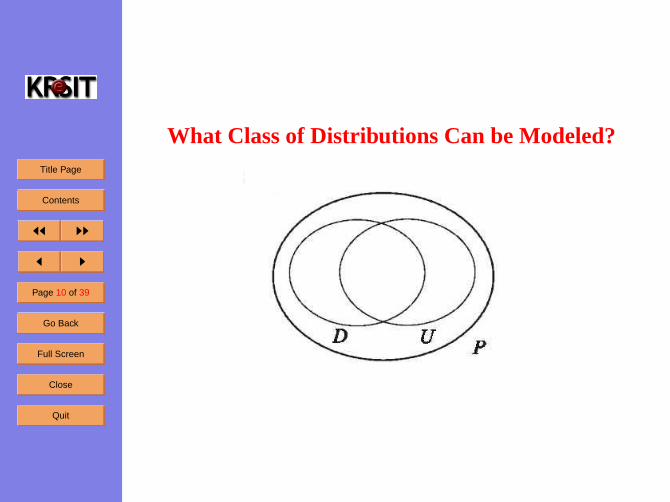
What Class of Distributions Can be Modeled?
Title Page
Contents
JJ II
J I
Page 11 of 39
Go Back
Full Screen
Close
Quit
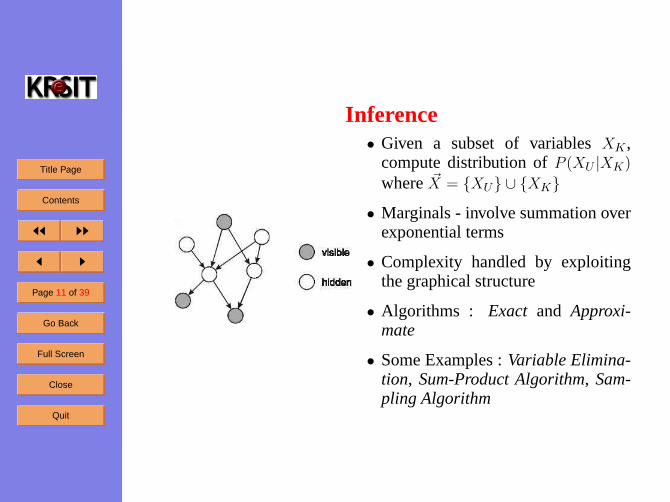
Inference• Given a subset of variablesXK ,
compute distribution ofP (XU |XK)
where ~X = {XU} ∪ {XK}
• Marginals - involve summation overexponential terms
• Complexity handled by exploitingthe graphical structure
• Algorithms : Exact and Approxi-mate
• Some Examples :Variable Elimina-tion, Sum-Product Algorithm, Sam-pling Algorithm
Title Page
Contents
JJ II
J I
Page 12 of 39
Go Back
Full Screen
Close
Quit
Learning
• Estimating graphical structureG and parametersfrom data
• Standard ML estimates used when variables in themodel are fullyObservable
• MRFs use Iterative Algorithms for parameter esti-mation
• Structure Learning relatively hard

Title Page
Contents
JJ II
J I
Page 13 of 39
Go Back
Full Screen
Close
Quit
Applications
Title Page
Contents
JJ II
J I
Page 14 of 39
Go Back
Full Screen
Close
Quit
Bio-informaticsGene Expression Analysis
• Gene Expression Analysis - Introduction
• Standard Techniques - Clustering and Bayesian Net-works
• Probabilistic Relational Models (PRMs)
• Integrating Additional Information into PRM
• Learning PRMs from Data
Title Page
Contents
JJ II
J I
Page 15 of 39
Go Back
Full Screen
Close
Quit
DNA - The Blueprint of Life!
• DNA - Deoxyribo Nucleic Acid
• Double Helix Structure
• Each Strand - Sequence ofNucleotides{Adenine(A),Guanine (G),Cytosine (C), Thymine (T)}
• Complementary Strands - A↔ G, C↔ T
• Gene- Portions of DNA that code for Proteins orlarge biomolecules
Title Page
Contents
JJ II
J I
Page 16 of 39
Go Back
Full Screen
Close
Quit
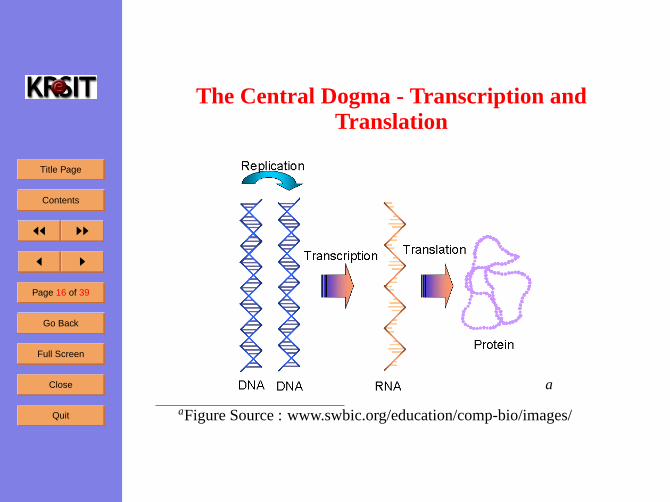
The Central Dogma - Transcription andTranslation
a
aFigure Source : www.swbic.org/education/comp-bio/images/
Title Page
Contents
JJ II
J I
Page 17 of 39
Go Back
Full Screen
Close
Quit
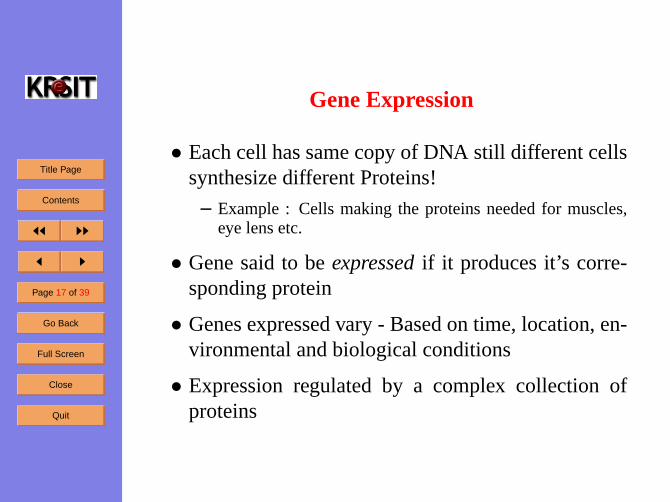
Gene Expression
• Each cell has same copy of DNA still different cellssynthesize different Proteins!
– Example : Cells making the proteins needed for muscles,eye lens etc.
• Gene said to beexpressedif it produces it’s corre-sponding protein
• Genes expressed vary - Based on time, location, en-vironmental and biological conditions
• Expression regulated by a complex collection ofproteins
Title Page
Contents
JJ II
J I
Page 18 of 39
Go Back
Full Screen
Close
Quit
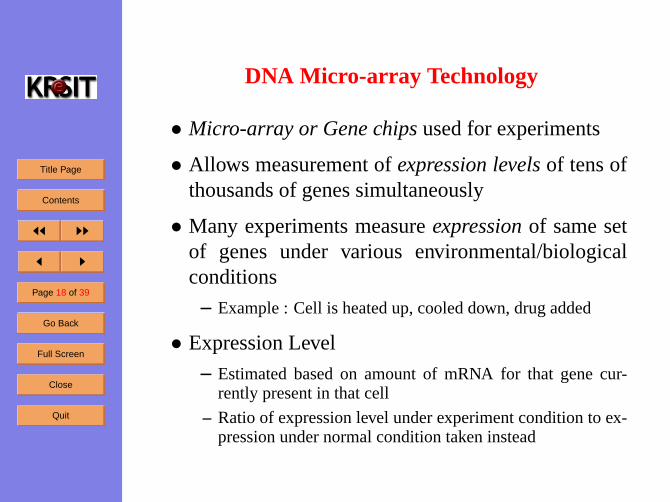
DNA Micro-array Technology
• Micro-array or Gene chipsused for experiments
• Allows measurement ofexpression levelsof tens ofthousands of genes simultaneously
• Many experiments measureexpressionof same setof genes under various environmental/biologicalconditions
– Example : Cell is heated up, cooled down, drug added
• Expression Level
– Estimated based on amount of mRNA for that gene cur-rently present in that cell
– Ratio of expression level under experiment condition to ex-pression under normal condition taken instead
Title Page
Contents
JJ II
J I
Page 19 of 39
Go Back
Full Screen
Close
Quit
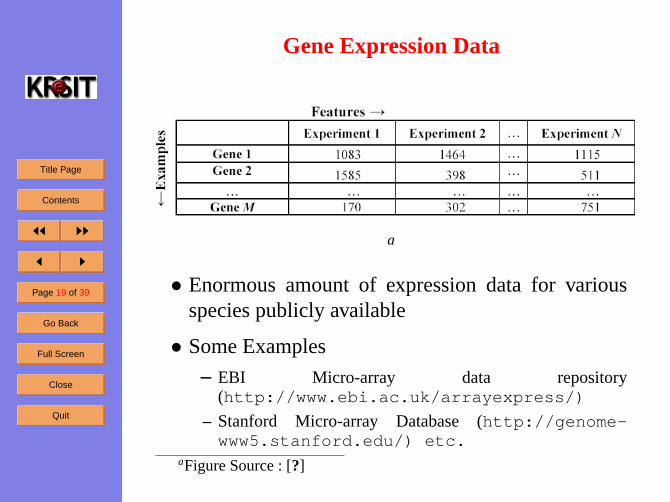
Gene Expression Data
a
• Enormous amount of expression data for variousspecies publicly available
• Some Examples
– EBI Micro-array data repository(http://www.ebi.ac.uk/arrayexpress/)
– Stanford Micro-array Database (http://genome-www5.stanford.edu/) etc.
aFigure Source : [?]
Title Page
Contents
JJ II
J I
Page 20 of 39
Go Back
Full Screen
Close
Quit
The Problem - Drowning in Data!Where is Information?
• Enormous amount of data
– EBI data repository has grown 100-fold just in a year!
• Difficult for humans to comprehend, detect patterns
• Biological experiments - Costly and Time consum-ing
• Machine Learning/Data Mining techniques to therescue
– Allow learning of models which provide useful insight intothe biological processes
– Reduce the number of biological experiments needed
Title Page
Contents
JJ II
J I
Page 21 of 39
Go Back
Full Screen
Close
Quit
Gene Expression Analysis - Approaches
• Aim
– To identify co-regulated genes
– To gain biological insight into gene regulatorymechanisms
• Approaches
– Clustering
– Bayesian Networks
– Probabilistic Relational Models (PRMs)
• Focus of the Presentation
– Probabilistic Models for Gene Expression usingPRMs
Title Page
Contents
JJ II
J I
Page 22 of 39
Go Back
Full Screen
Close
Quit
Clustering
• Two-Side Clustering
– Genes and Experiments partitioned into clustersG1, . . . , Gk
andE1, . . . , El simultaneously
– Summarizes data into groups ofk × l
– Assumption - Expression governed by a distribution specificto each combination of Gene/Experiment clusters
• Clustering Techniques - Problems
– Similarity based on all the measurements. What if similarityexists only over a subset of measurements?
– Difficult to integrate additional information - Gene Annota-tion, Cell-Type/Strain used, Gene Promoters
Title Page
Contents
JJ II
J I
Page 23 of 39
Go Back
Full Screen
Close
Quit
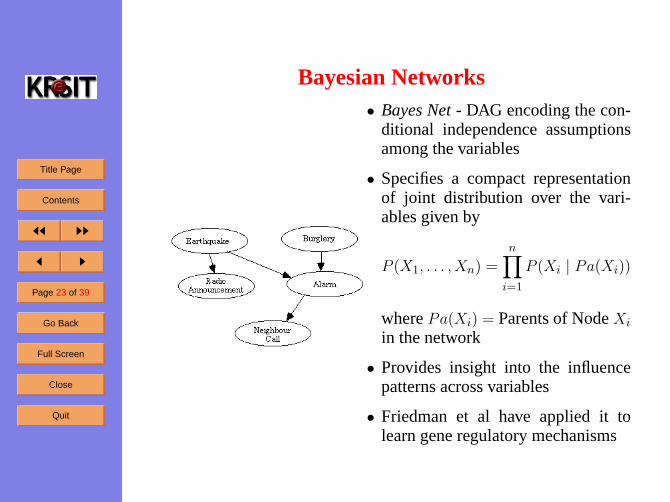
Bayesian Networks• Bayes Net- DAG encoding the con-
ditional independence assumptionsamong the variables
• Specifies a compact representationof joint distribution over the vari-ables given by
P (X1, . . . , Xn) =n∏
i=1
P (Xi | Pa(Xi))
wherePa(Xi) = Parents of NodeXi
in the network
• Provides insight into the influencepatterns across variables
• Friedman et al have applied it tolearn gene regulatory mechanisms
Title Page
Contents
JJ II
J I
Page 24 of 39
Go Back
Full Screen
Close
Quit
Bayesian Networks (Contd. . . )Modeling Relational Data
• Relational Data- Data spread across multiple tables
• Provides valuable additional information for learn-ing models
– Example : DNA Sequence Information, Gene Annotations
• Bayes Nets not suitable for modeling
– Bayes Net Learning Algorithms - Attribute Based
– Assume all the data to be present in a single table
– Make sample independence assumption
• Solution : Why not “flatten” the data?
– Will make the samples dependent
– Can’t be used to reach conclusions based on relational de-pendencies
Title Page
Contents
JJ II
J I
Page 25 of 39
Go Back
Full Screen
Close
Quit
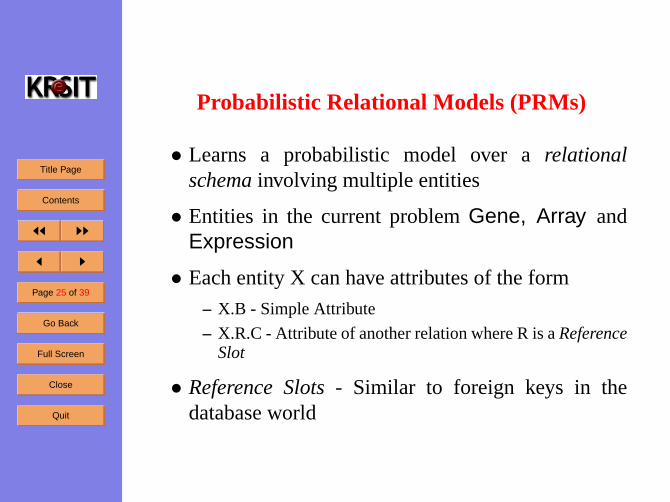
Probabilistic Relational Models (PRMs)
• Learns a probabilistic model over arelationalschemainvolving multiple entities
• Entities in the current problemGene, Array andExpression
• Each entity X can have attributes of the form
– X.B - Simple Attribute
– X.R.C - Attribute of another relation where R is aReferenceSlot
• Reference Slots- Similar to foreign keys in thedatabase world
Title Page
Contents
JJ II
J I
Page 26 of 39
Go Back
Full Screen
Close
Quit
PRMs (Contd. . . )
• Attributes of objects - Random Variables
• Given the above, a PRMΠ is defined by
– A class-level dependency structureS
– The parameter setθS for the resultantCondi-tional Probability Distribution (CPD)
• The PRMΠ is only a class-level “template” - Getsinstantiated for each object
Title Page
Contents
JJ II
J I
Page 27 of 39
Go Back
Full Screen
Close
Quit
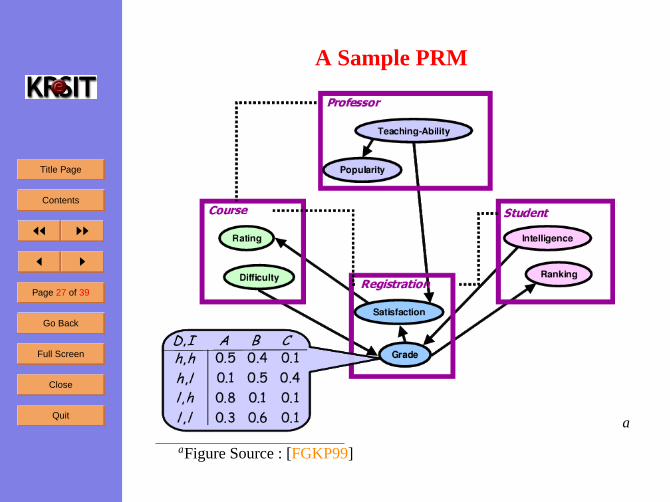
A Sample PRM
a
aFigure Source : [FGKP99]
Title Page
Contents
JJ II
J I
Page 28 of 39
Go Back
Full Screen
Close
Quit
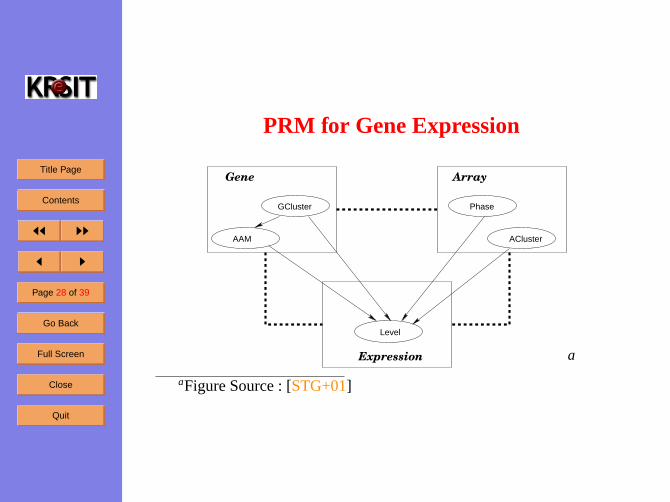
PRM for Gene Expression
Gene Array
GCluster
Expression
AAM
Phase
ACluster
Level
a
aFigure Source : [STG+01]
Title Page
Contents
JJ II
J I
Page 29 of 39
Go Back
Full Screen
Close
Quit
Inferencing in PRMs
• A Relational Skeletonσ is an instantiation of thisschema
• For Example : 1000 gene objects, 100 array objectsand 100,000 objects expression objects
• Relational skeletonσ completely specifies the val-ues for the reference slots
• ObjectiveGiven σ, with observed evidence regarding somevariables, update the probabilistic distribution overthe rest of the variables
Title Page
Contents
JJ II
J I
Page 30 of 39
Go Back
Full Screen
Close
Quit
Inferencing in PRMs (Contd. . . )
• Given a relational skeletonσ, a PRM induces aBayesian Networkover all the random variables
• Parents andCPDs of Bayes Net - Obtained fromclass-level PRM
• Bayesian Network Inferencing Algorithms are thenused forinferencein the resultant network
Title Page
Contents
JJ II
J I
Page 31 of 39
Go Back
Full Screen
Close
Quit
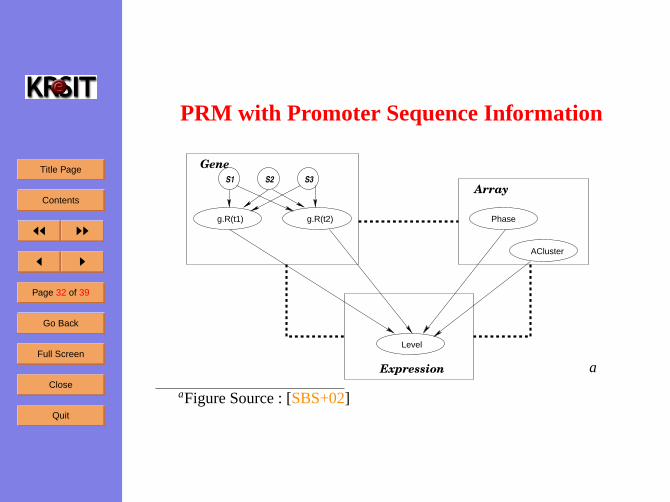
Integrating Additional Sources of DataDNA Sequence Information
• Transcription Factors (TFs)- Proteins that bindto specific DNA sequence in the promoter regionknown asbinding sites
• TFs encourage or repress the start of transcription
• Why is sequence information important?
– Help in identifying TFbinding sites
– Two genes with similar expression profiles -mostly likely to be controlled by same TFs
• New features added
– Base pairs of Promoter Sequence
– Regulatesvariableg.R(t) for each TFt
Title Page
Contents
JJ II
J I
Page 32 of 39
Go Back
Full Screen
Close
Quit
PRM with Promoter Sequence Information
Array
g.R(t2)
Expression
Phase
ACluster
Level
Gene
g.R(t1)
S1 S2 S3
a
aFigure Source : [SBS+02]
Title Page
Contents
JJ II
J I
Page 33 of 39
Go Back
Full Screen
Close
Quit
Learning the Models
• CPD Parameter Estimation
– Expression.Level modeled using a Gaussian
– CPD divides the expression values intok × l groups
– Parameter set constitutes the mean and variance of eachgroup
• CPD Structure Learning
– Scoring Function - measure of “goodness” of a structure rel-ative to data
– Search Algorithm - finding the structure with highest score
– Bayesian Score as scoring function- Posterior of structuregiven dataP (S | D)
– Greedy local structure search used for search algorithm
Title Page
Contents
JJ II
J I
Page 34 of 39
Go Back
Full Screen
Close
Quit
PRMs for Gene Expression : Conclusion
• Templates for directed graphical models over rela-tional data
• PRMs can be applied to relational data spread acrossmultiple tables
• Capable of learningunified modelsintegrating se-quence information, expression data and annotationdata
• Can easily accommodate additional information re-lated to domain
Title Page
Contents
JJ II
J I
Page 35 of 39
Go Back
Full Screen
Close
Quit
Web MiningCollective Web Page Classification [CDI98]
• Class of neighbouring pages (in Web Graph) usuallycorrelated.
• Construct a directed graphical model based on theweb graph.
– Nodes - Random Variables for the category of each page
• Given an assignment of categories for some nodes :
– Run inferencingon the above graphical model
– Find theMost Probable Explanationfor the rest
Title Page
Contents
JJ II
J I
Page 36 of 39
Go Back
Full Screen
Close
Quit
Summary
• Graphical Models - A natural formalism for model-ing multiple correlated random variables
• Allows integration of domain knowledge in the formof dependency structures
• Techniques especially useful when data spreadacross multiple tables
• Allows easy integration of new additional informa-tion

Title Page
Contents
JJ II
J I
Page 37 of 39
Go Back
Full Screen
Close
Quit
Thanks!
Title Page
Contents
JJ II
J I
Page 38 of 39
Go Back
Full Screen
Close
Quit
References
[NLD99] Nir Friedman, Lise Getoor, Daphne Koller and Avi Pfeffer, Learning Proba-bilistic Relational Models, In Proceedings of IJCAI 1999, pages 1300-1309, 1999.
[CDI98] Soumen Chakrabarti, Byron E. Dom and Piotr Indyk , Enhanced hypertext cat-egorization using hyperlinks , In Proceedings of SIGMOD-98, ACM InternationalConference on Management of Data , pages 307–318, 1998.
[Chi02] David Maxwell Chickering, The WinMine Toolkit, Microsoft, MSR-TR-2002-103, 2002, Redmond, WA.
[Col02] Michael Collins, Discriminative Training Methods for Hidden Markov Models:Theory and Experiments with Perceptron Algorithms, In the proceedings of EMNLP2002, pages 1–8, 2002.
[Fri00] Friedman N., Linial, Nachman I. and Pe’er D., Using Bayesian Networks to An-alyze Expression Data, Journal of Computational Biology, vol 7, pages 601-620,2000.
[GS04] Shantanu Godbole and Sunita Sarawagi, Discriminative Methods for Multi-Labeled Classification, In Proceedings of PAKDD 2004, 2004.
[LG03] Qing Lu and Lise Getoor, Link-based Classification, In Proceedings of ICML2003, page 496, August 2003.
[Mur01] Kevin P. Murphy, The Bayes Net Toolbox for MATLAB, Journal of ComputingScience and Statistics, vol. 33, 2001.
[FGKP99] Nir Friedman, Lise Getoor, Daphne Koller and Avi Pfeffer , Learning Proba-bilistic Relational Models , IJCAI , 1300-1309 , 1999
Title Page
Contents
JJ II
J I
Page 39 of 39
Go Back
Full Screen
Close
Quit
[STG+01] E. Segal, B. Taskar, A. Gasch, N. Friedman and D. Koller , Rich probabilisticmodels for gene expression , Bioinformatics , 17 , s243-52 , 2001
[SBS+02] E. Segal, Y. Barash, I. Simon, N. Friechnan and D. Koller , From promotersequence to expression: A probabilistic framework , RECOMB , 2002
[RN95] S. Russel and P. Norvig, Artificial Intelligence: A Modern Approach, Prentice-Hall, 1995.
[MWJ99] Kevin P. Murphy, Yair Weiss and Michael I. Jordan, Loopy belief propagationfor approximate inference : An emperical Study. In Proceedings of UAI 99, Pages467-475, 1999.
[JP98] Pearl, J., Probabilistic Reasoning in Intelligent Systems: Networks of PlausibleInference, Morgan Kaufmann Publishers, 1988.
27 6, 35 6 27 28 32 4, 7 9