Embed Size (px)
Citation preview

GRAPHS FOR THEDIRECT SHEAR DESIGNOF PRESTRESSED CONCRETEMEMBERS
Francis J. Jacques, P. E.Prestressed Concrete of Colorado, Inc.Denver, Colorado
A complete shear analysis for aprestressed concrete member issomewhat lengthy and time-consum-ing when the requirements of Sec-tion 2610 of the 1963 ACI BuildingCode are rigorously applied. Twoapproximate, shortcut methods havebeen developed for shear analysis' 2.Both of these methods, however, stillrequire a considerable amount ofauxiliary calculation. Also, both arebased on the assumption that themaximum bottom tension under fullsuperimposed load is 6 \/.
Recently, and particularly in ourlocal area, the use of partial pre-stressing (which utilizes higher bot-tom tensions) has been gaining everwider acceptance. Flexural designunder partial prestress criteria hasbeen easily handled with the designaids discussed in Reference 3. In thecase of shear, however, it has almostalways been necessary to preparecomplete longhand calculations.
To simplify this calculation, weundertook the development of agraphical design aid that would per-mit direct shear design for standardprestressed concrete members. Thiseffort has resulted in the develop-
ment of two separate graphical sheardesign methods. The first methodconsists of a single graph that per-mits direct shear design when bot-tom tensions are held to a fixed val-ue. The second method consists of aset of graphs, one graph for each su-perimposed load studied, that per-mits direct shear design when bot-tom tensions are allowed to vary.
These two graphical shear designmethods have been coupled withtwo similar graphical flexural designmethods to form two complete de-sign systems for standard prestressedconcrete members.
The flexural design method forworking stress design and ultimatestrength design was previously re-ported (3 > and frequent reference willbe made to this paper.
All work was programmed for aBurroughs B5500 computer, availa-ble at Denver Research Institute'sComputer Center at the Universityof Denver. An off-line CALCOMPplotter drew the actual curves andlabeled the graphs from data com-piled on magnetic tape. All program-ming was prepared by Mr. LeonardRice, a local engineering consultant.
14 PCI Journal

This article presents a practical design aid for standard prestressedconcrete members that permits an exact and completegraphical shear design for any uniformly loaded simple span.The graphs outline visually the shear steel required by the ACIBuilding Code shear steel equations. The computer programdeveloped to execute the calculations and draw thegraphs is general and can be applied to any prestressed member.
DESCRIPTION
The shear curves for both graphi-cal design methods are generated byactual computer printout of a largenumber of solutions of assignedequations in an orderly manner thatproduces a usable and practical de-sign aid. The two types of shear de-sign graphs are:
1. DESIGN SYSTEM I, ShearGrapis—Fixed Bottom Tension.This consists of a single graphfor each precast section andpermits direct shear design forvariable superimposed loading(WSL) when the final bottomtension in the flexural designhas been fixed (see Fig. 4 for atypical graph). This system isthe more compact of the twoand is designed to be usedwhen it is desirable to design toone assigned bottom tension.
2. DESIGN SYSTEM II, ShearGraphs—Variable Bottom Ten-sion. This consists of sets ofgraphs that provide for directshear design for a series ofWSL's when partial prestress-ing has been employed in theflexural design and final bottom
tension has been allowed tovary (see Fig. 5). This system isbest suited when it is desirableto design to a service criteriaestablished by performance atvarious stages of loading.
Both types of graphs permit com-plete straightforward shear designand allow the designer to determineat a glance the shear steel require-ments for V0,,, and Vd, and mini-mum shear steel for any span andloading.
FIXED CRITERIATo permit a direct, straightfor-
ward graphical design aid to be de-veloped, it was necessary to place alimit on the number of factorstreated as variables. Thus, it was de-cided to treat as fixed those condi-tions that are usually fixed within aprestressing plant. Examples of fixedcriteria in any run of the programare cross sections of members, typeof strand, method of depressingstrand, concrete strengths, and rein-forcing steel strengths. The programas written, however, is general andwill allow modification of any of thefixed criteria as conditions require.
Since these shear design aids are
August 1969 15
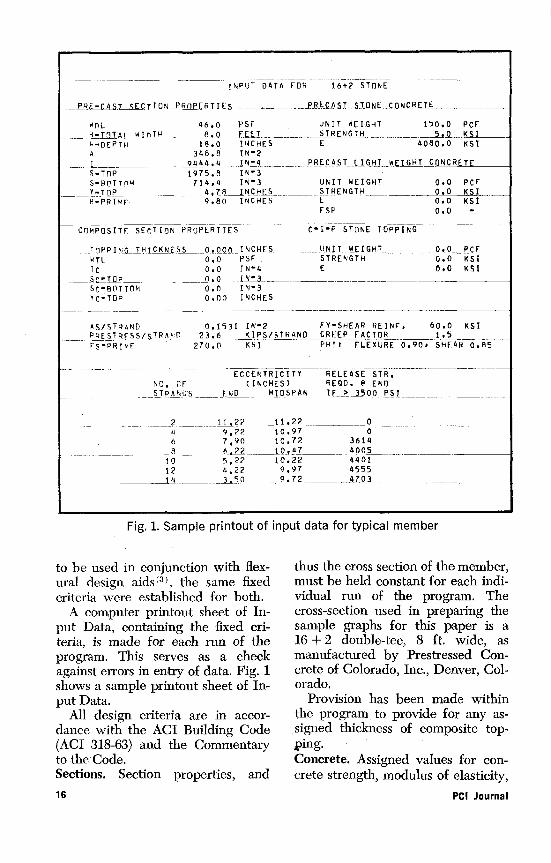
INPUT DATA FOR 16+2 STONE
PRk^A^.T C^ION. P IRTIE5_.- -PRECAST STONE CGNCRETt---------
WDL 46.0 PSF UNIT WEIGHT 150.0 PCF
R-TDTALWID T H -.. 8.0 FEET__-- -STRENGTH _ 5.0---.K
H-DEPTH 18.0 INCHES E 4060.0 KSIA 348,8 TN^2
-__9444.4 1N4 PRECAST LIGHTWEIGHT _CONCRETE
S-TOP 1975,8 IN-3
S-BOTTr M 714.4 IN-3 UNIT WEIGHT 0.0 PCFY-TOP _ ,78_ INCHES 0.0 K SI_6-PRIME 9.80 INCHES E 0.0 KSI
FSP 0.0 -
COMPOSITF SECTION PROPERTIES C-I-P STONE TOPPING
TDPPI- Ni0- THICKNESS 0.000 INCHES 0_x_0__ PCF
WTL 0.0 PSF STRENGTH 0.0 KSIIC 0,0 IN-4 E 0.0 KSI
SC7 LEP - _ .4-__ INSC-ROTTOM 0.0 IN-3
VT-TOP 0.00 INCHES
AS/STPAND 0.1531 IN-2PRESTRESS/STRAND 23,6 K IPS /STRAND
FS-PRIME 270.0 KSI
ECCENTRICITYNO. OF (INCHES)STRANDS END MIDSP.AN
FY-SHEAR REINF. 60,0 KSICREEP FACTOR 1.5PNI FLEXURE 0,90, SHEAR 0.85
-- - --- ------ ---- ---RELEASE STR.REGD. @ ENDIF >'3500 PSI
2 --122, -11.27 -- 0
u 9,22 10.97 06 7,90 10.72 3614
8 6-,?2 -.- 10,47 - 4 005
lO 5,22 10.22 4401
12 4,22 9.97 4555
Fig. 1. Sample printout of input data for typical member
to be used in conjunction with flex-ural design aids (3 ), the same fixedcriteria were established for both.
A computer printout sheet of In-put Data, containing the fixed cri-teria, is made for each run of theprogram. This serves as a checkagainst errors in entry of data. Fig. 1shows a sample printout sheet of In-put Data.
All design criteria are in accor-dance with the ACI Building Code(ACI 318-63) and the Commentaryto the Code.Sections. Section properties, and
thus the cross section of the member,must be held constant for each indi-vidual run of the program. Thecross-section used in preparing thesample graphs for this paper is a16 + 2 double-tee, 8 ft. wide, asmanufactured by Prestressed Con-crete of Colorado, Inc., Denver, Col-orado.
Provision has been made withinthe program to provide for any as-signed thickness of composite top-ping.Concrete. Assigned values for con-crete strength, modulus of elasticity,
16 PCI Journal
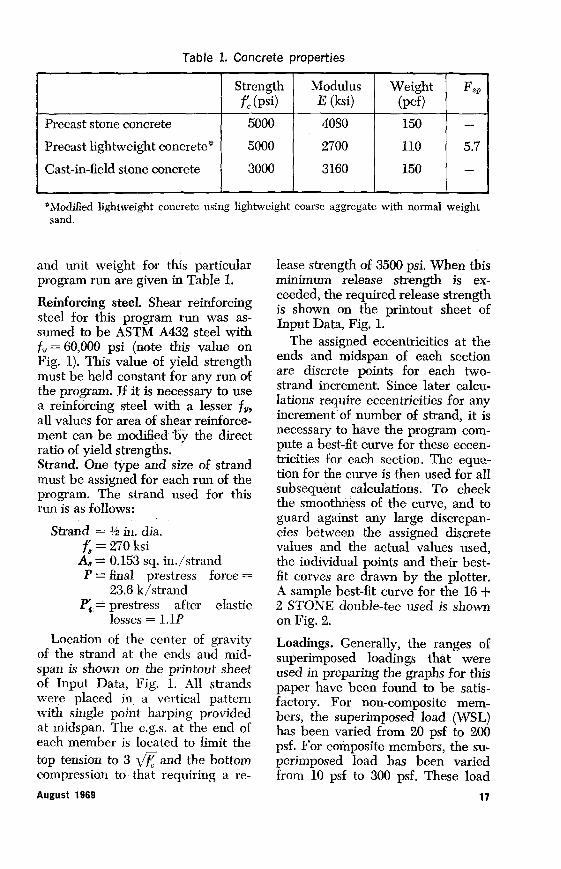
Table 1. Concrete properties
Strength Modulus Weight F85f, (psi) E (ksi) (pef)
Precast stone concrete 5000 4080 150 -
Precast lightweight concrete* 5000 2700 110 5.7
Cast-in-field stone concrete 3000 3160 150 —
*Modified lightweight concrete using lightweight coarse aggregate with normal weightsand.
and unit weight for this particularprogram run are given in Table 1.
Reinforcing steel. Shear reinforcingsteel for this program run was as-sumed to be ASTM A432 steel withf, = 60,000 psi (note this value onFig. 1). This value of yield strengthmust be held constant for any run ofthe program. If it is necessary to usea reinforcing steel with a lesser f,,all values for area of shear reinforce-ment can be modified by the directratio of yield strengths.Strand. One type and size of strandmust be assigned for each run of theprogram. The strand used for thisrun is as follows:
Strand = Y/z in. dia.f = 270 ksi
A8 = 0.153 sq. in. /strandP = final prestress force
23.6 k/strandP'{= prestress after elastic
losses = 1.1P
Location of the center of gravityof the strand at the ends and mid-span is shown on the printout sheetof Input Data, Fig. 1. All strandswere placed in a vertical patternwith single point harping providedat midspan. The c.g.s. at the end ofeach member is Iocated to Iimit thetop tension to 3 Vf and the bottomcompression to that requiring a re-
lease strength of 3500 psi. When thisminimum release strength is ex-ceeded, the required release strengthis shown on the printout sheet ofInput Data, Fig. 1.
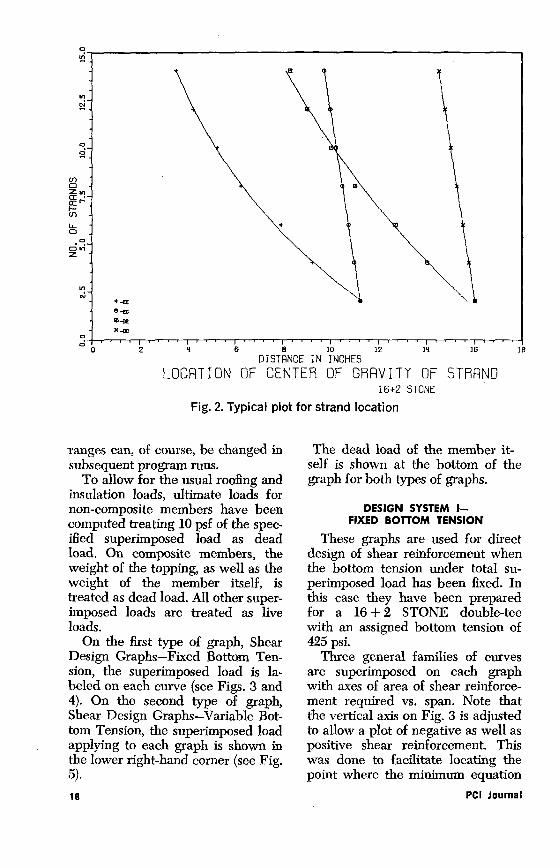
The assigned eccentricities at theends and midspan of each sectionare discrete points for each two-strand increment. Since later calcu-lations require eccentricities for anyincrement of number of strand, it isnecessary to have the program com-pute a best-fit curve for these eccen-tricities for each section. The equa-tion for the curve is then used for allsubsequent calculations. To checkthe smoothness of the curve, and toguard against any large discrepan-cies between the assigned discretevalues and the actual values used,the individual points and their best-fit curves are drawn by the plotter.A sample best-fit curve for the 16 +2 STONE double-tee used is shownon Fig. 2.
Loadings. Generally, the ranges ofsuperimposed loadings that wereused in preparing the graphs for thispaper have been found to be satis-factory. For non-composite mem-bers, the superimposed load (WSL)has been varied from 20 psf to 200psf. For composite members, the su-perimposed load has been variedfrom 10 psf to 300 psf. These load
August 1969 17
NC3ZQ
F-N
lLO
OZ
U,
InN
O
N
N
0N
0-if
x.
0 0 2 4 6 8 10 12 14 16 ]EOISTRNCE IN INCHES
LOCRTION OF CENTER OF GRRVITY OF STRAND16+2 STONE
Fig. 2. Typical plot for strand location
ranges can, of course, be changed insubsequent program runs.
To allow for the usual roofing andinsulation loads, ultimate loads fornon-composite members have beencomputed treating 10 psf of the spec-ified superimposed load as deadload. On composite members, theweight of the topping, as well as theweight of the member itself, istreated as dead load. All other super-imposed loads are treated as liveloads.
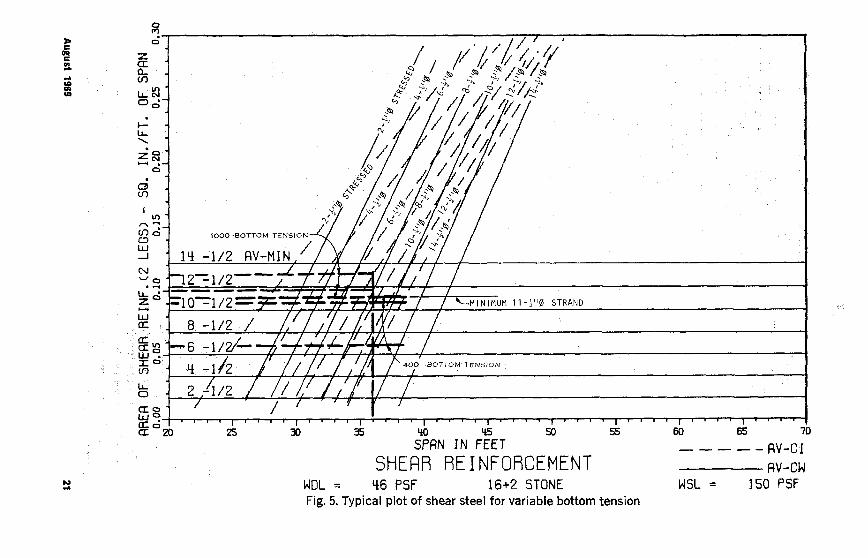
On the first type of graph, ShearDesign Graphs—Fixed Bottom Ten-sion, the superimposed load is la-beled on each curve (see Figs. 3 and4). On the second type of graph,Shear Design Graphs—Variable Bot-tom Tension, the superimposed loadapplying to each graph is shown inthe lower right-hand corner (see Fig.5).
The dead load of the member it-self is shown at the bottom of thegraph for both types of graphs.
DESIGN SYSTEM (-FIXED BOTTOM TENSION
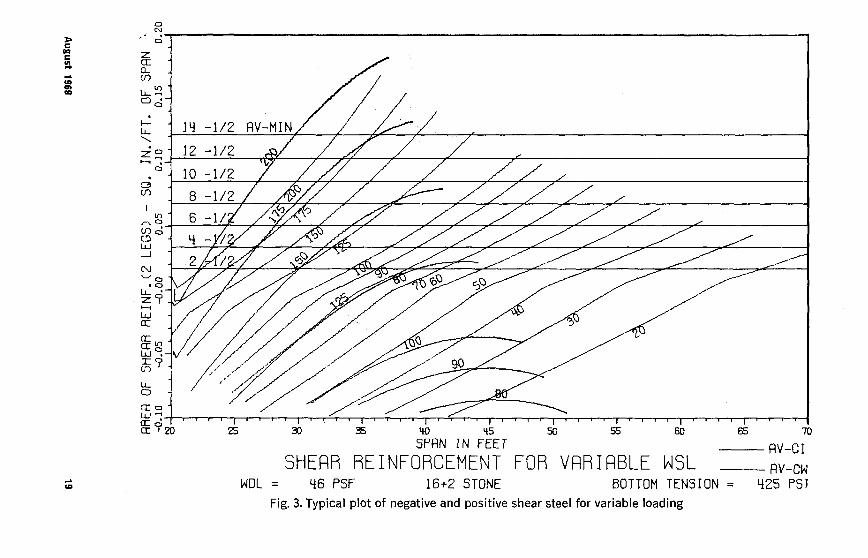
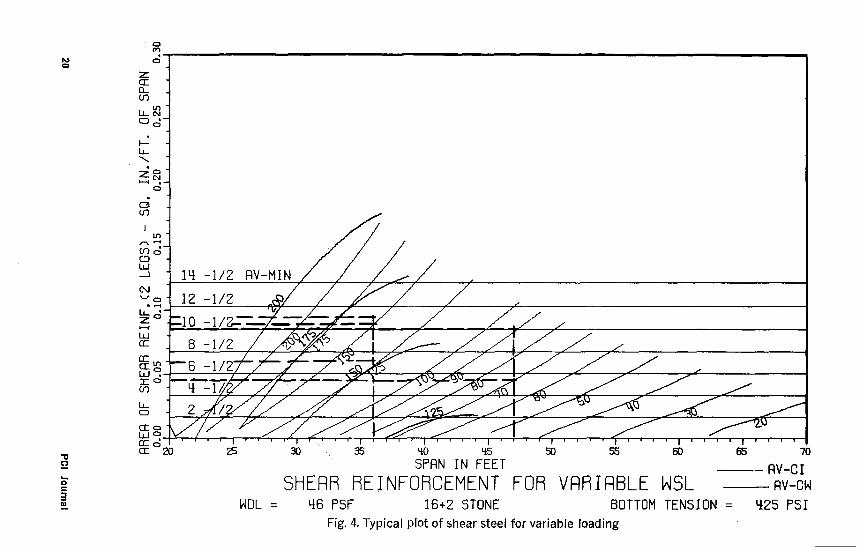
These graphs are used for directdesign of shear reinforcement whenthe bottom tension under total su-perimposed load has been fixed. Inthis case they have been preparedfor a 16+2 STONE double-teewith an assigned bottom tension of425 psi.
Three general families of curvesare superimposed on each graphwith axes of area of shear reinforce-ment required vs. span. Note thatthe vertical axis on Fig. 3 is adjustedto allow a plot of negative as well aspositive shear reinforcement. Thiswas done to facilitate locating thepoint where the minimum equation
18 PCI Journal
^^ O
zQ0
LI-
H0
In,-\QCr) owJN Q
oLL ^Z iLL)
a LnQW 0U)
QQ oW
Crcrt
CD
CD
co
14 -1/2 AV-M/IN
12 -1/2
10-1/2
8 -1/2
6-1/ ^
4-/
2 /
p 60c^0
^ v
/ g0
ao20 25 30 35 40 45 so 55 60 65 70
SPAN IN FEET RV-CISHEAR REINFORCEMENT FOR VARIABLE WSL RV-CW
WDL = 46 PSF 16+2 STONE BOTTOM TENSION = 425 PST
Fig. 3. Typical plot of negative and positive shear steel for variable loading
(I,
OO
Qa-U)
LL No
l-
Z NO
O
I)
OMI-LJNv O
w
c^wQo
._C)
U-o
Q oW
14 -1/2 RV-MIN
12 -1/2
-1/26 -1/2
1 cr`
2 /
0^ oQ 20 25 30 35 40 45 50 55 60 65 70
SPRN IN FEET Rv-CISHEAR REINFORCEMENT FOR VARIABLE WSL Rv-cw
WDL = 46 PSF 16+2 STONE BOTTOM TENSION = 425 PSIFig. 4. Typical plot of shear steel for variable loading
CDCDCO
0(Y)•
ct0
LL NO o
H-LL
.-IQ o
U,
C O
wJ
N
Z
W
w°
cO
11O
Q 00
f/f1I(/j ^
//JfP/c/I/&/44'/ /
1000 -BOTTOM TENSION / /j
14 -1/2 AV-MIN/ /
2 1 /2' /
= 10=1/2^ MINIMUM 11- "¢ STRAND
8 -1/2
/21 400 -BOTTOM' TENSION
2Y1/2
20 25 90 35 40 45 50 55 60 55 70SPAN IN FEET - - - .- - AV-CI
SHEAR REINFORCEMENT RV-CWWDL = 46 PSF 16+2 STONE WSL = 150 PSFFig. 5. Typical plot of shear steel for variable bottom tension

controls:Vim,=1.7b'd
or V, = 0.25 F8, b'dA definite break in all V,, curves forvarying superimposed load (blackcurves) can easily be seen near theline of zero required shear reinforce-ment. The graph on Fig. 4, how-ever, is used hereafter, since theconcept of negative shear reinforce-ment is needlessly confusing.
curves. The first family ofcurves, the solid red curves, showsthe shear steel required by V, atd/2 from the face of the support.Equations 26-13 and 26-10 of the1963 ACI Building Code have beenfollowed in computing these curves.
The width b' is taken as the sumof the stem widths of the two legs ofthe double-tee at midheight. A min-imum bearing length of 4 in. hasbeen assumed at each end. Thisbearing length is used to locate thecritical point for shear at d/2 fromthe face of the support and to com-pute the percentage of developmentof the prestressing in the strand. Atransfer length of 50 strand diame-ters has been assumed to fully devel-op the strand.
In Equation 26-10 the spacing, c,is assigned a constant value of 12 in.to obtain values of area of shear re-inforcement required (total area fortwo legs) in square inches per foot ofspan.
These curves indicate the shearreinforcement required at d/2 fromthe face of the support for variableWSL when the prestress force in themember has been designed to pro-duce the assigned final bottom ten-sion at the critical point. The criticalpoint is a short distance either sideof midspan where the tension in thebottom of the member is greatest. Itis located by an iterative methodequating the slope of the moment
curve to the slope of the deflectedstrand.
For a given WSL and with a fixedbottom tension at the critical point,prestress forces were assigned in halfstrand increments and correspond-ing span lengths were computed.These computed values were thenused to enter Equations 26-13 and26-10 to obtain the required shearreinforcement.
Since it was necessary to have val-ues of eccentricity at both the endand midspan of each section for anyincrement of number of strand, thebest-fit curves shown on Fig. 2 anddescribed above in the previous sec-tion were used to compute strandeccentricities.
The program is designed to useEquation 26-13A rather than 26-13when lightweight concrete is stud-ied.V, curves. The second family ofcurves, the solid black curves, showsthe shear steel required at the quar-ter-point of the span for V,;, byEquations 26-12 and 26-10. Thequarter-point was chosen as the crit-ical section in accordance with therecommendation in the Commentaryto the Code. Equation 26-12A is usedfor lightweight concrete.
The width b' and spacing s werethe same as for calculating V. Thesame procedure, as outlined for theV. , curves, was used in calculatingthe span of the member.
The computed values of V,j aretested against the minimum valuesof 1.7 b'd v for stone concrete and0.25 F, b'd \/f(( for lightweight con-crete, and the larger value is used.Minimum shear steel curves. Theseare the horizontal solid black lineslabeled 14-1/z AV-MIN, 12-11s, etc.They indicate the minimum area ofshear reinforcement required byEquation 26-11 for the amount of
22 PCI Journal

SLiJcWccC)
wI
U-a:
1/.^x..1W
•',
Q
C
C
IDIDID
C(V
C
MULTIPLICATION FACTORFOR INITIAL CAMBER
fei' Factor3500 1.04000 1.14500 1.25000 1.3
177 PSI TOP TENSION.,.I t`. 5y XO00 /
- 000 - -^
o ^
f r1 ^.
DE ECTION WSL'10 F
cn Fn 65 7(
w
'LV L7 ar w •,• ••• --SPAN IN FEET
CAMBER & RELEASE STRENGTH FOB VARIABLE NSLWOL = '-16 PSF 16+2 STONE BOTTOM TENSION = 425 PSI
Fig. 6. Working stress chart fora member without topping, variable loading
C,
0
tn
U,N
ON
O(nQWCcQ
D oZQ -HU)
In
0
20 25 30 35 40 45 so 55 60SPRN IN FEET
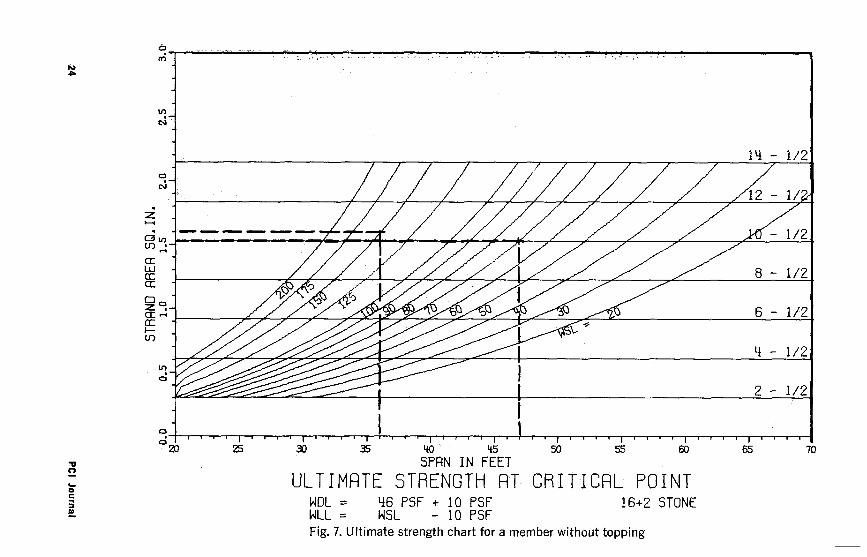
ULTIMATE STRENGTH AT CRITICAL POINTWDL = 46 PSF + 10 PSF 16+2 STONEWLL = WSL — 10 PSFFig. 7. Ultimate strength chart for a member without topping
65 70
MULTIPLICATION FACTORFOR INITIAL CAMBERfci' Factor
3500 1.04000 1.14500 1.25000 1.3
DEFLECTION WSL-15OPSF. /o'
177 ... PSI TOP TENSION, \ / /O1 ,^ y5O0
^^ L 1^000
// f / - g500 . '..
0M
as
isco
U)N
^ow NuJ
U
W^UiLL-c
MLJJm
Q oc-
z
0
I
^ Co
-l/2
ELECTION-10PSF 'ROOF G
20 25 30 35 40 45 50 55 6D 65 7D
SPPN IN FEET
CAMBEB9 BOTTOM TENSION & RELEASE STRENGTHSup
WDL = 46 PSF 16+2 STONE WSL = 150 PSF
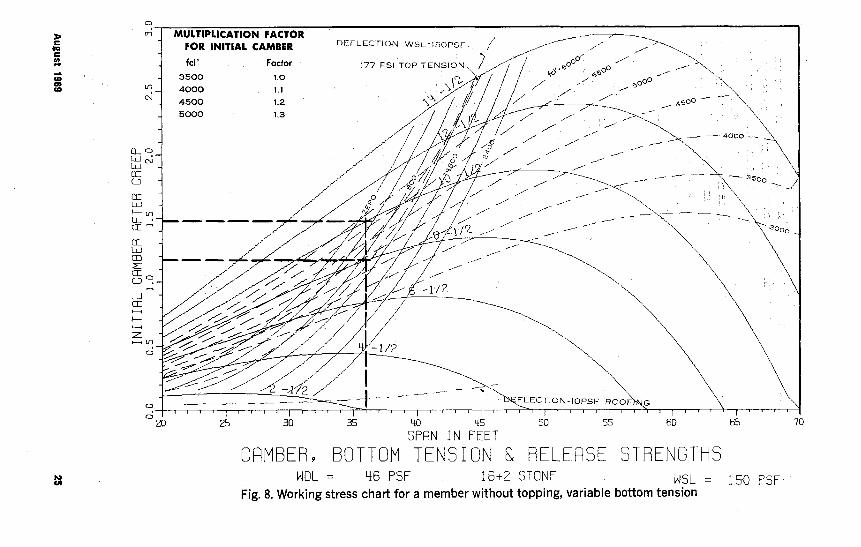
Fig. 8. Working stress chart for a member without topping, variable bottom tension

strand shown. This calculationshould be based on the strand re-quired by ultimate flexural strength.
The width b' used is as notedabove. Also, the spacings has beenassumed to be a constant 12 in. toobtain a value of required shear re-inforcement per foot of span.
DESIGN SYSTEM II—VARIABLE BOTTOM TENSION
These sets of graphs are used fordirect design of shear reinforcementwhen the bottom tension in the flex-ural design has been allowed tovary. (See Figure 5 for a typicalgraph.) The graph, Fig. 5, was pre-pared for a 16 + 2 STONE concretesection for a WSL = 150 psf.
Again, three general families ofcurves are superimposed on eachgraph with axes of area of shear re-inforcement required vs. span.V6 curves. These are the solid blackcurves going up and to the right thatare labeled 2-½" 0, STRESSED, 4-W'0, etc. These show the shear rein-forcement required at a point d/2from the face of the support for agiven number of stressed strands anda given WSL. In this case, WSL isequal to 150 psf. Equations 26-13and 26-10 have been used to com-pute the required shear reinforce-ment.
The width b', the spacing s, andthe minimum assumed bearinglength of 4 in. used to locate thepoint d/2 and to determine the per-centage of development of the pre-stressing, all were as describedabove for the V,,„ curves for Fixed
Bottom Tension graphs.For a given number of strand and
a known WSL, spans are assigned in1-ft. increments and a continuouscurve of required shear steel at d/2from the face of the support is com-puted and drawn. All calculationsare in accordance with Equations26-13 and 26-10, except Equation26-13A was used for lightweight con-crete.Va curves. These are the dashedblack curves going up and to theright. They show the area of shearreinforcement required at the quar-ter-point of the span for a givennumber of stressed strands and agiven WSL.
Again, Equations 26-12 and 26-10were followed for normal weightconcrete and Equation 26-12A wasused for lightweight concrete.
For a given number of strands anda known WSL, spans were assignedin 1-ft. increments and a curve of re-quired area of shear steel was ob-tained.
All other assumptions were as de-scribed above for Fixed Bottom. Ten-sion graphs, except the provisionthat the minimum value ofVa neednot be less than 1.7 b'd Vf for nor-mal weight concrete and 0.25 F8
b'd -\/f,, for lightweight concrete wasnot applied since the Commentaryto the Code specifically mentionsthat these minimum values are to beapplied only to those members hav-ing a normal amount of prestressing.Minimum shear steel curves. Theseare the same as described above forFixed Bottom Tension graphs.
DESIGN EXAMPLES
The examples, illustrating the use of both graphical design systems, are ofdesign procedure only and are not intended to be taken as examples ofrecommended design criteria.26 PCI Journal
Problem 1: Roof Member Design—Fixed Bottom Tension.Required: Complete flexural design for a 16 + 2 STONE concrete double-
tee spanning 47 ft. and carrying a superimposed load (WSL)of 70 psf.
Solution: Design System I.
WORKING STRESS DESIGN (see Fig. 6*)
Required prestressingstrand
Required releasestrength
Mult. factor for initialcamber
Corrected initialcamber
Defl. for basic WSL10 psf
Defl. for WSL = 70 psfNet camber
10-% in. dia. 270 K strand
4700 psi (interpolated)
1.24 (interpolated)
1.86 x 1.24 = 2.31 in. (up)
0.23 in.0.23x7 = 1.61 in. (down)
= 0.70 in. (up)
ULTIMATE STRENGTH DESIGN (see Fig. 7)
Area of strand required = 1.53 in. 2 or 10- 1/2 in. dia. 270 K strand
SHEAR DESIGN (see Fig. 4)
Area of shear reinforcement required (2 legs) for:V,1 @ '1a point
on span = 0.044 in.2V0 , @ d/2 from
support = noneMin. for 10-½ in.
dia. strand = 0.085 in. 2 (governs)
Note: Design System II could also be used to solve Problem 1 if theproper working stress graph and shear design graph could beincluded with this paper.
Problem 2: Roof Member Design—Variable Bottom Tension.
Required: Complete flexural design of a 16 + 2 STONE concrete double-tee spanning 36 ft. and carrying a superimposed load (WSL) of150 psf. Investigate bottom tensions of 400 psi and 1000 psiunder full superimposed load.
Solution: Design System II.
WORKING STRESS DESIGN (see Fig. 8)
*Note that this graph has not been discussed in either this article nor the article men-tioned in Reference 3. The WSL curves, however, are the same curves referred to as"Bottom Tension Curves" in Reference 3, The labeling has been reversed since the bot-tom tension is now being held as fixed and the WSL's have been varied.
August 1969 27
Bottom Tension Criteria400 psi 1000 psi
Req'd. prestressingstrand 10-1/z in. dia. strand 8- 1/z in. dia. strand
Final prestress req'd.(23.6 k/strand) 236 kips 189 kips
Req'd. release strength 5750 psi 4400 psiMult. factor for
critical camber 1.4 (estimated) 1.18 (interpolated)Initial camber from
graph 1.47 in. (up) 1.17 in. (up)Corrected initial
camber 2.06 in. (up) 1.38 in. (up)Deflection for WSL =
150 psf 1.17 in. 1.17 in.Net camber 0.89 in. (up) 0.21 in. (up)
ULTIMATE STRENGTH DESIGN (see Fig. 7)Area of strand required 1.60 in.' 1.60 in.2Total number of
strands required 11 -1/Z in dia. strand 11 - 1/z in. dia. strand
SHEAR DESIGN (see Fig. 5)Area of shear reinforcement required (2 legs) for:
V,ti @ '/4 pointon span 0.090 in.20.112 in.2
V,,„ @ d/2 fromsupport 0.056 in.20.100 in.2
Min. for 11 -1/2 in.dia. strand 0.095 in.20.095 in.2
The governing value of shear. reinforcement foreach design is underlined. -
Note: Design System I can be used for Problem 2 if the bottom ten-sion is adjusted to 425 psi. A solution by Design System I ismarked on. Figs. 6, 7, and 4. It is seen that the results arealmost identical to those obtained by Design System II, 400psi bottom tension.
SUMMARY formly loaded prestressed members.The shear graphs presented here- The first system is the more corn-
in, along with the working stress and pact of the two and provides forultimate , strength graphs presented working stress design, ultimatein detail in Reference 3, actually strength design and shear design,constitute two complete graphical with a single graph for each phase ofdesign systems for simple span uni- the design: This is made possible by28 PCI Journal
assigning a fixed maximum value tothe final allowable bottom tensionstress.
The second system has been de-veloped to allow the designer fullflexibility when employing partialprestressing; viz., allowing higherbottom tension stresses in order tocontrol camber, release strength, andcreep. This system requires sets ofgraphs (one graph for each WSLstudied) for working stress designand shear design, and a single graphfor ultimate strength design.
The advantage of Design SystemI is apparent. When using the rec-ommended loading range for non-composite members, a total of threegraphs can be used to record all ofthe design parameters that wouldrequire 27 graphs by Design SystemII. Also, it should be mentioned thatDesign System I can be modified toprovide for some partial prestressingdesign information by developingadditional graphs for bottom° ten-sions other than 6 Z/ f , . The inclu-sion of bottom tensions of zero and12 \/f^, as well as 6 \/f,,, would re-quire a total of only 7 graphs for De-sign System I, still considerably Iessthan the 27 required for Design Sys-tem II.
The advantage of Design SystemII is its total flexibility. It allowscomplete freedom of choice of bot-tom tensions, release strength andcamber for any loading stage andany span.
Design System II, with the sheardesign in tabular format, has been inuse in the Denver area for the lasttwo years and has had excellent ac-ceptance.
Needless to say, the savings in en-gineering time for both estimatingand preparation of final calculationshas been extensive—in excess of 50percent in most cases. The next stepis the extension of this system toprepare design graphs for beamsand girders.
REFERENCES1. Mast, Paul E., "Shortcuts for the Shear
Analysis of Standard Prestressed Con-crete Members," Journal of the Pre-stressed Concrete Institute, Volume 9,No. 5, October 1964, pp. 15-47.
2. Janney, Jack 11., and Elstner, Rich-ard C., ` Fundamentals of PrestressedConcrete Design," Prestressed ConcreteInstitute, 1964, pp. 48-59.
3. Jacques, Francis J. "Graphs for theDirect Design of Prestressed ConcreteMembers," Journal of the PrestressedConcrete Institute, Volume 12, No. 6,December 1967, pp. 61-76.
Discussion of this paper is invited. Please forward your discussion to PCI Headquartersby November 1 to permit publication in the February 1970 issue of the PCI JOURNAL.
August 1969 29