Embed Size (px)
DESCRIPTION
Graphs parabolas by calculating strategic points. Strategic points to calculate. Establish orientation of parabola Axis of Symmetry Vertex Roots y- intercept If you do not have 5 points substitute a value for x and calculate the corresponding y. Parabolas. y = ax 2 + bx + c - PowerPoint PPT Presentation
Citation preview
© Boardworks Ltd 20101 of 14
Graphs parabolas by Graphs parabolas by
calculating strategic pointscalculating strategic points
© Boardworks Ltd 20102 of 14
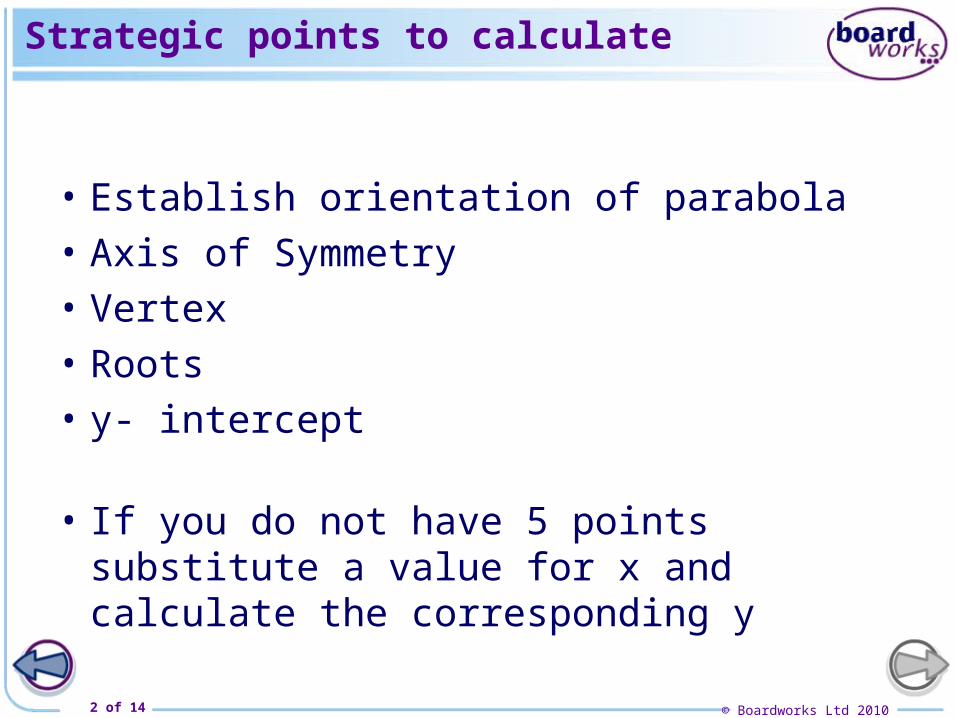
Strategic points to calculate
• Establish orientation of parabola
• Axis of Symmetry
• Vertex
• Roots
• y- intercept
• If you do not have 5 points substitute a value for x and calculate the corresponding y
© Boardworks Ltd 20103 of 14
Parabolas
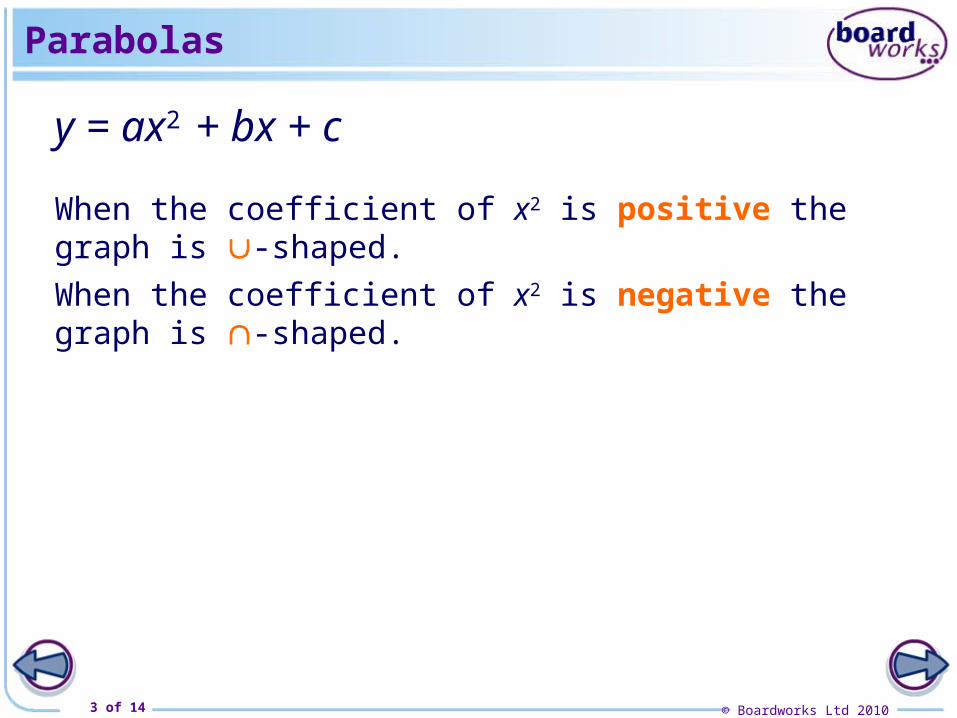
y = ax2 + bx + c
When the coefficient of x2 is positive the graph is -shaped.
When the coefficient of x2 is negative the graph is -shaped.
© Boardworks Ltd 20104 of 14
Graphs of the form y = ax2 + bx + c
© Boardworks Ltd 20105 of 14
Parabolas
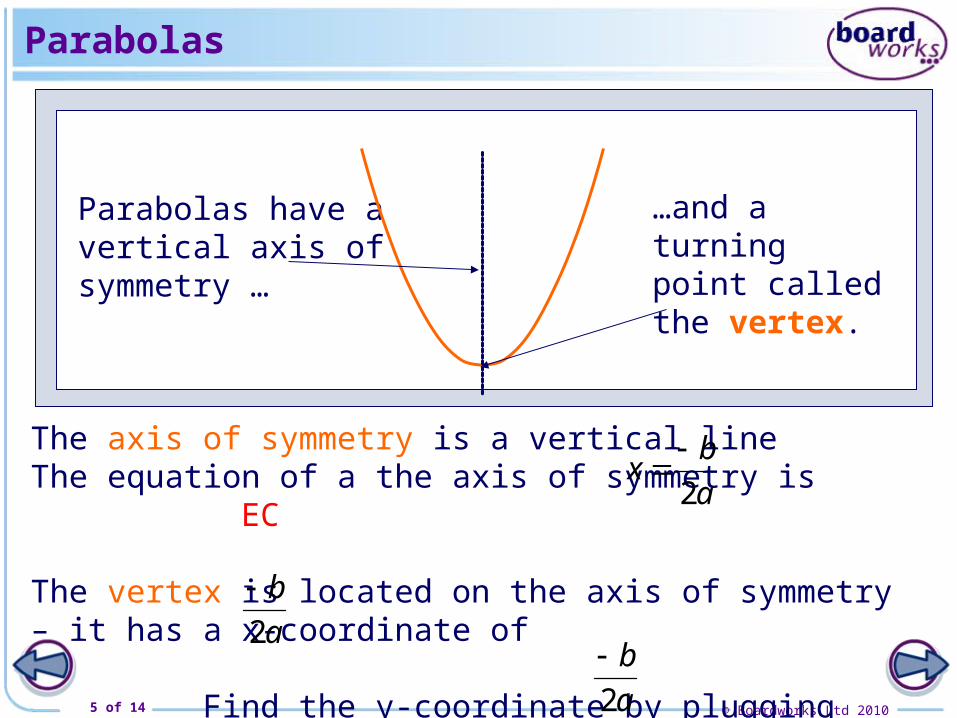
The axis of symmetry is a vertical lineThe equation of a the axis of symmetry is EC
The vertex is located on the axis of symmetry – it has a x-coordinate of Find the y-coordinate by plugging in for x
Parabolas have a vertical axis of symmetry …
…and a turning point called the vertex.
a
bx
2
a
b
2
a
b
2
© Boardworks Ltd 20106 of 14
Sketching graphs of quadratic functions
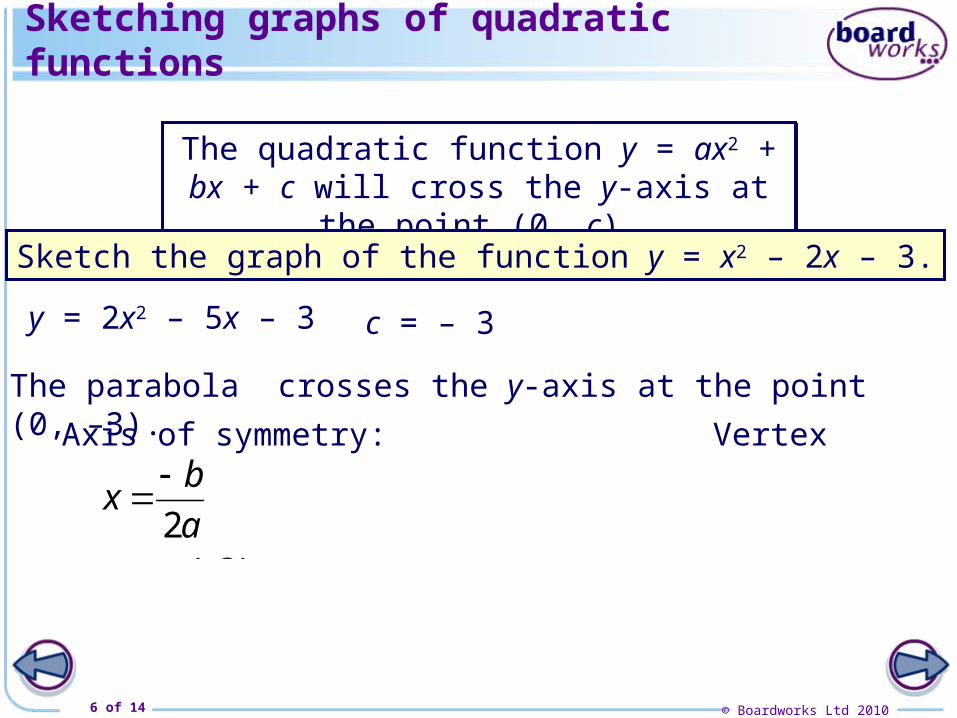
y = 2x2 – 5x – 3 c = – 3
The parabola crosses the y-axis at the point (0, –3).
The quadratic function y = ax2 + bx + c will cross the y-axis at the point (0, c).
The quadratic function y = ax2 + bx + c will cross the y-axis at the point (0, c).
Sketch the graph of the function y = x2 – 2x – 3.
Axis of symmetry: Vertex
1
)1(2
)2(2
x
x
a
bx
)4,1(
41
3)1(2)1(1 2
yandx
yandx
© Boardworks Ltd 20107 of 14
Sketching graphs of quadratic functions
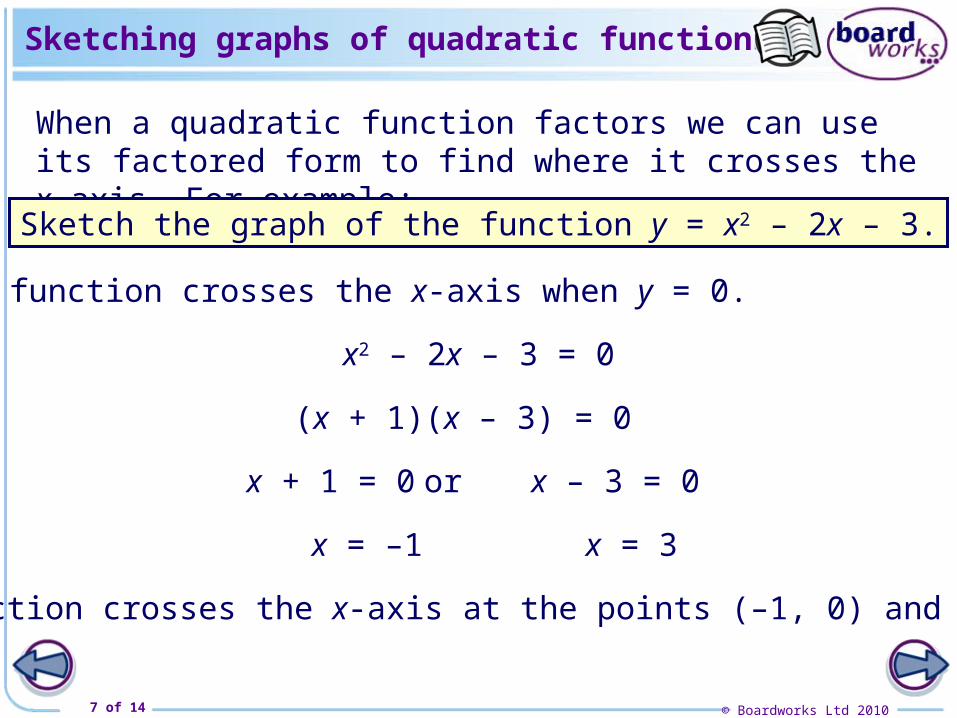
When a quadratic function factors we can use its factored form to find where it crosses the x-axis. For example:
Sketch the graph of the function y = x2 – 2x – 3.
The function crosses the x-axis when y = 0.
x2 – 2x – 3 = 0
(x + 1)(x – 3) = 0
x + 1 = 0 or x – 3 = 0
x = 3
The function crosses the x-axis at the points (–1, 0) and (3, 0).
x = –1
© Boardworks Ltd 20108 of 14
Sketching graphs of quadratic functions
0
y
x
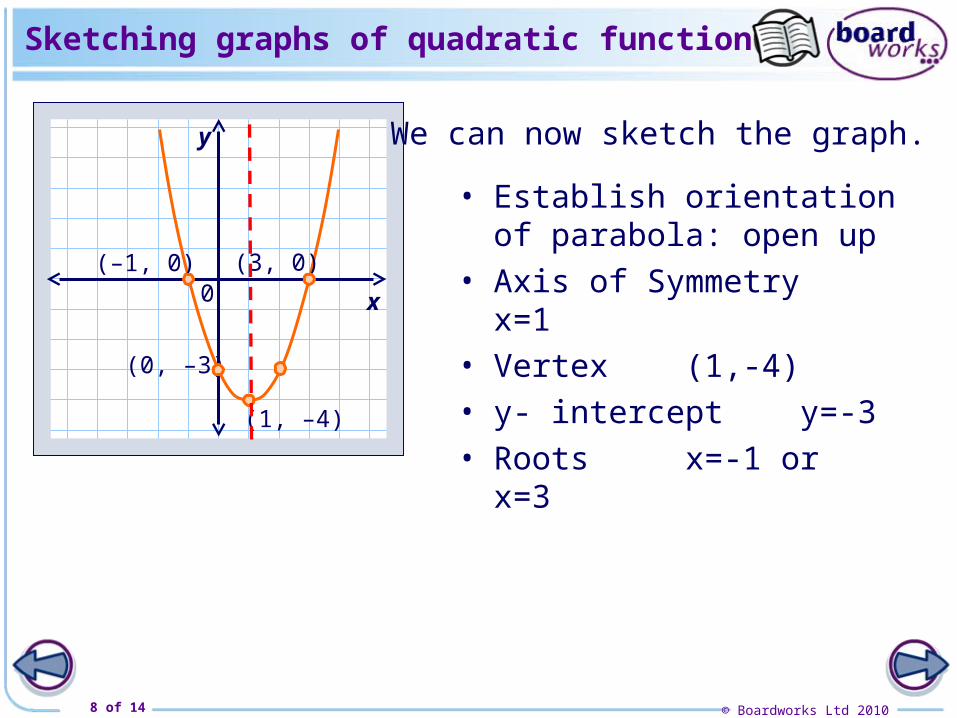
(–1, 0) (3, 0)
(0, –3)
(1, –4)
We can now sketch the graph.
• Establish orientation of parabola: open up
• Axis of Symmetry x=1• Vertex (1,-4)• y- intercept y=-3• Roots x=-1 or x=3
© Boardworks Ltd 20109 of 14
Sketching graphs of quadratic functions
When a quadratic function is written in the form y = a(x – p)(x – q), it is called
factored form and p and q are the roots of the quadratic function.
When a quadratic function is written in the form y = a(x – p)(x – q), it is called
factored form and p and q are the roots of the quadratic function.
In general:
© Boardworks Ltd 201010 of 14
Graphs of the form y = a(x – p)(x – q)
© Boardworks Ltd 201011 of 14
You try
• Find
a)Establish orientation of parabola
b)Axis of Symmetry
c)Vertex
d)Roots
e)y- intercept
Then graph the parabola
443 2 xxy