Embed Size (px)
Citation preview

The University of Toledo
R. Ellingson and M. Heben
Grating Spectrometers, Thermopile Detectors, and Lock-In Detection
September 11, 2012
focal length, f

Where are We, Where we are Going? (the next three weeks and beyond)
Igor (or comparable), LabView
Properties of the Sun
Understand Components in Optical Measurement System Physics
Role in experiments
Set Them Up! Bread Board Layout
Interface to Computer
Develop software
Characterize output of lamp/monochromator (three weeks)
Onward to reflection, transmission, absorption, QE, J/V, and a host of other, potentially interesting measurements!

Lab Due Dates, and other Info
Previously – Due on Monday before the lab, noon.
Rationale – wanted students to look at lab report
requirements/topics early, so we could help if needed
Now – Due on Tuesday, by Lab time
Think about your report and potential stumbling blocks
early! Interface with group members early!
Late policy will be strictly enforced!
Next Lab Report Due October 3 – 1st day after Fall Break
First Quiz on September 25

focal
length, f
Light Source Monochromator
Sample or
Detector
The “Set-Up”
A lens or two
Samples – semiconductor layers, transparent conductive layers, PV devices
Detectors – calibrated thermopile, photodiode
Tungsten –
halogen bulb

Spectral Products, CM110 1/8th meter monochromator

Czerny-Turner Monochromator
focal length, f

Diffraction
(not much different from
Interference)
multiple sources >> Diffraction
Few source (e.g. Young’s slits) >> Interference
"no-one has ever been able to define the
difference between interference and diffraction
satisfactorily. It is just a question of usage, and
there is no specific, important physical difference
between them.” – Richard Feynman
Occurs with all waves – Water, electromagnetic,
matter waves
Classical and Quantum mechanic descriptions
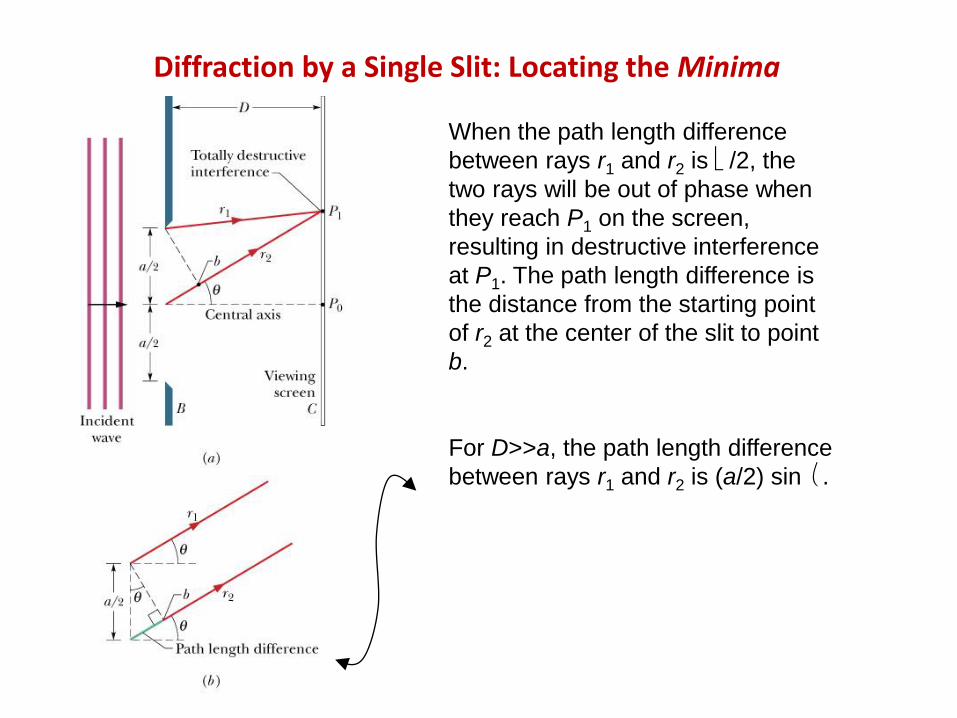
When the path length difference
between rays r1 and r2 is /2, the
two rays will be out of phase when
they reach P1 on the screen,
resulting in destructive interference
at P1. The path length difference is
the distance from the starting point
of r2 at the center of the slit to point
b.
For D>>a, the path length difference
between rays r1 and r2 is (a/2) sin .
Diffraction by a Single Slit: Locating the Minima

Single- and double-slit diffraction patterns
From Wikipedia

Device with N slits (rulings) can be used to separate different wavelengths of
light that are contained in a single beam. How does a diffraction grating affect
monochromatic light?
Diffraction Gratings (multiple “slits”
sin for 0,1,2 (maxima-lines)d m m
Can operate in transmission or reflection
Here we consider a single wavelength

Separates different wavelengths (colors) of light into distinct diffraction lines (this image
shows a transmission diffraction grating, while most spectrometers use reflective
diffraction gratings).
Grating Spectroscope (transmission diffraction grating)

Developing the Grating equation
http://gratings.newport.com/information/handbook/chapter2.asp#2.2
Reflective
diffraction
grating

By convention, angles of incidence and diffraction are measured from the grating normal to the beam. This is shown
by arrows in the diagrams. In both diagrams, the sign convention for angles is shown by the plus and minus symbols
located on either side of the grating normal. For either reflection or transmission gratings, the algebraic signs of two
angles differ if they are measured from opposite sides of the grating normal. Other sign conventions exist, so care
must be taken in calculations to ensure that results are self-consistent.
http://gratings.newport.com/information/handbook/chapter2.asp#2.2
A B
Different path lengths for different wave fronts at A and B
d
m is the diffraction order

mλ= d (sinα + sinβ),
Gmλ = sinα + sinβ
Different forms of the Grating equation
G = 1/d is the groove frequency or groove density
http://www.pariss-hyperspectral-imaging.com/GratingOrders_Movie/GratingOrders_Movie.html
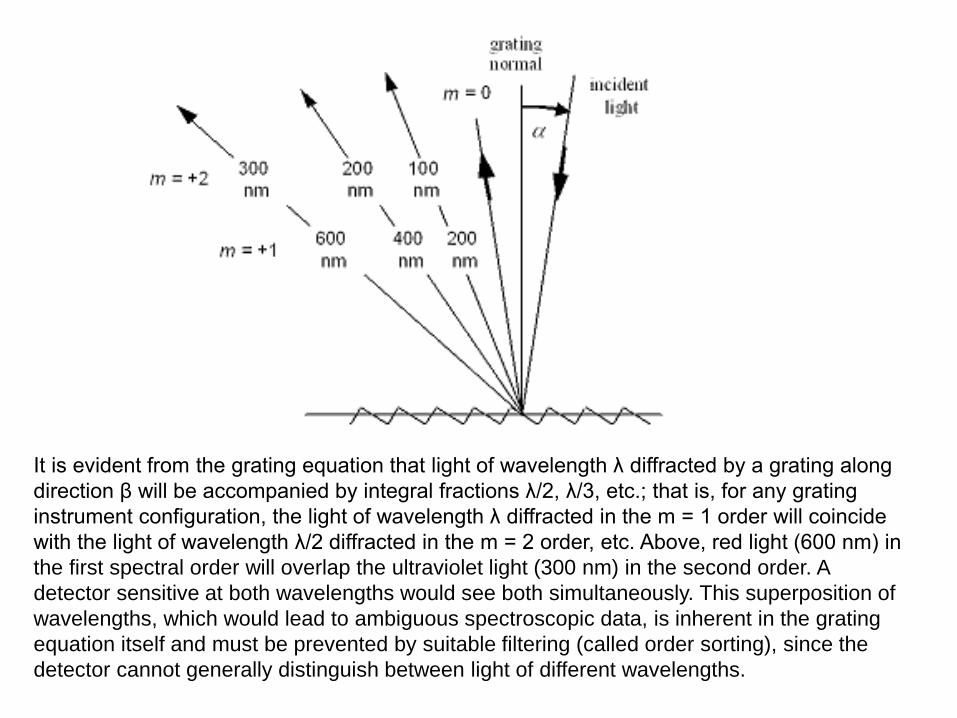
It is evident from the grating equation that light of wavelength λ diffracted by a grating along
direction β will be accompanied by integral fractions λ/2, λ/3, etc.; that is, for any grating
instrument configuration, the light of wavelength λ diffracted in the m = 1 order will coincide
with the light of wavelength λ/2 diffracted in the m = 2 order, etc. Above, red light (600 nm) in
the first spectral order will overlap the ultraviolet light (300 nm) in the second order. A
detector sensitive at both wavelengths would see both simultaneously. This superposition of
wavelengths, which would lead to ambiguous spectroscopic data, is inherent in the grating
equation itself and must be prevented by suitable filtering (called order sorting), since the
detector cannot generally distinguish between light of different wavelengths.

Spectral Products, CM110 1/8th meter monochromator

Maximum diffraction efficiency is produced from a given grating is
produced at the “Blaze Wavelength”
Grating Efficiency

Characterize lamp/monochromator output (photon
flux) at the sample plane (three week duration)
How many Photons/s/nm are incident at the sample plane?
X

You have two lenses per set-up
1) Both 1’ diameter
2) One has a focal length of 1”
3) The other has a focal length of 2”
CM110
1” 2”
A bit more bulbous

The nitty-gritty of communication with the CM110
Many of us had trouble getting the CM110 under proper computer control. Some
troubleshooting last week with a Spectra Products employee led us to proper operation.
The SP employee indicated that proper communication w/e CM110 requires that we be on
COMx where 1 x 4. To check the situation wrt our serial (RS-232) port assignments,
one can go into the Device Manager. You can get there by going to Control, then
Hardware and Sound, then Device Manager. It looks like this:
Expanding the Ports entry, one sees the COM ports
listed with their assigned number (you'll see four ports
listed most likely). If you encounter this problem
again, check into this listing – if none of the COM
ports refer to COM1-4, then right-click on one of
these numbers and choose Properties. From there,
go to Advanced. There you can reassign the COM
port from, e.g., COM8 to COM2.
But Note: you shouldn't’t (hopefully) need to do this,
so please confirm that you have tried all COM ports
on the USB to RS-232 hardware, and have tried all of
COM1-4 on the LabView program. Then take a look
at the Device Manager to see if indeed you lack at
least one COM1-4.

Getting nominally monochromatic light out of the
CM110 Once you have correct communication, you’ll be able to read the wavelength
using, e.g., getLambda.vi (if you have the port set correctly). When you first
power up the CM110, the wavelength setting goes to 0. OK, then if you use
goToLambda.vi to set the wavelength, and you don’t see the color you set, then
you likely need to change the grating selection. Note that the CM110 has a
double-grating turret, as Mike described in an earlier email. One side has our
1200 g/mm grating (make sure you know what g/mm means); the other side has
a flat aluminum mirror.
You can use the CM Series Demo vi (and set
the COM port correctly, while ensuring that you
are not running any potentially conflicting .vi’s
elsewhere that may simultaneously try to
communicate with the CM110), to see which
grating is selected. The number is in the upper
right corner. If necessary, change the grating
by: (a) exiting the Demo vi, (b) finding and
running Select11x2.vi. This .vi is in the folder
‘Desktop\CmC\8-0138-e’. You’ll need to set
the COM port correctly.

A thermopile is an electronic device that converts
thermal energy into electrical energy. It is composed of
several thermocouples connected usually in series or,
less commonly, in parallel.
Thermopiles do not respond to absolute temperature,
but generate an output voltage proportional to a local
temperature difference or temperature gradient.
Thermopiles are used to provide an output in response
to temperature as part of a temperature measuring
device, such as the infrared thermometers widely used
by medical professionals to measure body temperature.
They are also used widely in heat flux sensors. The
output of a thermopile is usually in the range of tens or
hundreds of millivolts.
Thermopile Detector
Dexter 2M detector
After Wikipedia and Dexter Research

Goals of this Unit 1) Build an optical set-up to permit development of a LabView program to acquire (directly into the DAQ board), plot, and store signals from the thermopile detector. The detector is to be excited by the chopped output of the CM110 monochromator. Determine the time constant of the detector, and identify the gas used for packaging. Useful resources are under “Effects of Encapsulation Gas on Thermopile Detectors” and “Thermopile Time Constant Determination” at the http://www.dexterresearch.com/?module=Page&sID=technical-library
2) Acquire plot and store data from the thermopile using the lock-in technique. Compare to data from (1), and understand how the measured voltage relates to the thermopile’s response.
3) Develop a program to measure, plot and store the output of the monochromator, in terms of # of photons/nm-cm2-s, as function of wavelength, for various lamp powers, and several slits widths. How does your measured spectrum compare to a Black Body spectrum? How does your measured spectrum compare to the AM 1.5 spectrum? Use Igor Pro to develop a correction file to convert measured spectrum into either BB or AM 1.5.
Additional guidance for Part 3 Include information about calculations and assumptions (step by step). Include a comparison of measured data to the AM 1.5 and AM0 spectra in units
of #photons/(s-cm2-nm). Specify definition of correction files as AM X(λ)/measured spectra (λ). Plot (measured spectra x correction file) for each case versus AM X spectra.

Chopper height and CM110 exit port height
The chopper has a base plate and is conveniently mounted flat on this base
plate – so it’s height is less easily changed. If you set the CM110 up correctly,
its height should be fine for use with the chopper without clipping the beam.
Specifically, use the smallest post holder, and screw these directly into the
optical breadboard (do not use a baseplate underneath the post holder) using
the ¼-20 set screws we provided). Then, be certain you’re using the 1.5” posts
mounted on the bottom of the CM110.

More on lock-in amplifier next week

Spectrometer sensitivity calibration: black body radiation, grating efficiency, detector sensitivity


Resources:
http://gratings.newport.com/information/handbook/toc.asp
http://www.thinksrs.com/products/SR510530.htm
http://www.dexterresearch.com/?module=Page&sID=technical-library
http://www.pariss-hyperspectral-
imaging.com/GratingOrders_Movie/GratingOrders_Movie.html