Embed Size (px)
Citation preview
706 IEEE TRANSACTIONS ON IMAGE PROCESSING, VOL. 12, NO. 6, JUNE 2003
Gray and Color Image Contrast Enhancementby the Curvelet Transform
Jean-Luc Starck, Fionn Murtagh, Emmanuel J. Candès, and David L. Donoho
Abstract—We present in this paper a new method for contrastenhancement based on the curvelet transform. The curvelettransform represents edges better than wavelets, and is thereforewell-suited for multiscale edge enhancement. We compare thisapproach with enhancement based on the wavelet transform,and the Multiscale Retinex. In a range of examples, we use edgedetection and segmentation, among other processing applications,to provide for quantitative comparative evaluation. Our findingsare that curvelet based enhancement out-performs other enhance-ment methods on noisy images, but on noiseless or near noiselessimages curvelet based enhancement is not remarkably better thanwavelet based enhancement.
Index Terms—Contrast enhancement, curvelets, ridgelets,wavelets.
I. INTRODUCTION
BECAUSE some features are hardly detectable by eye inan image, we often transform images before display. His-
togram equalization is one the most well-known methods forcontrast enhancement. Such an approach is generally useful forimages with poor intensity distribution. Since edges play a fun-damental role in image understanding, one good way to enhancethe contrast is to enhance the edges. For example, we can addto the original image its Laplacian ( , where
is the enhanced image andis a parameter). Only features atthe finest scale are enhanced (linearly). For a highvalue, onlythe high frequencies are visible. Multiscale edge enhancement[15] can be seen as a generalization of this approach, taking allresolution levels into account.
In color images, objects can exhibit variations in color satu-ration with little or no correspondence in luminance variation.Several methods have been proposed in the past for color imageenhancement [14]. The retinex concept was introduced by Land[7] as a model for human color constancy. The single scaleretinex (SSR) method [6] consists of applying the followingtransform to each bandof the color image:
(1)
Manuscript received April 26, 2002; revised February 6, 2003. The associateeditor coordinating the review of this manuscript and approving it for publica-tion was Dr. Eric L. Miller.
J.-L. Starck is with the CEA-Saclay, DAPNIA/SEDI-SAP, Service d’Astro-physique, F-91191 Gif sur Yvette, France (e-mail: [email protected]).
F. Murtagh is with the School of Computer Science, Queen’s UniversityBelfast, Belfast BT7 1NN, Ireland (e-mail: [email protected]).
E. J. Candès is with the Department of Applied Mathematics, California In-stitute of Technology, Pasadena, CA 91125 USA (e-mail: [email protected]).
D. L. Donoho is with the Department of Statistics, Stanford University, Stan-ford, CA 94305 USA (e-mail: [email protected]).
Digital Object Identifier 10.1109/TIP.2003.813140
where is the retinex output, is the image dis-tribution in the th spectral band, is a Gaussian function, and
is convolution. A gain/offset is applied to the retinex outputwhich clips the highest and lowest signal excursions. This canbe done by k-sigma clipping. The retinex method is efficient fordynamic range compression, but does not provide good tonalrendition [10]. The Multiscale Retinex (MSR) combines severalSSR outputs to produce a single output image which has bothgood dynamic range compression and color constancy (colorconstancy may be defined as the independence of the perceivedcolor from the color of the light source [8], [9]), and good tonalrendition [5]. The MSR can be defined by
(2)
with
(3)
is the number of scales, is the th spectral component ofthe MSR output, and is the weight associated with the scale. The Gaussian is given by
(4)
where defines the width of the Gaussian. In [5], three scaleswere recommended with values equal respectively to 15, 80,250, and all weights fixed to . These parameters mayhowever be image dependent, and automatic parameter estima-tion by a genetic algorithm was proposed in [9].
The Multiscale Retinex introduces the concept of multires-olution for contrast enhancement. It performs dynamic rangecompression and can be used for different image processinggoals. Improvements of the algorithm have been presented in[1], leading to better color fidelity.
MSR softens the strongest edges and keeps the faint edges al-most untouched. The opposite approach was proposed by Velde[15] in using the wavelet transform for enhancing the faintestedges and keeping untouched the strongest. The strategies aredifferent, but both methods allow the user to see details whichwere hardly distinguishable in the original image, by reducingthe ratio of strong features to faint features.
The wavelet approach [15] consists of first transforming theimage using the dyadic wavelet transform (two directions perscale). The gradient at scale and at pixel location iscalculated at each scalefrom the wavelet coefficients
and relative to the horizontal and vertical wavelet bands:
1057-7149/03$17.00 © 2003 IEEE
STARCK et al.: GRAY AND COLOR IMAGE CONTRAST ENHANCEMENT BY THE CURVELET TRANSFORM 707
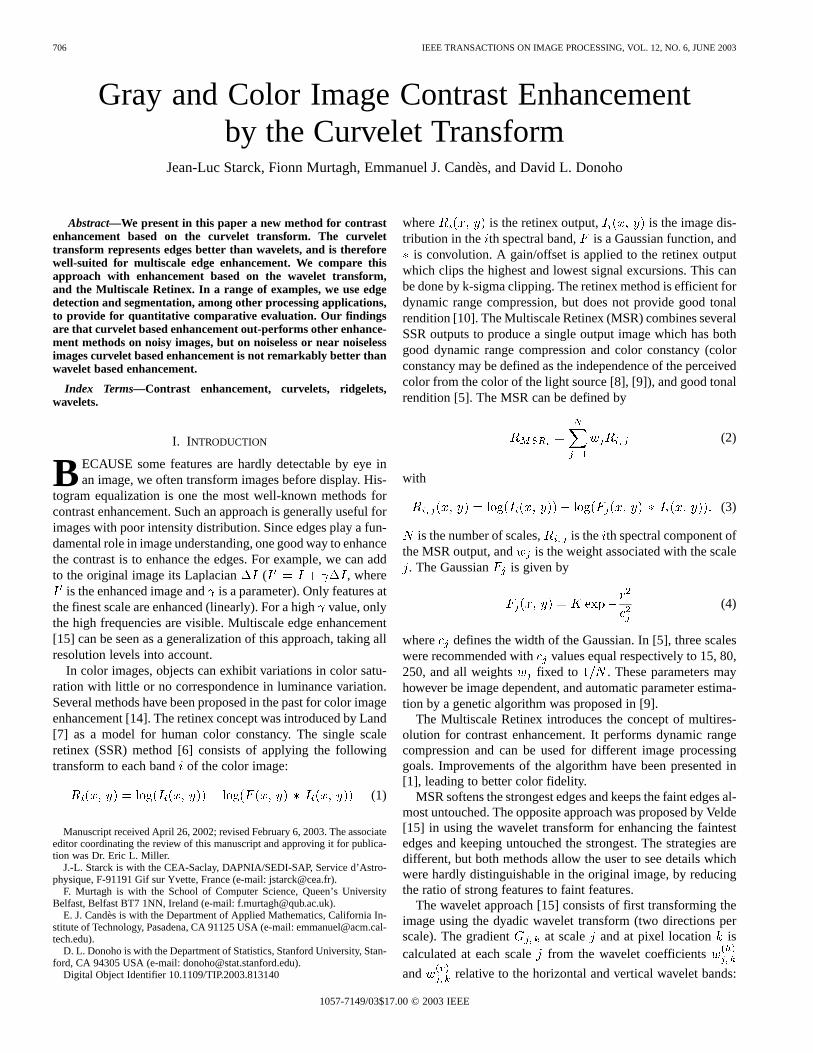
Fig. 1. Enhanced coefficients versus original coefficients. Parameters arem =
30, c = 3, andp = 0:5.
. Then the two wavelet coeffi-cients at scale and at pixel position [i.e., ] aremultiplied by , where is defined by
if
if
if (5)
Three parameters are needed:, and . determines thedegree of nonlinearity in the nonlinear rescaling of the lumi-nance, and must be in . Coefficients larger than arenot modified by the algorithm. Theparameter corresponds tothe noise level. Fig. 1 shows the modified wavelet coefficientsversus the original wavelet coefficients for a given set of param-eters ( , and ). Finally, the enhanced imageis obtained by the inverse wavelet transform from the modifiedwavelet coefficients. For color images, a similar method canbe used, but by calculating the overall multiscale gradientfrom the multiscale gradient of the three, , components:
. All wavelet coeffi-
cients at scale and at position are multiplied by , theenhanced , , components are reconstructed from the modi-fied wavelet coefficients, and the (, , ) image is transformedinto an RGB image. More details can be found in [15].
Wavelet bases present some limitations, because they are notwell adapted to the detectionofhighlyanisotropic elements, suchas alignments in an image, or sheets in a cube. Recently, othermultiscale systems have been developed, which include in par-ticular ridgelets [2] and curvelets [3], [12], and these are very dif-ferent fromwavelet-likesystems.Curveletsandridgelets take theform of basis elements which exhibit very high directional sensi-tivity and are highly anisotropic. The curvelet transform uses theridgelet transform in its digital implementation. We first describethe ridgelet and the curvelet transforms, and then we show howcontrast enhancement can be obtained from the curvelet coef-ficients. Following that, we present a number of evaluations ofthe use of wavelet- and curvelet-based enhancement.
II. CONTRAST ENHANCEMENT USING THE
CURVELET TRANSFORM
A. Ridgelet Transform
The two-dimensional continuous ridgelet transform incan be defined as follows [2]. We pick a smooth univariate func-
tion with sufficient decay and satisfying the admis-sibility condition
(6)
where denotes the Fourier transform of. Equation (6) holdsif, say, has a vanishing mean . We will supposea special normalization aboutso that .
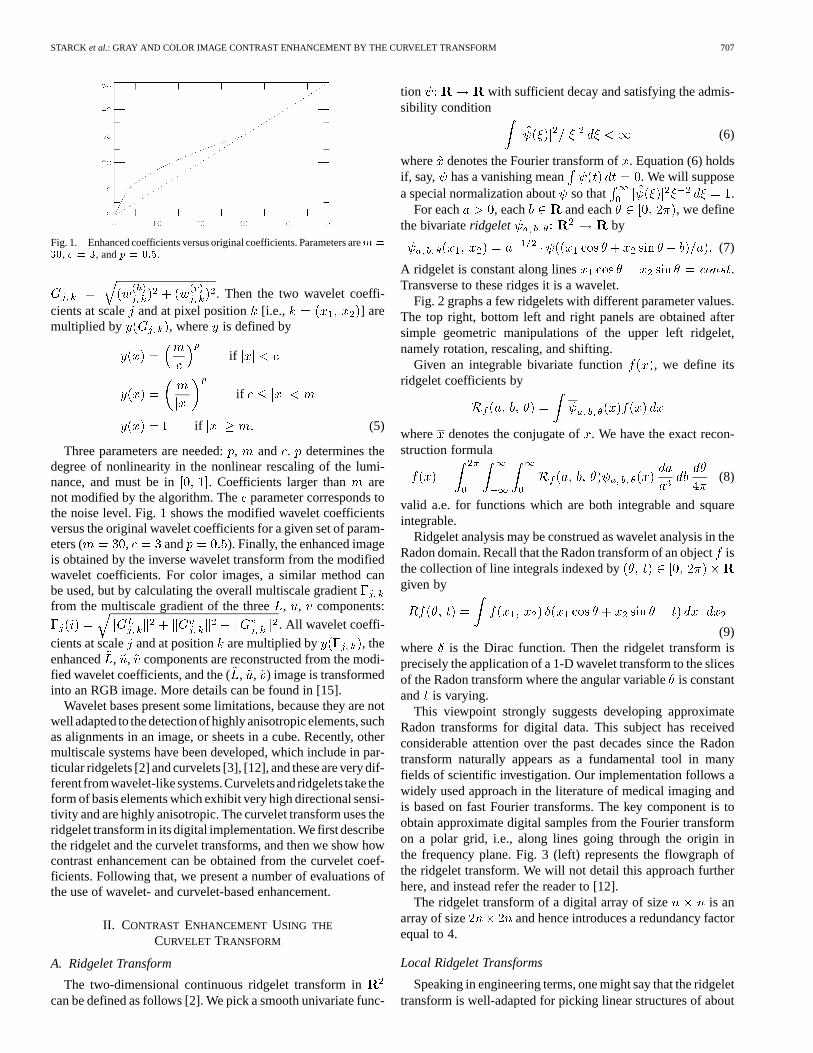
For each , each and each , we definethe bivariateridgelet by
(7)
A ridgelet is constant along lines .Transverse to these ridges it is a wavelet.
Fig. 2 graphs a few ridgelets with different parameter values.The top right, bottom left and right panels are obtained aftersimple geometric manipulations of the upper left ridgelet,namely rotation, rescaling, and shifting.
Given an integrable bivariate function , we define itsridgelet coefficients by
where denotes the conjugate of. We have the exact recon-struction formula
(8)
valid a.e. for functions which are both integrable and squareintegrable.
Ridgelet analysis may be construed as wavelet analysis in theRadon domain. Recall that the Radon transform of an objectisthe collection of line integrals indexed bygiven by
(9)where is the Dirac function. Then the ridgelet transform isprecisely the application of a 1-D wavelet transform to the slicesof the Radon transform where the angular variableis constantand is varying.
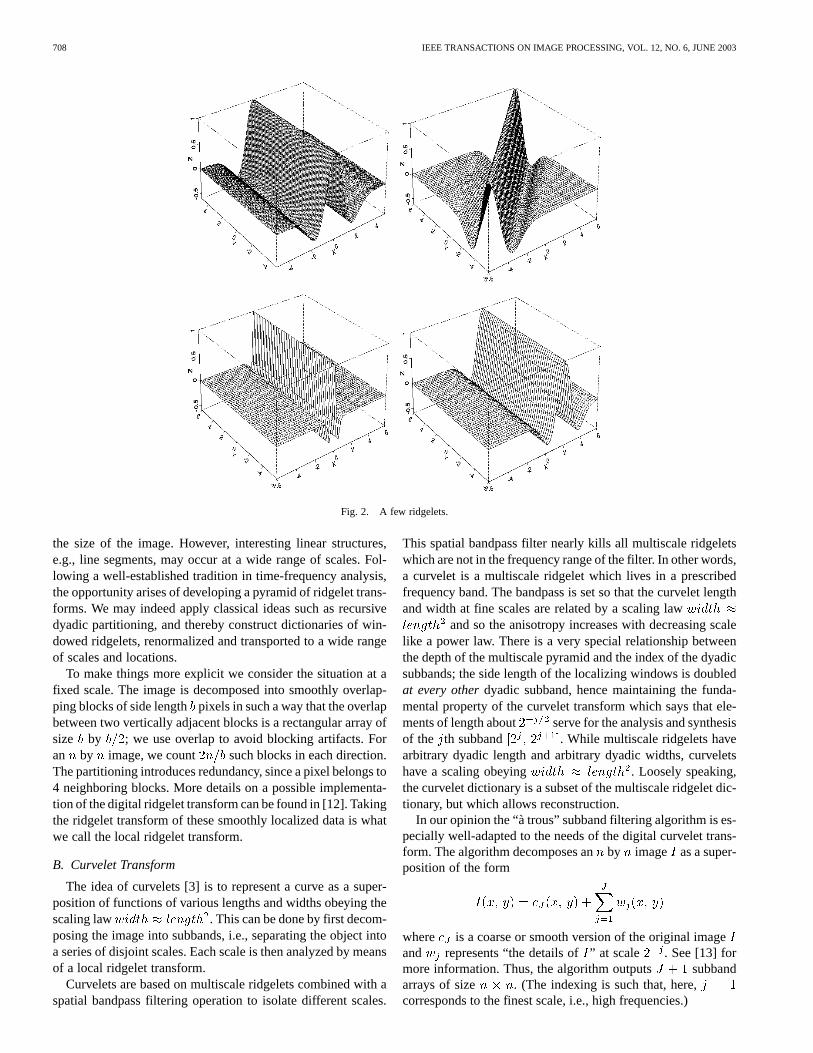
This viewpoint strongly suggests developing approximateRadon transforms for digital data. This subject has receivedconsiderable attention over the past decades since the Radontransform naturally appears as a fundamental tool in manyfields of scientific investigation. Our implementation follows awidely used approach in the literature of medical imaging andis based on fast Fourier transforms. The key component is toobtain approximate digital samples from the Fourier transformon a polar grid, i.e., along lines going through the origin inthe frequency plane. Fig. 3 (left) represents the flowgraph ofthe ridgelet transform. We will not detail this approach furtherhere, and instead refer the reader to [12].
The ridgelet transform of a digital array of size is anarray of size and hence introduces a redundancy factorequal to 4.
Local Ridgelet Transforms
Speaking in engineering terms, one might say that the ridgelettransform is well-adapted for picking linear structures of about
708 IEEE TRANSACTIONS ON IMAGE PROCESSING, VOL. 12, NO. 6, JUNE 2003
Fig. 2. A few ridgelets.
the size of the image. However, interesting linear structures,e.g., line segments, may occur at a wide range of scales. Fol-lowing a well-established tradition in time-frequency analysis,the opportunity arises of developing a pyramid of ridgelet trans-forms. We may indeed apply classical ideas such as recursivedyadic partitioning, and thereby construct dictionaries of win-dowed ridgelets, renormalized and transported to a wide rangeof scales and locations.
To make things more explicit we consider the situation at afixed scale. The image is decomposed into smoothly overlap-ping blocks of side lengthpixels in such a way that the overlapbetween two vertically adjacent blocks is a rectangular array ofsize by ; we use overlap to avoid blocking artifacts. Foran by image, we count such blocks in each direction.The partitioning introduces redundancy, since a pixel belongs to4 neighboring blocks. More details on a possible implementa-tion of the digital ridgelet transform can be found in [12]. Takingthe ridgelet transform of these smoothly localized data is whatwe call the local ridgelet transform.
B. Curvelet Transform
The idea of curvelets [3] is to represent a curve as a super-position of functions of various lengths and widths obeying thescaling law . This can be done by first decom-posing the image into subbands, i.e., separating the object intoa series of disjoint scales. Each scale is then analyzed by meansof a local ridgelet transform.
Curvelets are based on multiscale ridgelets combined with aspatial bandpass filtering operation to isolate different scales.
This spatial bandpass filter nearly kills all multiscale ridgeletswhich are not in the frequency range of the filter. In other words,a curvelet is a multiscale ridgelet which lives in a prescribedfrequency band. The bandpass is set so that the curvelet lengthand width at fine scales are related by a scaling law
and so the anisotropy increases with decreasing scalelike a power law. There is a very special relationship betweenthe depth of the multiscale pyramid and the index of the dyadicsubbands; the side length of the localizing windows is doubledat every otherdyadic subband, hence maintaining the funda-mental property of the curvelet transform which says that ele-ments of length about serve for the analysis and synthesisof the th subband . While multiscale ridgelets havearbitrary dyadic length and arbitrary dyadic widths, curveletshave a scaling obeying . Loosely speaking,the curvelet dictionary is a subset of the multiscale ridgelet dic-tionary, but which allows reconstruction.
In our opinion the “à trous” subband filtering algorithm is es-pecially well-adapted to the needs of the digital curvelet trans-form. The algorithm decomposes anby image as a super-position of the form
where is a coarse or smooth version of the original imageand represents “the details of” at scale . See [13] formore information. Thus, the algorithm outputs subbandarrays of size . (The indexing is such that, here,corresponds to the finest scale, i.e., high frequencies.)
STARCK et al.: GRAY AND COLOR IMAGE CONTRAST ENHANCEMENT BY THE CURVELET TRANSFORM 709
Fig. 3. Top, ridgelet transform flowgraph. Each of the2n radial lines in theFourier domain is processed separately. The 1-D inverse FFT is calculatedalong each radial line followed by a 1-D nonorthogonal wavelet transform. Inpractice, the one-dimensional wavelet coefficients are directly calculated inthe Fourier space. Bottom, curvelet transform flowgraph. The figure illustratesthe decomposition of the original image into subbands followed by the spatialpartitioning of each subband (i.e., each subband is decomposed into blocks).The ridgelet transform is then applied to each block.
As a side comment, we note that the coarse description of theimage is not processed. We used the default valuepixels in our implementation. Fig. 3 (right) gives an overviewof the organization of the algorithm.
This implementation of the curvelet transform is redundant.The redundancy factor is equal to whenever scales areemployed. Finally, the method enjoys exact reconstruction andstability, because each step of the transform is both invertibleand stable.
III. CONTRAST ENHANCEMENT USING THE
CURVELET TRANSFORM
Since the curvelet transform is well-adapted to represent im-ages containing edges, it is a good candidate for edge enhance-ment. Curvelet coefficients can be modified in order to enhanceedges in an image. A function must be defined which modi-fies the values of the curvelet coefficients. It could be a functionsimilar to the one defined for the wavelet coefficients [15] [see(5)]. This function however gives rise to the drawback ampli-fying the noise (linearly) as well as the signal of interest. Weintroduce explicitly the noise standard deviationin the equa-tion
if
if
if
if (10)
Here, determines the degree of nonlinearity andintro-duces dynamic range compression. Using a nonzerowill en-hance the faintest edges and soften the strongest edges at thesame time. becomes a normalization parameter, and avaluelarger than 3 guaranties that the noise will not be amplified. The
parameter is the value under which coefficients are ampli-fied. This value depends obviously on the pixel values insidethe curvelet scale. Therefore, we found it necessary to derivethe value from the data. Two options are possible:
• can be derived from the noise standard deviation () using an additional parameter . The advantage is that
is now independent of the curvelet coefficient values, andtherefore much easier for a user to set. For instance, usingand amplifies all coefficients with a SNR between 3and 10.
• can also be derived from the maximum curvelet coeffi-cient of the relative band ( , with ). In thiscase, choosing for instance and , we amplifyall coefficients with an absolute value betweenand half themaximum absolute value of the band.
The first choice allows the user to define the coefficients tobe amplified as a function of their signal to noise ratio, while thesecond one gives an easy and general way to fix theparameterindependently of the range of the pixel values. Fig. 4 shows thecurve representing the enhanced coefficients versus the originalcoefficients for two sets of parameters.
The curvelet enhancement method for grayscale images con-sists of the following steps.
1) Estimate the noise standard deviationin the inputimage .
710 IEEE TRANSACTIONS ON IMAGE PROCESSING, VOL. 12, NO. 6, JUNE 2003
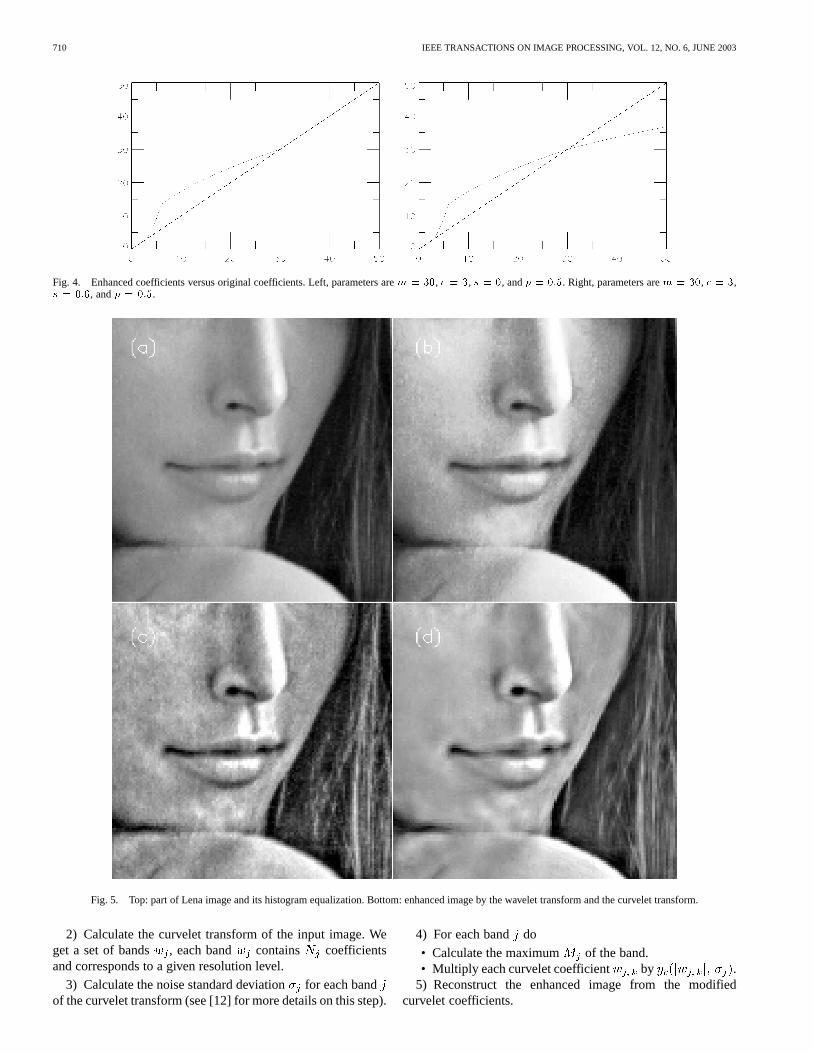
Fig. 4. Enhanced coefficients versus original coefficients. Left, parameters arem = 30, c = 3, s = 0, andp = 0:5. Right, parameters arem = 30, c = 3,s = 0:6, andp = 0:5.
Fig. 5. Top: part of Lena image and its histogram equalization. Bottom: enhanced image by the wavelet transform and the curvelet transform.
2) Calculate the curvelet transform of the input image. Weget a set of bands , each band contains coefficientsand corresponds to a given resolution level.
3) Calculate the noise standard deviationfor each bandof the curvelet transform (see [12] for more details on this step).
4) For each band do
• Calculate the maximum of the band.• Multiply each curvelet coefficient by .
5) Reconstruct the enhanced image from the modifiedcurvelet coefficients.
STARCK et al.: GRAY AND COLOR IMAGE CONTRAST ENHANCEMENT BY THE CURVELET TRANSFORM 711
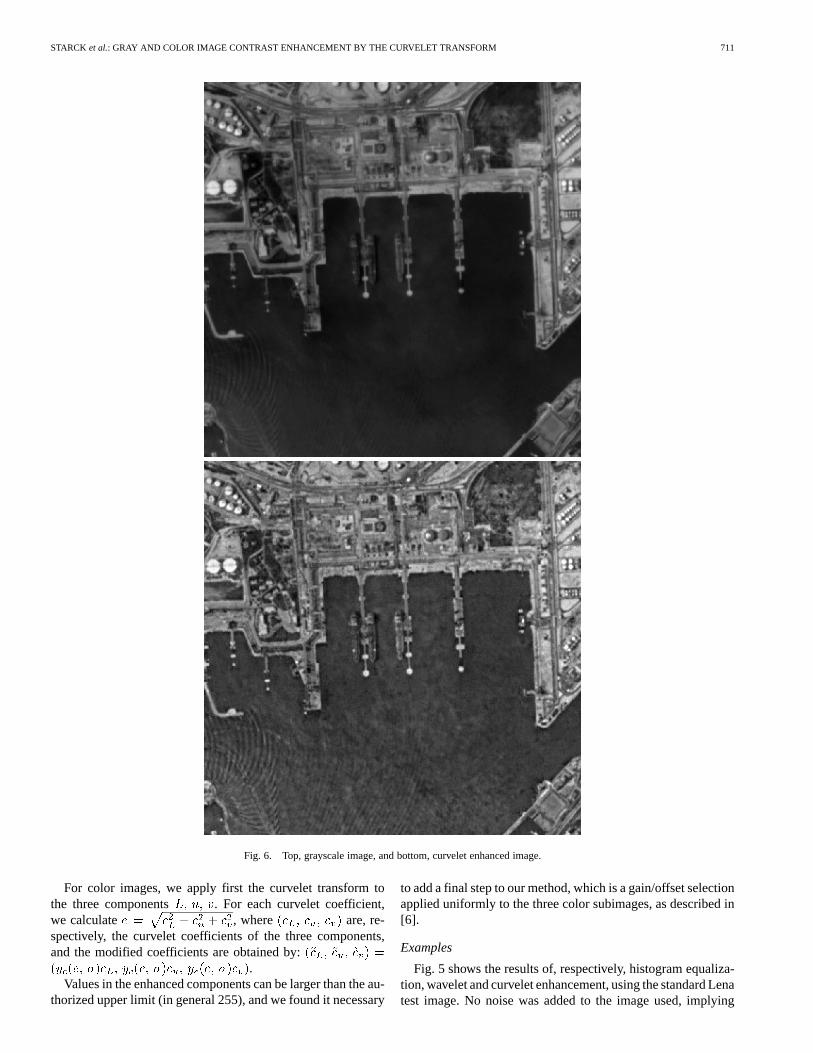
Fig. 6. Top, grayscale image, and bottom, curvelet enhanced image.
For color images, we apply first the curvelet transform tothe three components . For each curvelet coefficient,we calculate , where are, re-spectively, the curvelet coefficients of the three components,and the modified coefficients are obtained by:
.Values in the enhanced components can be larger than the au-
thorized upper limit (in general 255), and we found it necessary
to add a final step to our method, which is a gain/offset selectionapplied uniformly to the three color subimages, as described in[6].
Examples
Fig. 5 shows the results of, respectively, histogram equaliza-tion, wavelet and curvelet enhancement, using the standard Lenatest image. No noise was added to the image used, implying
712 IEEE TRANSACTIONS ON IMAGE PROCESSING, VOL. 12, NO. 6, JUNE 2003
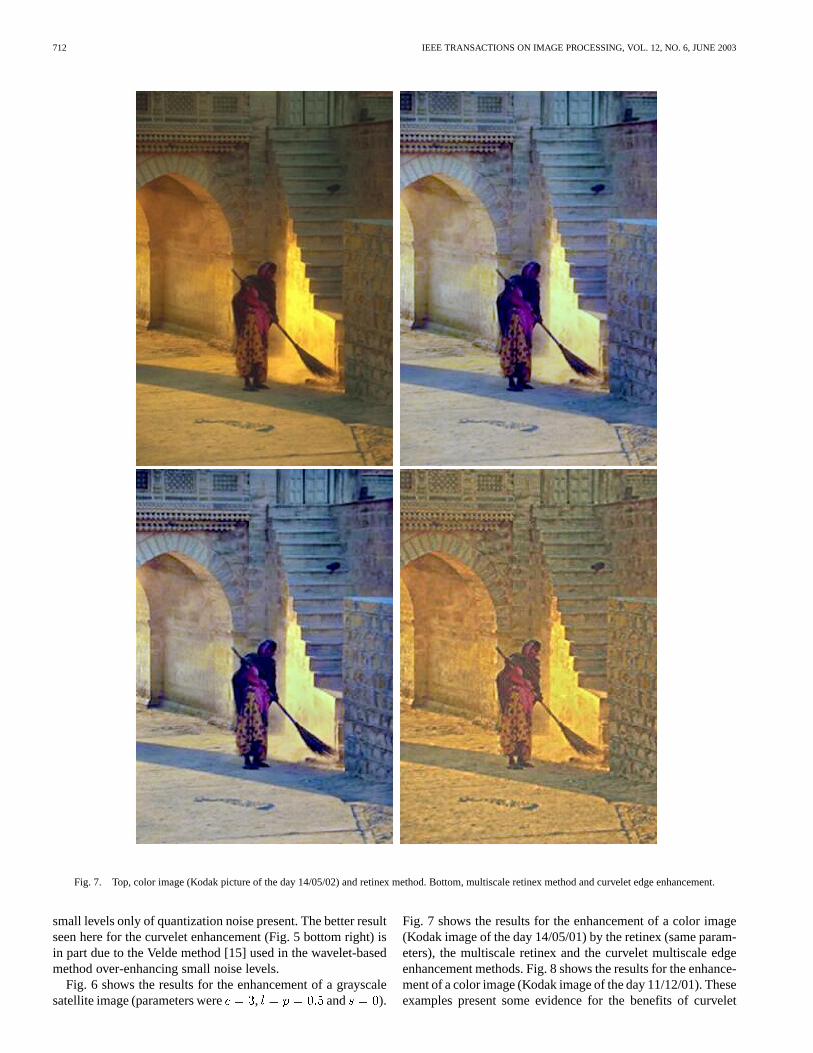
Fig. 7. Top, color image (Kodak picture of the day 14/05/02) and retinex method. Bottom, multiscale retinex method and curvelet edge enhancement.
small levels only of quantization noise present. The better resultseen here for the curvelet enhancement (Fig. 5 bottom right) isin part due to the Velde method [15] used in the wavelet-basedmethod over-enhancing small noise levels.
Fig. 6 shows the results for the enhancement of a grayscalesatellite image (parameters were , and ).
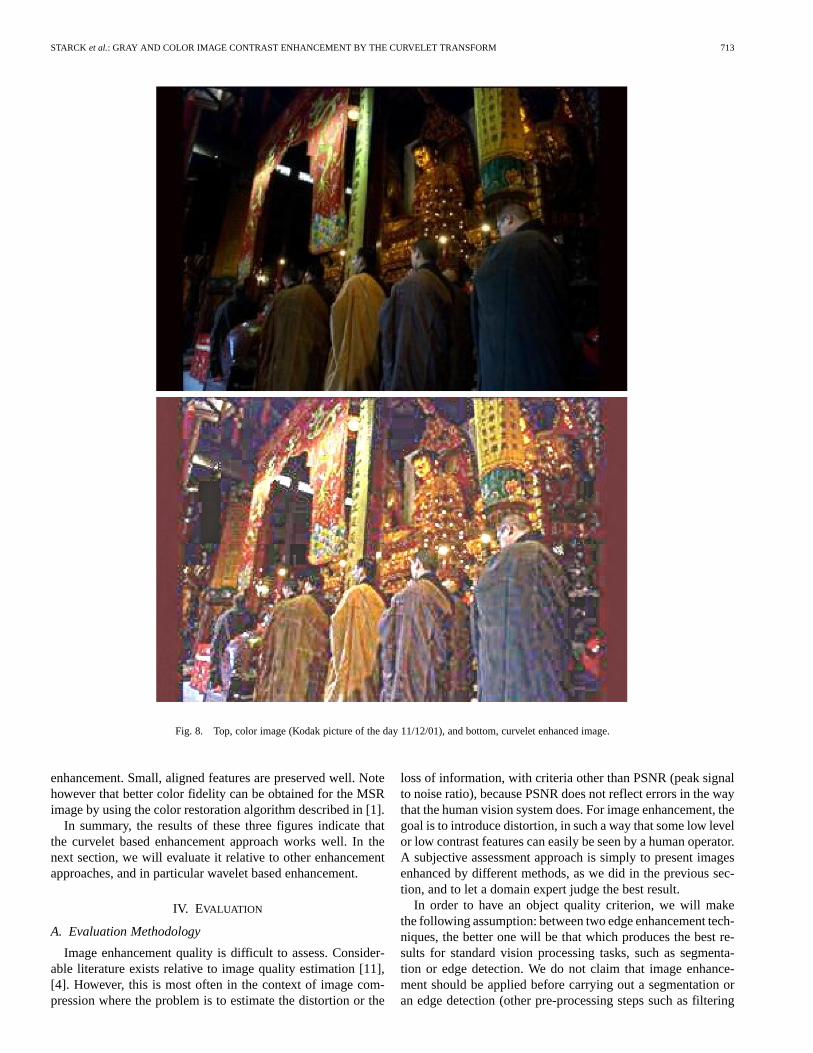
Fig. 7 shows the results for the enhancement of a color image(Kodak image of the day 14/05/01) by the retinex (same param-eters), the multiscale retinex and the curvelet multiscale edgeenhancement methods. Fig. 8 shows the results for the enhance-ment of a color image (Kodak image of the day 11/12/01). Theseexamples present some evidence for the benefits of curvelet
STARCK et al.: GRAY AND COLOR IMAGE CONTRAST ENHANCEMENT BY THE CURVELET TRANSFORM 713
Fig. 8. Top, color image (Kodak picture of the day 11/12/01), and bottom, curvelet enhanced image.
enhancement. Small, aligned features are preserved well. Notehowever that better color fidelity can be obtained for the MSRimage by using the color restoration algorithm described in [1].
In summary, the results of these three figures indicate thatthe curvelet based enhancement approach works well. In thenext section, we will evaluate it relative to other enhancementapproaches, and in particular wavelet based enhancement.
IV. EVALUATION
A. Evaluation Methodology
Image enhancement quality is difficult to assess. Consider-able literature exists relative to image quality estimation [11],[4]. However, this is most often in the context of image com-pression where the problem is to estimate the distortion or the
loss of information, with criteria other than PSNR (peak signalto noise ratio), because PSNR does not reflect errors in the waythat the human vision system does. For image enhancement, thegoal is to introduce distortion, in such a way that some low levelor low contrast features can easily be seen by a human operator.A subjective assessment approach is simply to present imagesenhanced by different methods, as we did in the previous sec-tion, and to let a domain expert judge the best result.
In order to have an object quality criterion, we will makethe following assumption: between two edge enhancement tech-niques, the better one will be that which produces the best re-sults for standard vision processing tasks, such as segmenta-tion or edge detection. We do not claim that image enhance-ment should be applied before carrying out a segmentation oran edge detection (other pre-processing steps such as filtering
714 IEEE TRANSACTIONS ON IMAGE PROCESSING, VOL. 12, NO. 6, JUNE 2003
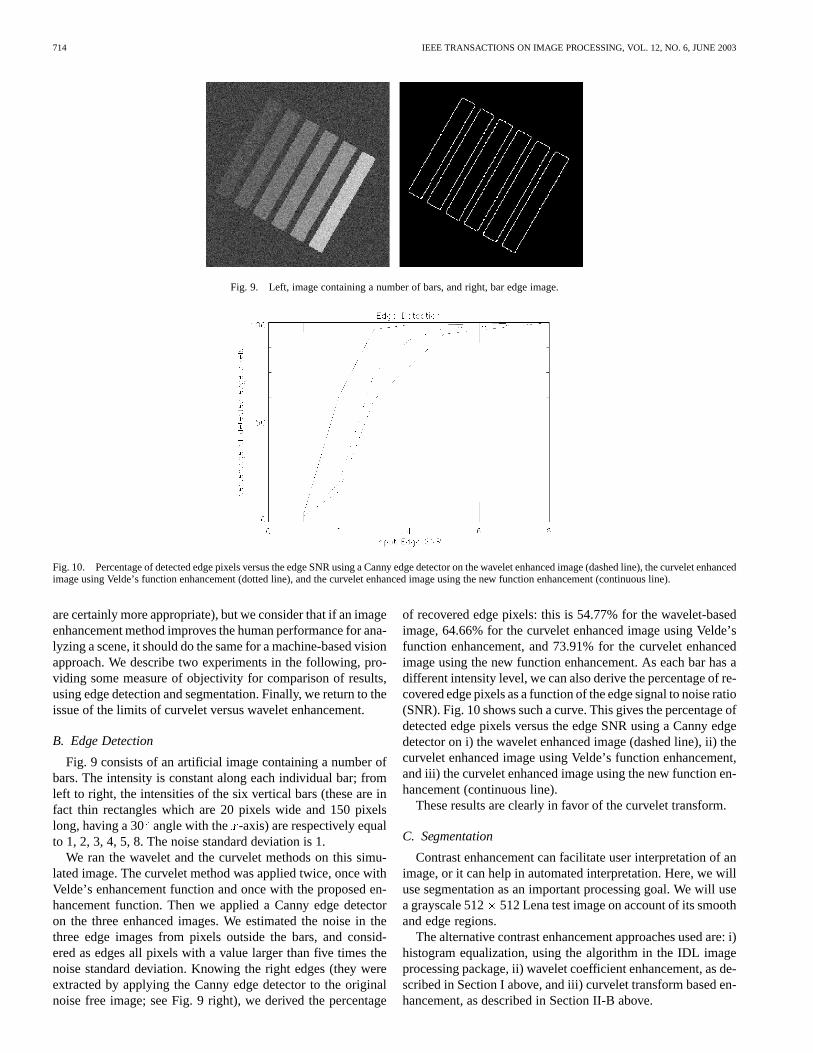
Fig. 9. Left, image containing a number of bars, and right, bar edge image.
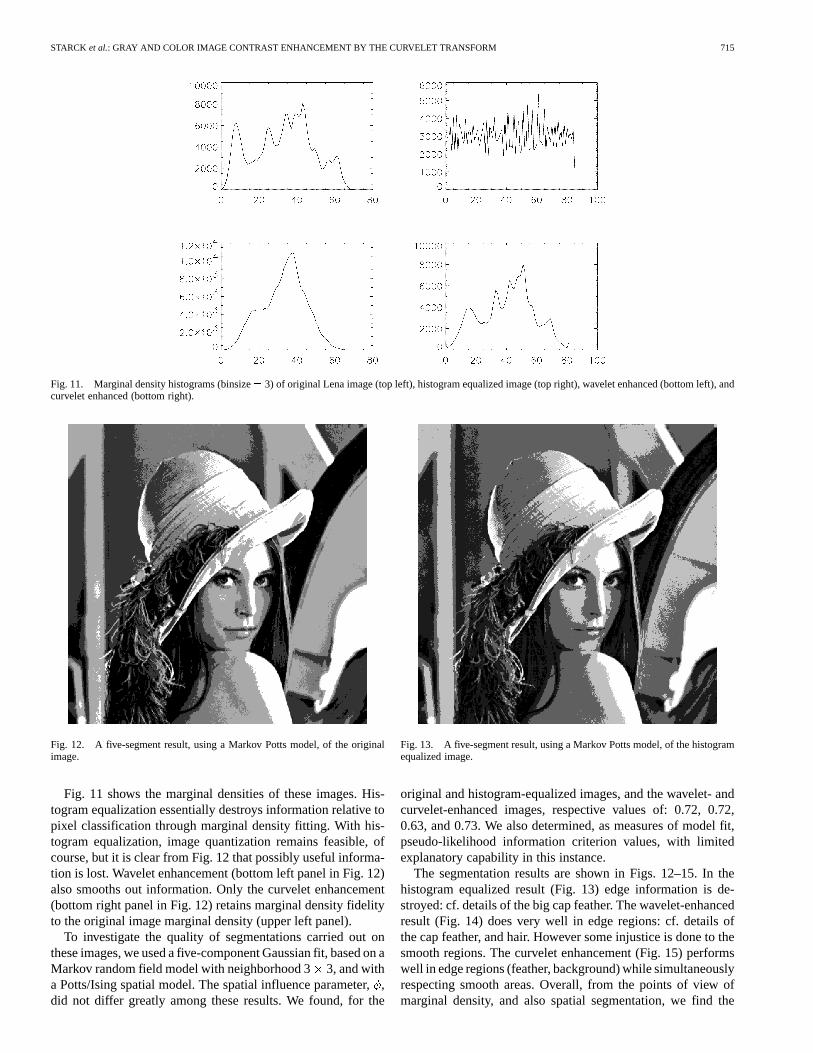
Fig. 10. Percentage of detected edge pixels versus the edge SNR using a Canny edge detector on the wavelet enhanced image (dashed line), the curvelet enhancedimage using Velde’s function enhancement (dotted line), and the curvelet enhanced image using the new function enhancement (continuous line).
are certainly more appropriate), but we consider that if an imageenhancement method improves the human performance for ana-lyzing a scene, it should do the same for a machine-based visionapproach. We describe two experiments in the following, pro-viding some measure of objectivity for comparison of results,using edge detection and segmentation. Finally, we return to theissue of the limits of curvelet versus wavelet enhancement.
B. Edge Detection
Fig. 9 consists of an artificial image containing a number ofbars. The intensity is constant along each individual bar; fromleft to right, the intensities of the six vertical bars (these are infact thin rectangles which are 20 pixels wide and 150 pixelslong, having a 30angle with the -axis) are respectively equalto 1, 2, 3, 4, 5, 8. The noise standard deviation is 1.
We ran the wavelet and the curvelet methods on this simu-lated image. The curvelet method was applied twice, once withVelde’s enhancement function and once with the proposed en-hancement function. Then we applied a Canny edge detectoron the three enhanced images. We estimated the noise in thethree edge images from pixels outside the bars, and consid-ered as edges all pixels with a value larger than five times thenoise standard deviation. Knowing the right edges (they wereextracted by applying the Canny edge detector to the originalnoise free image; see Fig. 9 right), we derived the percentage
of recovered edge pixels: this is 54.77% for the wavelet-basedimage, 64.66% for the curvelet enhanced image using Velde’sfunction enhancement, and 73.91% for the curvelet enhancedimage using the new function enhancement. As each bar has adifferent intensity level, we can also derive the percentage of re-covered edge pixels as a function of the edge signal to noise ratio(SNR). Fig. 10 shows such a curve. This gives the percentage ofdetected edge pixels versus the edge SNR using a Canny edgedetector on i) the wavelet enhanced image (dashed line), ii) thecurvelet enhanced image using Velde’s function enhancement,and iii) the curvelet enhanced image using the new function en-hancement (continuous line).
These results are clearly in favor of the curvelet transform.
C. Segmentation
Contrast enhancement can facilitate user interpretation of animage, or it can help in automated interpretation. Here, we willuse segmentation as an important processing goal. We will usea grayscale 512 512 Lena test image on account of its smoothand edge regions.
The alternative contrast enhancement approaches used are: i)histogram equalization, using the algorithm in the IDL imageprocessing package, ii) wavelet coefficient enhancement, as de-scribed in Section I above, and iii) curvelet transform based en-hancement, as described in Section II-B above.
STARCK et al.: GRAY AND COLOR IMAGE CONTRAST ENHANCEMENT BY THE CURVELET TRANSFORM 715
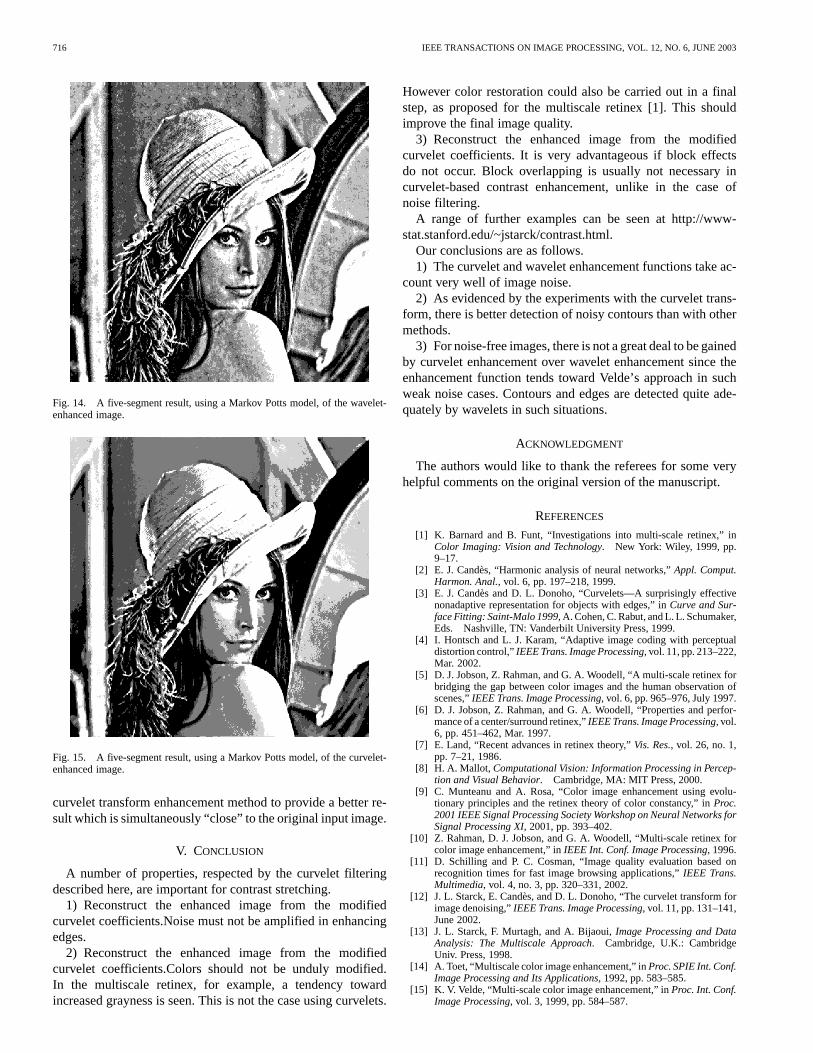
Fig. 11. Marginal density histograms (binsize= 3) of original Lena image (top left), histogram equalized image (top right), wavelet enhanced (bottom left), andcurvelet enhanced (bottom right).
Fig. 12. A five-segment result, using a Markov Potts model, of the originalimage.
Fig. 11 shows the marginal densities of these images. His-togram equalization essentially destroys information relative topixel classification through marginal density fitting. With his-togram equalization, image quantization remains feasible, ofcourse, but it is clear from Fig. 12 that possibly useful informa-tion is lost. Wavelet enhancement (bottom left panel in Fig. 12)also smooths out information. Only the curvelet enhancement(bottom right panel in Fig. 12) retains marginal density fidelityto the original image marginal density (upper left panel).
To investigate the quality of segmentations carried out onthese images, we used a five-component Gaussian fit, based on aMarkov random field model with neighborhood 33, and witha Potts/Ising spatial model. The spatial influence parameter,,did not differ greatly among these results. We found, for the
Fig. 13. A five-segment result, using a Markov Potts model, of the histogramequalized image.
original and histogram-equalized images, and the wavelet- andcurvelet-enhanced images, respective values of: 0.72, 0.72,0.63, and 0.73. We also determined, as measures of model fit,pseudo-likelihood information criterion values, with limitedexplanatory capability in this instance.
The segmentation results are shown in Figs. 12–15. In thehistogram equalized result (Fig. 13) edge information is de-stroyed: cf. details of the big cap feather. The wavelet-enhancedresult (Fig. 14) does very well in edge regions: cf. details ofthe cap feather, and hair. However some injustice is done to thesmooth regions. The curvelet enhancement (Fig. 15) performswell in edge regions (feather, background) while simultaneouslyrespecting smooth areas. Overall, from the points of view ofmarginal density, and also spatial segmentation, we find the
716 IEEE TRANSACTIONS ON IMAGE PROCESSING, VOL. 12, NO. 6, JUNE 2003
Fig. 14. A five-segment result, using a Markov Potts model, of the wavelet-enhanced image.
Fig. 15. A five-segment result, using a Markov Potts model, of the curvelet-enhanced image.
curvelet transform enhancement method to provide a better re-sult which is simultaneously “close” to the original input image.
V. CONCLUSION
A number of properties, respected by the curvelet filteringdescribed here, are important for contrast stretching.
1) Reconstruct the enhanced image from the modifiedcurvelet coefficients.Noise must not be amplified in enhancingedges.
2) Reconstruct the enhanced image from the modifiedcurvelet coefficients.Colors should not be unduly modified.In the multiscale retinex, for example, a tendency towardincreased grayness is seen. This is not the case using curvelets.
However color restoration could also be carried out in a finalstep, as proposed for the multiscale retinex [1]. This shouldimprove the final image quality.
3) Reconstruct the enhanced image from the modifiedcurvelet coefficients. It is very advantageous if block effectsdo not occur. Block overlapping is usually not necessary incurvelet-based contrast enhancement, unlike in the case ofnoise filtering.
A range of further examples can be seen at http://www-stat.stanford.edu/~jstarck/contrast.html.
Our conclusions are as follows.1) The curvelet and wavelet enhancement functions take ac-
count very well of image noise.2) As evidenced by the experiments with the curvelet trans-
form, there is better detection of noisy contours than with othermethods.
3) For noise-free images, there is not a great deal to be gainedby curvelet enhancement over wavelet enhancement since theenhancement function tends toward Velde’s approach in suchweak noise cases. Contours and edges are detected quite ade-quately by wavelets in such situations.
ACKNOWLEDGMENT
The authors would like to thank the referees for some veryhelpful comments on the original version of the manuscript.
REFERENCES
[1] K. Barnard and B. Funt, “Investigations into multi-scale retinex,” inColor Imaging: Vision and Technology. New York: Wiley, 1999, pp.9–17.
[2] E. J. Candès, “Harmonic analysis of neural networks,”Appl. Comput.Harmon. Anal., vol. 6, pp. 197–218, 1999.
[3] E. J. Candès and D. L. Donoho, “Curvelets—A surprisingly effectivenonadaptive representation for objects with edges,” inCurve and Sur-face Fitting: Saint-Malo 1999, A. Cohen, C. Rabut, and L. L. Schumaker,Eds. Nashville, TN: Vanderbilt University Press, 1999.
[4] I. Hontsch and L. J. Karam, “Adaptive image coding with perceptualdistortion control,”IEEE Trans. Image Processing, vol. 11, pp. 213–222,Mar. 2002.
[5] D. J. Jobson, Z. Rahman, and G. A. Woodell, “A multi-scale retinex forbridging the gap between color images and the human observation ofscenes,”IEEE Trans. Image Processing, vol. 6, pp. 965–976, July 1997.
[6] D. J. Jobson, Z. Rahman, and G. A. Woodell, “Properties and perfor-mance of a center/surround retinex,”IEEE Trans. Image Processing, vol.6, pp. 451–462, Mar. 1997.
[7] E. Land, “Recent advances in retinex theory,”Vis. Res., vol. 26, no. 1,pp. 7–21, 1986.
[8] H. A. Mallot, Computational Vision: Information Processing in Percep-tion and Visual Behavior. Cambridge, MA: MIT Press, 2000.
[9] C. Munteanu and A. Rosa, “Color image enhancement using evolu-tionary principles and the retinex theory of color constancy,” inProc.2001 IEEE Signal Processing Society Workshop on Neural Networks forSignal Processing XI, 2001, pp. 393–402.
[10] Z. Rahman, D. J. Jobson, and G. A. Woodell, “Multi-scale retinex forcolor image enhancement,” inIEEE Int. Conf. Image Processing, 1996.
[11] D. Schilling and P. C. Cosman, “Image quality evaluation based onrecognition times for fast image browsing applications,”IEEE Trans.Multimedia, vol. 4, no. 3, pp. 320–331, 2002.
[12] J. L. Starck, E. Candès, and D. L. Donoho, “The curvelet transform forimage denoising,”IEEE Trans. Image Processing, vol. 11, pp. 131–141,June 2002.
[13] J. L. Starck, F. Murtagh, and A. Bijaoui,Image Processing and DataAnalysis: The Multiscale Approach. Cambridge, U.K.: CambridgeUniv. Press, 1998.
[14] A. Toet, “Multiscale color image enhancement,” inProc. SPIE Int. Conf.Image Processing and Its Applications, 1992, pp. 583–585.
[15] K. V. Velde, “Multi-scale color image enhancement,” inProc. Int. Conf.Image Processing, vol. 3, 1999, pp. 584–587.
STARCK et al.: GRAY AND COLOR IMAGE CONTRAST ENHANCEMENT BY THE CURVELET TRANSFORM 717
Jean-Luc Starck received the Ph.D. degree from theUniversity Nice-Sophia Antipolis and the Habilita-tion degree from University Paris XI.
He was a Visitor at the European Southern Obser-vatory (ESO) in 1993 and in the Statistics Depart-ment, Stanford University, Stanford, CA, in 2000. Hehas been a Researcher at CEA since 1994. His re-search interests include image processing, multiscalemethods, and statistical methods in astrophysics. Heis the author of two books entitledImage Processingand Data Analysis: The Multiscale Approach(Cam-
bridge, U.K.: Cambridge University Press, 1998) andAstronomical Image andData Analysis(Berlin, Germany: Springer, 2002).
Fionn Murtagh received the B.A. and B.A.I.degrees in mathematics and engineering science,and the M.Sc. degree in computer science, all fromTrinity College, Dublin, Ireland. He received thePh.D. degree in mathematical statistics from theUniversité P. & M. Curie, Paris VI, France, andan Habilitation degree from Université L. Pasteur,Strasbourg, France.
Previous posts have included Senior Scientist withthe Space Science Department of the European SpaceAgency, and visiting appointments with the European
Commission’s Joint Research Centre, and the Department of Statistics, Univer-sity of Washington. He is Professor of Computer Science at Queen’s University,Belfast, Ireland. He is Editor-in-Chief ofThe Computer Journal.
Dr. Murtagh is a Fellow of the British Computer Society.
Emmanuel J. Candèsgraduated from the EcolePolytechnique, France, and received the M.Sc.degrtee in applied mathematics from the Universityof Paris VI, France. He received the Ph.D. degreein statistics at Stanford University, Stanford, CA,where David L. Donoho served as his adviser.
He is Assistant Professor of Applied and Computa-tional Mathematics at the California Institute of Tech-nology (Caltech), Pasadena. Prior to joining Caltech,he was an Assistant Professor in statistics at StanfordUniversity, Stanford, CA. His research interests are in
the areas of computational harmonic analysis, approximation theory, statisticalestimation, and their applications to signal and image processing and scientificcomputing.
Dr. Candès is an Alfred P. Sloan Research Fellow.
David L. Donoho received the A.B. degree (summacum laude) in statistics from Princeton University,Princeton, NJ, where his senior thesis adviser wasJohn W. Tukey, and the Ph.D. degree in statisticsfrom Harvard University, Cambridge, MA, wherehis Ph.D. adviser was Peter Huber.
He is Professor of Statistics at Stanford University.He has previously been a Professor at the Universityof California, Berkeley, and a Visiting Professor atUniversité de Paris, as well as a Sackler Fellow atTel Aviv University. His research interests are in har-
monic analysis, image representation, and mathematical statistics.Dr. Donoho is a member of the U.S.A. National Academy of Sciences and a
fellow of the American Academy of Arts and Sciences.


![An innovative technique for contrast enhancement of ... · contrast enhancement allows an easy distinction of the image components through an appropriate upsurge in its contrast [2]](https://img.pdfslide.net/doc/110x75/5f03b8127e708231d40a6f18/an-innovative-technique-for-contrast-enhancement-of-contrast-enhancement-allows.jpg)