Embed Size (px)
Citation preview
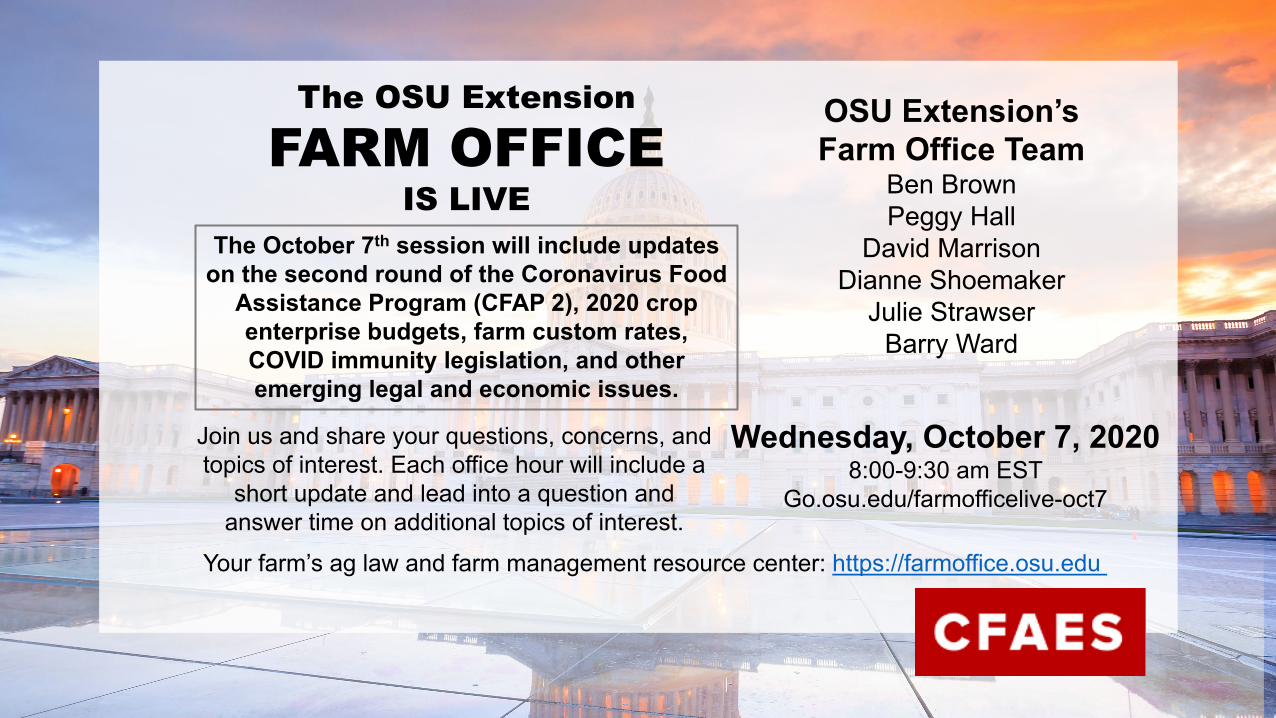
grea The OSU Extension
FARM OFFICEIS LIVE
The October 7th session will include updates on the second round of the Coronavirus Food
Assistance Program (CFAP 2), 2020 crop enterprise budgets, farm custom rates, COVID immunity legislation, and other emerging legal and economic issues.
Join us and share your questions, concerns, and topics of interest. Each office hour will include a
short update and lead into a question and answer time on additional topics of interest.
OSU Extension’sFarm Office Team
Ben BrownPeggy Hall
David MarrisonDianne Shoemaker
Julie StrawserBarry Ward
Wednesday, October 7, 20208:00-9:30 am EST
Go.osu.edu/farmofficelive-oct7
Your farm’s ag law and farm management resource center: https://farmoffice.osu.edu

Farm Office Team

Coronavirus Food Assistance Program 1
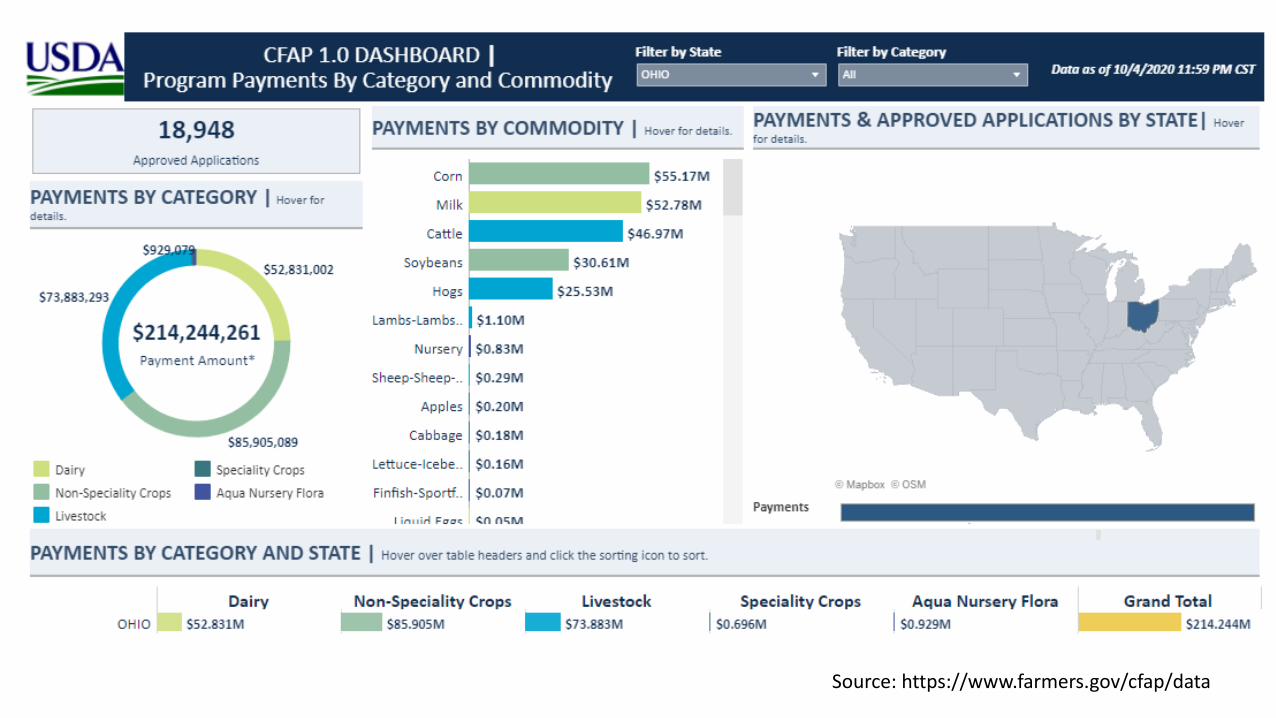
Source: https://www.farmers.gov/cfap/data

Coronavirus Food Assistance Program 2
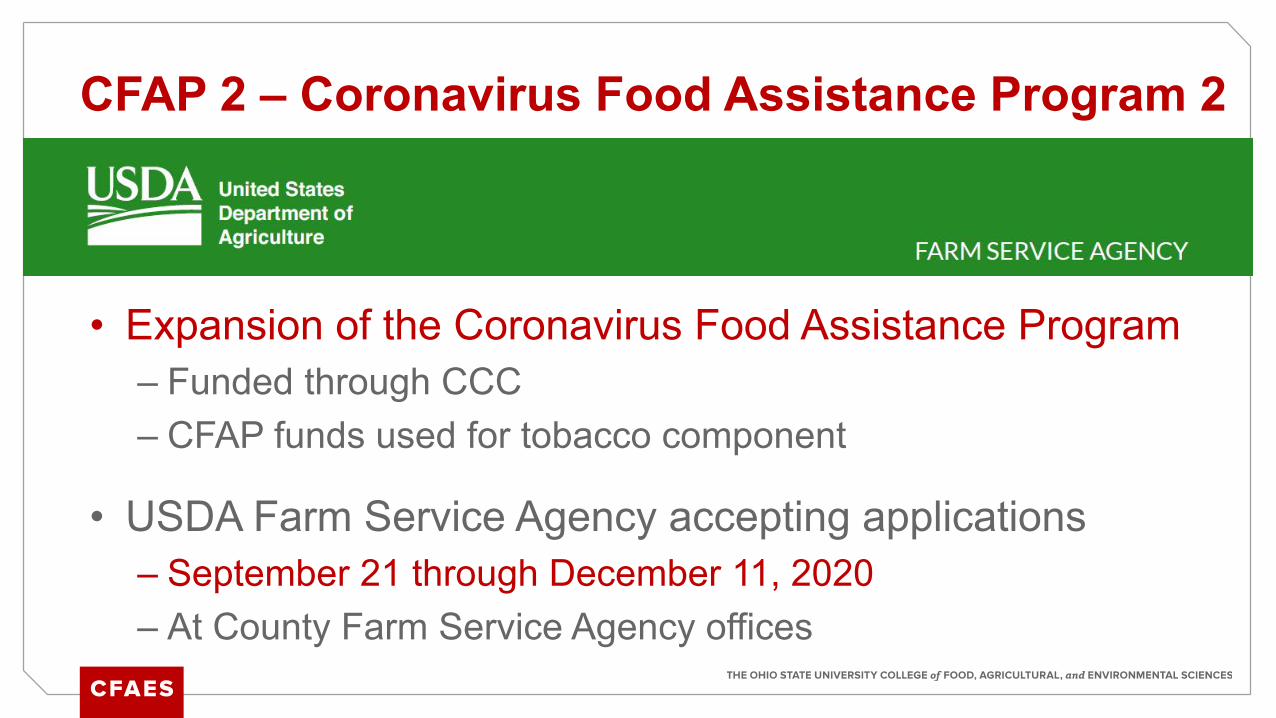
• Expansion of the Coronavirus Food Assistance Program– Funded through CCC– CFAP funds used for tobacco component
• USDA Farm Service Agency accepting applications– September 21 through December 11, 2020– At County Farm Service Agency offices
CFAP 2 – Coronavirus Food Assistance Program 2
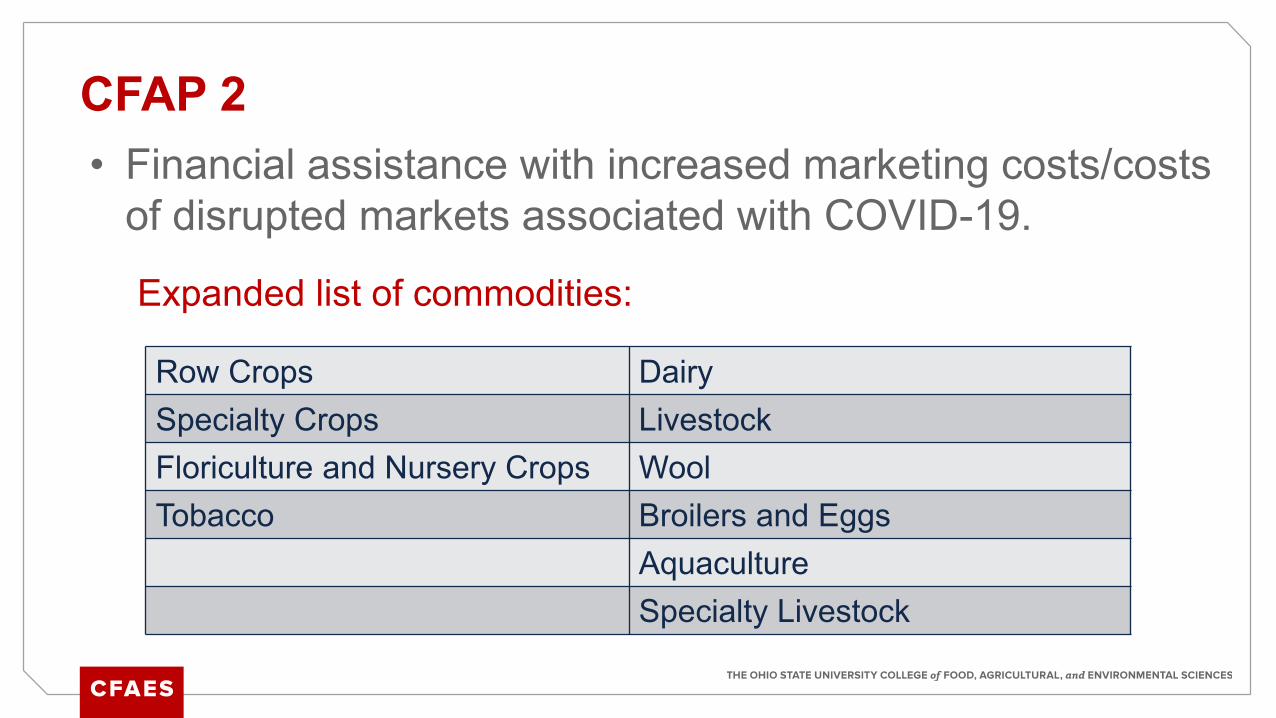
• Financial assistance with increased marketing costs/costs of disrupted markets associated with COVID-19.
Expanded list of commodities:
CFAP 2
Row Crops DairySpecialty Crops LivestockFloriculture and Nursery Crops WoolTobacco Broilers and Eggs
AquacultureSpecialty Livestock
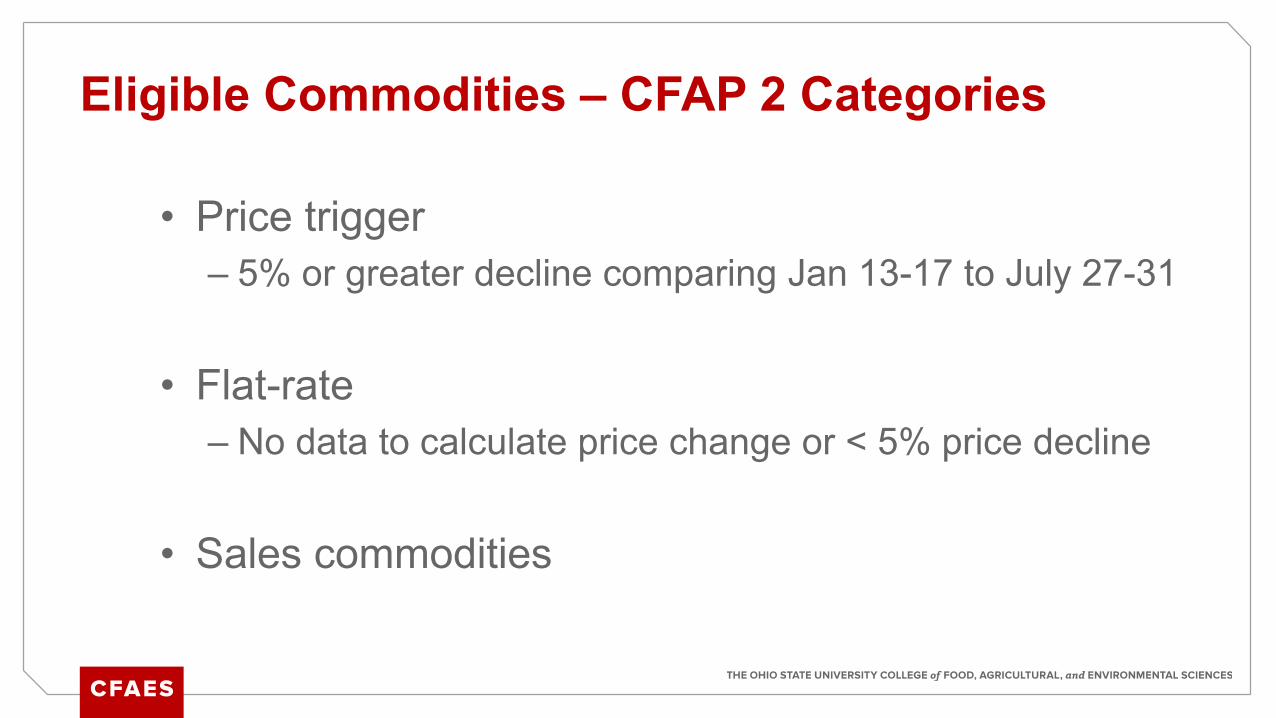
• Price trigger– 5% or greater decline comparing Jan 13-17 to July 27-31
• Flat-rate– No data to calculate price change or < 5% price decline
• Sales commodities
Eligible Commodities – CFAP 2 Categories
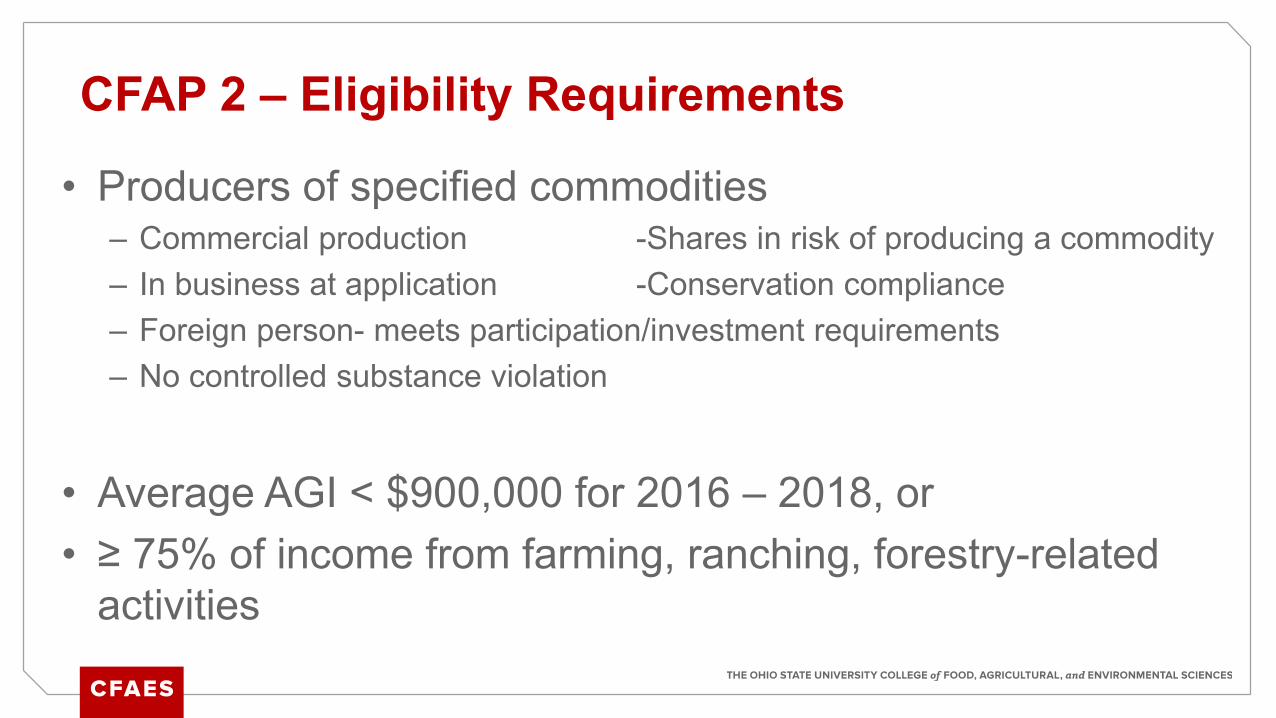
• Producers of specified commodities– Commercial production -Shares in risk of producing a commodity– In business at application -Conservation compliance– Foreign person- meets participation/investment requirements– No controlled substance violation
• Average AGI < $900,000 for 2016 – 2018, or • ≥ 75% of income from farming, ranching, forestry-related
activities
CFAP 2 – Eligibility Requirements
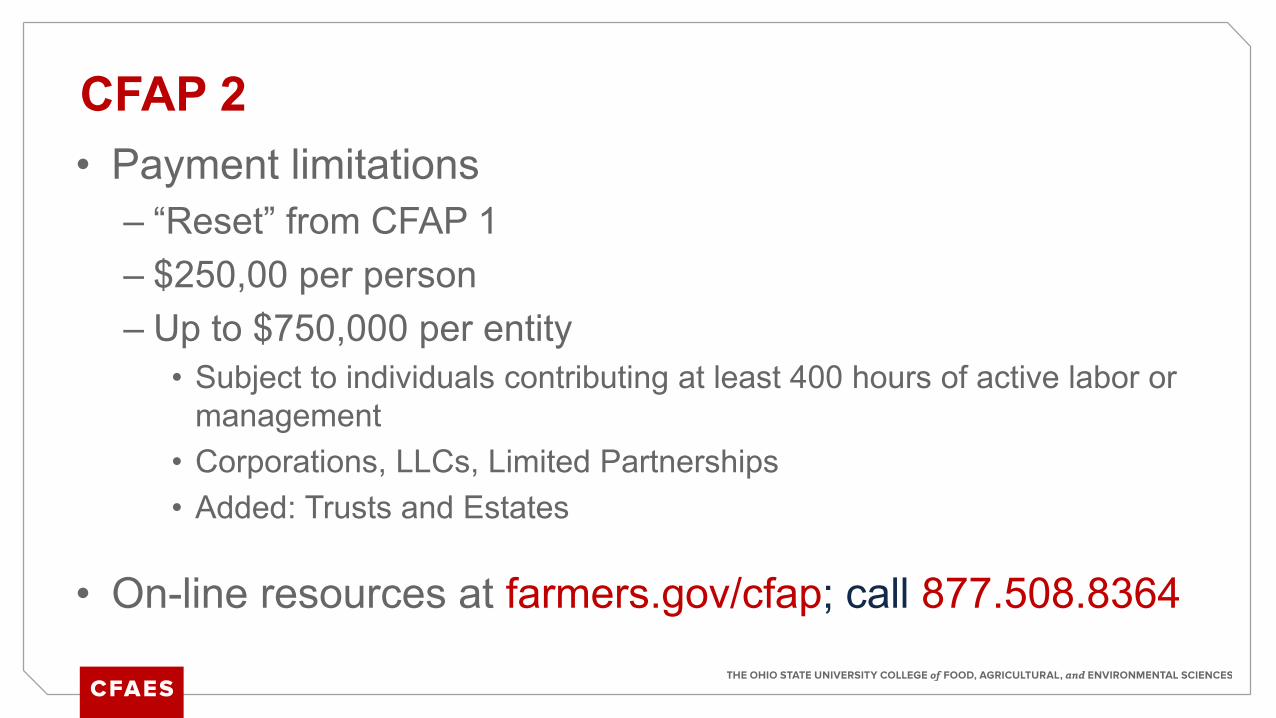
• Payment limitations– “Reset” from CFAP 1– $250,00 per person– Up to $750,000 per entity
• Subject to individuals contributing at least 400 hours of active labor or management
• Corporations, LLCs, Limited Partnerships• Added: Trusts and Estates
• On-line resources at farmers.gov/cfap; call 877.508.8364
CFAP 2
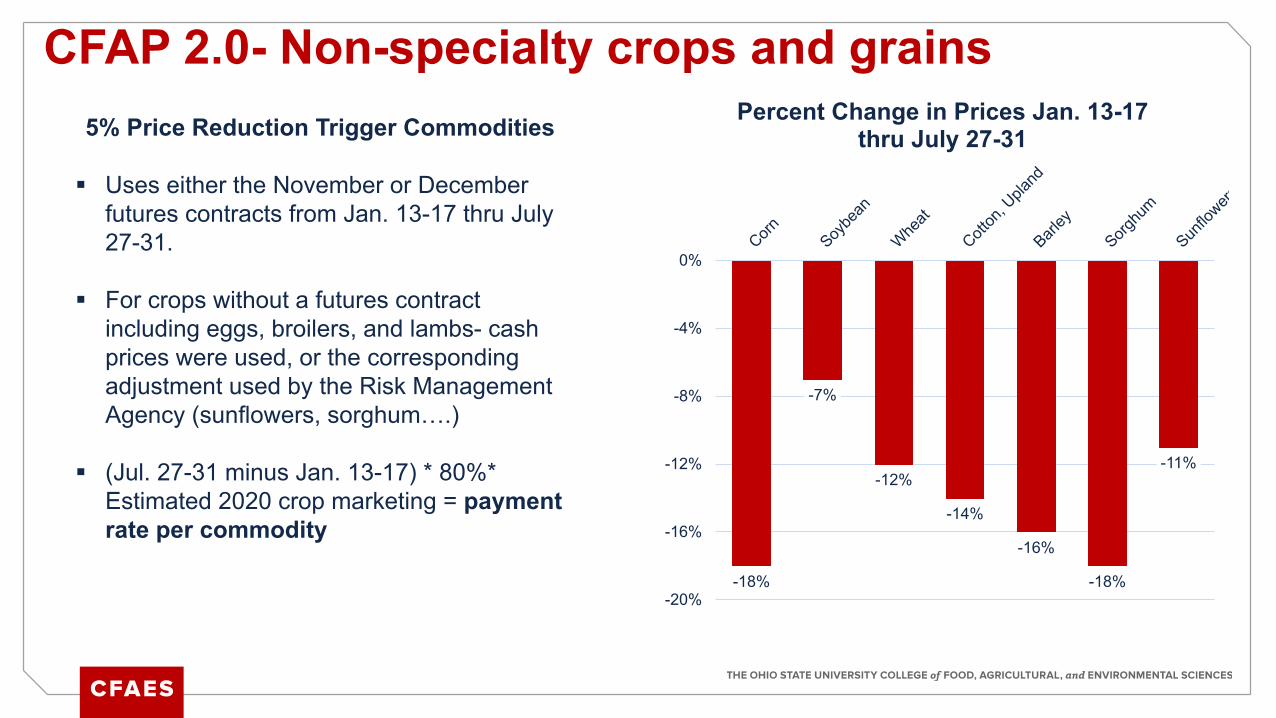
CFAP 2.0- Non-specialty crops and grains5% Price Reduction Trigger Commodities
Uses either the November or December futures contracts from Jan. 13-17 thru July 27-31.
For crops without a futures contract including eggs, broilers, and lambs- cash prices were used, or the corresponding adjustment used by the Risk Management Agency (sunflowers, sorghum….)
(Jul. 27-31 minus Jan. 13-17) * 80%* Estimated 2020 crop marketing = payment rate per commodity
-18%
-7%
-12%
-14%
-16%
-18%
-11%
-20%
-16%
-12%
-8%
-4%
0%
Percent Change in Prices Jan. 13-17 thru July 27-31
CFAP 2.0- Non-specialty crops and grains
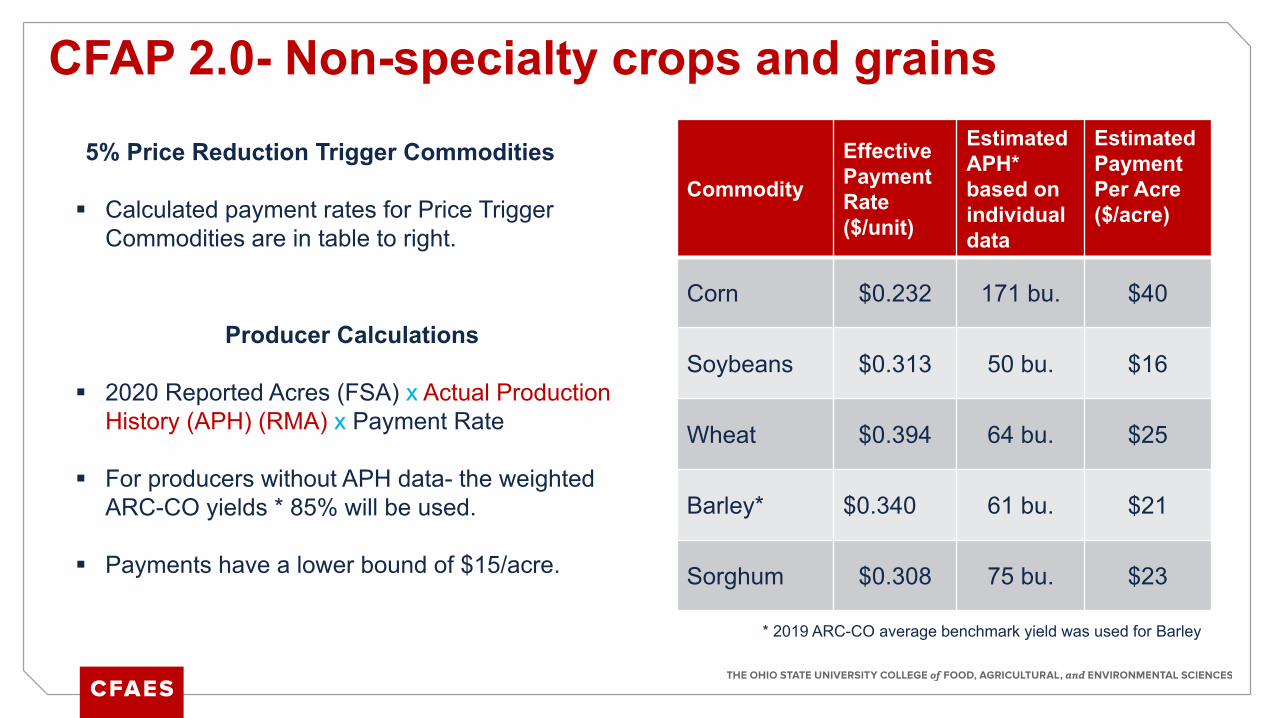
5% Price Reduction Trigger Commodities
Calculated payment rates for Price Trigger Commodities are in table to right.
Producer Calculations
2020 Reported Acres (FSA) x Actual Production History (APH) (RMA) x Payment Rate
For producers without APH data- the weighted ARC-CO yields * 85% will be used.
Payments have a lower bound of $15/acre.
Commodity
Effective Payment Rate($/unit)
Estimated APH* based on individual data
EstimatedPayment Per Acre($/acre)
Corn $0.232 171 bu. $40
Soybeans $0.313 50 bu. $16
Wheat $0.394 64 bu. $25
Barley* $0.340 61 bu. $21
Sorghum $0.308 75 bu. $23
* 2019 ARC-CO average benchmark yield was used for Barley
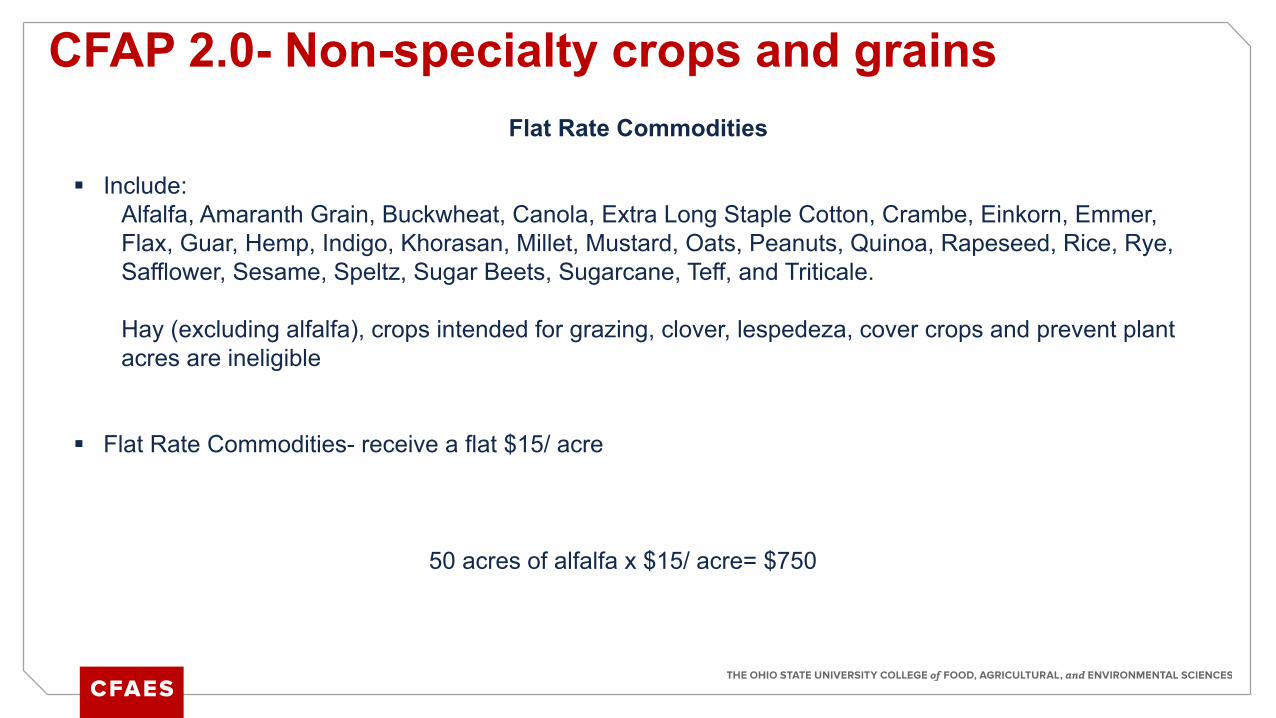
CFAP 2.0- Non-specialty crops and grainsFlat Rate Commodities
Include: Alfalfa, Amaranth Grain, Buckwheat, Canola, Extra Long Staple Cotton, Crambe, Einkorn, Emmer, Flax, Guar, Hemp, Indigo, Khorasan, Millet, Mustard, Oats, Peanuts, Quinoa, Rapeseed, Rice, Rye, Safflower, Sesame, Speltz, Sugar Beets, Sugarcane, Teff, and Triticale.
Hay (excluding alfalfa), crops intended for grazing, clover, lespedeza, cover crops and prevent plant acres are ineligible
Flat Rate Commodities- receive a flat $15/ acre
50 acres of alfalfa x $15/ acre= $750
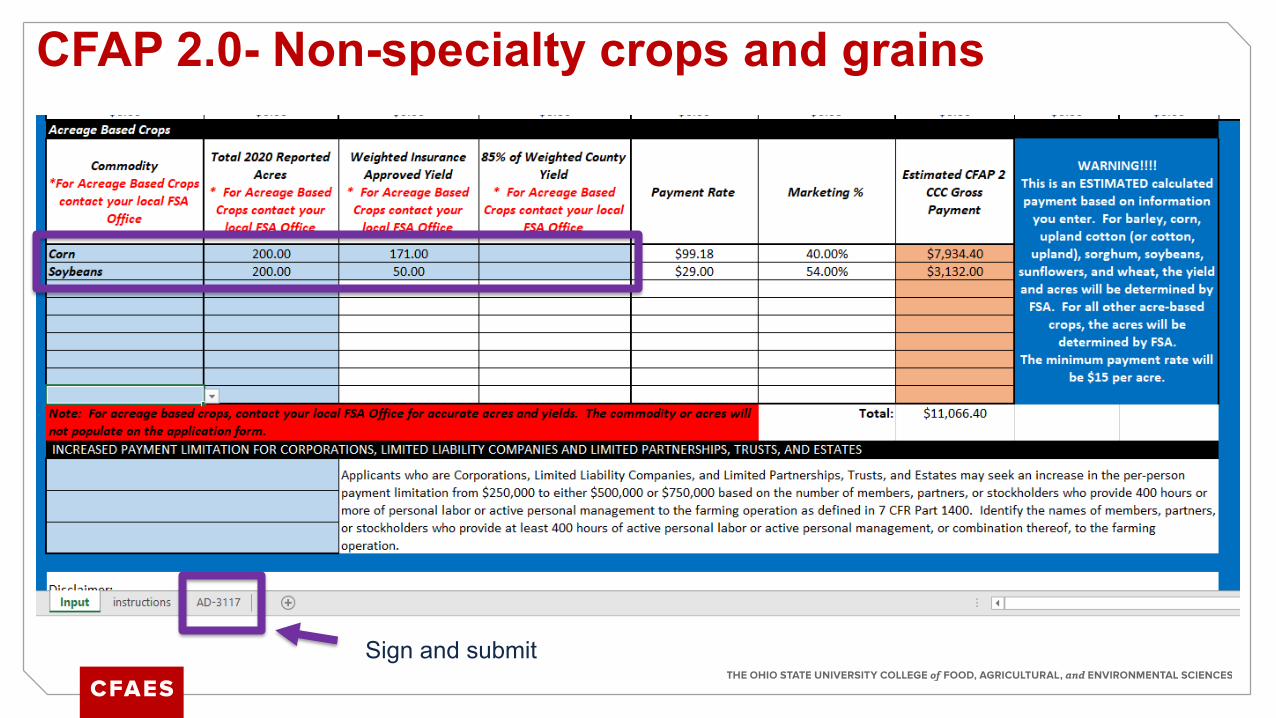
CFAP 2.0- Non-specialty crops and grains
Sign and submit
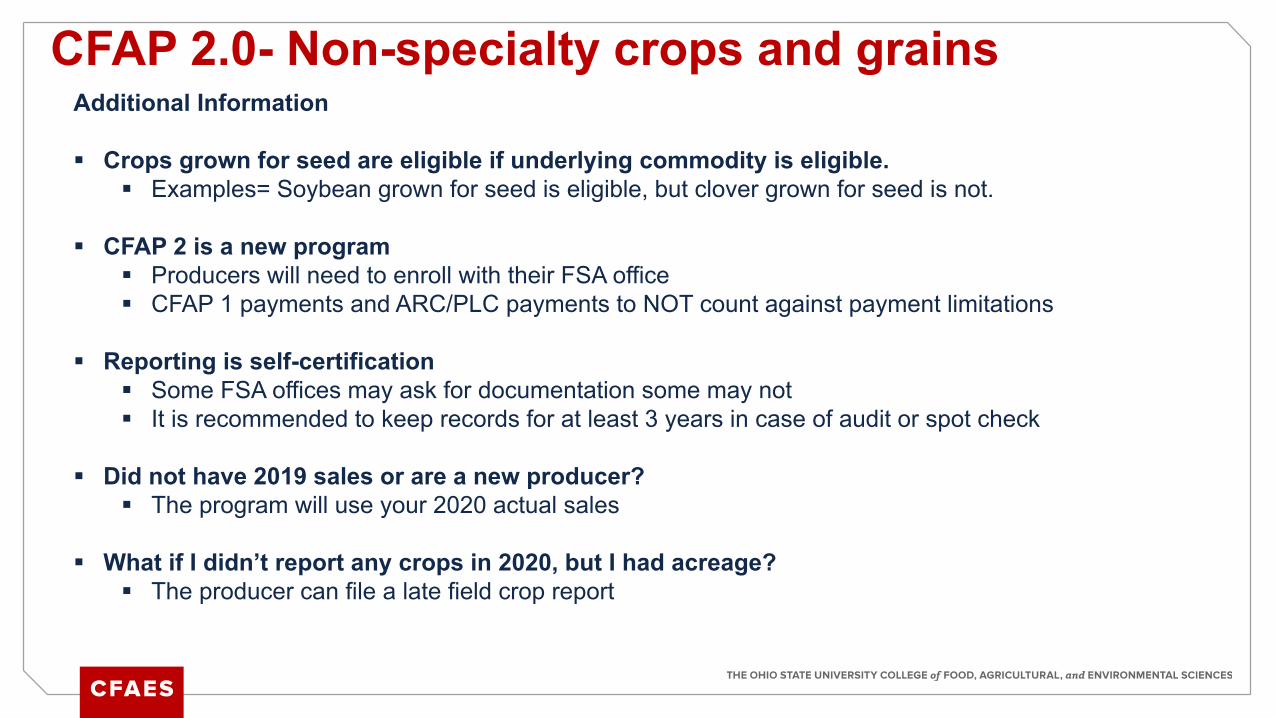
CFAP 2.0- Non-specialty crops and grainsAdditional Information
Crops grown for seed are eligible if underlying commodity is eligible. Examples= Soybean grown for seed is eligible, but clover grown for seed is not.
CFAP 2 is a new program Producers will need to enroll with their FSA office CFAP 1 payments and ARC/PLC payments to NOT count against payment limitations
Reporting is self-certification Some FSA offices may ask for documentation some may not It is recommended to keep records for at least 3 years in case of audit or spot check
Did not have 2019 sales or are a new producer? The program will use your 2020 actual sales
What if I didn’t report any crops in 2020, but I had acreage? The producer can file a late field crop report
CFAP 2.0- Non-specialty crops and grainsAdditional Information
Contract growers are eligible if they share in the ownership and risk of the crop are eligible:
For CFAP 2, “contract grower” is a person or legal entity who grows or produces an eligible commodity or livestock under contract for someone else. The contract grower’s income is dependent upon the successful production of a crop or livestock of offspring from livestock. The contract grower does not have ownership in the commodity or livestock and is not entitled to a share from sales proceeds of the commodity or livestock.
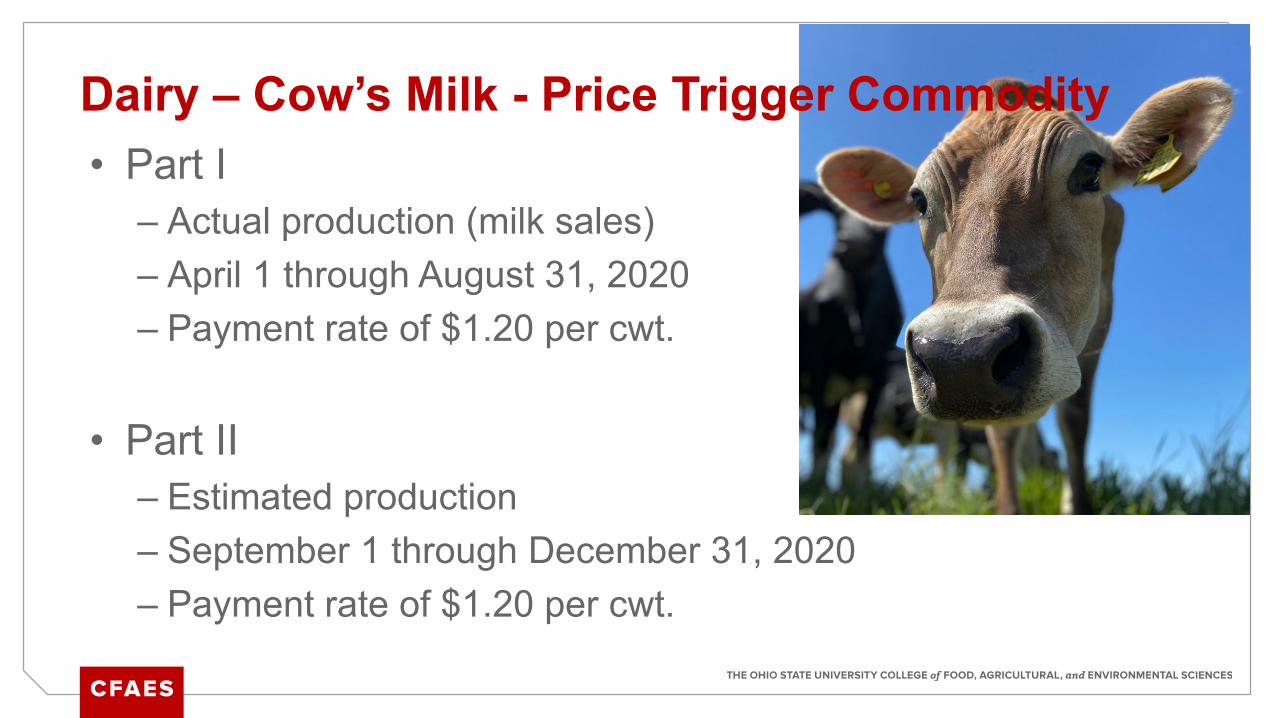
• Part I– Actual production (milk sales) – April 1 through August 31, 2020– Payment rate of $1.20 per cwt.
• Part II– Estimated production– September 1 through December 31, 2020– Payment rate of $1.20 per cwt.
Dairy – Cow’s Milk - Price Trigger Commodity
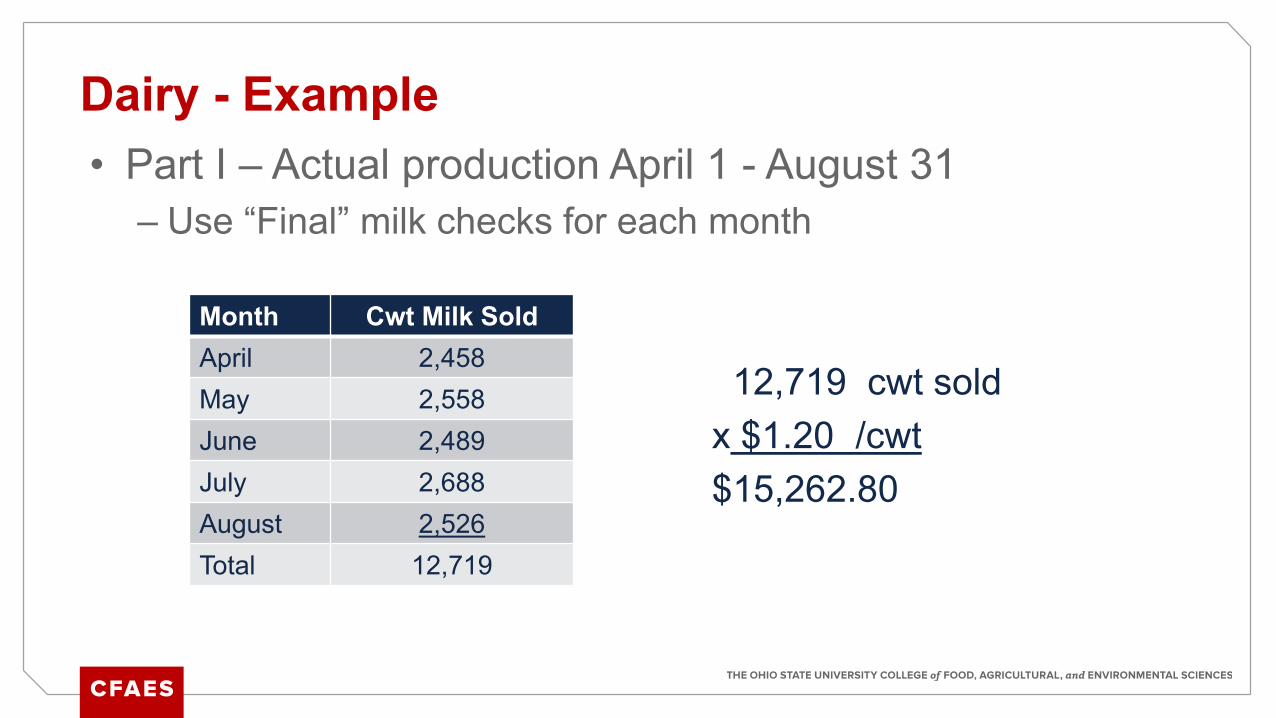
• Part I – Actual production April 1 - August 31– Use “Final” milk checks for each month
12,719 cwt soldx $1.20 /cwt$15,262.80
Dairy - Example
Month Cwt Milk SoldApril 2,458May 2,558June 2,489July 2,688August 2,526Total 12,719
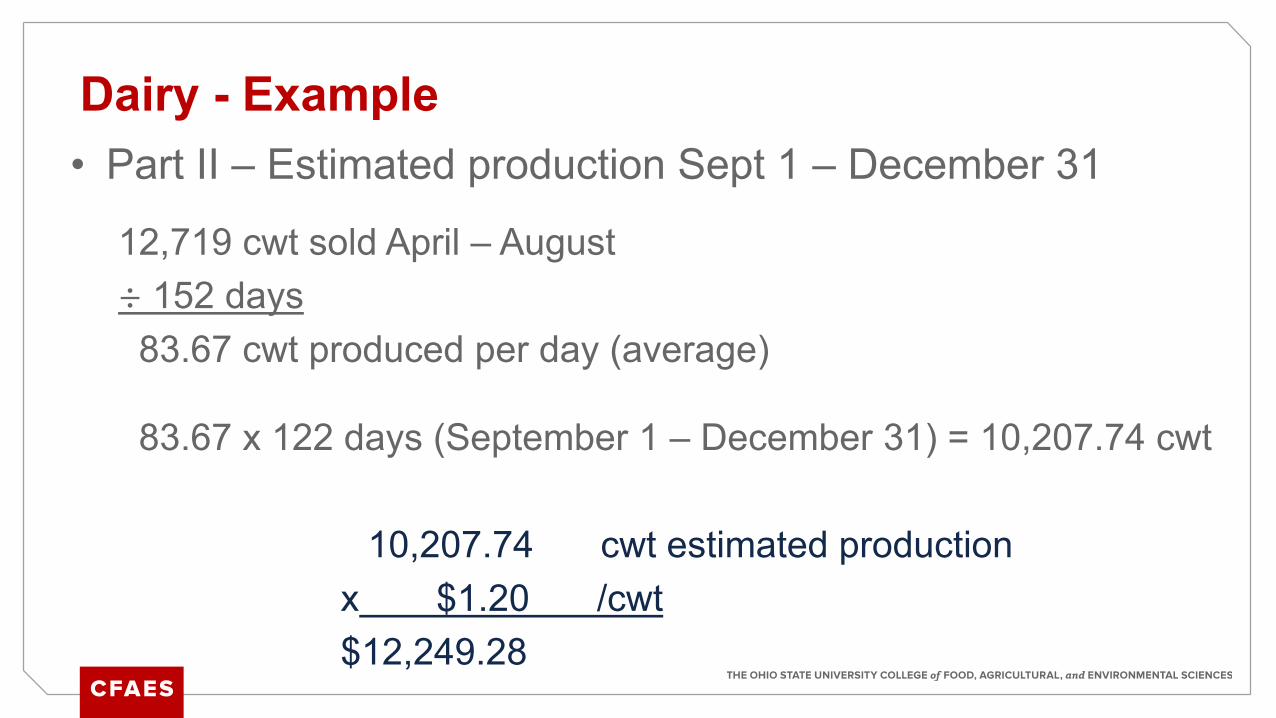
• Part II – Estimated production Sept 1 – December 31
12,719 cwt sold April – August÷ 152 days83.67 cwt produced per day (average)
83.67 x 122 days (September 1 – December 31) = 10,207.74 cwt
10,207.74 cwt estimated production x $1.20 /cwt$12,249.28
Dairy - Example
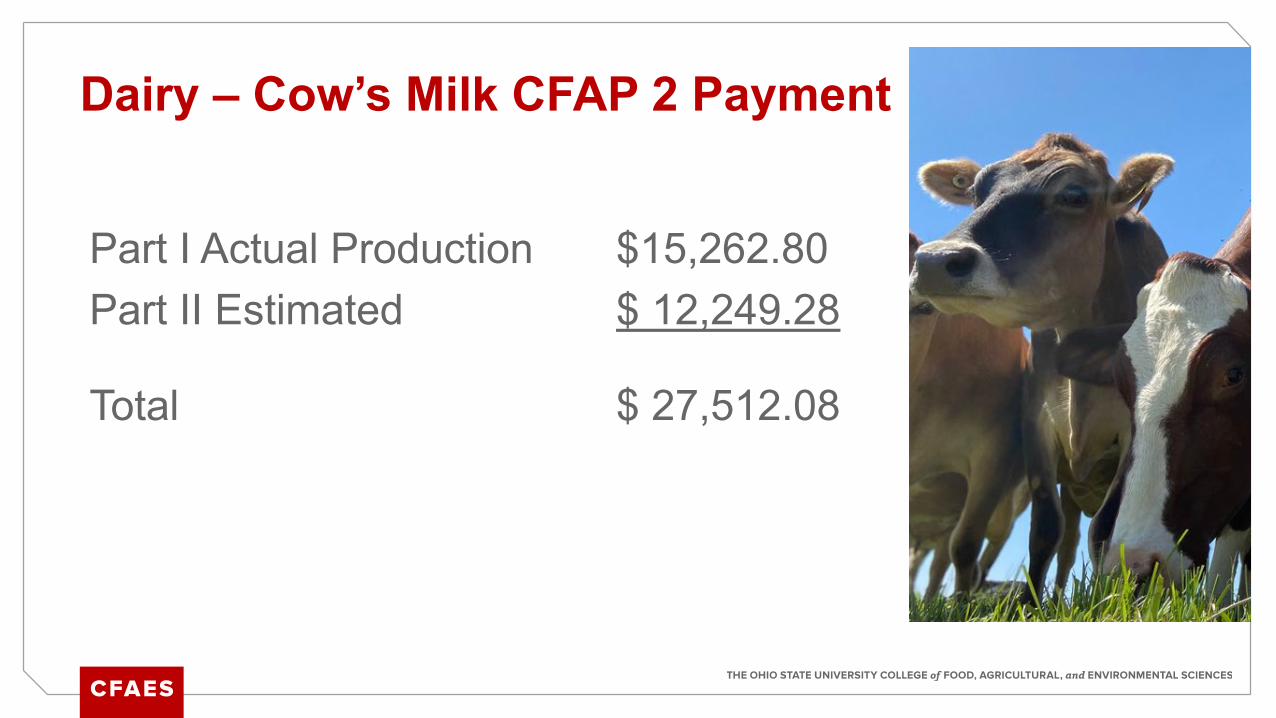
Part I Actual Production $15,262.80Part II Estimated $ 12,249.28
Total $ 27,512.08
Dairy – Cow’s Milk CFAP 2 Payment
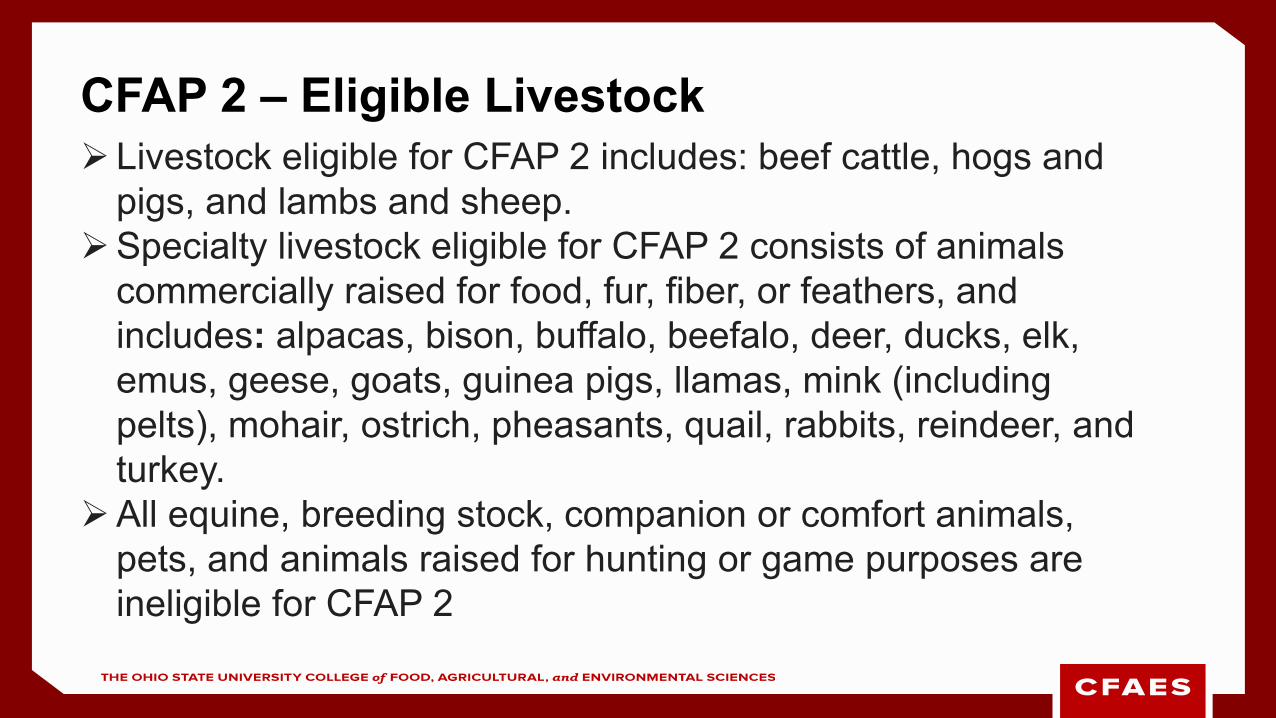
CFAP 2 – Eligible Livestock Livestock eligible for CFAP 2 includes: beef cattle, hogs and
pigs, and lambs and sheep.Specialty livestock eligible for CFAP 2 consists of animals
commercially raised for food, fur, fiber, or feathers, and includes: alpacas, bison, buffalo, beefalo, deer, ducks, elk, emus, geese, goats, guinea pigs, llamas, mink (including pelts), mohair, ostrich, pheasants, quail, rabbits, reindeer, and turkey.
All equine, breeding stock, companion or comfort animals, pets, and animals raised for hunting or game purposes are ineligible for CFAP 2
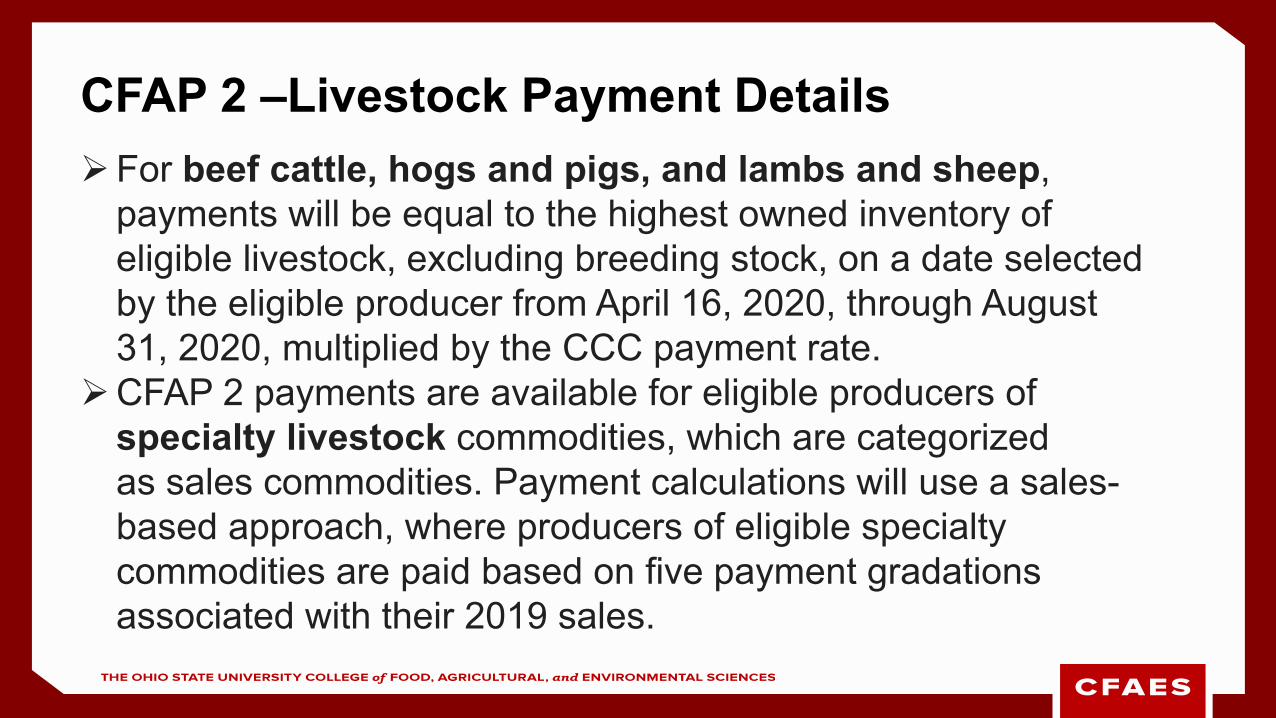
CFAP 2 –Livestock Payment DetailsFor beef cattle, hogs and pigs, and lambs and sheep,
payments will be equal to the highest owned inventory of eligible livestock, excluding breeding stock, on a date selected by the eligible producer from April 16, 2020, through August 31, 2020, multiplied by the CCC payment rate.
CFAP 2 payments are available for eligible producers of specialty livestock commodities, which are categorized as sales commodities. Payment calculations will use a sales-based approach, where producers of eligible specialty commodities are paid based on five payment gradations associated with their 2019 sales.
CFAP 2 – Livestock Payment Examples
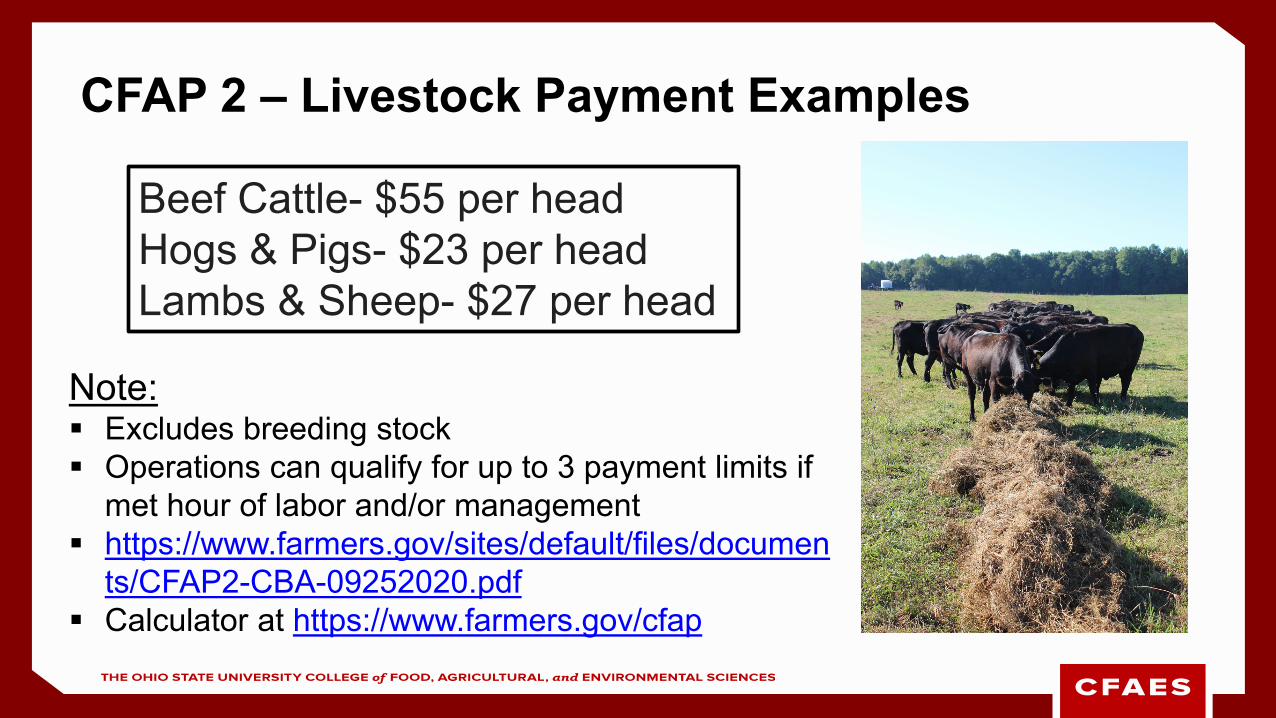
Beef Cattle- $55 per headHogs & Pigs- $23 per headLambs & Sheep- $27 per head
Note: Excludes breeding stock Operations can qualify for up to 3 payment limits if
met hour of labor and/or management https://www.farmers.gov/sites/default/files/documen
ts/CFAP2-CBA-09252020.pdf Calculator at https://www.farmers.gov/cfap
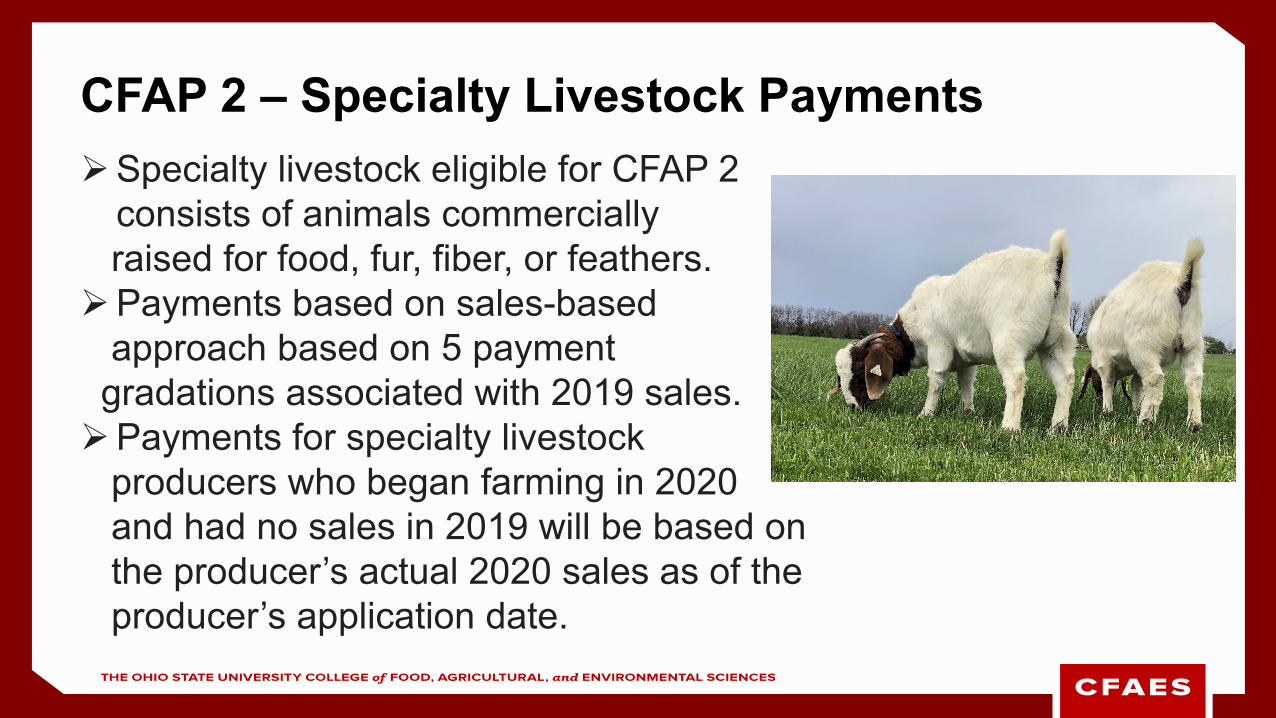
CFAP 2 – Specialty Livestock PaymentsSpecialty livestock eligible for CFAP 2
consists of animals commerciallyraised for food, fur, fiber, or feathers. Payments based on sales-based
approach based on 5 payment gradations associated with 2019 sales.Payments for specialty livestock
producers who began farming in 2020and had no sales in 2019 will be based on the producer’s actual 2020 sales as of the producer’s application date.
CFAP 2 – Specialty Livestock Payments
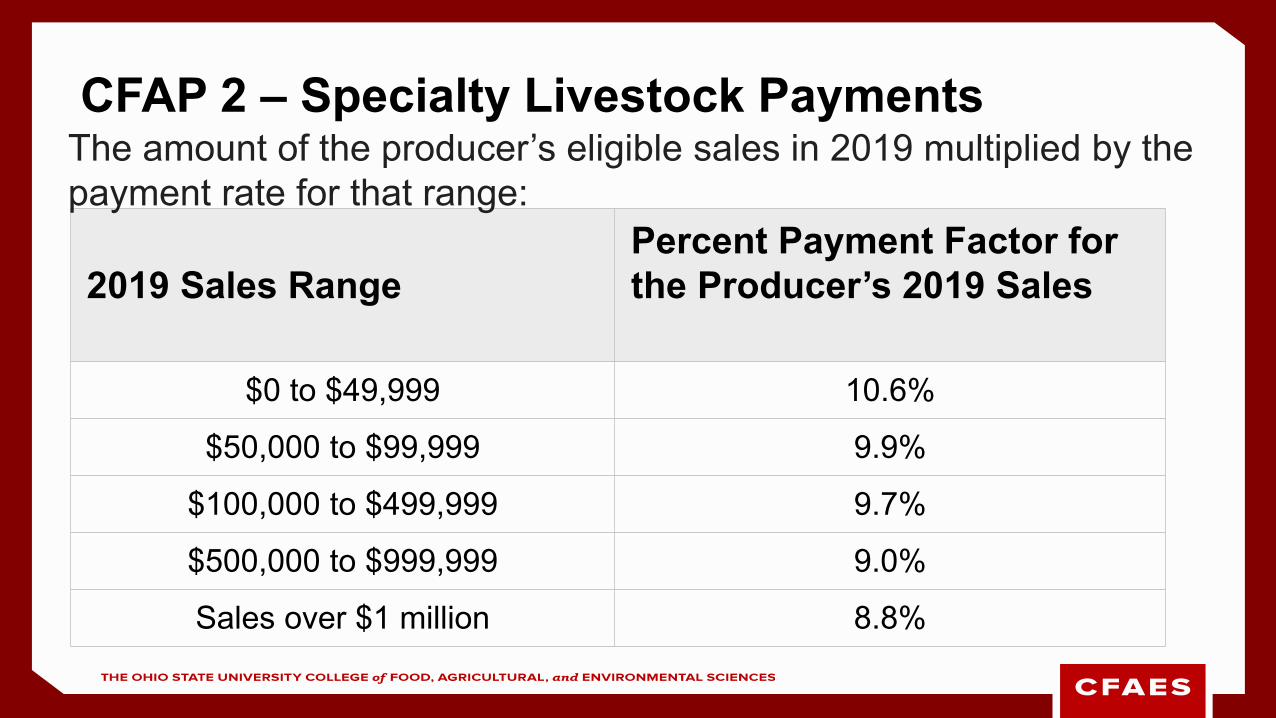
2019 Sales RangePercent Payment Factor for the Producer’s 2019 Sales
$0 to $49,999 10.6%
$50,000 to $99,999 9.9%
$100,000 to $499,999 9.7%
$500,000 to $999,999 9.0%
Sales over $1 million 8.8%
The amount of the producer’s eligible sales in 2019 multiplied by the payment rate for that range:
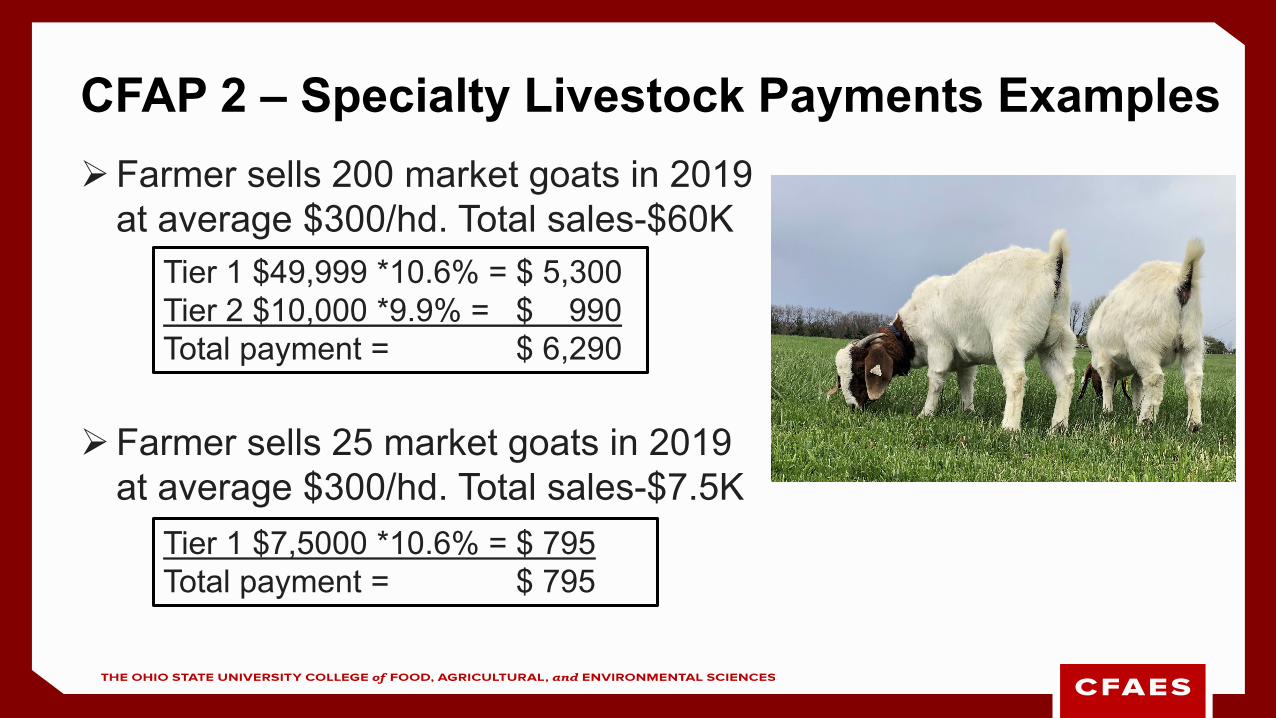
CFAP 2 – Specialty Livestock Payments ExamplesFarmer sells 200 market goats in 2019
at average $300/hd. Total sales-$60K
Farmer sells 25 market goats in 2019 at average $300/hd. Total sales-$7.5K
Tier 1 $49,999 *10.6% = $ 5,300Tier 2 $10,000 *9.9% = $ 990Total payment = $ 6,290
Tier 1 $7,5000 *10.6% = $ 795Total payment = $ 795
Legal Update
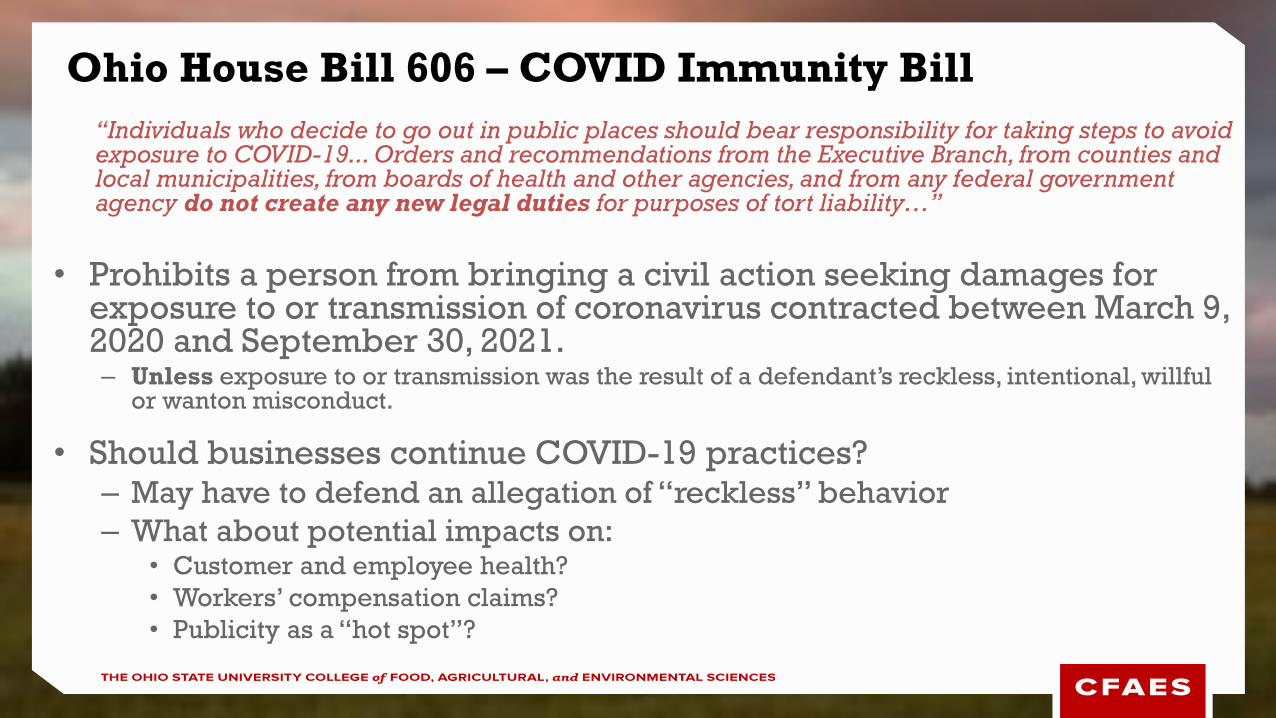
“Individuals who decide to go out in public places should bear responsibility for taking steps to avoid exposure to COVID-19... Orders and recommendations from the Executive Branch, from counties and local municipalities, from boards of health and other agencies, and from any federal government agency do not create any new legal duties for purposes of tort liability…”
• Prohibits a person from bringing a civil action seeking damages for exposure to or transmission of coronavirus contracted between March 9, 2020 and September 30, 2021.– Unless exposure to or transmission was the result of a defendant’s reckless, intentional, willful
or wanton misconduct.
• Should businesses continue COVID-19 practices?– May have to defend an allegation of “reckless” behavior– What about potential impacts on:
• Customer and employee health?• Workers’ compensation claims?• Publicity as a “hot spot”?
Ohio House Bill 606 – COVID Immunity Bill
• Overhaul of Ohio’s petition ditch law – HB 340– Aligning county engineer and SWCD timelines and processes– Technical practices incorporated into law– Language edit
• Purple paint bill – SB 290– Purple paint markings can designate property boundaries
Other Ohio legislation on the move
• Enlist Duo back in court– Registration renewed except for impact on monarch butterflies– Request for “en banc” review
• New registration applications for Engenia and XtendiMax are back at EPA; also reviewing re-registration of Tavium– Approval in time for 2021 season?– Bayer’s “plant with confidence” offer:
• Price reduction for purchases of RR 2Xtend ($7/unit) and XtendFlexsoybeans ($3/unit) if XtendiMax or OTT dicamba is not approved for registration by Feb. 20, 2021.
Pesticide/herbicide registration battles
Crop Enterprise BudgetsOhio Cropland Values & Cash Rents ‘19-20
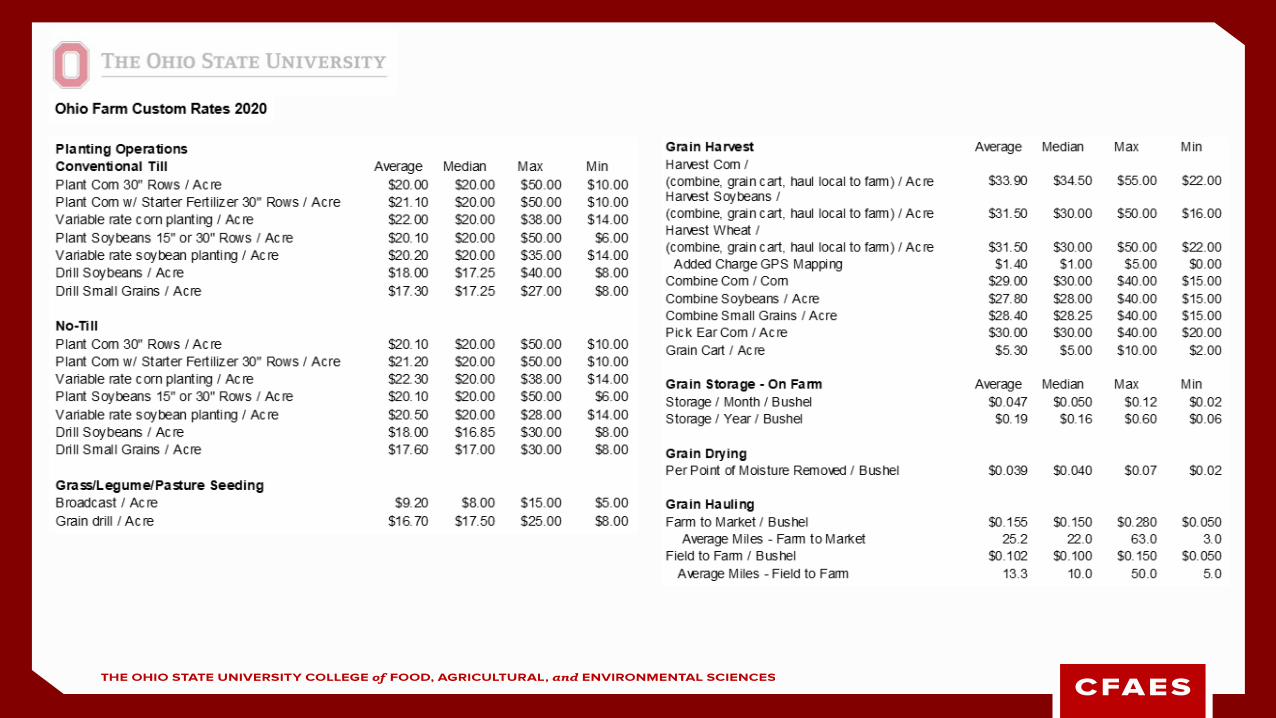
Ohio Farm Custom Rates 2020
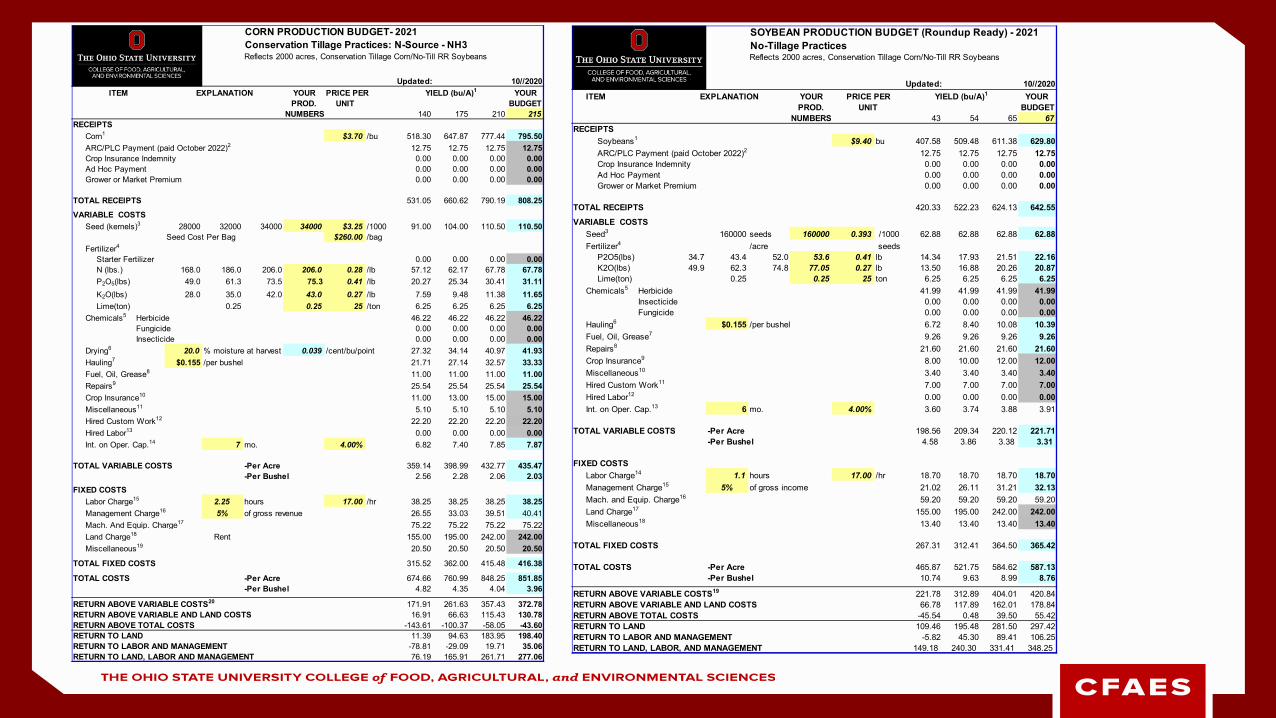
CORN PRODUCTION BUDGET- 2021Conservation Tillage Practices: N-Source - NH3Reflects 2000 acres, Conservation Tillage Corn/No-Till RR Soybeans
Updated:YOUR PRICE PER YIELD (bu/A)1 YOURPROD. UNIT BUDGET
NUMBERS 140 175 210 215RECEIPTS
Corn1 $3.70 /bu 518.30 647.87 777.44 795.50ARC/PLC Payment (paid October 2022)2 12.75 12.75 12.75 12.75Crop Insurance Indemnity 0.00 0.00 0.00 0.00Ad Hoc Payment 0.00 0.00 0.00 0.00Grower or Market Premium 0.00 0.00 0.00 0.00
TOTAL RECEIPTS 531.05 660.62 790.19 808.25VARIABLE COSTS
Seed (kernels)3 28000 32000 34000 34000 $3.25 /1000 91.00 104.00 110.50 110.50Seed Cost Per Bag $260.00 /bag
Fertilizer4
Starter Fertilizer 0.00 0.00 0.00 0.00N (lbs.) 168.0 186.0 206.0 206.0 0.28 /lb 57.12 62.17 67.78 67.78P2O5(lbs) 49.0 61.3 73.5 75.3 0.41 /lb 20.27 25.34 30.41 31.11K2O(lbs) 28.0 35.0 42.0 43.0 0.27 /lb 7.59 9.48 11.38 11.65Lime(ton) 0.25 0.25 25 /ton 6.25 6.25 6.25 6.25
Chemicals5 Herbicide 46.22 46.22 46.22 46.22Fungicide 0.00 0.00 0.00 0.00Insecticide 0.00 0.00 0.00 0.00
Drying6 20.0 % moisture at harvest 0.039 /cent/bu/point 27.32 34.14 40.97 41.93Hauling7 $0.155 /per bushel 21.71 27.14 32.57 33.33Fuel, Oil, Grease8 11.00 11.00 11.00 11.00Repairs9 25.54 25.54 25.54 25.54Crop Insurance10 11.00 13.00 15.00 15.00Miscellaneous11 5.10 5.10 5.10 5.10Hired Custom Work12 22.20 22.20 22.20 22.20Hired Labor13 0.00 0.00 0.00 0.00Int. on Oper. Cap.14 7 mo. 4.00% 6.82 7.40 7.85 7.87
TOTAL VARIABLE COSTS -Per Acre 359.14 398.99 432.77 435.47-Per Bushel 2.56 2.28 2.06 2.03
FIXED COSTSLabor Charge15 2.25 hours 17.00 /hr 38.25 38.25 38.25 38.25Management Charge16 5% of gross revenue 26.55 33.03 39.51 40.41Mach. And Equip. Charge17 75.22 75.22 75.22 75.22Land Charge18 Rent 155.00 195.00 242.00 242.00Miscellaneous19 20.50 20.50 20.50 20.50
TOTAL FIXED COSTS 315.52 362.00 415.48 416.38
TOTAL COSTS -Per Acre 674.66 760.99 848.25 851.85-Per Bushel 4.82 4.35 4.04 3.96
RETURN ABOVE VARIABLE COSTS20 171.91 261.63 357.43 372.78RETURN ABOVE VARIABLE AND LAND COSTS 16.91 66.63 115.43 130.78RETURN ABOVE TOTAL COSTS -143.61 -100.37 -58.05 -43.60RETURN TO LAND 11.39 94.63 183.95 198.40RETURN TO LABOR AND MANAGEMENT -78.81 -29.09 19.71 35.06RETURN TO LAND, LABOR AND MANAGEMENT 76.19 165.91 261.71 277.06
ITEM EXPLANATION10//2020
. SOYBEAN PRODUCTION BUDGET (Roundup Ready) - 2021No-Tillage PracticesReflects 2000 acres, Conservation Tillage Corn/No-Till RR Soybeans
Updated:ITEM YOUR YOUR
PROD. BUDGETNUMBERS 43 54 65 67
RECEIPTSSoybeans1 $9.40 bu 407.58 509.48 611.38 629.80ARC/PLC Payment (paid October 2022)2 12.75 12.75 12.75 12.75Crop Insurance Indemnity 0.00 0.00 0.00 0.00Ad Hoc Payment 0.00 0.00 0.00 0.00Grower or Market Premium 0.00 0.00 0.00 0.00
TOTAL RECEIPTS 420.33 522.23 624.13 642.55VARIABLE COSTS
Seed3 160000 seeds 160000 0.393 /1000 62.88 62.88 62.88 62.88Fertilizer4 /acre seeds
P2O5(lbs) 34.7 43.4 52.0 53.6 0.41 lb 14.34 17.93 21.51 22.16K2O(lbs) 49.9 62.3 74.8 77.05 0.27 lb 13.50 16.88 20.26 20.87Lime(ton) 0.25 0.25 25 ton 6.25 6.25 6.25 6.25
Chemicals5 Herbicide 41.99 41.99 41.99 41.99Insecticide 0.00 0.00 0.00 0.00Fungicide 0.00 0.00 0.00 0.00
Hauling6 $0.155 /per bushel 6.72 8.40 10.08 10.39Fuel, Oil, Grease7 9.26 9.26 9.26 9.26Repairs8 21.60 21.60 21.60 21.60Crop Insurance9 8.00 10.00 12.00 12.00Miscellaneous10 3.40 3.40 3.40 3.40Hired Custom Work11 7.00 7.00 7.00 7.00Hired Labor12 0.00 0.00 0.00 0.00Int. on Oper. Cap.13 6 mo. 4.00% 3.60 3.74 3.88 3.91
TOTAL VARIABLE COSTS -Per Acre 198.56 209.34 220.12 221.71-Per Bushel 4.58 3.86 3.38 3.31
FIXED COSTSLabor Charge14 1.1 hours 17.00 /hr 18.70 18.70 18.70 18.70Management Charge15 5% of gross income 21.02 26.11 31.21 32.13Mach. and Equip. Charge16 59.20 59.20 59.20 59.20Land Charge17 155.00 195.00 242.00 242.00Miscellaneous18 13.40 13.40 13.40 13.40
TOTAL FIXED COSTS 267.31 312.41 364.50 365.42
TOTAL COSTS -Per Acre 465.87 521.75 584.62 587.13-Per Bushel 10.74 9.63 8.99 8.76
RETURN ABOVE VARIABLE COSTS19 221.78 312.89 404.01 420.84RETURN ABOVE VARIABLE AND LAND COSTS 66.78 117.89 162.01 178.84RETURN ABOVE TOTAL COSTS -45.54 0.48 39.50 55.42RETURN TO LAND 109.46 195.48 281.50 297.42RETURN TO LABOR AND MANAGEMENT -5.82 45.30 89.41 106.25RETURN TO LAND, LABOR, AND MANAGEMENT 149.18 240.30 331.41 348.25
EXPLANATION PRICE PERUNIT
YIELD (bu/A)110//2020
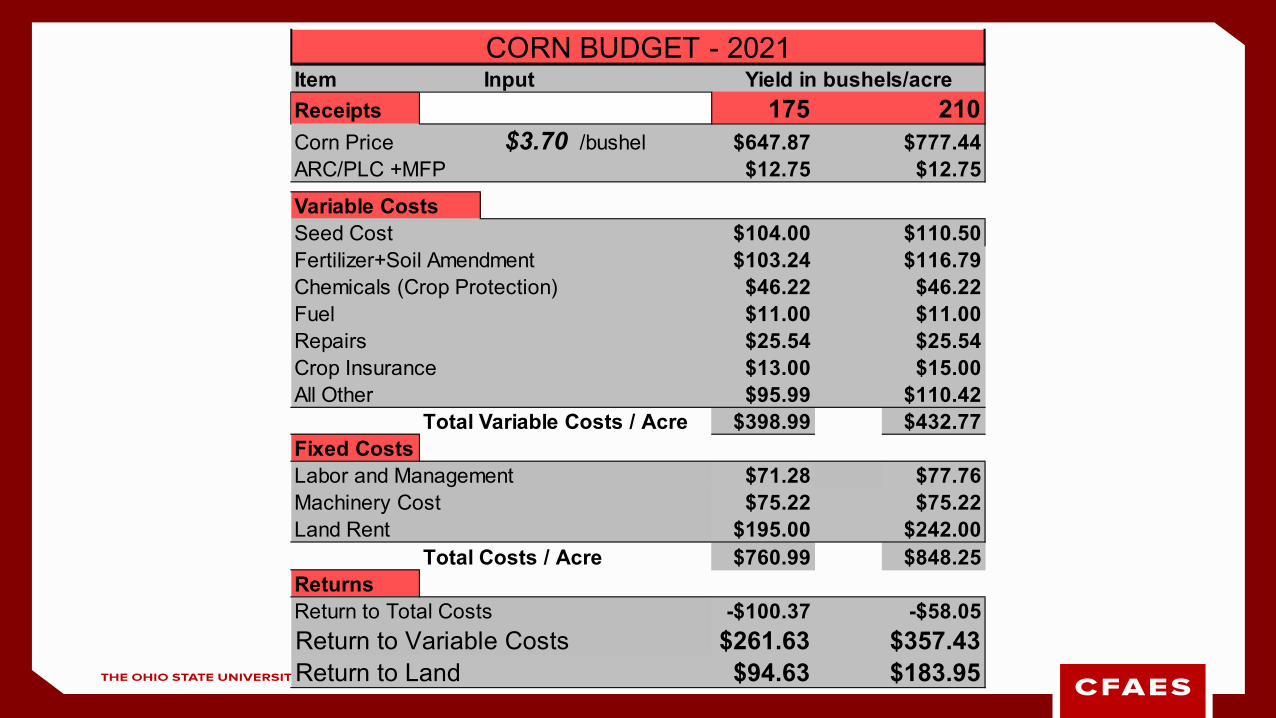
Receipts 175 210Corn Price $3.70 /bushel $647.87 $777.44ARC/PLC +MFP $12.75 $12.75Variable CostsSeed Cost $104.00 $110.50Fertilizer+Soil Amendment $103.24 $116.79Chemicals (Crop Protection) $46.22 $46.22Fuel $11.00 $11.00Repairs $25.54 $25.54Crop Insurance $13.00 $15.00All Other $95.99 $110.42
Total Variable Costs / Acre $398.99 $432.77Fixed CostsLabor and Management $71.28 $77.76Machinery Cost $75.22 $75.22Land Rent $195.00 $242.00
Total Costs / Acre $760.99 $848.25ReturnsReturn to Total Costs -$100.37 -$58.05Return to Variable Costs $261.63 $357.43Return to Land $94.63 $183.95
CORN BUDGET - 2021Item Input Yield in bushels/acre
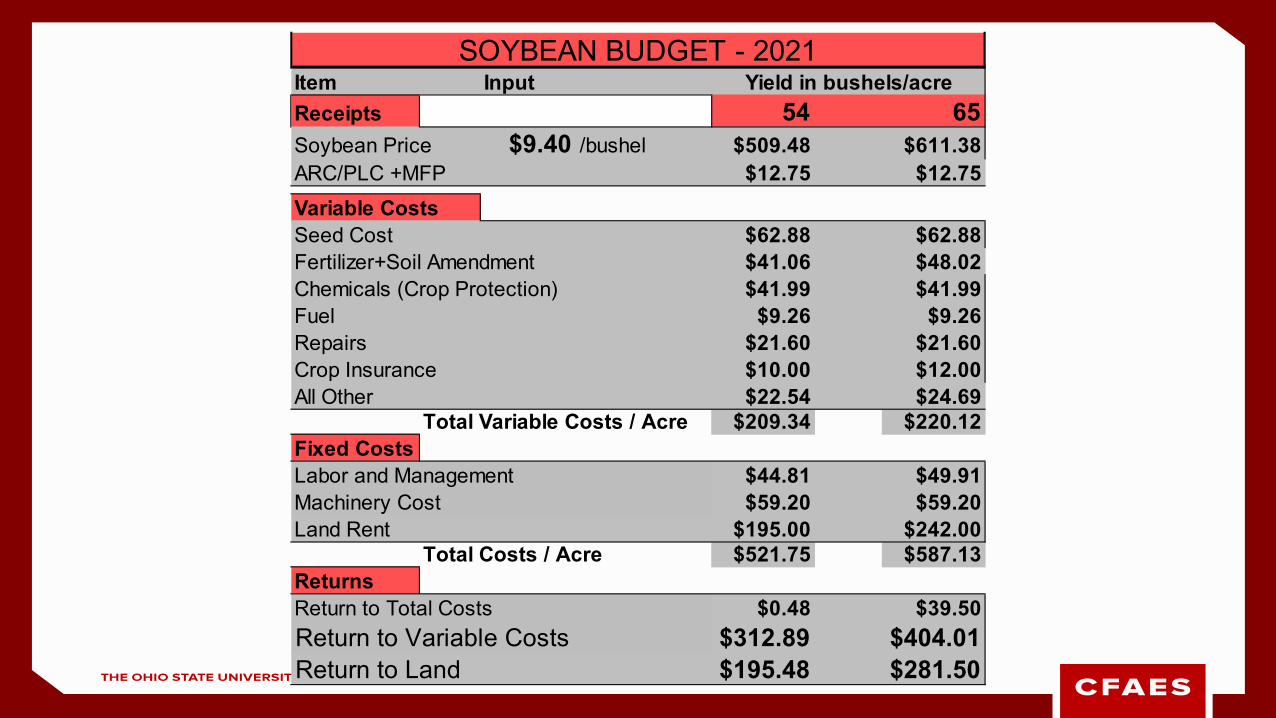
Receipts 54 65Soybean Price $9.40 /bushel $509.48 $611.38ARC/PLC +MFP $12.75 $12.75Variable CostsSeed Cost $62.88 $62.88Fertilizer+Soil Amendment $41.06 $48.02Chemicals (Crop Protection) $41.99 $41.99Fuel $9.26 $9.26Repairs $21.60 $21.60Crop Insurance $10.00 $12.00All Other $22.54 $24.69
Total Variable Costs / Acre $209.34 $220.12Fixed CostsLabor and Management $44.81 $49.91Machinery Cost $59.20 $59.20Land Rent $195.00 $242.00
Total Costs / Acre $521.75 $587.13ReturnsReturn to Total Costs $0.48 $39.50Return to Variable Costs $312.89 $404.01Return to Land $195.48 $281.50
SOYBEAN BUDGET - 2021Item Input Yield in bushels/acre
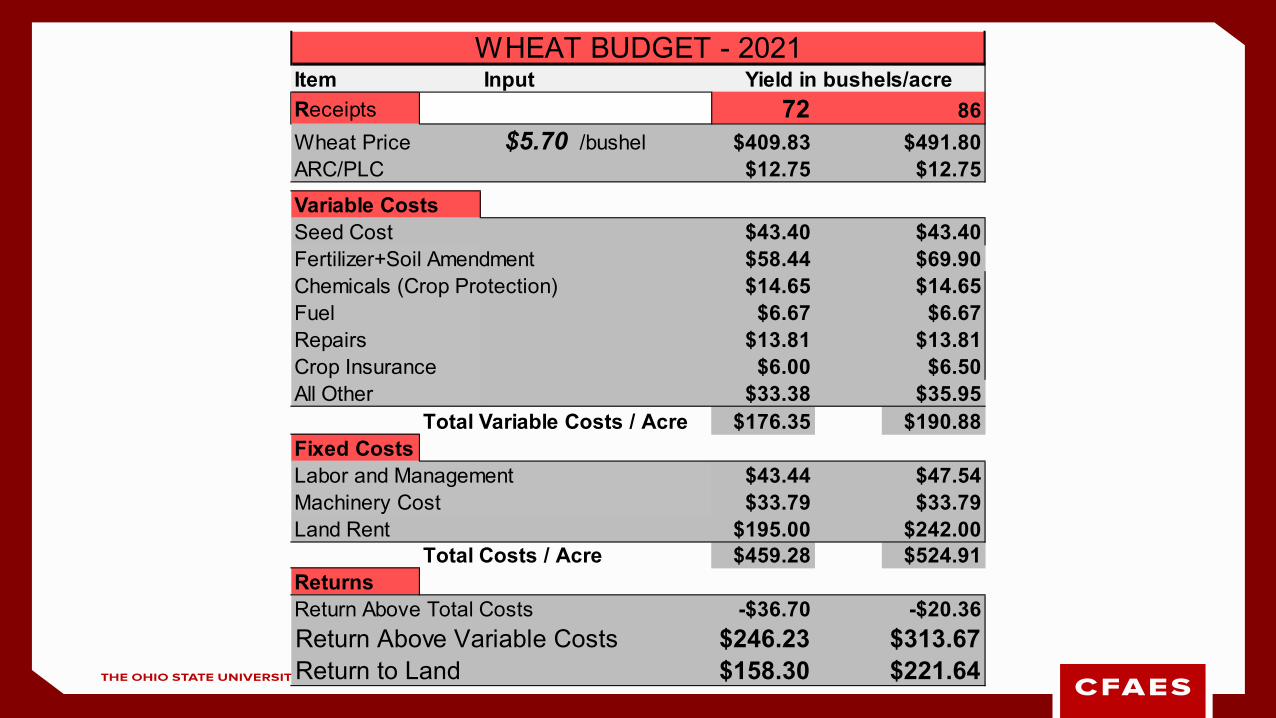
Receipts 72 86Wheat Price $5.70 /bushel $409.83 $491.80ARC/PLC $12.75 $12.75Variable CostsSeed Cost $43.40 $43.40Fertilizer+Soil Amendment $58.44 $69.90Chemicals (Crop Protection) $14.65 $14.65Fuel $6.67 $6.67Repairs $13.81 $13.81Crop Insurance $6.00 $6.50All Other $33.38 $35.95
Total Variable Costs / Acre $176.35 $190.88Fixed CostsLabor and Management $43.44 $47.54Machinery Cost $33.79 $33.79Land Rent $195.00 $242.00
Total Costs / Acre $459.28 $524.91ReturnsReturn Above Total Costs -$36.70 -$20.36Return Above Variable Costs $246.23 $313.67Return to Land $158.30 $221.64
WHEAT BUDGET - 2021Item Input Yield in bushels/acre
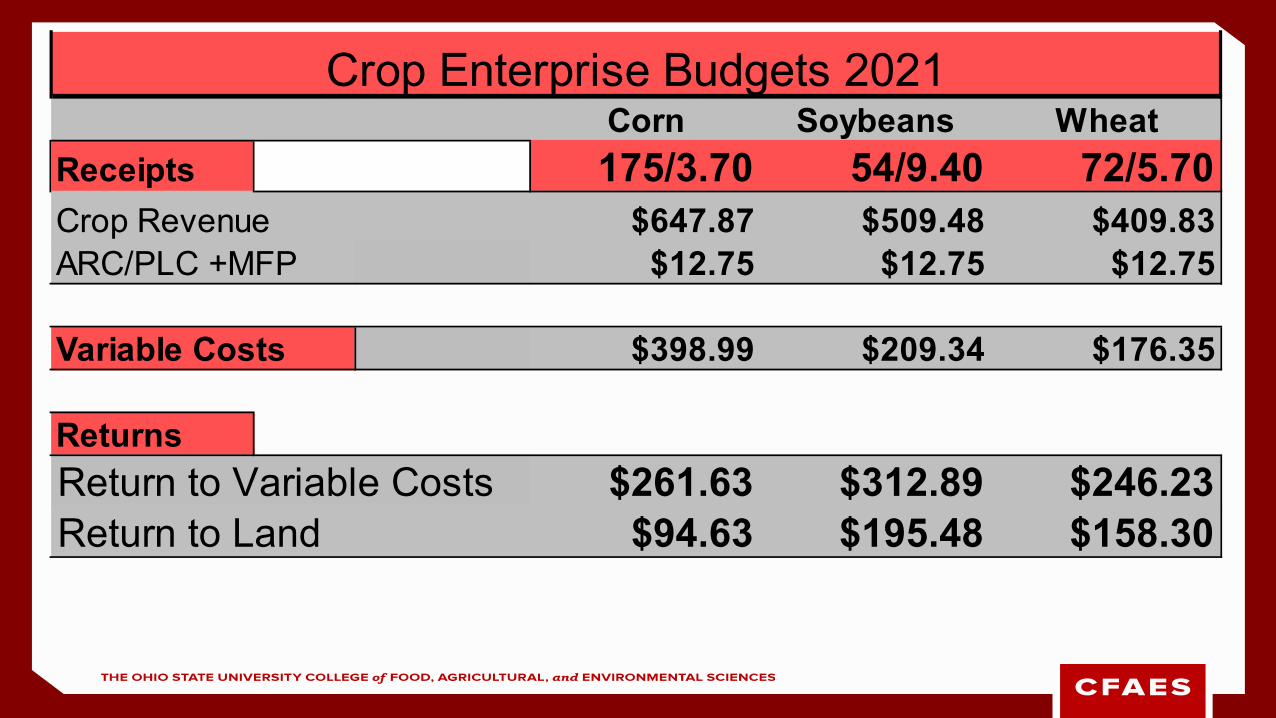
Corn Soybeans WheatReceipts 175/3.70 54/9.40 72/5.70Crop Revenue $647.87 $509.48 $409.83ARC/PLC +MFP $12.75 $12.75 $12.75
Variable Costs $398.99 $209.34 $176.35
ReturnsReturn to Variable Costs $261.63 $312.89 $246.23Return to Land $94.63 $195.48 $158.30
Crop Enterprise Budgets 2021
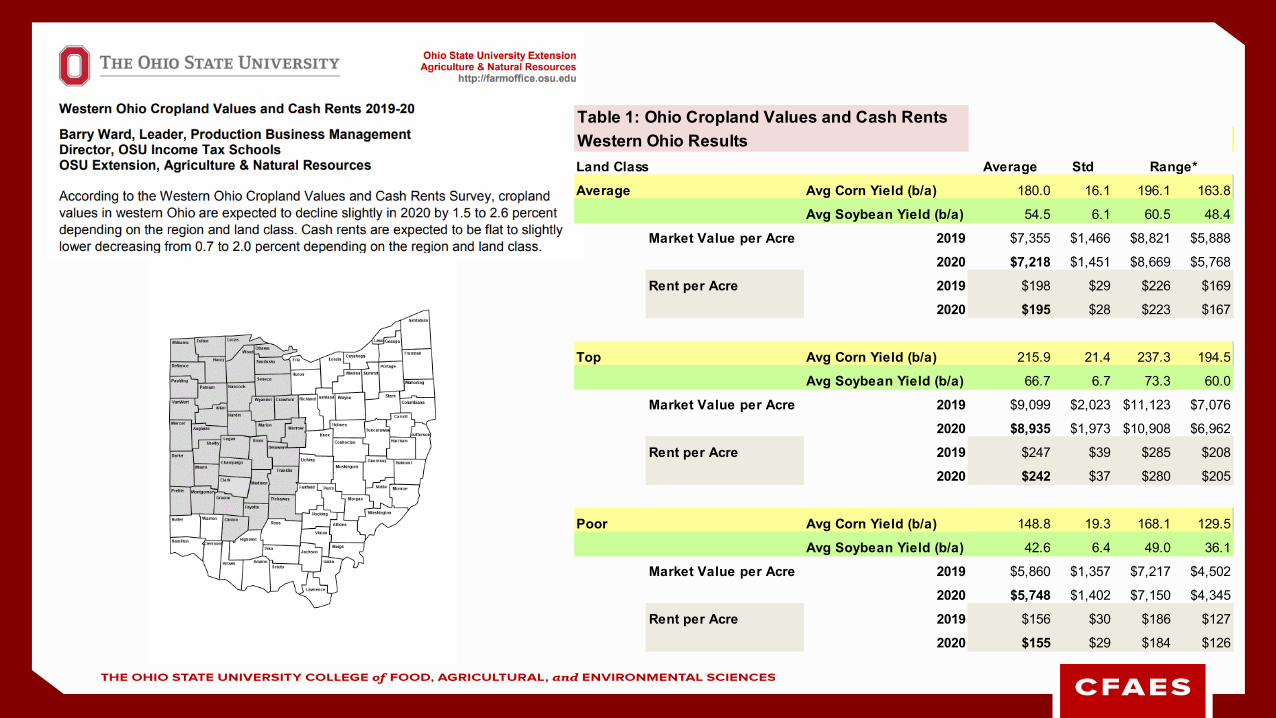
Table 1: Ohio Cropland Values and Cash RentsWestern Ohio ResultsLand Class Average StdAverage Avg Corn Yield (b/a) 180.0 16.1 196.1 163.8
Avg Soybean Yield (b/a) 54.5 6.1 60.5 48.4
Market Value per Acre 2019 $7,355 $1,466 $8,821 $5,888
2020 $7,218 $1,451 $8,669 $5,768
Rent per Acre 2019 $198 $29 $226 $169
2020 $195 $28 $223 $167
Top Avg Corn Yield (b/a) 215.9 21.4 237.3 194.5
Avg Soybean Yield (b/a) 66.7 6.7 73.3 60.0
Market Value per Acre 2019 $9,099 $2,023 $11,123 $7,076
2020 $8,935 $1,973 $10,908 $6,962
Rent per Acre 2019 $247 $39 $285 $208
2020 $242 $37 $280 $205
Poor Avg Corn Yield (b/a) 148.8 19.3 168.1 129.5
Avg Soybean Yield (b/a) 42.6 6.4 49.0 36.1
Market Value per Acre 2019 $5,860 $1,357 $7,217 $4,502
2020 $5,748 $1,402 $7,150 $4,345
Rent per Acre 2019 $156 $30 $186 $127
2020 $155 $29 $184 $126
Range*
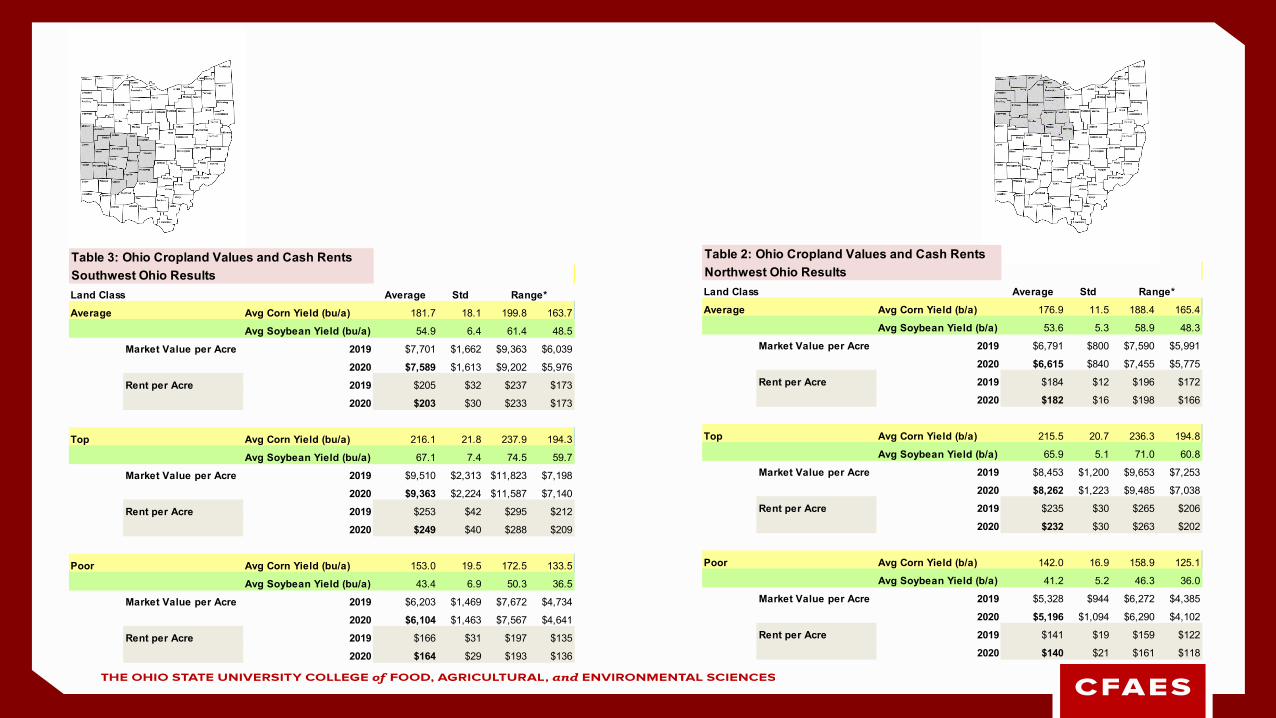
Table 2: Ohio Cropland Values and Cash RentsNorthwest Ohio ResultsLand Class Average StdAverage Avg Corn Yield (b/a) 176.9 11.5 188.4 165.4
Avg Soybean Yield (b/a) 53.6 5.3 58.9 48.3
Market Value per Acre 2019 $6,791 $800 $7,590 $5,991
2020 $6,615 $840 $7,455 $5,775
Rent per Acre 2019 $184 $12 $196 $172
2020 $182 $16 $198 $166
Top Avg Corn Yield (b/a) 215.5 20.7 236.3 194.8
Avg Soybean Yield (b/a) 65.9 5.1 71.0 60.8
Market Value per Acre 2019 $8,453 $1,200 $9,653 $7,253
2020 $8,262 $1,223 $9,485 $7,038
Rent per Acre 2019 $235 $30 $265 $206
2020 $232 $30 $263 $202
Poor Avg Corn Yield (b/a) 142.0 16.9 158.9 125.1
Avg Soybean Yield (b/a) 41.2 5.2 46.3 36.0
Market Value per Acre 2019 $5,328 $944 $6,272 $4,385
2020 $5,196 $1,094 $6,290 $4,102
Rent per Acre 2019 $141 $19 $159 $122
2020 $140 $21 $161 $118
Range*
Table 3: Ohio Cropland Values and Cash RentsSouthwest Ohio ResultsLand Class Average StdAverage Avg Corn Yield (bu/a) 181.7 18.1 199.8 163.7
Avg Soybean Yield (bu/a) 54.9 6.4 61.4 48.5
Market Value per Acre 2019 $7,701 $1,662 $9,363 $6,039
2020 $7,589 $1,613 $9,202 $5,976
Rent per Acre 2019 $205 $32 $237 $173
2020 $203 $30 $233 $173
Top Avg Corn Yield (bu/a) 216.1 21.8 237.9 194.3
Avg Soybean Yield (bu/a) 67.1 7.4 74.5 59.7
Market Value per Acre 2019 $9,510 $2,313 $11,823 $7,198
2020 $9,363 $2,224 $11,587 $7,140
Rent per Acre 2019 $253 $42 $295 $212
2020 $249 $40 $288 $209
Poor Avg Corn Yield (bu/a) 153.0 19.5 172.5 133.5
Avg Soybean Yield (bu/a) 43.4 6.9 50.3 36.5
Market Value per Acre 2019 $6,203 $1,469 $7,672 $4,734
2020 $6,104 $1,463 $7,567 $4,641
Rent per Acre 2019 $166 $31 $197 $135
2020 $164 $29 $193 $136
Range*
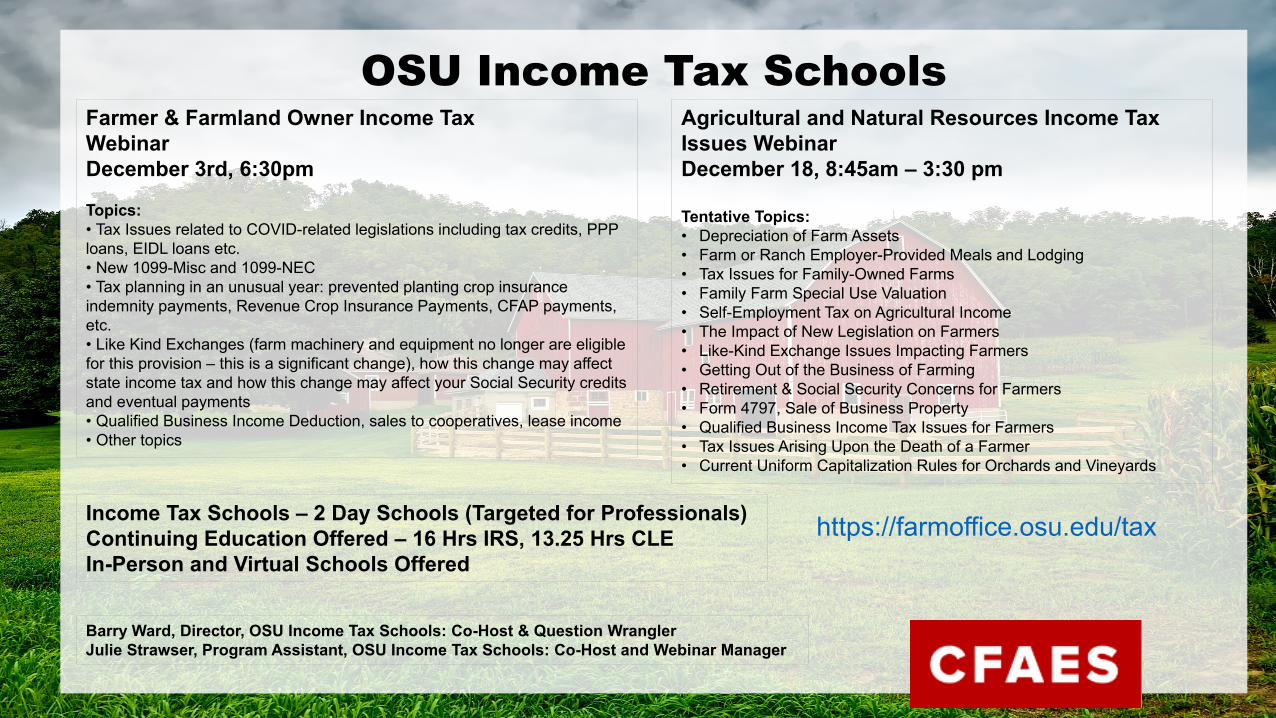
OSU Income Tax Schools
https://farmoffice.osu.edu/tax
Farmer & Farmland Owner Income TaxWebinarDecember 3rd, 6:30pm
Topics:• Tax Issues related to COVID-related legislations including tax credits, PPP loans, EIDL loans etc.• New 1099-Misc and 1099-NEC• Tax planning in an unusual year: prevented planting crop insurance indemnity payments, Revenue Crop Insurance Payments, CFAP payments, etc.• Like Kind Exchanges (farm machinery and equipment no longer are eligible for this provision – this is a significant change), how this change may affect state income tax and how this change may affect your Social Security credits and eventual payments• Qualified Business Income Deduction, sales to cooperatives, lease income• Other topics
Agricultural and Natural Resources Income Tax Issues WebinarDecember 18, 8:45am – 3:30 pm
Tentative Topics:• Depreciation of Farm Assets• Farm or Ranch Employer-Provided Meals and Lodging• Tax Issues for Family-Owned Farms• Family Farm Special Use Valuation• Self-Employment Tax on Agricultural Income• The Impact of New Legislation on Farmers• Like-Kind Exchange Issues Impacting Farmers• Getting Out of the Business of Farming• Retirement & Social Security Concerns for Farmers• Form 4797, Sale of Business Property• Qualified Business Income Tax Issues for Farmers• Tax Issues Arising Upon the Death of a Farmer• Current Uniform Capitalization Rules for Orchards and Vineyards
Income Tax Schools – 2 Day Schools (Targeted for Professionals)Continuing Education Offered – 16 Hrs IRS, 13.25 Hrs CLEIn-Person and Virtual Schools Offered
Barry Ward, Director, OSU Income Tax Schools: Co-Host & Question Wrangler Julie Strawser, Program Assistant, OSU Income Tax Schools: Co-Host and Webinar Manager
• Barry Ward – 614.688.3959 or [email protected]
• Peggy Hall– 937.645.3123 or [email protected]
• Ben Brown– 614.688.8686 or [email protected]
• Dianne Shoemaker– 330.533.5538 or [email protected]
• David Marrison– 740.622.2265 or [email protected]
• Julie Strawser– 614.292.2433 or [email protected]
Contact Information