Embed Size (px)
Citation preview

Great Expectations: Ethnicity, Performance, andUgandan Voters∗
Elizabeth CarlsonPhD Candidate
Department of Political ScienceUCLA
April 22, 2010
Abstract
When voters vote ethnically, as they do in many African countries, what is the reason? Dovoters prefer coethnics because of ethnic pride? Or is ethnicity as a proxy for performance? Iuse a voting simulation experiment in Uganda to investigate the underlying rationale for ethnicvoting. I find evidence that voters anticipate more future goods from a coethnic presidentialcandidate. Most strikingly, I find that coethnicity matters to voters only when the candidate hasa record of prior goods provisions and, similarly, that record matters most when the candidateis coethnic. Furthermore, those types of voters who would be most likely to receive ethnicpatronage are those who are most likely to vote ethnically. I confirm this finding by askingrespondents to make predictions about the future performance of coethnic and non-coethniccandidates. I find that respondents expect more future goods from coethnics than from non-coethnic candidates.
1 IntroductionIn Uganda, as elsewhere in Africa, there is an ethnic pattern to voting. Though President Musevenigarners support from voters throughout the country, the president’s tribe,1 the Banyankole, votefor him in numbers much higher than the public as a whole. Tribes throughout the Western region,
∗This project is funded by the National Science Foundation. The author thanks Daniel Posner, Miriam Golden,Edmond Keller, Lynn Vavreck and Craig McIntosh for support and feedback over the course of the project; the mem-bers of the Working Group on African Political Economy for their invaluable suggestions; Mountains of the MoonUniversity for allowing me to be an affiliate of their university; and, especially, Kenneth Ekode and the rest of myresearch team for their hard work.
1I am aware of the negative connotations of the word ‘tribe’ in Western analysis. I use it in this context because itis the best term for the concept I am trying to convey, and will generate the least confusion for African readers. In East
1

most of whom are related to the Banyankole, also prefer Museveni at levels approaching or ex-ceeding 80%. The Uganda panel of the Afrobarometer survey finds that ethnicity has a significant,independent effect on vote choice controlling for other candidate characteristics, such as policy orperformance.[Bratton et al., 2004] It seems that, in the words of one particularly candid respondenton this project, “I don’t love to elect someone from another tribe. I love the people of my tribe.”
What is the reason for the apparent preference among voters for a candidate of their own tribe?Is voting an expressive gesture based on ethnic affiliation and pride? Or do voters see ethnicity as aproxy for the performance of the candidate? We care about voters’ motivations because they haveimplications for governance. Of particular concern is whether ethnic cues override more “rational”considerations about the candidate’s performance in office, undermining the ability of voters tohold government accountable. Dowd and Dreissen [2008], for example, find declines in quality ofgovernance as ethnicity becomes more strongly correlated with vote. If this is true, from a nor-mative perspective, we should be pleased with shifts away from ethnic voting. However, withouta more precise understanding of voters’ calculus, such conclusions would be premature. Patternsthat appear to be “ethnic” voting need not be associated with under-provision of goods; perhaps,for example, voters prefer coethnics because they know that coethnics will be more responsive tothem (see Habyarimana et al. [2007] for evidence that coethnics are more able to influence oneanother than outsiders are.) And perhaps, if ethnic cues are unavailable, voters do not move on toretrospective voting, but select their candidates more or less stochastically.2
There are a number of recent studies that address the underpinnings of ethnic voting. All ofthese studies, however, measure a candidate’s performance in office based on how survey respon-dents assess him. They then find that those with more favorable assessments are likely to supporthim. These assessments are endogenous to the extent that voters’ assessments of a candidate’sperformance are shaped by whether they already support him,3 which in itself may be a product ofethnic affiliation. The story we might be tempted to tell based on the correlation between voters’self-reported retrospective assessments and their votes is thus highly suspect.
My investigation improves on prior studies by exogenously determining candidate performancein an experimental setting. These experiments allow me to directly measure the relative importanceof ethnicity and record to voters, as well as determine whether voters see ethnicity as a proxy forfuture goods provision. I find that voters value ethnicity at least as much as they value priorperformance, because they anticipate more targeted future goods from coethnic elites.
Africa, the term ”ethnic group” has a specific meaning than is different from what I intend here - it refers to the largerlanguage family that one’s native tongue falls under (such as “Bantu”.) “Tribe” is the word that implies a hereditarygroup whose members all speak the same, discrete language (such as “Mutooro”.) Since most theory on ethnicity inAfrica relates to the latter categorization rather than the former, I use the word tribe to denote this type of identitygroup.
2Chandra [2004] and Ferree [2004] suggest and Conroy-Krutz [2008] finds that in a low information setting votersrely almost entirely on ethnic cues. In the absence of these cues, it is unclear what is available to replace them.
3A particularly robust finding in American politics is that voters’ estimates of the state of the economy are sig-nificantly more positive when their preferred party is in power. See Gerber and Huber [2010] for the most recentdiscussion of the finding.
2

2 Uganda’s Political ContextDepending on the means of classification there are between 30 and 80 tribes in Uganda. Accordingto some calculations, it is the most ethnically diverse country in the world.[Alesina et al., 2003]The southern half of the country, comprising 70% of the population, is composed of tribes fromthe larger Bantu ethno-linguistic group. Kampala and the rest of Central Region are dominatedby the relatively large Baganda tribe, whose king, the Kabaka, power-shares control of the regionwith the central government. The West is populated by a closely related group of tribes, includingthe president’s tribe, the Banyankole.4 Those who live in the North/Northeast are of smaller andmore varied tribes, including those more closely related to groups in Kenya and Sudan. No tribe inUganda forms a majority. The largest tribe in Uganda are the Baganda, who comprise 17% of thepopulation. The president’s tribe, the Banyankole, are the second-largest, at 9% of the population.
Uganda’s President Yuweri Museveni, leader of the National Resistance Movement (NRM),has been in power since 1986, when he led a coup against General Tito Okello, who had himselfdeposed President Milton Obote six months earlier. Museveni ruled as a military dictator until1996, when the country held its first elections in fifteen years. These elections were unique intheir “no party” status: parties could not nominate or campaign for candidates, leading to a de-facto one-party competition. The first true multi-party elections were not held until 2006. Despiteacknowledgment of widespread fraud and intimidation, both internal and international observershave declared the results of the 2006 elections fundamentally valid: Museveni officially won 59%of the vote. Museveni’s support is concentrated in the west of the country, with a firm majorityin Central Region (excepting Kampala itself), and pockets of support elsewhere in the country.Museveni’s primary challenger of the past two decades has been Dr. Kizza Besigye, of the Fo-rum for Democratic Change (FDC). Other parties include the United People’s Congress (UPC),Obote’s former party, which is popular primarily in his home region in the North, and the Demo-cratic Party(DP), which is associated historically with the powerful Buganda Kingdom. In the nextsection, I provide hypotheses for the ethnic patterns we see in Ugandan elections that have tractionboth in the literature and in the Ugandan context.
3 Theory and HypothesesThe longest-standing hypotheses on ethnic voting is that voters prefer coethnics out of ethnic pride,or for what Chandra [2004] calls the “psychic benefits” of having someone like them in office.This was the expectation of scholars in the earliest days of African democracy who predicted thatelections in Africa and other diverse places would turn out to be ”ethnic censuses.” [Horowitz,1985] Recently, Bratton and Kimenyi [2008] find that Kenyans who are most attached to theirethnic identity are those most likely to vote ethnically. In Uganda, ethnicity may be important inand of itself because tribal identity is historically salient. Previous rulers Milton Obote and IdiAmin encouraged attacks on tribes believed to favor other leaders (Obote repressed the Baganda,while Amin massacred two northern tribes that had supported Obote.) Though Uganda under
4Those tribes living in the west speak similar, mututally comprehensible languages. A standardized Western lan-guage, Runyakitara, was developed in the 1990s, but is not widely used, perhaps because it is mostly unnecessary.
3
Museveni is indubitably more stable and ethnically tolerant, ethnic tension has manifested in theongoing war with the Lord’s Resistance Army, which among other things claims to be an Acholinationalist movement, and in a series of deadly riots in 2009 and 2010 that resulted from perceivedinsults to the Buganda Kingdom.5
H1) Voters vote expressively, supporting coethnics out of ethnic pride.
On the other hand, it is possible that, like voters elsewhere, Ugandans vote retrospectively,supporting candidates who have performed well during their tenure. Evidence of retrospectivevoting has been found in countries throughout the world [Fiorina, 1987, Lohmann et al., 1997,Besley and Burgess, 2001, Kousser, 2004]. Though they each have limitations, there are also arange of studies that find evidence of retrospective voting in Africa. Ferree [2004], Ferree andHorowitz [2007], Hoffman et al. [2007], Bratton et al. [2004] and Lindberg and Morrison [2008]find that African voters, regardless of ethnicity, base their votes primarily on assessments of thecandidate’s performance. In a situation such as this, we could still ethnic patterns in voting ifMuseveni provided more to the Banyankole than to other groups. Ethnic patronage, in which theleaders’ coethnics receive a disproportionate share of public resources, is a common expectationin the literature, (see Berman et al. [2004], Chabal and Daloz [1999], Horowitz [1985]) and onethat is alive and well in Uganda. Scholars and journalists report that President Museveni hasbuilt his entire cabinet from his home region [Green, 2010, Habati, 2010, Musoke and Olupot,2010] and that the Western regions ”eat” more than others.[Observer, 2009, Rubongoya, 2007]Analysis of the Ugandan panel of the Afrobarometer survey results confirms that the Banyankoleconsider themselves to be favored, reporting themselves economically better off and politicallymore powerful than other groups. Controlling for urbanization, as well education and incumbentparty support, Banyankole also report significantly better quality of life.[Carlson, 2008a]
H2) Voters vote retrospectively, supporting coethnics because these candidates have given themmore.
Another possibility is that voters believe that electing a coethnic provides their best chanceof receiving future goods from the government, regardless of his prior provision.6 Ferree [2004]argues that ethnic voting is South Africa is primarily due to voters’ belief that coethnic partieswill be more responsive to their needs. Carlson [2008b] found that Ugandan voters are 20% morelikely to prefer a coethnic candidate, even if he is less qualified than his opponent, when theyare unemployed than when they have a secure job. Since those without jobs are dependent ongovernment largesse, this strongly suggests that coethnicity in a candidate represents hope of futurepatronage. The belief that Museveni favors his own tribe would tend to reinforce this expectation,even among those who have not experienced ethnic patronage themselves.
5The first of these riots began when when Museveni blocked the movement of the Kabaka citing security concerns,the second when Museveni attempted to visit royal tombs that were burned by an arsonist.
6Even if a candidate has received nothing from a coethnic candidate thus far, he may believe that his chances ofreceiving future benefits from this candidate are still higher than the zero percent chance of getting such goods from anon-coethnic candidate.
4

H3) Voters vote prospectively, supporting coethnics because they anticipate future ethnicpatronage.
Finally, it is possible that ethnic voting is not an individual choice, but a response to socialpressure. To the extent that bloc voting can increase the influence of members of the bloc, voters,particularly those living in ethnically homogeneous areas, are likely to face pressure to coordinateon a coethnic candidate. Tukahebwa [2003] claims that the extraordinary support that Museveniwins in the Rukungiri district, despite few resources being channeled there, has been due to theefforts of a local group to enforce voting for “their” candidate Museveni.7
H4) Coethnics vote socially, voting ethnically due to pressure to vote with their ethnic bloc.
4 MethodsI approach the question of voter motivation question using a voting simulation experiment. De-spite the necessarily artificial framework of experimentation, it is the best method for the Ugandancontext. If we were to rely on election returns we would encounter a number of intractable ob-stacles. First, there is a degrees of freedom problem. The only public office for which mostvoters would encounter a candidate from another ethnic group is the office of the president.(Localofficials would be expected to be from the locally dominant ethnic group.) However, there areonly two major presidential candidates in Uganda – President Museveni and opposition leader Dr.Kizza Besigye. These candidates provide a sample of two – or actually a sample of one, since ofthe two only Museveni has a record of performance in office. Being real people, however, theyalso contribute myriad idiosyncratic characteristics that might lead voters to prefer one over theother. Additionally, the two candidates are similar in a very important way: they both are fromthe western part of the country and are of related tribes. In a model using Uganda’s real presiden-tial candidates, those from many tribes, particularly in the East, would have no option of votingethnically. Using an experimental approach allows me to provide a large sample of discrete candi-dates, with necessary variation on all explanatory variables, while reducing noise from the variousimmeasurable qualities of real candidates.
In the voting simulation, respondents cast votes for candidates whose characteristics - includingethnicity and performance record - were randomly assigned. After completing individual surveysof demographic and welfare indicators, respondents were placed in groups of three to five and readthree pairs of candidates; in each pairing they were asked to mark and deposit a paper ballot forthe candidate they would most prefer to see in office. 8 The candidate descriptions were short andprovided five pieces of information on each candidate: tribe, education, prior office held, recordwhile in the prior office, and a statement of platform. Candidate descriptions were intentionallylimited to five dimensions for a number of reasons. First, when choices are read aloud, as these
7There is a great deal of confusion among the Ugandan public, perhaps intentional, about the home district of thepresident. Rukungiri is one possibility.
8To allow illiterate respondents to write a ballot, ballots were pre-printed with a square and circle; respondentswere told to tick the square if they preferred the first candidate or to tick the circle if they preferred the second. Onlyone respondent was unfamiliar with ballots and had to be shown how to tick her choice.
5

were, there is a limit to how much information people can retain about each choice. [Haab andMcConnell, 2003] Finally, actual Ugandan campaign fliers, printed on quarter-sheets, contain asimilar amount of information.
In the candidate descriptions, tribe was not mentioned directly, but was proxied by indicatingwhere the respondent was from. Every major tribe in Uganda is readily associated with a partic-ular hometown.9 Proxying in this way provides the respondents with tribal information withoutmentioning tribe directly - a condition that would likely to cause respondents to consciously avoidappearing “tribalistic” and therefore unsophisticated. The education dimension included a mas-ter’s degree in one of three social sciences or a bachelor’s degree10 in an unrelated field such asHorticulture or Tourism. Candidates’ prior “office” could include being a businessman, as well asvarious local elected positions. Candidates who had held public office could have paved a road,created jobs, or brought in a new clinic. Those who had held no prior elected office were not givena record. Additionally, approximately 35% the candidates who had held public office were alsogiven no record, simply by omitting any reference to performance.11 Platforms included a promiseto create jobs, improve health care, or improve free education.
Figure 1: Example Candidate Pairing for Voting Simulation Experiment
Candidate One. The candidate is from Hoima. He has a Master’s Degree in AfricanDevelopment. Before running for office he was a businessman. If elected president hepromises to improve government health care.
Candidate Two.The candidate is from Busia. He has a university degree inTourism. Before running for office he was a Member of Parliament. While he was aMember of Parliament he paved the community’s major road. If elected president hepromises to create new jobs.
The experiment tests whether Ugandans vote retrospectively: if so, the candidate’s record ofservice provision should more strongly predict vote than any other characteristic, including eth-nicity. Conversely, if voters rely on ethnic cues, candidates should always win the votes of theircoethnics, regardless of their other qualities.
The voting simulation experiment has an additional purpose: variations in the conditions underwhich the simulation occurs allow us to analyze the impact of social pressure on voter preferences.The simulation varied in two ways among respondents. First, the voting groups varied in theirethnic homogeneity, reflecting the ethnic composition of the surrounding community. Groupsfrom homogeneous areas were necessarily homogeneous; those from diverse areas varied in theircomposition. While waiting to vote with their group, group members mingled and decided on
9Candidates in the experiment could have been from any of the 30 most populous tribes. The draws were weightedso that 40- 50% of the candidates presented to a particular voting group were from the areas’ dominant tribe(s)
10All presidential candidates are constitutionally required to have at least a bachelor’s degree11Though candidates were paired randomly, at least one candidate in the first pairing was given a record, so that the
lack of a record would be meaningful in comparison.
6

the language in which they wanted the voting simulation to be conducted; this allowed groupmembers to become familiar with the ethnicities of others in the group. 12 In the second variation,respondents either marked only a “secret” ballot identified by a code written inconspicuously onthe back, or were told to cast their ballot and then state aloud to the group how they had voted. Ifsocial pressure drives ethnic voting, we should expect to see ethnicity become more predictive ofvote when respondents are grouped with coethnics and asked to vote aloud - a coethnic candidatepresented to a homogeneous group should serve as an obvious target for coordination, and publicvoting should provide opportunity for the group to enforce this coordination.
4.1 SampleThe sample for the project was 801 respondents from across 32 villages in Central, Eastern, andWestern Uganda; approximately 30 respondents were recruited at each site, but attrition varied.The village sites are a sub-sample of the villages sampled in the 2004/2005 Uganda NationalHousehold Survey. The sample sites were chosen at random from the master sample list, with afew caveats. First, since we believe ethnic diversity may be relevant to the importance of ethnicityto voting, I stratified the sample based on the ethnic diversity calculated from the 2001 census, withthe intention of sampling homogeneous and diverse populations in both urban and rural areas; thisresulted in some oversampling of ethnically diverse rural areas, which are uncommon. Second, Iwas only able to visit sites that could be reached by public transportation. Because of transportationproblems, as well as lingering security concerns, I did not visit the north of the country. Dueto these restrictions, the sample was less northern and more “accessible” than the country as awhole.13 Because my methods are experimental, and the treatments randomized within the sample,these imbalances do not threaten the validity of my conclusions as they would in a descriptivestudy. Additionally, we do not have a priori assumptions that there are systematic effects from theunderrepresented groups that are not captured in the existing variation in the sample.14 However,it must be kept in mind that the findings may not be applicable to the entire population of Ugandanvoters.
At the sample sites, households were chosen using a geographic sampling method in whichenumerators started at a central location and walked in different directions, stopping at every fifthhouse. Once at the household, the enumerator asked for an individual of a pre-determined gen-der and age-bracket. This method was chosen, rather than randomly selecting names from thevillage roster, because it protects anonymity. Selected respondents were asked to provide basicdemographic information, including tribe, and told to report to a central location the next day toparticipate in the longer survey and voting experiment.
12In some particularly diverse urban areas, the voting simulation was read in multiple languages.13In the eastern part of the country, where road networks are under-developed, this also means that the eastern
sample is more urban than the region as a whole.14Certainly, northern areas –and presumably inaccessible areas as well– are generally poorer than areas in the
sample. Northerners are also the least likely to support Museveni. However, it is unclear whether these factors wouldchange voters’ priorities in a general sense. We are able to test this to some extent: because of migration, there aremembers of northern tribes in the sample. A “northern tribe” dummy added to relevant models below does not take onsignificance or change the outcome of the models.
7

In keeping with the demographics of Uganda, the villages in the sample were primarily rural;only six out of 32 sites were located in urban centers. A solid majority of respondents in the sample(63%) work as subsistence farmers and/or small-scale vendors in the informal economy. Sixteenpercent of respondents work for the government, primarily as teachers; the remainder (18%) havepermanent jobs in the private sector. The typical respondent completed most of primary school,lives in a mud house with an iron-sheet roof, and eats two meals a day. Most respondents reportthat their household owns a radio (77%), a mobile phone (60%), and either a bicycle or motorbike(56%). The vast majority of those who voted (78%) claimed that they vote for Museveni. Though isthis certainly something of an overestimation (respondents have an incentive to claim they supportthe ruling party), the sample sites are predominantly located in areas that supported Museveni in2006. This partly reflects the fact that 70% of the districts in the country support Museveni. Italso reflects the fact that many of the areas that don’t support Museveni are also the most difficultto access and were therefore excluded from the sample. Table 1 provided summary statistics byregion and by treatment.
Table 1: Sample Means, by Region and Treatment
Gender Age Yrs Education Urban Voted 06Western region 0.52 37.81 5.79 0.15 0.86Central region 0.56 36.86 6.59 0.10 0.76Eastern region 0.56 37.60 7.06 0.38 0.83Presented coethnic 0.54 37.03 6.24 0.18 0.81Not presented coethnic 0.53 37.44 6.49 0.22 0.83Full sample 0.54 37.48 6.34 0.19 0.82
5 FindingsMy findings, in their simplest specification, confirm earlier studies on African voting and supportthe hypothesis that voting, even in ethnically diverse societies, is for the most part retrospective. Iuse a conditional logit model to determine the impact of each candidate characteristic on the can-didate’s chance of winning his contest. Conditional logit models are used to predict the probabilitythat a respondent will choose one alternative out of a set of discrete alternatives; in this case, I useit to predict the probability that a candidate won his contest. Because each respondent voted inmultiple contests, and a respondent’s choices are likely to be correlated with one another, I clusterthe standard errors by respondent. Table 2 presents these findings. As in earlier studies, perfor-mance variables - record and office held - predict candidate success more strongly than ethnicity.Predicted values from the logit, holding all other variables at their means, indicate that a coethniccandidate is 6% more likely to win than an identical non-coethnic candidate. A candidate with arecord of provision, however, is 10% more likely to win than an identical candidate without such a
8

record. Similarly, a candidate who has held prior elected office, regardless of record, is 10% morelikely to win than a candidate who was previously a businessman.15
Table 2: Determinants of Candidate Selection - Full SampleVariable Coefficient
(Std. Err.)Cand. is coethnic 0.299∗∗
(0.090)
Cand. has record 0.515∗∗
(0.130)
Cand. held prior office 0.494∗∗
(0.159)
Cand. holds relevant degree 0.140(0.114)
Cand. promising education 0.358∗∗
(0.113)
N 4524Log-likelihood -2402.318χ2(5) 67.789
Significance levels : † : 10% ∗ : 5% ∗∗ : 1%Conditional logit model with standard errors clustered by respondent.DV takes value one if candidate won his contest; zero otherwise.N represents number of candidates, not number of contests.
These findings indicate that while both coethnicity and performance convey an advantage toa candidate, performance is more important. Prior office and a positive record trump ethnicity.These findings confirm H2, which predicts that voters will vote on performance. The good newsof this finding is that it implies that voters, even those who vote ethnically, are holding their elitesaccountable for performance rather than relying solely on ethnic cues. The finding, however, is notrobust. When the sample is separated into those voted in a secret ballot and those who voted aloud,we find that social pressure appears to be driving much of the impact of candidate performance indetermining vote. Those who cast secret – and presumably more genuine – ballots are willing tochoose a coethnic rather than a candidate with strong performance.
15Unlike in other countries, there is no particular tribe associated with business. Rather, the term is a general onefor an entrepreneur – anyone who is not a farmer, but who does not work for pay for anyone else.
9

5.1 Social VotingThe findings just discussed, which indicate that retrospection is a stronger predictor of vote thanethnicity, are based on the full sample of respondents, which includes the votes of those whovoted silently on secret ballots as well as those (approximately 27% of the sample) who reportedtheir vote aloud after casting a ballot. Hypothesis 4 predicts that ethnic voting is encouragedby social pressure to coordinate on a coethnic candidate. If H4 is correct, and ethnic voting isencouraged by social pressure, we should find that ethnicity is most important to those who votealoud. Retrospection, on the other hand, should become even more important relative to ethnicitywhen the sample is limited to those who voted in secret ballots. This would lead to the conclusionthat voters’ true preference is for retrospection.
Instead we find the opposite: those who voted aloud are less likely to elect a coethnic. Whenthe sample is limited to those cast their votes aloud, coethnicity loses its significance in predictingvotes. On the other hand, the coefficient on record almost triples (from 0.29 to 0.81), and the candi-date’s education suddenly becomes a significant predictor of vote. (Table 3) We might expect thatthe willingness to vote for a coethnic candidate when voting aloud would depend on whether thosewatching were from one’s own group or another group. However, those presented a coethnic in acompletely homogeneous group are still unwilling to vote for him. Instead, a candidate presentedto a group who all share his tribe is significantly less likely to win his round.16 (Table 7, later inthe paper,demonstrates these findings.)
When we limit the sample to only those votes cast in secret, on the other hand, the coefficienton ethnicity increases in importance relative to the full sample, while the relative importance ofrecord decreases. The two impacts are now equal: both coethnicity and a positive record increasea candidate’s chance of winning by 8-9%) (Table 4) As before, the uniformity of the group hasa significant negative impact on ethnic voting. (See Table7) This strongly suggests that thosewho were asked to vote aloud were self-censoring and intentionally avoiding the appearance ofethnic voting. Those who have to present their vote in front of others would have an incentive toact as if ethnicity were not important to them. 17 Those who vote in secret, on the other hand,are free to express their preference for a coethnic. If we believe that the votes on secret ballotsare more representative of voters’ true preferences, then this finding indicates that being a non-coethnic candidate harms a candidate as much as not having a record, or almost as much as neverhaving held office at all: ethnicity can replace performance. The finding also calls into questionthe findings of studies that require respondents to report their vote aloud to an enumerator. Thoughthese studies find that performance is more important than ethnicity, it is likely that respondentsare simply unwilling to indicate to someone else how important ethnicity is to them.
The findings of the social pressure experiment have two implications. First, social pressure
16This is a surprising finding, but might be explained by the increased ability of coethnics to sanction one another viatight social networks. If ethnic voting is considered socially undesirable, respondents may be more concerned aboutmaking such a faux pas in front of their coethnics than those outside their ethnic group. See Habyarimana et al. [2007]and Miguel and Gugerty [2005] for evidence that in-group sanctioning is far more effective cross-group sanctioning.
17Consider the opinion of ethnic voting in the following 2009 headline: [Trade Minister] Otafiire Fires Salvo onTribalism, Calls its Perpetrators ‘Stupid’. [Okumu and Amuro, 2009] Similarly, the President has claimed that tribal-ism is “backwards”[Jaramogi, 2008] and a recent editorial claims it is something to shed (along with immorality andreckless driving) for a new beginning in the new year.[Vision, 2010]
10

Table 3: Determinants of Candidate Selection - Votes Cast AloudVariable Coefficient
(Std. Err.)Cand. is coethnic 0.108
(0.171)
Cand. has record 0.808∗∗
(0.260)
Cand. held prior office 0.483†
(0.291)
Cand. holds relevant degree 0.516∗
(0.228)
Cand. promising education 0.629∗∗
(0.213)
N 1246Log-likelihood -630.169χ2(5) 34.016
Significance levels : † : 10% ∗ : 5% ∗∗ : 1%Conditional logit model with standard errors clustered by respondent.DV takes value one if candidate won his contest; zero otherwise.N represents number of candidates, not number of contests.
11

Table 4: Determinants of Candidate Selection - Votes Cast SecretlyVariable Coefficient
(Std. Err.)Cand. is coethnic 0.386∗∗
(0.105)
Cand. has record 0.403∗∗
(0.148)
Cand. held prior office 0.450∗
(0.185)
Cand. holds relevant degree -0.015(0.131)
Cand. promising education 0.242†
(0.130)
N 3278Log-likelihood -1731.815χ2(5) 40.078
Significance levels : † : 10% ∗ : 5% ∗∗ : 1%Conditional logit model with standard errors clustered by respondent.DV takes value one if candidate won his contest; zero otherwise.N represents number of candidates, not number of contests.
12

does not appear to drive ethnic voting, as was predicted in H4.18 Rather, when exposed to increasedsocial monitoring, respondents become far less likely to choose a coethnic candidate. Additionally,we must revise our earlier statements on the relative importance of ethnicity and retrospection.When in the secrecy of the voting booth, it appears that ethnicity is as important to Ugandan votersas record or prior office held. The question, then, is why? We have two hypotheses remaining.H1 predicts that ethnic voting works as cross purposes to retrospection, replacing utility that couldotherwise be gained by performance. Hypothesis 3 predicts that coethnicity implies performance,serving as a proxy for improved future service delivery, regardless of prior provision.
5.2 The Origin of Ethnic VotingThe data from the voting simulation experiment provide evidence that ethnicity matters to voters,particularly when they are free from observation and can vote more genuinely. The implicationsof this finding, however, are different depending on the reasons why voters vote this way. From anormative perspective, we should be more concerned if ethnicity itself provides sufficient utility tovoters that they do not require their coethnic elites to provide anything else. If voters use ethnicityas a proxy for development goods, however, then elites may be required to provide these goods,particularly over the long run, in order to retain their advantage among their coethnics.
The following analysis involves only those who voted in secret ballots, as ethnicity is not adeterminant in the votes of those who voted aloud. The findings imply that voters vote ethnicallybecause they expect more future goods from coethnic candidates. First, and most strikingly, theeffect of coethnicity can be eliminated by controlling for an interaction between coethnicity andrecord. The interaction between record and ceothnicity is strongly significant, while neither coeth-nicity or record retain their own significance. (Table 5)What this means is that neither coethnicitynor record has a strong impact on its own: each matters only in light of the other. Table 6 providesa candidate’s probability of winning his election given his record and ethnicity, when other charac-teristics are set to their mean. It shows that record has a much greater impact when the candidate iscoethnic; similarly, coethnicity has a greater impact on the probability of winning when the candi-date has a record. Coethnicity matters when there is reason to think that it will be accompanied byprovision of goods (as evidenced by an existing record of goods provision.) Record matters onlywhen the candidate is coethnic – this is strong evidence that voters expect a candidate to channelgoods in the direction of his own tribe.
We can get additional traction on the reasons for ethnic voting by investigating who votes eth-nically. Table 7 presents a model testing the impacts of characteristics that are thought to influencethe likelihood of ethnic voting. The dependent variable is an interaction term indicating that thecandidate is a coethnic who won a contest in which the other candidate was a non-coethnic; inother words, it indicates that the respondent selected a coethnic candidate over a non-coethnic one.Included among the independent variables the dummy for a uniform voting group, used in thesocial voting experiment described above. Additionally, I control for the non-ethnic attributes of
18This does not mean that social pressure does not impact voting in a more general way; a fair percentage of thesample reported feeling intimidated or threatened during voting. However, this pressure generally pushes voters towardMuseveni specifically, not a coethnic candidate per se
13

Table 5: Determinants of Candidate Selection - Including InteractionVariable Coefficient
(Std. Err.)Cand. is coethnic -0.002
(0.151)
Cand. has record 0.100(0.168)
Cand. held prior office 0.442∗
(0.185)
Cand. holds relevant degree -0.007(0.130)
Cand. promising education 0.252†
(0.131)
Coethnicity*record 0.874∗∗
(0.230)
N 3278Log-likelihood -1720.282χ2(6) 56.468
Significance levels : † : 10% ∗ : 5% ∗∗ : 1%Conditional logit model with standard errors clustered by respondent.DV takes value one if candidate won his contest; zero otherwise.N represents number of candidates, not number of contests.
Table 6: Predicted Probability of Candidate Win, Given Characteristics
No record RecordNon coethnic 0.601 0.601Coethnic 0.625 0.794
14

the candidate, such as record and history of prior office, as these factors are likely to increase acandidate’s chance of winning, coethnic or not. Then I control for various characteristics of therespondents themselves. Urbanness, education and employment, the components of moderniza-tion, have been hypothesized to both decrease and increase the importance of ethnicity in politicalcalculations. I also include two standard measures of ethnic attachment,19 as well as indicatorsof the dominance of respondent’s tribe and the diversity of the local community. Voters from thedominant tribe in their area20 should be more likely to vote ethnically. Goods provided by elites aregenerally community goods (roads, water, schools, etc.); if elites intend to target goods ethnically,they do better to place these goods in communities where their own group predominates – and isnot intermixed with members of other tribes. Strategic voters living outside their tribe’s traditionalhome, or in highly hetergeneous areas, likely realize that a vote for their own coethnic will benefitthe area where their tribe is concentrated rather than the area where they currently reside.
Table 7 demonstrates evidence that ethnic voting is primarily strategic - i.e. based on expecta-tions of performance - rather than an issue of ethnic pride. We see that by far the strongest predictorof ethnic voting is whether the voter is member of the area’s dominant ethnic group. Predicted val-ues indicate that those who are from the locally dominant group are more than four times morelikely to vote for a coethnic than those who are a minority in their area; setting all other variablesat their means, a coethnic candidate has a predicted 0.06 probability of winning his round if he ispresented to a respondent who is not a member of the locally dominant group. When presentedto a member of the dominant group, this probability is 0.26. Those who come from diverse areasare also significantly less likely to vote ethnically, controlling for the diversity of the voting groupitself. This may be a reflection of social conditions: those who live in diverse areas have moreexposure to members of other groups and may be more tolerant of them. (This hypothesis is borneout in the fact that community diversity is correlated to willingness to marry outside one’s tribe atthe 0.000 level of significance.Controlling for residence in an urban area, those in homogeneousareas have a 59% chance of being willing to marry outside their tribe, while those in the mostdiverse site in the sample have an 89% chance of saying the same.) However, the importance ofcommunity diversity is also consistent with a strategic story in which voters realize that a diversearea will not be the first target for ethnic patronage – a finding in keeping with the very strongimpact of local ethnic dominance on the propensity for ethnic voting.
This is not to claim that there is no element of ethnic pride in ethnic voting. One of the measuresof ethnic attachment - the willingness to marry someone of another tribe - is negatively correlatedwith ethnic voting at 0.005 level of significance. Not surprisingly, this means that someone whois only willing to marry someone of their own tribe is also more likely to elect someone of theirtribe. However, it is possible that both election and marital choices are at least somewhat strategic.In Uganda, marriage implies both a personal and financial relationship: bride price – in the formof cattle, property or cash – is frequently paid by the groom to the bride’s family. The Banyankole
19Specifically, we ask, “Would you marry someone who was not [tribe]?” and “If you had to choose between beinga [tribe] and being a Ugandan, which would you choose?” These questions were the last on the survey, asked after thevoting simulation was completed, to avoid priming ethnicity before the voting experiment.
20A tribe is classified as “dominant” if it is the largest group in the area and above 40% of the local population;usually the tribe is also understood to be “from” the area. In one sample site, there are two dominant tribes with equalpopulations.
15

Table 7: Determinants of Ethnic VotingVariable Coefficient
(Std. Err.)Homogeneous voting group -0.369∗
(0.152)
Cand. has a record 0.253†
(0.143)
Cand. held prior office 0.004(0.163)
Cand. promising education -0.010(0.126)
Cand. holds relevant degree 0.128(0.119)
Resp. is urban 0.412∗∗
(0.152)
Resp. has permanent job -0.187(0.128)
Resp. level of education 0.008(0.016)
Resp. will marry outside tribe -0.367∗∗
(0.131)
Resp. prefers national identity 0.193(0.135)
Resp. from dominant group 1.663∗∗
(0.216)
Community ethnic diversity -0.731∗∗
(0.250)
Intercept -2.271∗∗
(0.319)
N 1961Log-likelihood -928.044χ2(12) 100.64
Significance levels : † : 10% ∗ : 5% ∗∗ : 1%Logit model with standard errors clustered by respondentDV takes value one if coethnic candidate won contest over non-coethnic candidate
16

are one of the groups most likely to practice this custom and as one respondent explained, theBanyankole are particularly unwilling to marry outside their group21 because they ‘don’t want toshare what they have.’22 Those who believe they are the recipients of ethnic patronage may be morelikely to want to elect a coethnic and also not to want to dilute this wealth by marrying outside thetribe.It is therefore perhaps relevant that the second measure of ethnic attachment, whether therespondent prioritizes his national over tribal identity, is not significantly correlated with his vote.
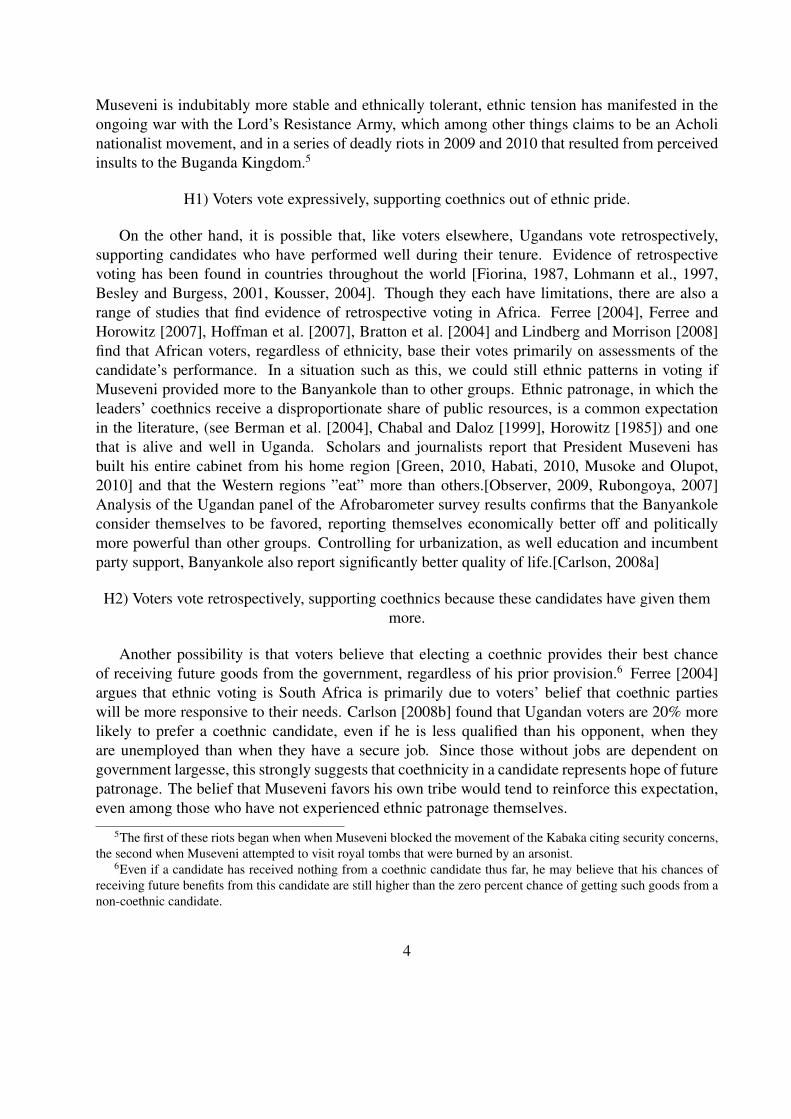
A final, indirect but nonetheless interesting, piece of evidence is that eastern Ugandans seemto have disassociated ethnicity from politics. Neither coethnicity itself or the interaction termof coethnicity and record remains significant among respondents from the Eastern region of thecountry. (See Table 8.) This makes sense only if ethnic voting is about performance rather thanpride. Easterners are more likely to show ethnic attachment than members of other regions.23 Andthey are no less future-oriented than other groups: a candidate’s platform (specifically an educationplatform) is as important in the East as it is elsewhere.24 Yet they are less likely to vote along ethniclines. No member of an Eastern tribe has been in power, or been a serious contender for power, inrecent memory. President Museveni and his main rival, Dr. Besigye, are both from the southwest ofUganda; leaders before Museveni were from the North. The recent development in the region, andthe fortunes of the people who live there, has been necessarily uncorrelated with any experiencewith coethnics in power. It is likely that Easterners do not see ethnicity as a signal about futuregoods provision, because they have had no experience with ethnic favoritism.
6 The Prediction ExperimentThe voting experiment provided evidence that voters select their coethnics because they antici-pate future goods provision from coethnic candidates. With the prediction experiment, I test thisdirectly. Following Rosenwasser and Seale [1988] and other experiments in American politics,I present each of my respondents with the same hypothetical candidate: the only difference be-tween the candidates received by various respondents is the candidate’s ethnicity. I then ask therespondents to predict whether the candidate will accomplish a series of positive tasks if elected,including those that are general - “grow the economy” or “control corruption”- and targeted - “pro-vide more or better jobs for people like me” or “extend more water pipes to this district”. If votersexpect future favoritism from a coethnic, they should expect more targeted goods from the coethnicversion of the candidate than they do from a non-coethnic one.
I find that, with the exception of Easterners, Ugandan voters do, in fact, appear to expect moretargeted goods26 from coethnic candidates. (As before, Easterners do not seem to be impacted by
21Banyankole are almost 20% less willing to marry outside their tribe than are other groups, at the 0.003 level ofsignificance
22In keeping with this hypothesis, a quick look through the personal ads in The New Vision will demonstrate (amongother things) that men – who are the providers of bride price – are more likely to indicate the desired tribe of theirmate than are women.
23Controlling for education and urbanness, Easterners show significantly stronger ethnic attachment on both indi-cators, significant at the 0.01 level.
24It is worth noting that in the absence of ethnic cues, platform, not record, is determining the eastern vote.26I create a scale by summing the scores on the three targeted good options, including jobs, water pipes or new free
17
Table 8: Determinants of Voting - Eastern respondents onlyVariable Coefficient
(Std. Err.)Cand. is coethnic 0.065
(0.367)
Cand. has record 0.452(0.355)
Cand. held prior office 0.125(0.352)
Cand. holds relevant degree -0.318(0.253)
Cand. promising education 0.560∗
(0.257)
Coethnicity*record 0.698(0.533)
N 794Log-likelihood -413.343χ2(6) 17.912
Significance levels : † : 10% ∗ : 5% ∗∗ : 1%Conditional logit model with standard errors clustered by respondent.DV takes value one if candidate won his contest; zero otherwise.N represents number of candidates, not number of contests.
18
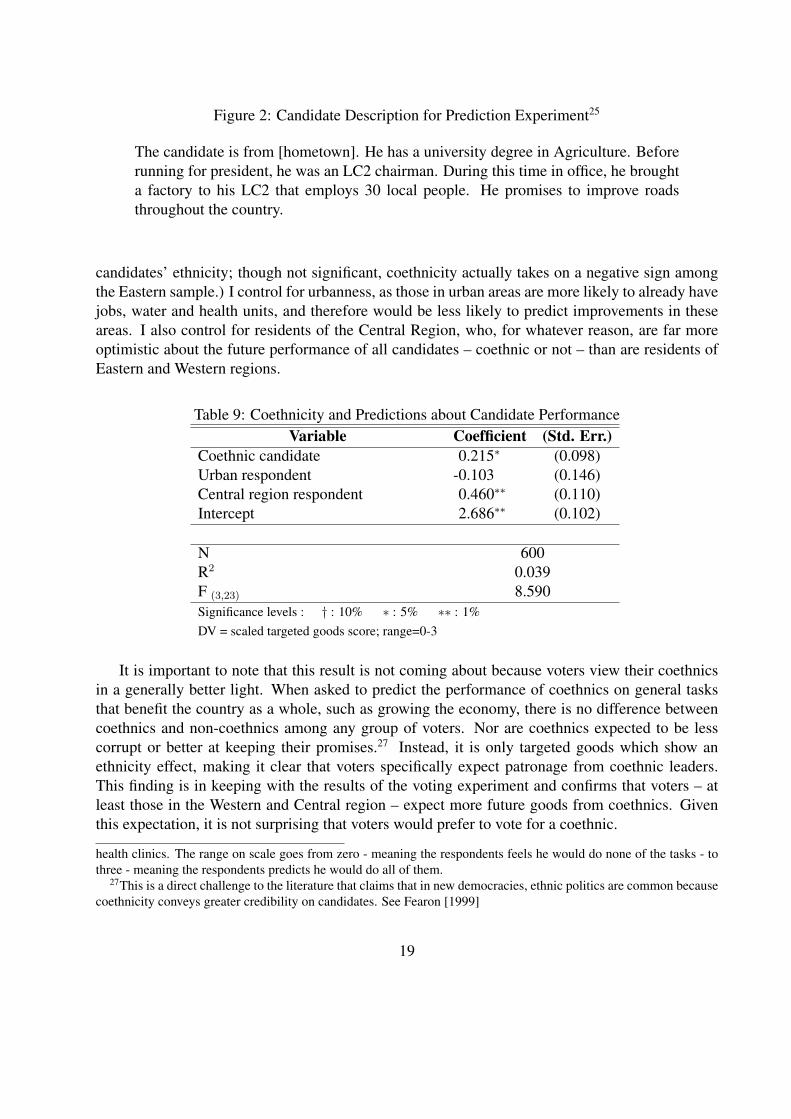
Figure 2: Candidate Description for Prediction Experiment25
The candidate is from [hometown]. He has a university degree in Agriculture. Beforerunning for president, he was an LC2 chairman. During this time in office, he broughta factory to his LC2 that employs 30 local people. He promises to improve roadsthroughout the country.
candidates’ ethnicity; though not significant, coethnicity actually takes on a negative sign amongthe Eastern sample.) I control for urbanness, as those in urban areas are more likely to already havejobs, water and health units, and therefore would be less likely to predict improvements in theseareas. I also control for residents of the Central Region, who, for whatever reason, are far moreoptimistic about the future performance of all candidates – coethnic or not – than are residents ofEastern and Western regions.
Table 9: Coethnicity and Predictions about Candidate PerformanceVariable Coefficient (Std. Err.)
Coethnic candidate 0.215∗ (0.098)Urban respondent -0.103 (0.146)Central region respondent 0.460∗∗ (0.110)Intercept 2.686∗∗ (0.102)
N 600R2 0.039F (3,23) 8.590Significance levels : † : 10% ∗ : 5% ∗∗ : 1%DV = scaled targeted goods score; range=0-3
It is important to note that this result is not coming about because voters view their coethnicsin a generally better light. When asked to predict the performance of coethnics on general tasksthat benefit the country as a whole, such as growing the economy, there is no difference betweencoethnics and non-coethnics among any group of voters. Nor are coethnics expected to be lesscorrupt or better at keeping their promises.27 Instead, it is only targeted goods which show anethnicity effect, making it clear that voters specifically expect patronage from coethnic leaders.This finding is in keeping with the results of the voting experiment and confirms that voters – atleast those in the Western and Central region – expect more future goods from coethnics. Giventhis expectation, it is not surprising that voters would prefer to vote for a coethnic.
health clinics. The range on scale goes from zero - meaning the respondents feels he would do none of the tasks - tothree - meaning the respondents predicts he would do all of them.
27This is a direct challenge to the literature that claims that in new democracies, ethnic politics are common becausecoethnicity conveys greater credibility on candidates. See Fearon [1999]
19

7 ConclusionUsing a voting simulation experiment in Uganda, I challenge previous findings that performanceis more important to African voters than ethnicity. When we analyze only those respondents whoreport their vote in secret, rather than to an enumerator, ethnicity becomes more substantivelyand statistically significant than previously estimated. However, voters do not view ethnicity asa substitute for performance, but rather as a proxy. Evidence from the voting simulation anddirect test of voters’ predictions about future goods reveals that voters expect targeted goods fromcoethnic candidates. The normative implications of these findings are mixed. On the one hand,they indicate that expectations of future performance, as independent from actual performance,are contributing strongly to voting. On the other, it appears that these expectations may be basedon actual patterns of provision: coethnicity does not provide much advantage to a candidate whodoes not also have a prior record, and Easterners seem to have never learned (or unlearned) toassociate ethnicity with development. Over the long run, it seems that coethnicity may not conveyan advantage on a candidate unless it also conveys an advantage on voters.
ReferencesAlberto Alesina, Arnaud Devleeschauwer, William Easterly, Sergio Kurlat, and Romain Wacziarg.
Fractionalization. Journal of Economic Growth, 2003.
Bruce Berman, Eyoh Dickson, and Will Kymlicka. Ethnicity and Democracy in Africa. J. Currey,2004.
Timothy J. Besley and Robin Burgess. The Political Economy of Government Responsiveness:Theory and Evidence from India. CEPR Working Paper No.2721, 2001.
Michael Bratton and Mwangi Kimenyi. Voting in kenya: Putting Ethnicity in Perspective. Afro-barometer Working Paper No. 95, 2008.
Michael Bratton, Robert Mattes, and E. Gyimah-Boadi. Public Opinion, Democracy and MarketReform in Africa. Cambridge University Press, 2004.
Elizabeth Carlson. Using the Afrobarometer to Measure Ethnic Favoritism. Unpublishedmanuscript, 2008a.
Elizabeth Carlson. Does Ethnicity or Candidate Quality Matter More to African Voters? a SurveyExperiment in Uganda. Presented to the Working Group in African Political Economy., 2008b.
Patrick Chabal and Jean-Pascal Daloz. Africa Works:Disorder as Political Instrument. IndianaUniversity Press, 1999.
Kanchan Chandra. Why Ethnic Parties Suceed. Cambridge University Press, 2004.
20

Jeffrey Conroy-Krutz. Information and Voting Behavior:Results of a Survey Experiment inUganda. Presented to the American Political Science Association, 2008.
Robert Dowd and Michael Dreissen. Ethnically Dominated Party Systems and the Quality ofDemocracy:Evidence from Sub-Saharan Africa. Afrobarometer Working Paper No. 92, 2008.
James Fearon. Why Ethnic Politics and ‘Pork’ Tend to Go Together. Unpublished manuscript,1999.
Karen Ferree. The Micro-Foundations of Ethnic Voting. Afrobarometer Working Paper No.40,2004.
Karen Ferree and Jeremy Horowitz. Identity Voting and the Regional Consensus in Malawi. Afro-barometer Working Paper No. 72, 2007.
Morris Fiorina. Retrospective Voting in American Elections. Yale University Press, 1987.
Alan S. Gerber and Gregory A. Huber. Partisanship, Political Control and Economic Assessments.American Journal of Political Science, 54, 2010.
Elliott Green. Patronage, District Creation and Reform in Uganda. Studies in Comparative Inter-national Development, 2010.
Timothy C Haab and Kenneth E. McConnell. Valuing Environmental and Natural Resources.Edward Elgar Publishing Limited, 2003.
Mubatsi Asinja Habati. NRM and Tribalism. The Independent, 2010.
James Habyarimana, Macartan Humphreys, Daniel Posner, and Jeremy Weinstein. Why DoesEthnic Diveristy Undermine Public Goods Provision? American Political Science Review, 2007.
Barak Hoffman, Clark Gibson, Karen Ferree, and James Long. Explaining the African Vote.Presented to American Political Science Association, 2007.
Donald Horowitz. Ethnic Groups in Conflict. University of California Press, 1985.
Patrick Jaramogi. ’tribalism is Backward’-Museveni. The New Vision, 2008.
T Kousser. Retrospective Voting and Strategic Behavior in European Parliament Elections. Elec-toral Studies, 23, 2004.
Staffan Lindberg and Minion K.C. Morrison. Are African Voters Really Ethnic or Clientalistic?Survey Evidence from Ghana. Political Science Quarterly, 123, 2008.
Susanne Lohmann, David Brady, and Douglas Rivers. Party Identification, Retrospective Voting,and Moderating Elections in a Federal System. Comparative Political Studies, 1997.
Edward Miguel and Mary Kay Gugerty. Ethnicity Diversity, Social Sanctions and Public Goods inKenya. Journal of Public Economics, 89, 2005.
21

Cyprian Musoke and Milton Olupot. NRM Vows to Unite, Move On. The New Vision, 2010.
The Weekly Observer. Anti-Sectarian Law was Made to Protect Sectarianism. The Weekly Ob-server, 2009.
David Okumu and Paul Amuro. Otafiire Fires Salvo on Tribalism, Calls its Perpetators ’Stupid’.The Daily Monitor, 2009.
Shirly Rosenwasser and Jean Seale. Attitudes Towards a Hypothetical Male or Female PresidentialCandidate: A Research Note. Political Psychology, 1988.
Joshua B. Rubongoya. Regime Hegemony in Museveni’s Uganda. Palgrave Macmillan, 2007.
Geoffrey Tukahebwa. Block Voting in South Western Uganda: The Case of the 1996 Elections inRukungiri District. In Sabiti Makara, editor, Voting for Democracy in Uganda. LDC Publishers,2003.
The New Vision. A New Year, a New Beginning. The New Vision, 2010.
22