Embed Size (px)
Citation preview

1
© 2016 STR, Inc. All Rights Reserved.
Any reprint, use or republication of all or a part of this presentation without the prior written approval of STR, Inc. or STR Global, Ltd. trading as STR
(collectively “STR”) is strictly prohibited. Any such reproduction shall specifically credit STR as the source. This presentation is based on data collected by STR.
No strategic advice or marketing recommendation is intended or implied.
Greater Nashville Hospitality Association
Hotel Industry Performance
March 15, 2017
Amanda W. Hite
President & CEO
@HiteAmanda

2© 2016 STR. All Rights Reserved.
• Total US Review
• Markets
• Pipeline
• Nashville
Agenda
3© 2016 STR. All Rights Reserved.
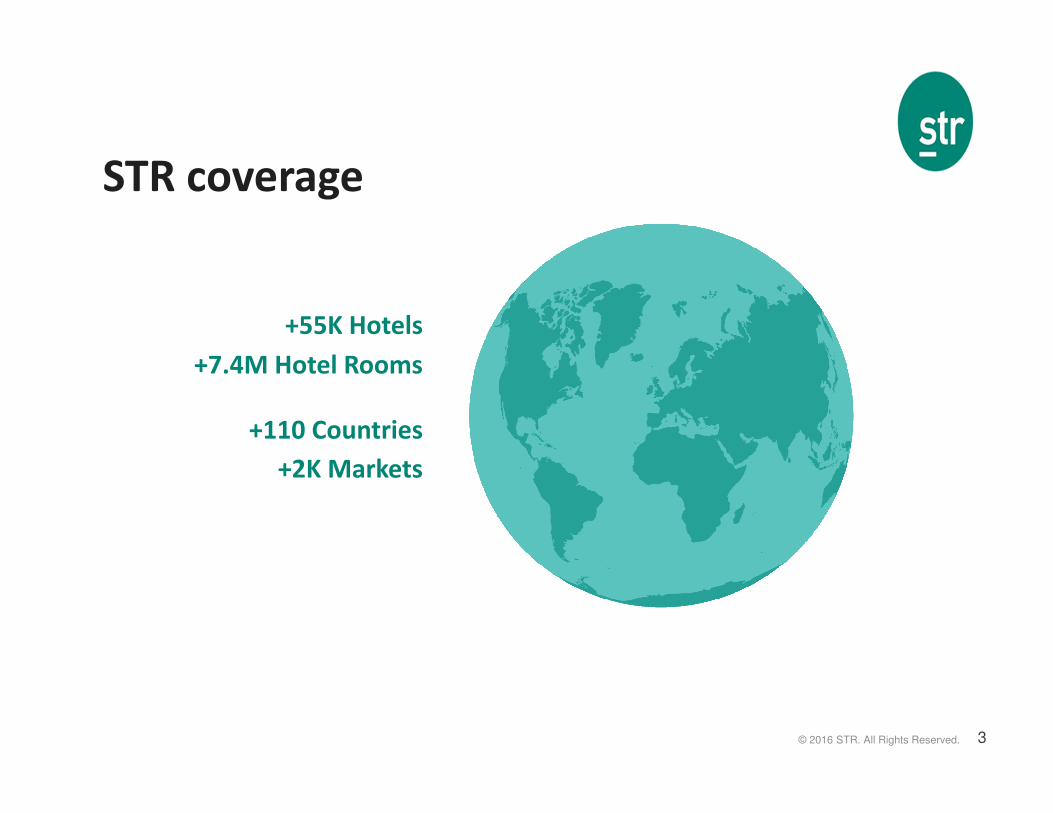
+55K Hotels
+7.4M Hotel Rooms
+110 Countries
+2K Markets
STR coverage

4© 2016 STR. All Rights Reserved.
Total U.S. Review
5© 2016 STR. All Rights Reserved.
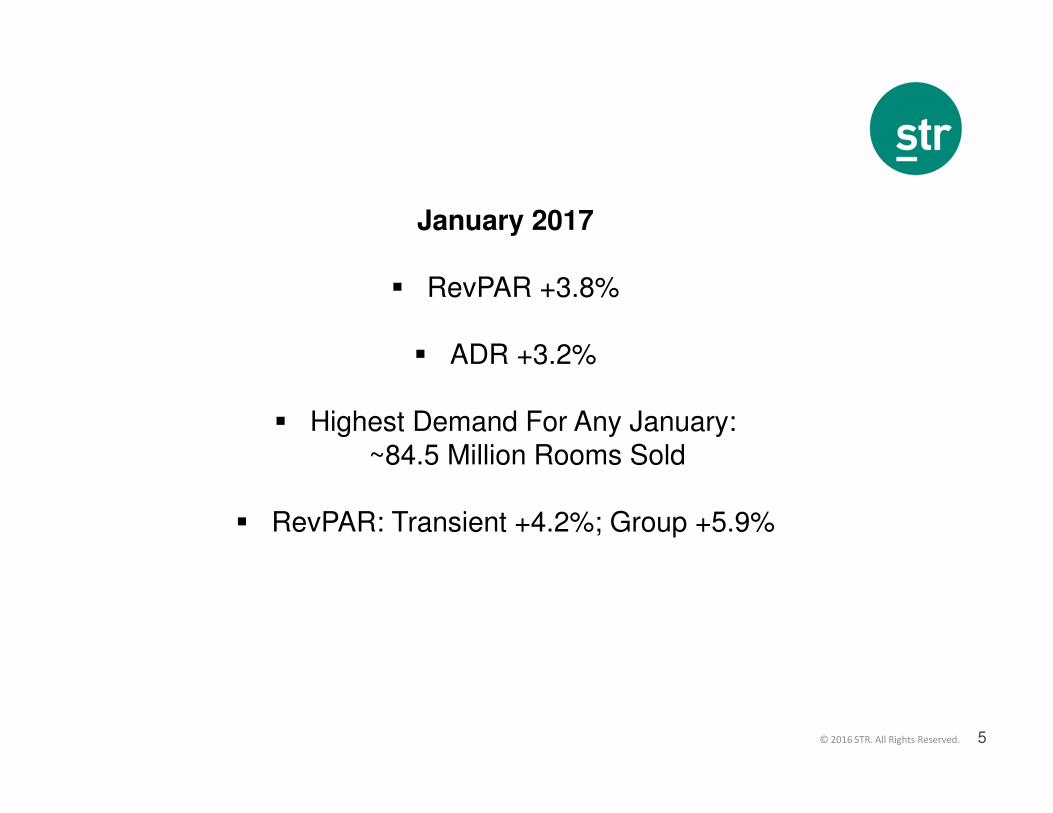
January 2017
� RevPAR +3.8%
� ADR +3.2%
� Highest Demand For Any January:~84.5 Million Rooms Sold
� RevPAR: Transient +4.2%; Group +5.9%

6© 2016 STR. All Rights Reserved.
12MMA January 2017: ADR Growth Continues
% Change
Room Supply 1.6%
Room Demand 1.8%
Occupancy 65.5% 0.2%
A.D.R. $124 3.1%
RevPAR $81 3.3%
Room Revenue 4.9%
January 2017 12 MMA, Total US Results

7© 2016 STR. All Rights Reserved.
Demand Growth Slows. Supply Growth Increases To 1.6%.
-0.8
-4.7
-7.1
7.7
-8
-4
0
4
8
1990 2000 2010
Supply % Change
Demand % Change
Total U.S., Supply & Demand % Change, 12 MMA 1/1990 – 1/2017
1.8
1.6
8© 2016 STR. All Rights Reserved.
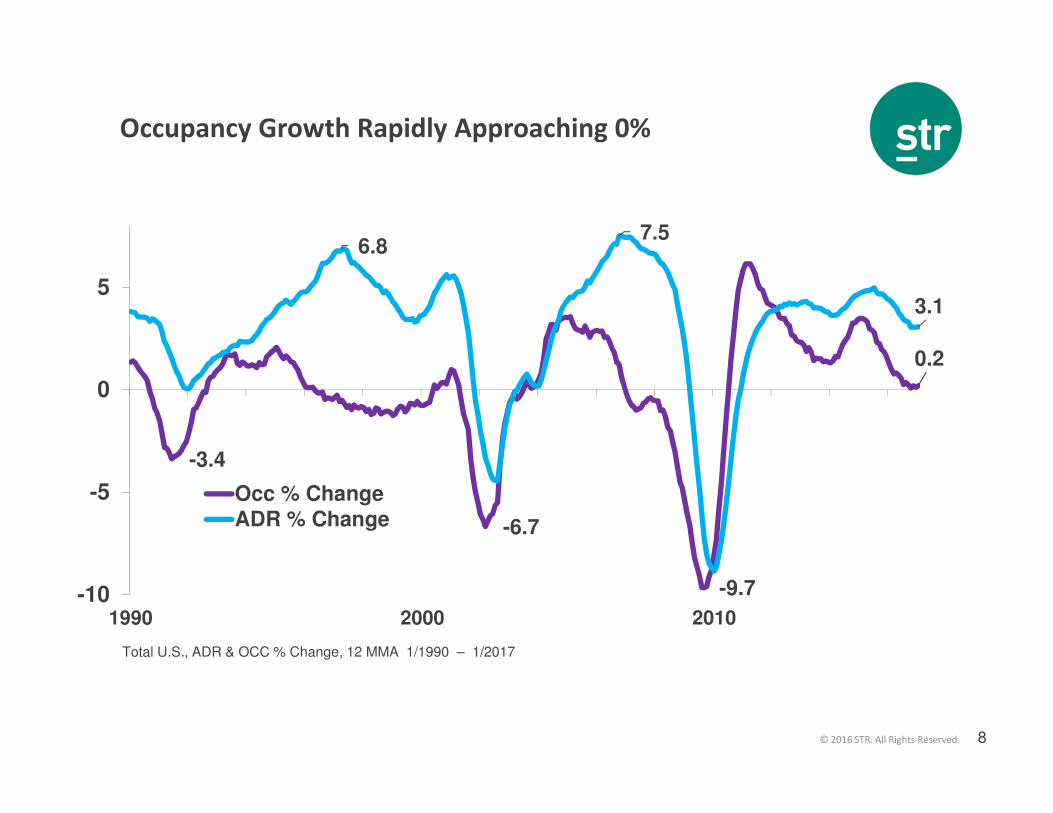
Occupancy Growth Rapidly Approaching 0%
-3.4
-6.7
-9.7
0.2
6.8 7.5
3.1
-10
-5
0
5
1990 2000 2010
Occ % Change
ADR % Change
Total U.S., ADR & OCC % Change, 12 MMA 1/1990 – 1/2017

9© 2016 STR. All Rights Reserved.
Declining Occupancies and Rising ADRs
Are Not Unprecedented
-4
-2
0
2
4
6
8
1990 1992 1994 1996 1998
OCC % Change
ADR % Change
24 Months
42 Months
Total U.S., ADR & OCC % Change, 12 MMA 1/1990 – 12/1999

10© 2016 STR. All Rights Reserved.
RevPAR Growth: Slowing Down After 6 Yrs. Of Growth
-25
-20
-15
-10
-5
0
5
10
15
1990 2000 2010
Total U.S., RevPAR % Change, 1/1990 – 1/2017
56 Months 83 Months80 Months 31 Mo
11© 2016 STR. All Rights Reserved.
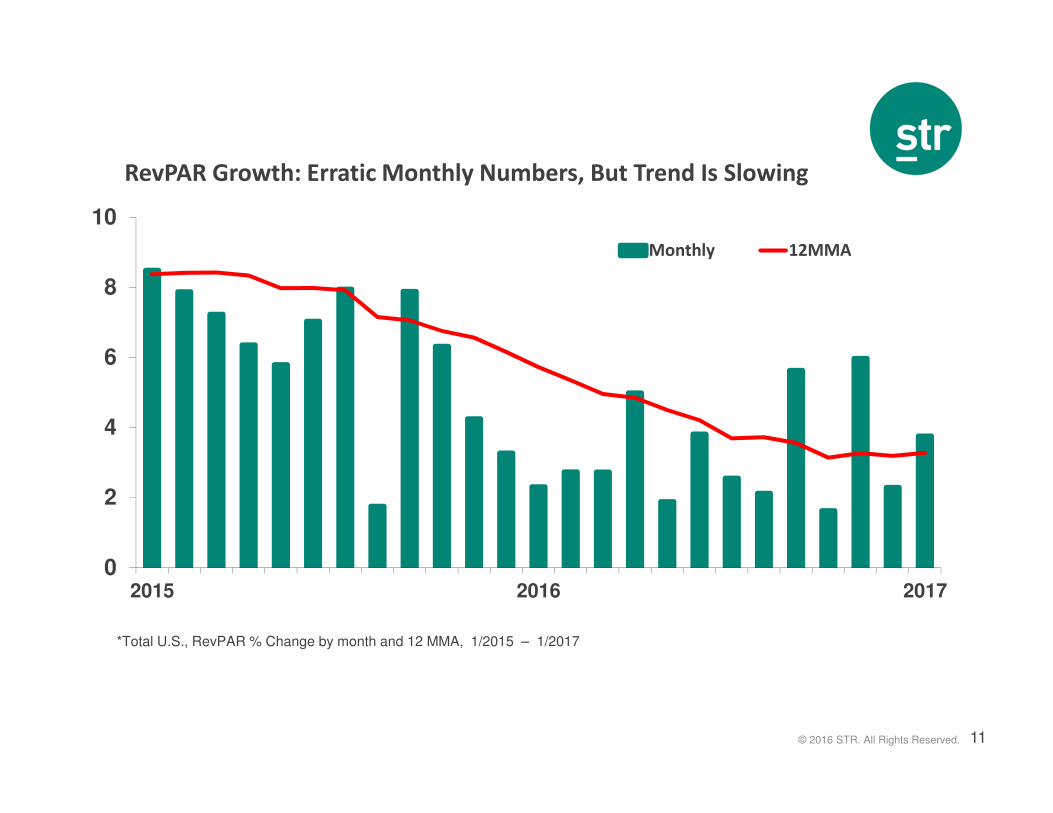
RevPAR Growth: Erratic Monthly Numbers, But Trend Is Slowing
0
2
4
6
8
10
2015 2016 2017
Monthly 12MMA
*Total U.S., RevPAR % Change by month and 12 MMA, 1/2015 – 1/2017
12© 2016 STR. All Rights Reserved.
Upscale Hotels:
In Search Of The Ideal
Occupancy
13© 2016 STR. All Rights Reserved.
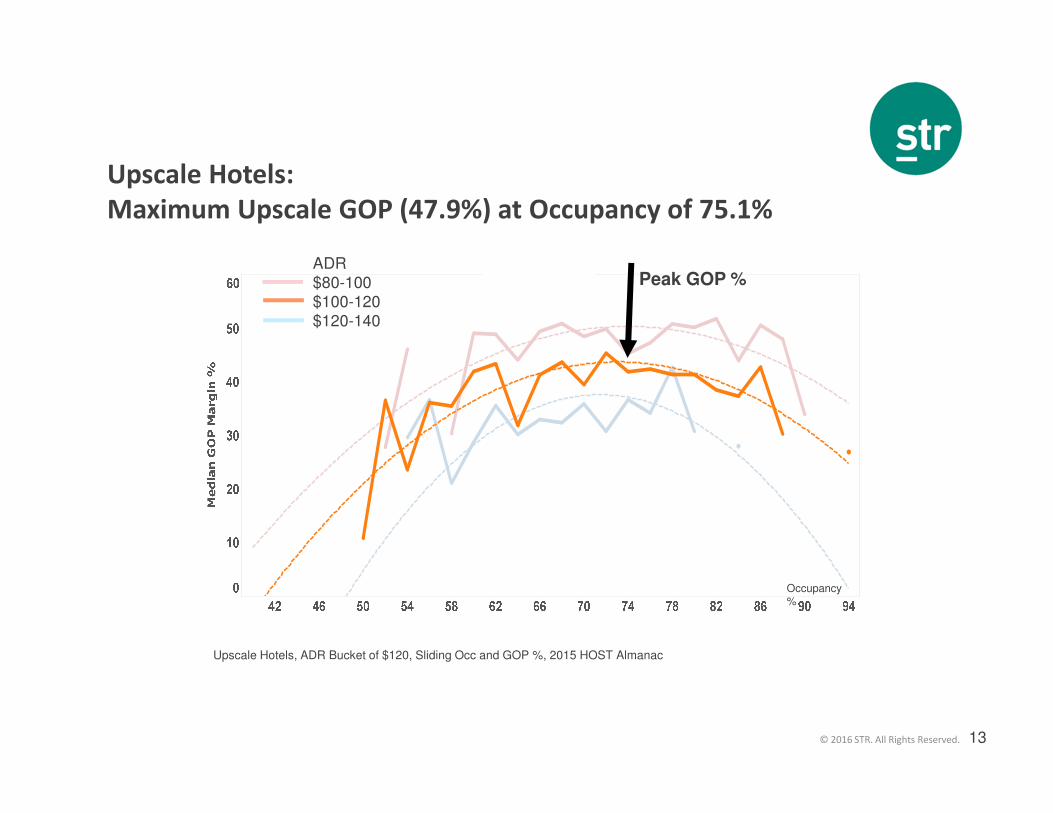
Upscale Hotels:
Maximum Upscale GOP (47.9%) at Occupancy of 75.1%
Upscale Hotels, ADR Bucket of $120, Sliding Occ and GOP %, 2015 HOST Almanac
Peak GOP %
Occupancy %
ADR$80-100$100-120$120-140
14© 2016 STR. All Rights Reserved.
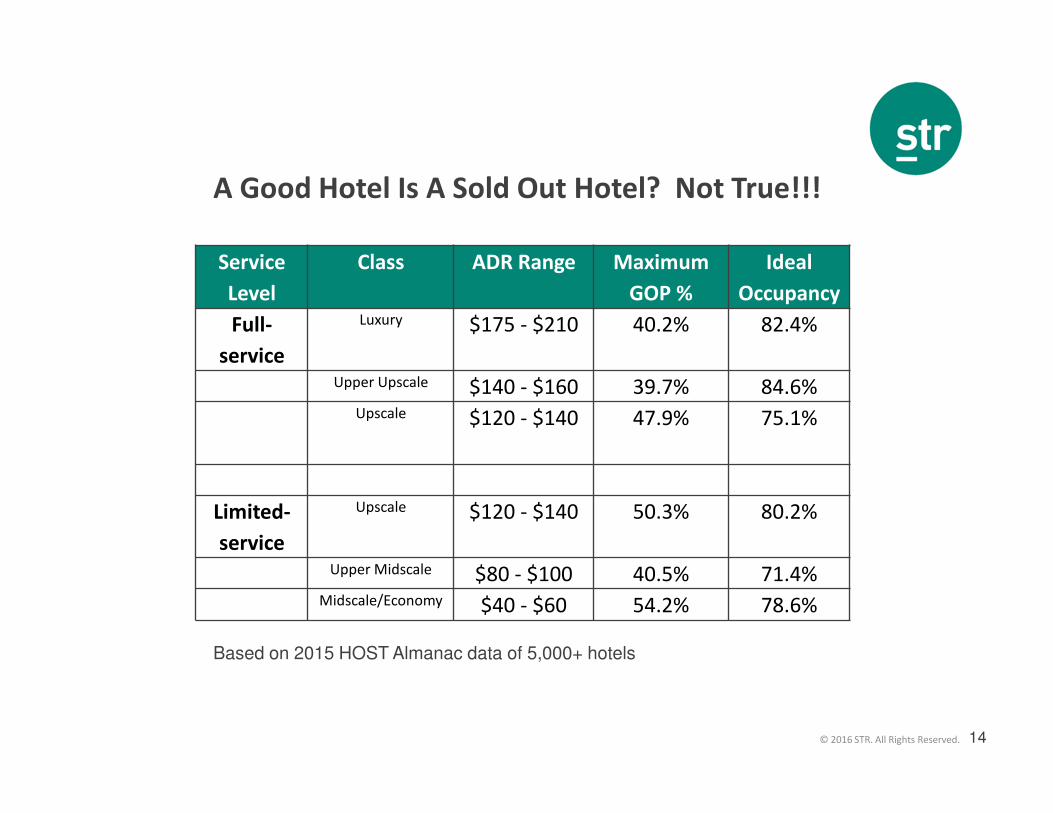
A Good Hotel Is A Sold Out Hotel? Not True!!!
Service
Level
Class ADR Range Maximum
GOP %
Ideal
Occupancy
Full-
service
Luxury $175 - $210 40.2% 82.4%
Upper Upscale $140 - $160 39.7% 84.6%Upscale $120 - $140 47.9% 75.1%
Limited-
service
Upscale $120 - $140 50.3% 80.2%
Upper Midscale $80 - $100 40.5% 71.4%Midscale/Economy $40 - $60 54.2% 78.6%
Based on 2015 HOST Almanac data of 5,000+ hotels

15© 2016 STR. All Rights Reserved.
Markets

16© 2016 STR. All Rights Reserved.
January YTD 2016 : New Supply Hits NYC, Houston, Miami.
Market OCC % ADR % Change
Los Angeles/Long Beach, CA 81.2 7.9
Tampa/St Petersburg, FL 71.8 6.2
Nashville, TN 74.6 5.9
Atlanta, GA 70.0 5.7
Denver, CO 73.4 5.2
Chicago, IL 69.1 1.6
New Orleans, LA 69.0 0.3
New York, NY 86.0 (2.2)
Houston, TX 61.9 (3.7)
Miami/Hialeah, FL 75.5 (4.0)* January 2017 12 MMA ADR % Change in Top 25: 5 Best / 5 Worst Performing ADR % Markets

17© 2016 STR. All Rights Reserved.
US 2016 RevPAR:
3 Markets Dragged US Results
Total US YTD: +3.2%
NYC: - 1.8%Miami: - 5.5%Houston: -12.4%
Total US
excluding NYC, Miami & Houston:+3.8%
*RevPAR % Change January 2016 YTD

18© 2016 STR. All Rights Reserved.
(15.0)
(10.0)
(5.0)
-
5.0
10.0
(12.0) (10.0) (8.0) (6.0) (4.0) (2.0) - 2.0 4.0 6.0 8.0 10.0
Majority Of Markets With Positive ADR % Change
Occ % Change
ADR % Change
HoustonWest Virginia
North Dakota
Maryland Area
New Jersey Shore
34%
8%
57%
* January 2017 12MMA ADR & Occupancy % Change, All Markets. % are respective share of all 164 markets
Texas West
Wyoming
North Carolina
East
2%
Melbourne, FL
NYC
CO Springs

19© 2016 STR. All Rights Reserved.
Pipeline

20© 2016 STR. All Rights Reserved.
US Pipeline: I/C Growth Still Strong (But Growth Rates Used to be 30%+)
Phase 2017 2016 % Change
In Construction 190 149 27%
Final Planning 204 188 9%
Planning 180 158 14%
Under Contract 575 496 16%
*Total US Pipeline, by Phase, ‘000s Rooms, January 2017 and 2016

21© 2016 STR. All Rights Reserved.
*Total US Pipeline; Rooms In Construction, in ‘000s; 1/2006 – 1/2017
0
50
100
150
200
250
2006 2008 2010 2012 2014 2016
Low: May ‘11
50K
Jan‘17
190K
High:
Dec ‘07
211K
21K
I/C Pipeline Is Growing But Still Below Prior Peak
Th
ou
sa
nd
s

22© 2016 STR. All Rights Reserved.
Limited Service Construction Is The Name Of The Game
8.0
24.6
61.8 62.1
8.8
2.0
23.0
Luxury Upper Upscale Upscale Upper Midscale Midscale Economy Unaffiliated
*US Pipeline, Rooms In Construction , ‘000s Rooms, by Scale, January 2017
65%

23© 2016 STR. All Rights Reserved.
Construction In Top 26 Markets: 10 With 5%+ Of Supply
*US Pipeline, Top 26 Markets, I/C Rooms as % of Existing Supply, January 2017
Market Rooms I/C % Of Existing
Oahu Island, HI 180 1%
Norfolk/Virginia Beach, VA 456 1%
Orlando, FL 2,032 2%
Minneapolis/St Paul, MN-WI 887 2%
Las Vegas, NV 4,116 3%
St Louis, MO-IL 1,087 3%
Phoenix, AZ 1,962 3%
New Orleans, LA 1,317 3%
Chicago, IL 3,780 3%
San Francisco/San Mateo, CA 1,825 4%
Detroit, MI 1,548 4%
Washington, DC-MD-VA 4,069 4%
Atlanta, GA 3,649 4%
Tampa/St Petersburg, FL 1,771 4%
San Diego, CA 2,468 4%
Anaheim/Santa Ana, CA 2,348 4%
Boston, MA 2,823 5%
Houston, TX 4,778 6%
Philadelphia, PA-NJ 2,705 6%
Los Angeles/Long Beach, CA 6,070 6%
Miami/Hialeah, FL 3,578 7%
Dallas, TX 7,228 9%
Nashville, TN 3,904 10%
Denver, CO 4,586 10%
Seattle, WA 5,117 12%
New York, NY 15,607 14%

24© 2016 STR. All Rights Reserved.
Forecast
25© 2016 STR. All Rights Reserved.
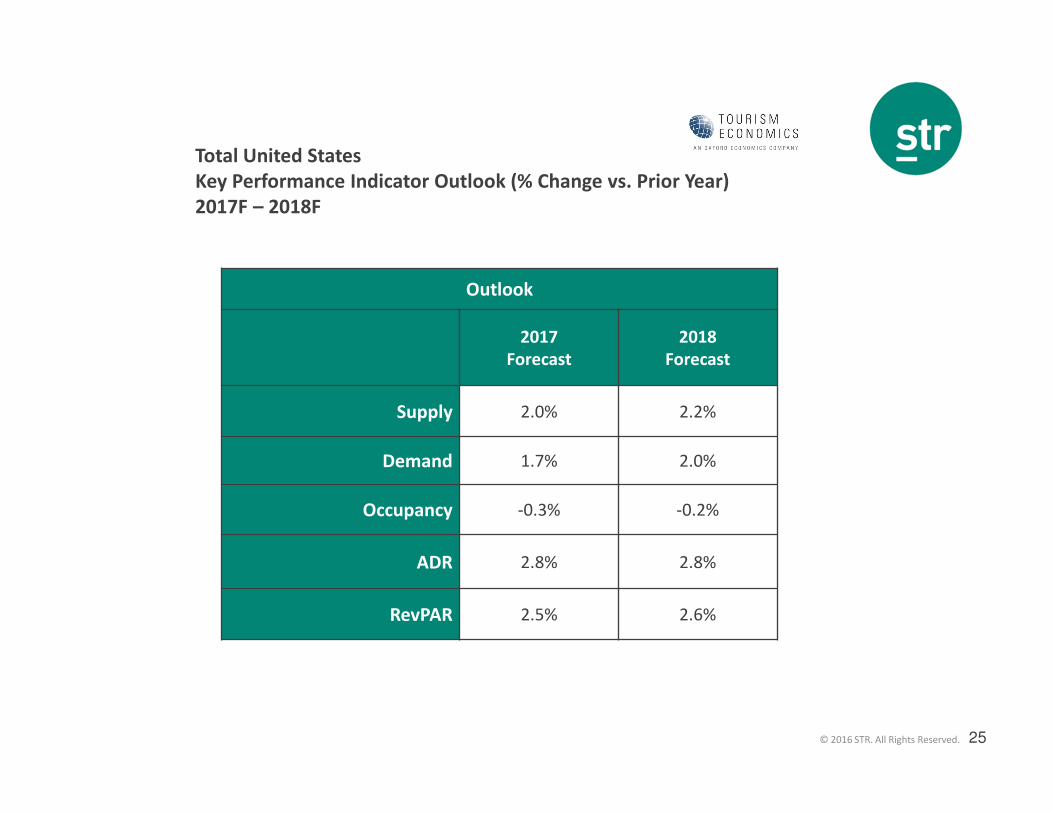
Total United States
Key Performance Indicator Outlook (% Change vs. Prior Year)
2017F – 2018F
Outlook
2017
Forecast
2018
Forecast
Supply 2.0% 2.2%
Demand 1.7% 2.0%
Occupancy -0.3% -0.2%
ADR 2.8% 2.8%
RevPAR 2.5% 2.6%
26© 2016 STR. All Rights Reserved.
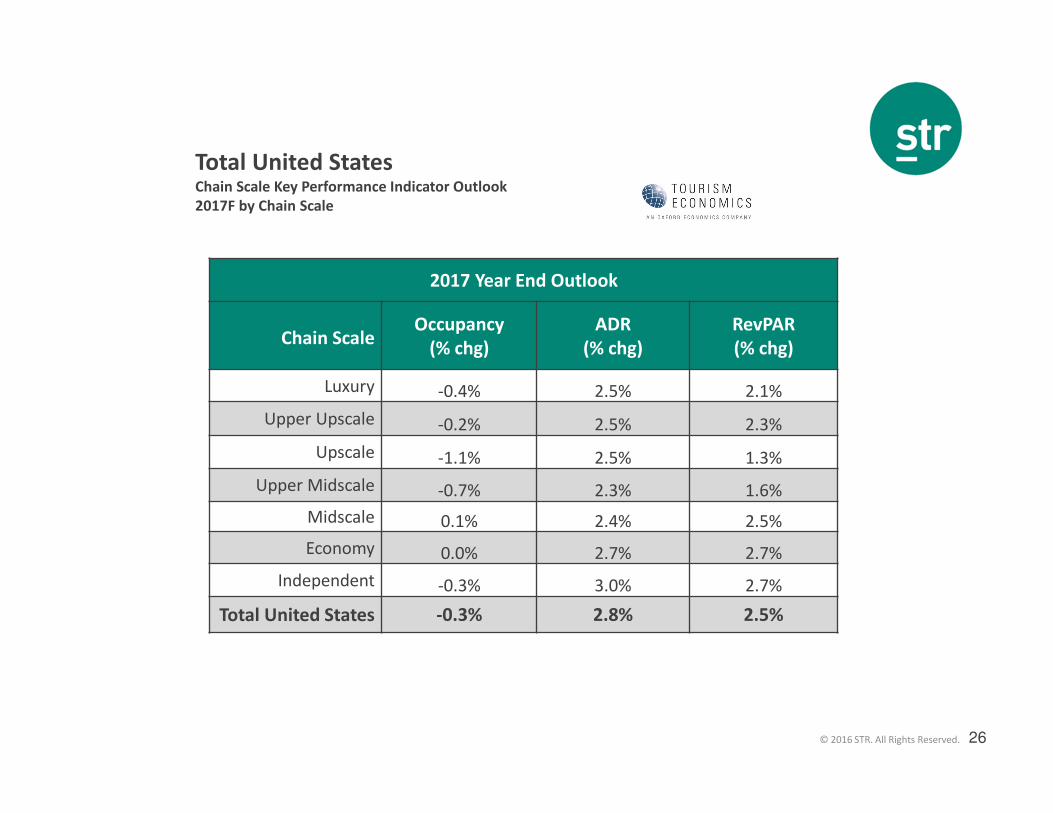
Total United StatesChain Scale Key Performance Indicator Outlook
2017F by Chain Scale
2017 Year End Outlook
Chain ScaleOccupancy
(% chg)
ADR
(% chg)
RevPAR
(% chg)
Luxury -0.4% 2.5% 2.1%
Upper Upscale -0.2% 2.5% 2.3%
Upscale -1.1% 2.5% 1.3%
Upper Midscale -0.7% 2.3% 1.6%
Midscale 0.1% 2.4% 2.5%
Economy 0.0% 2.7% 2.7%
Independent -0.3% 3.0% 2.7%
Total United States -0.3% 2.8% 2.5%

27© 2016 STR. All Rights Reserved.
Total United StatesChain Scale Key Performance Indicator Outlook
2018F by Chain Scale
2018 Year End Outlook
Chain ScaleOccupancy
(% chg)
ADR
(% chg)
RevPAR
(% chg)
Luxury -0.2% 3.0% 2.8%
Upper Upscale -0.1% 2.8% 2.7%
Upscale -0.7% 2.5% 1.7%
Upper Midscale -0.6% 2.5% 1.9%
Midscale -0.2% 2.5% 2.2%
Economy -0.1% 2.3% 2.3%
Independent -0.2% 2.8% 2.7%
Total United States -0.2% 2.8% 2.6%

28
© 2016 STR, Inc. All Rights Reserved.
Any reprint, use or republication of all or a part of this presentation without the prior written approval of STR, Inc. or STR Global, Ltd. trading as STR
(collectively “STR”) is strictly prohibited. Any such reproduction shall specifically credit STR as the source. This presentation is based on data collected by STR.
No strategic advice or marketing recommendation is intended or implied.
Nashville Hotel
Industry Performance
Jan D. Freitag
Senior Vice President
@jan_freitag

29© 2016 STR. All Rights Reserved.
Demand Was Never Higher
% Change
• Room Supply 2.2%
• Room Demand 3.8%
• Occupancy 74.6% 1.5%
• A.D.R. $134.82 5.9%
• RevPAR $100.64 7.5%
Nashville, TN; January 2017 12 MMA KPIs
30© 2016 STR. All Rights Reserved.
Demand Growth Slows. Supply Growth Increases To 2.2%.
0
2
4
6
8
10
2013 2014 2015 2016 2017
Supply % Change
Demand % Change
2.72.2
Nashville market., Supply & Demand % Change, 12 MMA 1/1990 – 1/2017
8.1
3.8
2.5

31© 2016 STR. All Rights Reserved.
Growth Slowing
0
3
6
9
12
2013 2014 2015 2016
Occ % Change
ADR % Change
5.95.6
1.5
Nashville, ADR & OCC % Change, 12 MMA 1/1990 – 1/2017
12.8
32© 2016 STR. All Rights Reserved.
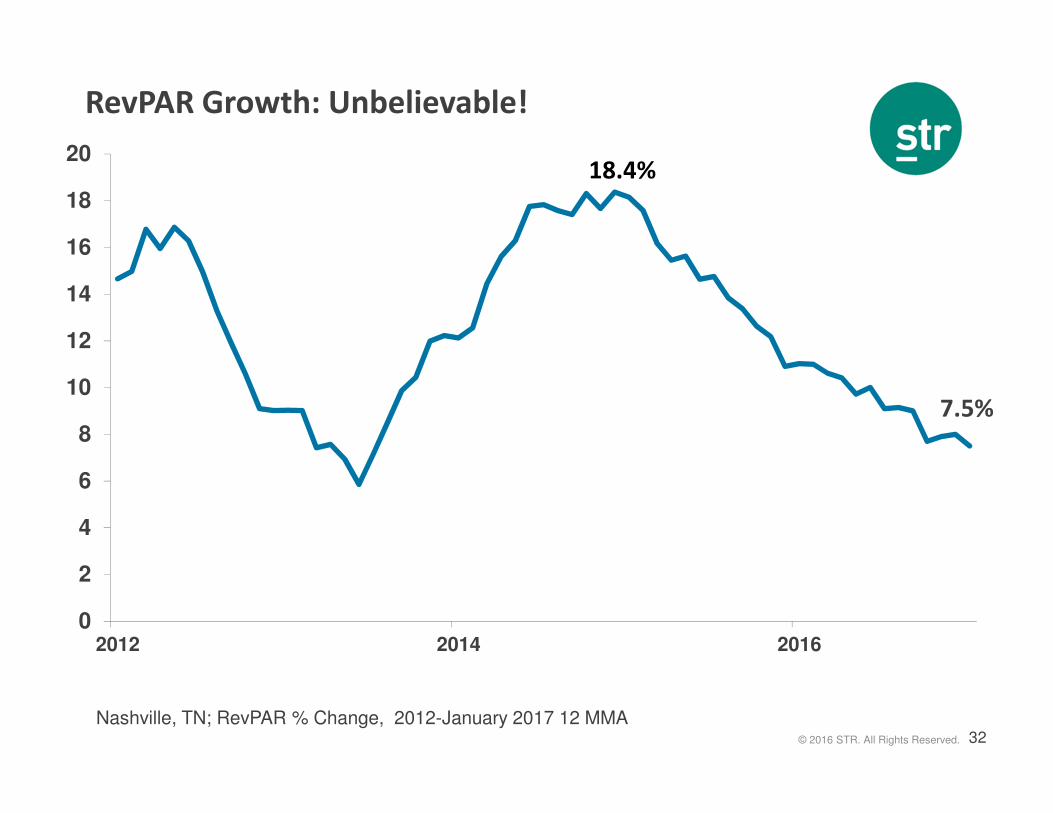
RevPAR Growth: Unbelievable!
0
2
4
6
8
10
12
14
16
18
20
2012 2014 2016
18.4%
Nashville, TN; RevPAR % Change, 2012-January 2017 12 MMA
7.5%

33© 2016 STR. All Rights Reserved.
For Perspective: Massive Changes Since 2010
15%
47%
28%
56%
99%
Supply Demand Occupancy ADR RevPAR
Nashville, TN; September YTD KPIs: 2016 vs 2010

34© 2016 STR. All Rights Reserved.
Submarket RevPAR Growth Also Very Strong
5.87.0
5.5
9.3
13.0
11.1
Nashville, TN Submarkets; RevPAR % Change December YTD 2016
35© 2016 STR. All Rights Reserved.
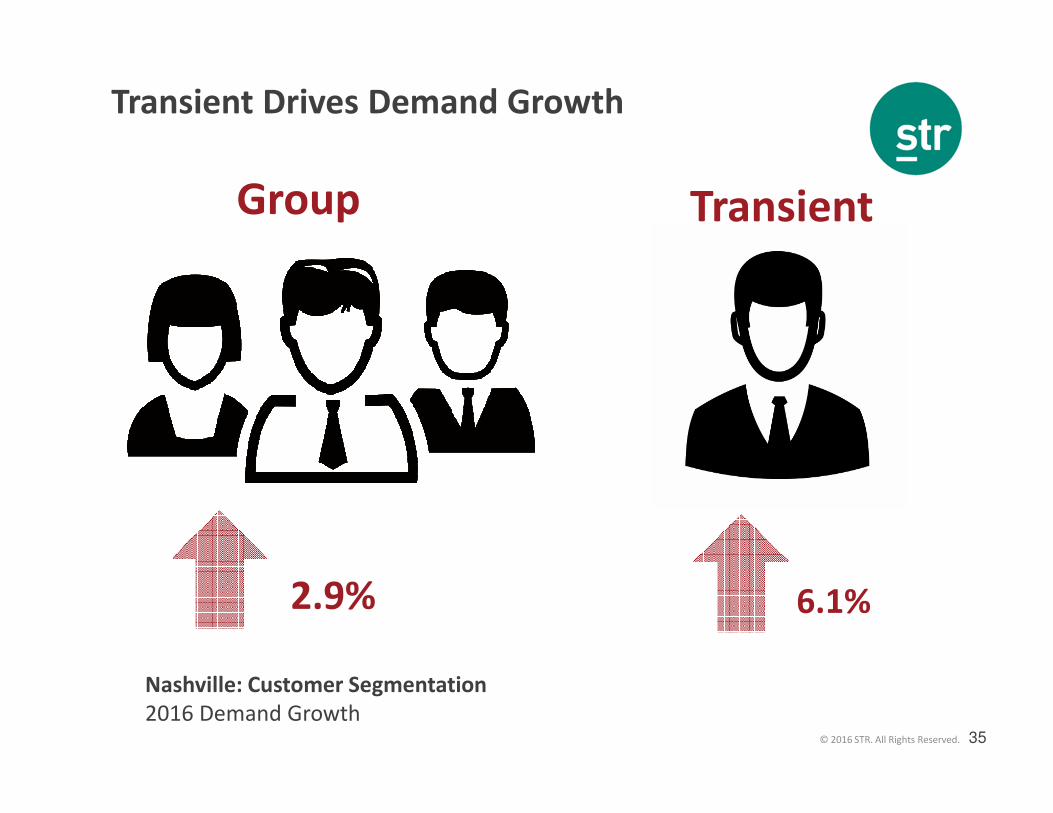
GROU
PTRANSIEN
T
6.1%
20.7%Nashville: Customer Segmentation
2016 Demand Growth
2.9%
Group Transient
Transient Drives Demand Growth

36© 2016 STR. All Rights Reserved.
Nashville Pipeline: But wait, there’s more …
Phase 2016 2015 % Change
In Construction 3.4 2.0 70%
Final Planning 3.8 4.6 -17%
Planning 4.9 2.8 75%
Under Contract 12.1 9.4 29%
Nashville Pipeline, by Phase, ‘000s Rooms, December 2015 and 2016

37© 2016 STR. All Rights Reserved.
2017 Year End RevPAR ForecastTop 25 US Markets, Nov 2016 Forecast (Markets sorted alphabetically)
-5% to 0% 0% to 5% 5% to 10%
Houston, TX Anaheim-Santa Ana, CA
Miami-Hialeah, FL Atlanta, GA
New York, NY Boston, MA
Chicago, IL
Dallas, TX
Denver, CO
Detroit, MI
Los Angeles-Long Beach, CA
Minneapolis-St. Paul, MN-WI
Nashville, TN
New Orleans, LA
Norfolk-Virginia Beach, VA
Oahu Island, HI
Orlando, FL
Philadelphia, PA-NJ
Phoenix, AZ
San Diego, CA
San Francisco/San Mateo, CA
Seattle, WA
St. Louis, MO-IL
Tampa, FL
Washington, D.C.

38© 2016 STR. All Rights Reserved.
Thank You!


![[XLS] · Web viewSTR 20015 STR 30105 STR 30115 STR 30123 STR 30125 STR 30130 STR 40090 ORİ STR 40115 STR 41090 ORİ STR 44115 STR 45111 STR 50020 STR 50103A STR 50112 STR 50113A](https://img.pdfslide.net/doc/110x75/5ad04b0c7f8b9a1d328e1e93/xls-viewstr-20015-str-30105-str-30115-str-30123-str-30125-str-30130-str-40090.jpg)