Embed Size (px)
Citation preview
Prepared byNew Haven Economic Performance Laboratory
in association with Department of Economics, College of Business, University of New Haven Entrepreneurship and Innovation Program, University of New Haven Online at www.nhepl.org.
GREATER NEW HAVEN ECONOMIC ACTIVITY REPORTFall 2016


December, 2016
The Fall, 2016 edition of the Economic Activity Report, published by the New Haven Economic Performance Laboratory, represents a collaborative and peda-gogical effort by faculty and students of the Department of Economics. It contains trustworthy and relevant socio-economic information and analysis that focuses on the economic conditions in Connecticut and, in particular, the greater New Haven Region. The Fall, 2016 report (as well as previous reports) can also be found on the Laboratory’s website (www.nhepl.org).
This report contains a set of economic data series analyzed by Department of Economics capstone students. Students were charged to instruct, inform and evaluate a data series as a means by which to further their understanding of economics as well as provide information services that can guide and inform public policy initiatives. The University of New Haven student analysts of today are the analysts on whom our future turns. Their names and e-mail addresses are included. Please do not hesitate to contact them.
Also included in this report are certain indices and analyses jointly developed by faculty and students. Of particular note are the New Haven Regional Economic Performance Index and a Shift-Share and Random Forest Analysis specifically examining the New Haven Region. The objective of the foregoing is to fill the gap created by official government statistics, which reflects the strengths of our program in Data Analytics and Behavioral Economics.
In addition to visiting the Laboratory’s website, you are invited to visit another student initiative that involves posts, commentary and noteworthy contributions from students, faculty, alumni and members of the broader community: The University of New Haven Economics Collective (http://unheconomicscollective.ning.com). The Collective, as it is affectionately known, is a thought-leadership and learning space that fosters the integration of theory, technical competencies, real-life learning and communication skills.
Kind regards,
Brian T. Kench, Ph.D. Dean, College of Business
Executive Summary .............................................2
New Haven Region Economic Performance Index ..............................3
The Connecticut Value Index ...............................5
Housing ..............................................................6
Labor Force, Manufacturing Employment and Unemployment ........................7
Gross Domestic Product and Consumer Price Index ..................................9
Conclusion: A Connecticut Assessment “The Forest from the Trees” ...............................10
A Collective from the Collective ........................12
About the Laboratory ........................................13
GREATER NEW HAVEN ECONOMIC ACTIVITY REPORT 1
General economic conditions continue to improve in Connecticut and the New Haven Region as they do for the nation. The New Haven Region’s performance improvement, however, continues to lag other states in New England and the nation. The improvement is far from robust, as is evident by the interpretation of the data reflected in the New Haven Region Economic Performance Index as well as information pertaining to housing, employment, unemployment, gross domestic product and consumer prices.
While it has been suggested by many that a reduction in corporate taxes could reverse the State of Connecticut’s anemic performance, our Winter 2016 Report called for a renewed emphasis on entrepreneurship and the importance of establishing priorities to address the improving, yet mixed, state of affairs. The Opportunity Share of New Entrepreneurs of the Kauffman Index of Entrepreneurship identified Connecticut’s notice-able difference in performance to its neighbors. Connecticut continues to underperform. We continue to encourage a multi-pronged approach: tax policy alone is not the answer. The recent Connecticut legislative initiatives related to entrepreneurship, which, among other things, encourage partnerships between the public and private sectors with the academic community, could bolster Connecticut’s position as an entrepreneurial and innovation-friendly place. The same can be said for the City of New Haven, which continues to create local initiatives. The city of New Haven also recently received a CTNext grant from the State of Connecticut for purposes of establishing the city as an “innovative place.” The focus of the grant is to formulate a strategic plan that could ultimately make the city eligible for other grants so as to recruit, attract, and expand the technology sector of the local economy.
Of course, further complicating matters from a national perspective as well as a local perspective are the policies and programs that could result from a Trump Administration, none of which has been rolled into this report.
Executive Summary
GREATER NEW HAVEN ECONOMIC ACTIVITY REPORT2
Comments should be directed to Esin Cakan, Ph.D. at [email protected].
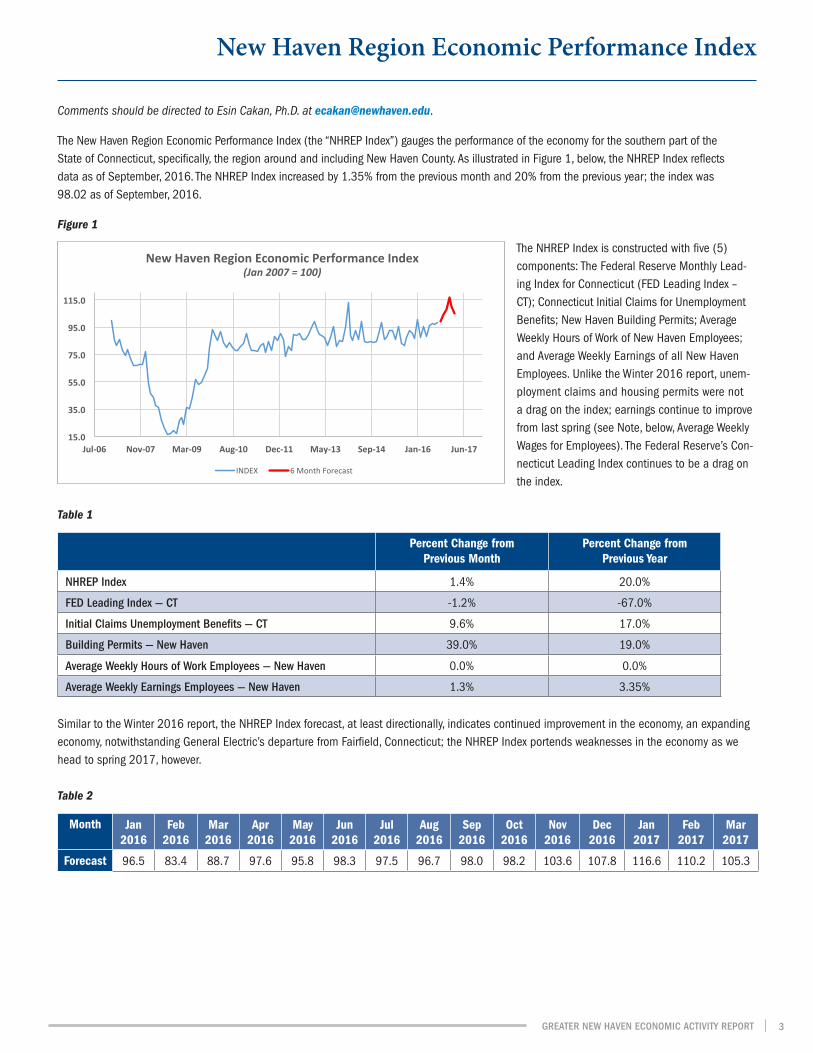
The New Haven Region Economic Performance Index (the “NHREP Index”) gauges the performance of the economy for the southern part of the State of Connecticut, specifically, the region around and including New Haven County. As illustrated in Figure 1, below, the NHREP Index reflects data as of September, 2016. The NHREP Index increased by 1.35% from the previous month and 20% from the previous year; the index was 98.02 as of September, 2016.
Figure 1
The NHREP Index is constructed with five (5) components: The Federal Reserve Monthly Lead-ing Index for Connecticut (FED Leading Index – CT); Connecticut Initial Claims for Unemployment Benefits; New Haven Building Permits; Average Weekly Hours of Work of New Haven Employees; and Average Weekly Earnings of all New Haven Employees. Unlike the Winter 2016 report, unem-ployment claims and housing permits were not a drag on the index; earnings continue to improve from last spring (see Note, below, Average Weekly Wages for Employees). The Federal Reserve’s Con-necticut Leading Index continues to be a drag on the index.
Table 1
Percent Change from Previous Month
Percent Change from Previous Year
NHREP Index 1.4% 20.0%
FED Leading Index — CT -1.2% -67.0%
Initial Claims Unemployment Benefits — CT 9.6% 17.0%
Building Permits — New Haven 39.0% 19.0%
Average Weekly Hours of Work Employees — New Haven 0.0% 0.0%
Average Weekly Earnings Employees — New Haven 1.3% 3.35%
Similar to the Winter 2016 report, the NHREP Index forecast, at least directionally, indicates continued improvement in the economy, an expanding economy, notwithstanding General Electric’s departure from Fairfield, Connecticut; the NHREP Index portends weaknesses in the economy as we head to spring 2017, however. Table 2
Month Jan 2016
Feb 2016
Mar 2016
Apr 2016
May 2016
Jun 2016
Jul 2016
Aug 2016
Sep 2016
Oct 2016
Nov 2016
Dec 2016
Jan 2017
Feb 2017
Mar 2017
Forecast 96.5 83.4 88.7 97.6 95.8 98.3 97.5 96.7 98.0 98.2 103.6 107.8 116.6 110.2 105.3
New Haven Region Economic Performance Index
15.0
35.0
55.0
75.0
95.0
115.0
Jul-‐06 Nov-‐07 Mar-‐09 Aug-‐10 Dec-‐11 May-‐13 Sep-‐14 Jan-‐16 Jun-‐17
New Haven Region Economic Performance Index (Jan 2007 = 100)
INDEX 6 Month Forecast
GREATER NEW HAVEN ECONOMIC ACTIVITY REPORT 3
Note: Average Weekly Wages for Employees
Comments should be directed to Jurgena Hysolli at [email protected].
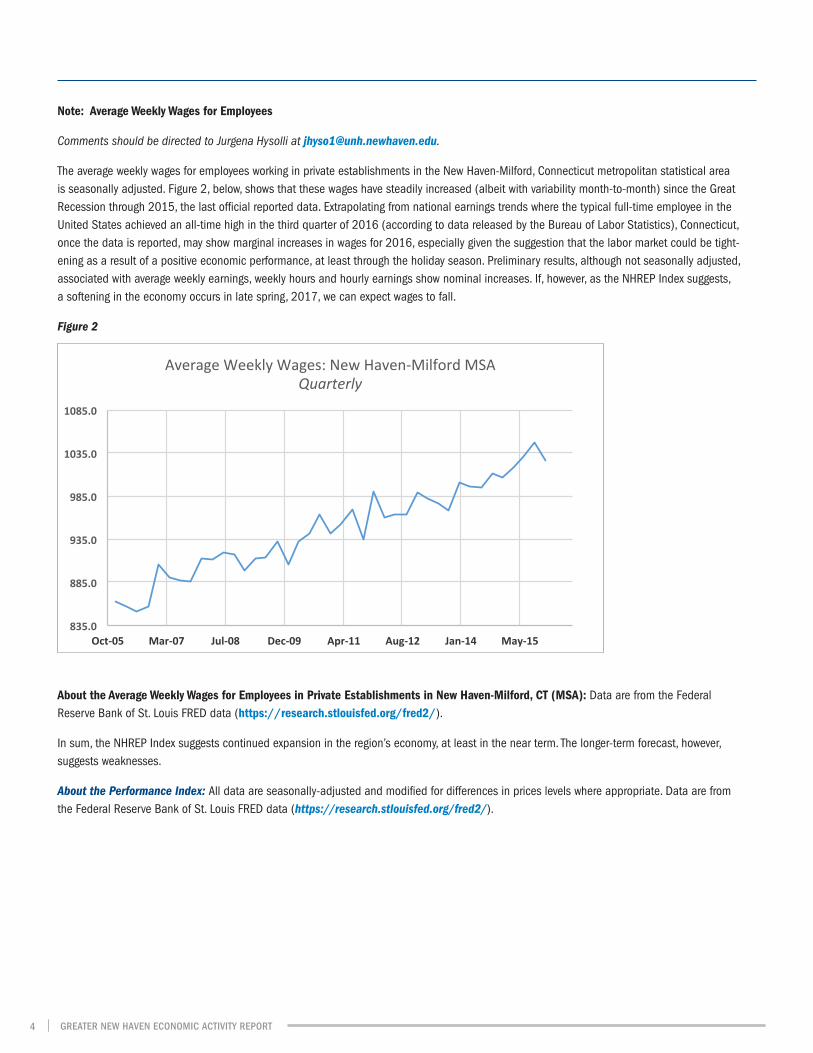
The average weekly wages for employees working in private establishments in the New Haven-Milford, Connecticut metropolitan statistical area is seasonally adjusted. Figure 2, below, shows that these wages have steadily increased (albeit with variability month-to-month) since the Great Recession through 2015, the last official reported data. Extrapolating from national earnings trends where the typical full-time employee in the United States achieved an all-time high in the third quarter of 2016 (according to data released by the Bureau of Labor Statistics), Connecticut, once the data is reported, may show marginal increases in wages for 2016, especially given the suggestion that the labor market could be tight-ening as a result of a positive economic performance, at least through the holiday season. Preliminary results, although not seasonally adjusted, associated with average weekly earnings, weekly hours and hourly earnings show nominal increases. If, however, as the NHREP Index suggests, a softening in the economy occurs in late spring, 2017, we can expect wages to fall.
Figure 2
About the Average Weekly Wages for Employees in Private Establishments in New Haven-Milford, CT (MSA): Data are from the Federal Reserve Bank of St. Louis FRED data (https://research.stlouisfed.org/fred2/).
In sum, the NHREP Index suggests continued expansion in the region’s economy, at least in the near term. The longer-term forecast, however, suggests weaknesses.
About the Performance Index: All data are seasonally-adjusted and modified for differences in prices levels where appropriate. Data are from the Federal Reserve Bank of St. Louis FRED data (https://research.stlouisfed.org/fred2/).
835.0
885.0
935.0
985.0
1035.0
1085.0
Oct-‐05 Mar-‐07 Jul-‐08 Dec-‐09 Apr-‐11 Aug-‐12 Jan-‐14 May-‐15
Average Weekly Wages: New Haven-‐Milford MSA Quarterly
GREATER NEW HAVEN ECONOMIC ACTIVITY REPORT4
Comments should be directed to Esin Cakan, Ph.D., at [email protected].
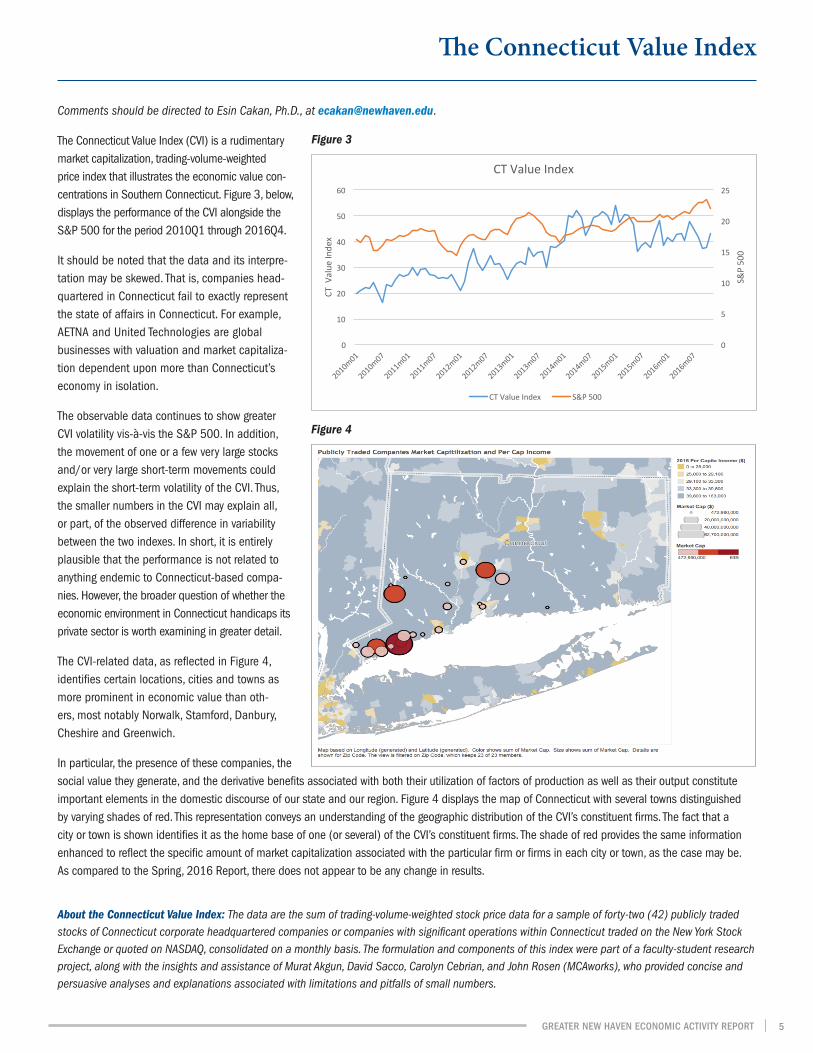
The Connecticut Value Index (CVI) is a rudimentary market capitalization, trading-volume-weighted price index that illustrates the economic value con-centrations in Southern Connecticut. Figure 3, below, displays the performance of the CVI alongside the S&P 500 for the period 2010Q1 through 2016Q4.
It should be noted that the data and its interpre-tation may be skewed. That is, companies head-quartered in Connecticut fail to exactly represent the state of affairs in Connecticut. For example, AETNA and United Technologies are global businesses with valuation and market capitaliza-tion dependent upon more than Connecticut’s economy in isolation.
The observable data continues to show greater CVI volatility vis-à-vis the S&P 500. In addition, the movement of one or a few very large stocks and/or very large short-term movements could explain the short-term volatility of the CVI. Thus, the smaller numbers in the CVI may explain all, or part, of the observed difference in variability between the two indexes. In short, it is entirely plausible that the performance is not related to anything endemic to Connecticut-based compa-nies. However, the broader question of whether the economic environment in Connecticut handicaps its private sector is worth examining in greater detail.
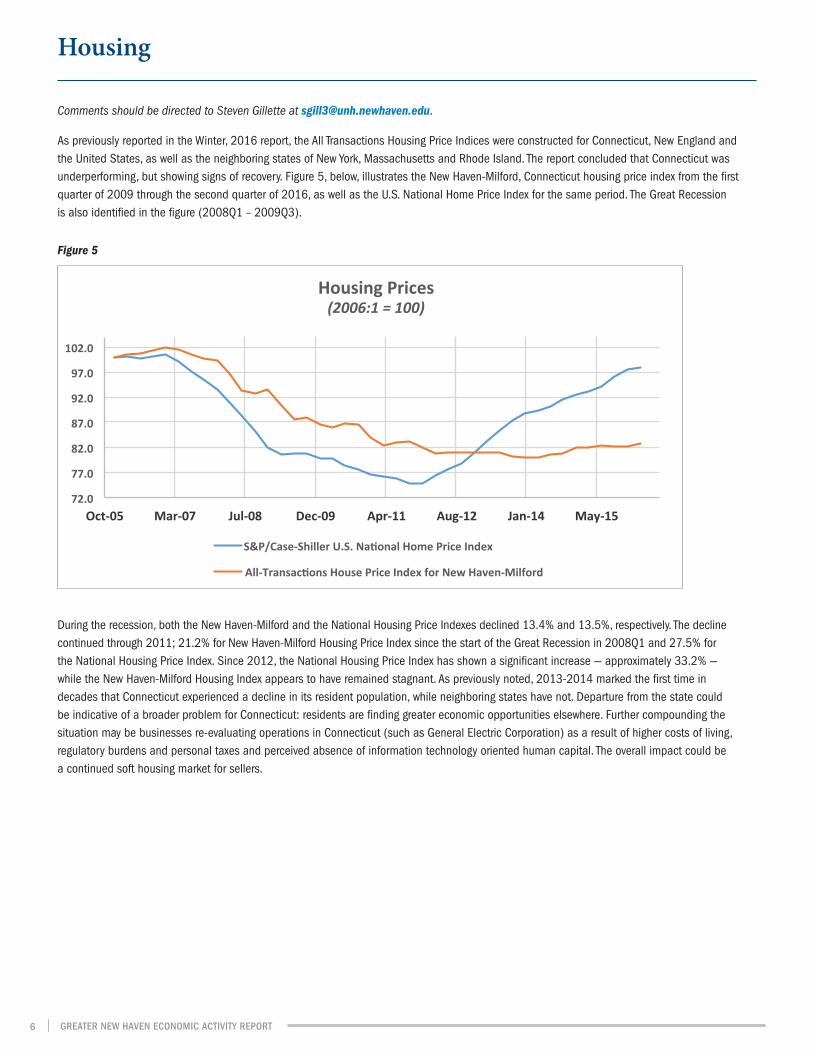
The CVI-related data, as reflected in Figure 4, identifies certain locations, cities and towns as more prominent in economic value than oth-ers, most notably Norwalk, Stamford, Danbury, Cheshire and Greenwich.
In particular, the presence of these companies, the social value they generate, and the derivative benefits associated with both their utilization of factors of production as well as their output constitute important elements in the domestic discourse of our state and our region. Figure 4 displays the map of Connecticut with several towns distinguished by varying shades of red. This representation conveys an understanding of the geographic distribution of the CVI’s constituent firms. The fact that a city or town is shown identifies it as the home base of one (or several) of the CVI’s constituent firms. The shade of red provides the same information enhanced to reflect the specific amount of market capitalization associated with the particular firm or firms in each city or town, as the case may be. As compared to the Spring, 2016 Report, there does not appear to be any change in results.
About the Connecticut Value Index: The data are the sum of trading-volume-weighted stock price data for a sample of forty-two (42) publicly traded stocks of Connecticut corporate headquartered companies or companies with significant operations within Connecticut traded on the New York Stock Exchange or quoted on NASDAQ, consolidated on a monthly basis. The formulation and components of this index were part of a faculty-student research project, along with the insights and assistance of Murat Akgun, David Sacco, Carolyn Cebrian, and John Rosen (MCAworks), who provided concise and persuasive analyses and explanations associated with limitations and pitfalls of small numbers.
The Connecticut Value Index
Figure 3
0
5
10
15
20
25
0
10
20
30
40
50
60
2010m01
2010m07
2011m01
2011m07
2012m01
2012m07
2013m01
2013m07
2014m01
2014m07
2015m01
2015m07
2016m01
2016m07
S&P 500
CT V
alue
Inde
x
CT Value Index
CT Value Index S&P 500
Figure 4
GREATER NEW HAVEN ECONOMIC ACTIVITY REPORT 5
72.0
77.0
82.0
87.0
92.0
97.0
102.0
Oct-‐05 Mar-‐07 Jul-‐08 Dec-‐09 Apr-‐11 Aug-‐12 Jan-‐14 May-‐15
Housing Prices (2006:1 = 100)
S&P/Case-‐Shiller U.S. NaHonal Home Price Index
All-‐TransacHons House Price Index for New Haven-‐Milford
Comments should be directed to Steven Gillette at [email protected].
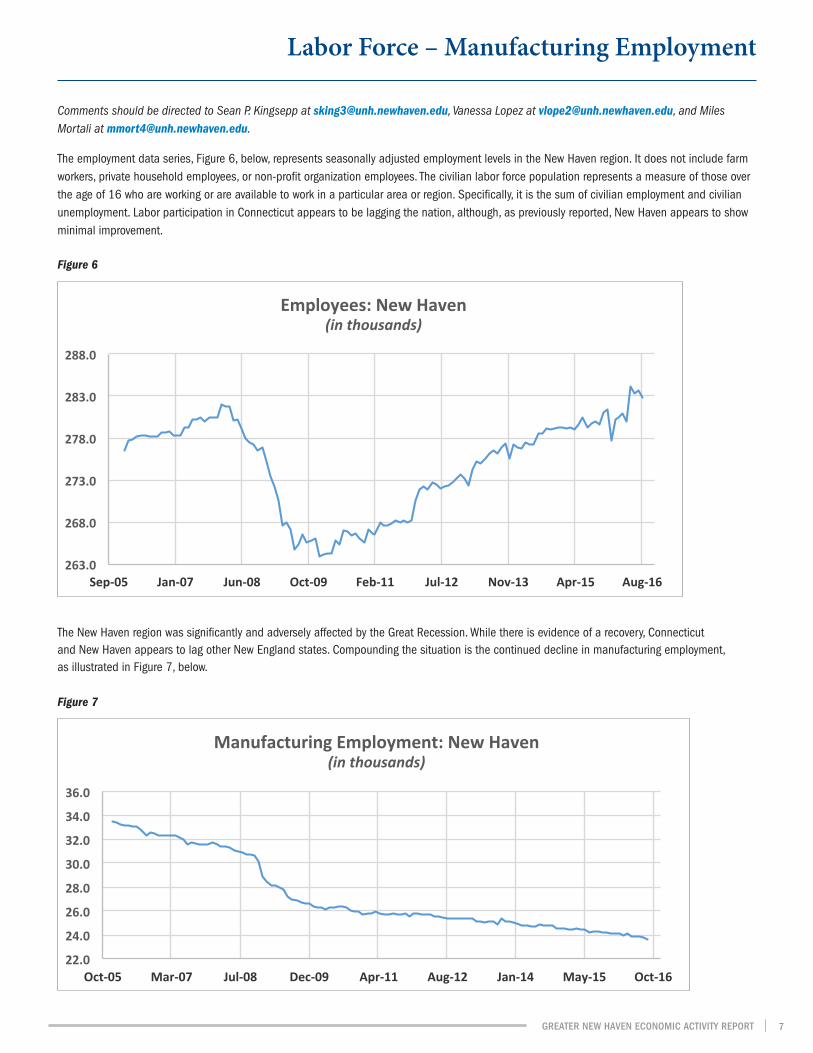
As previously reported in the Winter, 2016 report, the All Transactions Housing Price Indices were constructed for Connecticut, New England and the United States, as well as the neighboring states of New York, Massachusetts and Rhode Island. The report concluded that Connecticut was underperforming, but showing signs of recovery. Figure 5, below, illustrates the New Haven-Milford, Connecticut housing price index from the first quarter of 2009 through the second quarter of 2016, as well as the U.S. National Home Price Index for the same period. The Great Recession is also identified in the figure (2008Q1 – 2009Q3).
Housing
Figure 5
During the recession, both the New Haven-Milford and the National Housing Price Indexes declined 13.4% and 13.5%, respectively. The decline continued through 2011; 21.2% for New Haven-Milford Housing Price Index since the start of the Great Recession in 2008Q1 and 27.5% for the National Housing Price Index. Since 2012, the National Housing Price Index has shown a significant increase — approximately 33.2% — while the New Haven-Milford Housing Index appears to have remained stagnant. As previously noted, 2013-2014 marked the first time in decades that Connecticut experienced a decline in its resident population, while neighboring states have not. Departure from the state could be indicative of a broader problem for Connecticut: residents are finding greater economic opportunities elsewhere. Further compounding the situation may be businesses re-evaluating operations in Connecticut (such as General Electric Corporation) as a result of higher costs of living, regulatory burdens and personal taxes and perceived absence of information technology oriented human capital. The overall impact could be a continued soft housing market for sellers.
GREATER NEW HAVEN ECONOMIC ACTIVITY REPORT6
Comments should be directed to Sean P. Kingsepp at [email protected], Vanessa Lopez at [email protected], and Miles Mortali at [email protected].
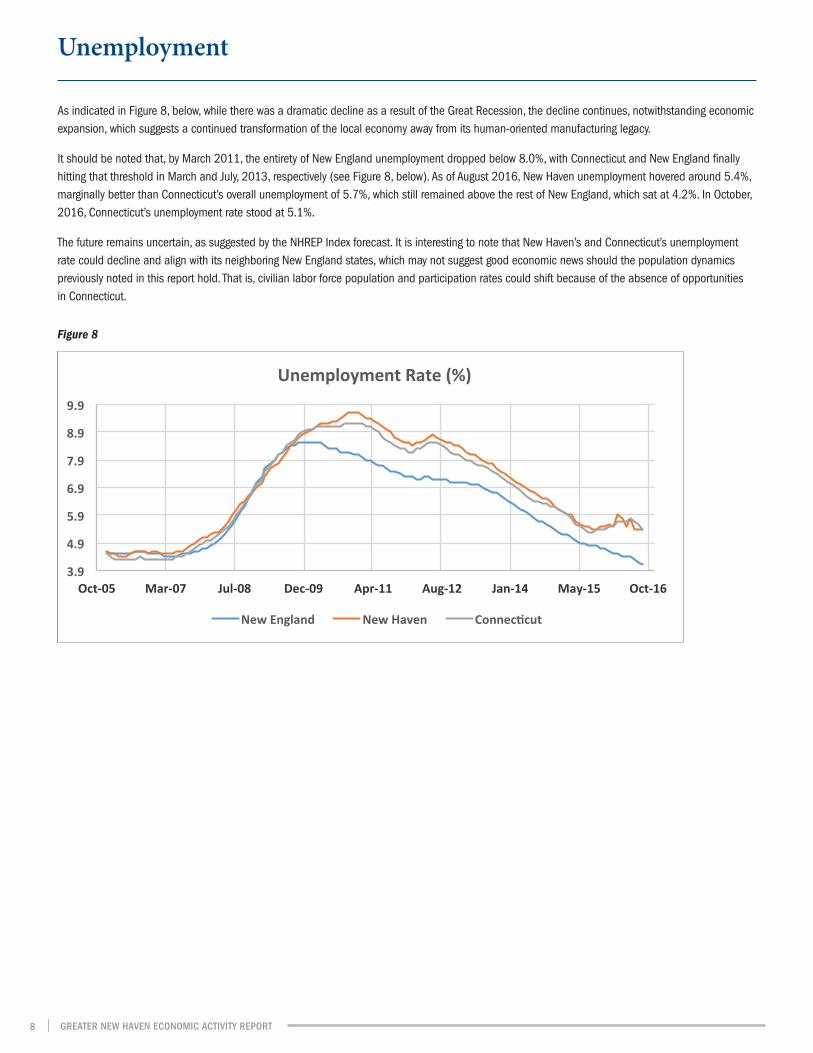
The employment data series, Figure 6, below, represents seasonally adjusted employment levels in the New Haven region. It does not include farm workers, private household employees, or non-profit organization employees. The civilian labor force population represents a measure of those over the age of 16 who are working or are available to work in a particular area or region. Specifically, it is the sum of civilian employment and civilian unemployment. Labor participation in Connecticut appears to be lagging the nation, although, as previously reported, New Haven appears to show minimal improvement.
The New Haven region was significantly and adversely affected by the Great Recession. While there is evidence of a recovery, Connecticut and New Haven appears to lag other New England states. Compounding the situation is the continued decline in manufacturing employment, as illustrated in Figure 7, below.
Figure 6
Labor Force – Manufacturing Employment
263.0
268.0
273.0
278.0
283.0
288.0
Sep-‐05 Jan-‐07 Jun-‐08 Oct-‐09 Feb-‐11 Jul-‐12 Nov-‐13 Apr-‐15 Aug-‐16
Employees: New Haven (in thousands)
22.0
24.0
26.0
28.0
30.0
32.0
34.0
36.0
Oct-‐05 Mar-‐07 Jul-‐08 Dec-‐09 Apr-‐11 Aug-‐12 Jan-‐14 May-‐15 Oct-‐16
Manufacturing Employment: New Haven (in thousands)
Figure 7
GREATER NEW HAVEN ECONOMIC ACTIVITY REPORT 7
As indicated in Figure 8, below, while there was a dramatic decline as a result of the Great Recession, the decline continues, notwithstanding economic expansion, which suggests a continued transformation of the local economy away from its human-oriented manufacturing legacy.
It should be noted that, by March 2011, the entirety of New England unemployment dropped below 8.0%, with Connecticut and New England finally hitting that threshold in March and July, 2013, respectively (see Figure 8, below). As of August 2016, New Haven unemployment hovered around 5.4%, marginally better than Connecticut’s overall unemployment of 5.7%, which still remained above the rest of New England, which sat at 4.2%. In October, 2016, Connecticut’s unemployment rate stood at 5.1%.
The future remains uncertain, as suggested by the NHREP Index forecast. It is interesting to note that New Haven’s and Connecticut’s unemployment rate could decline and align with its neighboring New England states, which may not suggest good economic news should the population dynamics previously noted in this report hold. That is, civilian labor force population and participation rates could shift because of the absence of opportunities in Connecticut.
Unemployment
Figure 8
3.9
4.9
5.9
6.9
7.9
8.9
9.9
Oct-‐05 Mar-‐07 Jul-‐08 Dec-‐09 Apr-‐11 Aug-‐12 Jan-‐14 May-‐15 Oct-‐16
Unemployment Rate (%)
New England New Haven ConnecLcut
GREATER NEW HAVEN ECONOMIC ACTIVITY REPORT8
Comments should be directed to David Ortone at [email protected] and Nathan J. Pitruzzello at [email protected].
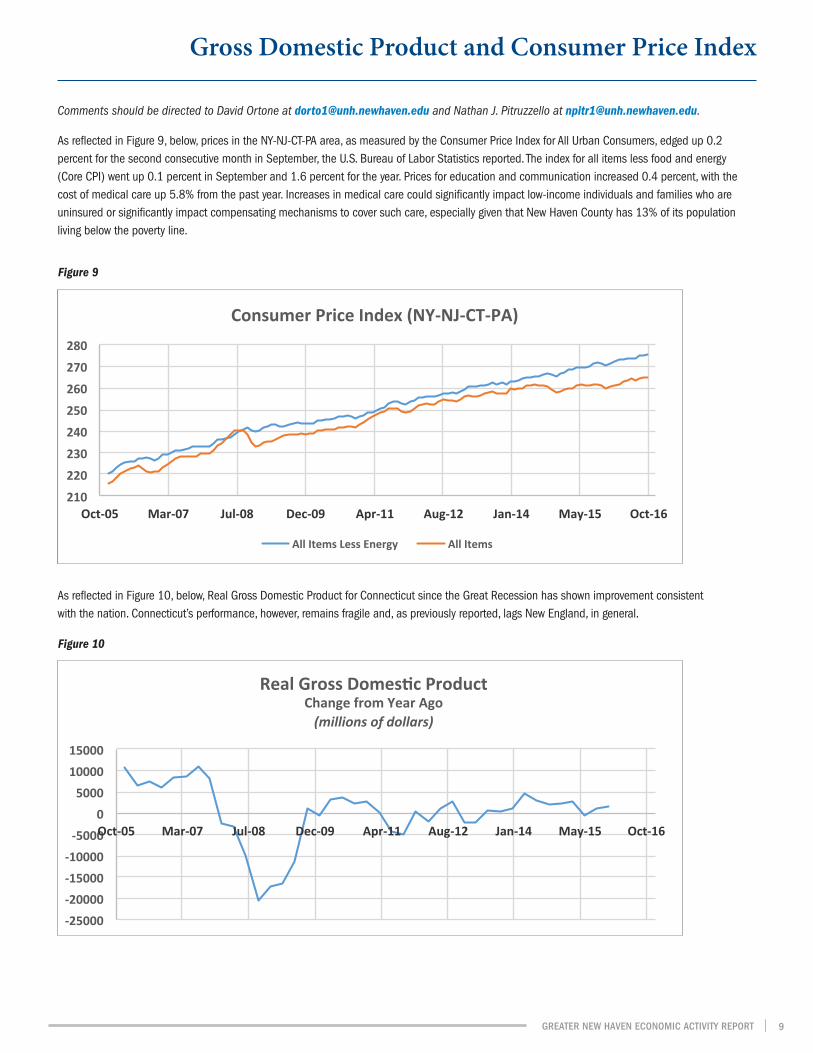
As reflected in Figure 9, below, prices in the NY-NJ-CT-PA area, as measured by the Consumer Price Index for All Urban Consumers, edged up 0.2 percent for the second consecutive month in September, the U.S. Bureau of Labor Statistics reported. The index for all items less food and energy (Core CPI) went up 0.1 percent in September and 1.6 percent for the year. Prices for education and communication increased 0.4 percent, with the cost of medical care up 5.8% from the past year. Increases in medical care could significantly impact low-income individuals and families who are uninsured or significantly impact compensating mechanisms to cover such care, especially given that New Haven County has 13% of its population living below the poverty line.
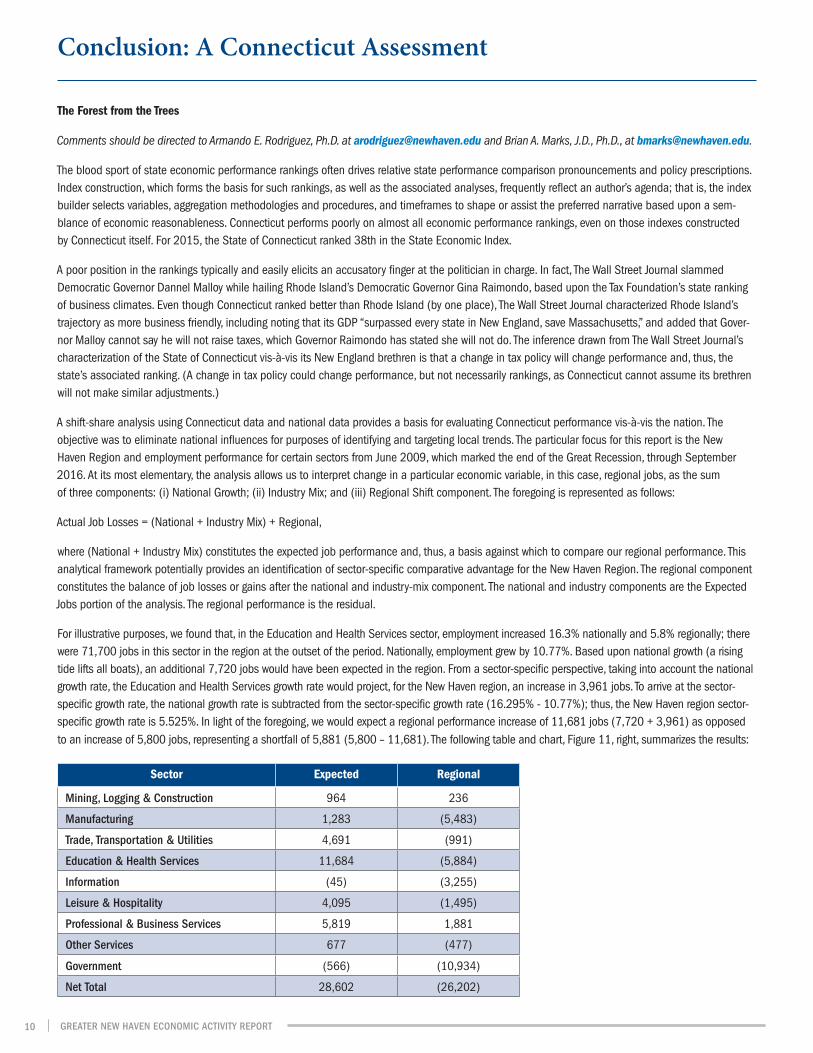
As reflected in Figure 10, below, Real Gross Domestic Product for Connecticut since the Great Recession has shown improvement consistent with the nation. Connecticut’s performance, however, remains fragile and, as previously reported, lags New England, in general.
Gross Domestic Product and Consumer Price Index
210
220
230
240
250
260
270
280
Oct-‐05 Mar-‐07 Jul-‐08 Dec-‐09 Apr-‐11 Aug-‐12 Jan-‐14 May-‐15 Oct-‐16
Consumer Price Index (NY-‐NJ-‐CT-‐PA)
All Items Less Energy All Items
-‐25000 -‐20000 -‐15000 -‐10000 -‐5000
0 5000
10000 15000
Oct-‐05 Mar-‐07 Jul-‐08 Dec-‐09 Apr-‐11 Aug-‐12 Jan-‐14 May-‐15 Oct-‐16
Real Gross DomesAc Product Change from Year Ago (millions of dollars)
Figure 10
Figure 9
GREATER NEW HAVEN ECONOMIC ACTIVITY REPORT 9
Conclusion: A Connecticut Assessment
The Forest from the Trees
Comments should be directed to Armando E. Rodriguez, Ph.D. at [email protected] and Brian A. Marks, J.D., Ph.D., at [email protected].
The blood sport of state economic performance rankings often drives relative state performance comparison pronouncements and policy prescriptions. Index construction, which forms the basis for such rankings, as well as the associated analyses, frequently reflect an author’s agenda; that is, the index builder selects variables, aggregation methodologies and procedures, and timeframes to shape or assist the preferred narrative based upon a sem-blance of economic reasonableness. Connecticut performs poorly on almost all economic performance rankings, even on those indexes constructed by Connecticut itself. For 2015, the State of Connecticut ranked 38th in the State Economic Index.
A poor position in the rankings typically and easily elicits an accusatory finger at the politician in charge. In fact, The Wall Street Journal slammed Democratic Governor Dannel Malloy while hailing Rhode Island’s Democratic Governor Gina Raimondo, based upon the Tax Foundation’s state ranking of business climates. Even though Connecticut ranked better than Rhode Island (by one place), The Wall Street Journal characterized Rhode Island’s trajectory as more business friendly, including noting that its GDP “surpassed every state in New England, save Massachusetts,” and added that Gover-nor Malloy cannot say he will not raise taxes, which Governor Raimondo has stated she will not do. The inference drawn from The Wall Street Journal’s characterization of the State of Connecticut vis-à-vis its New England brethren is that a change in tax policy will change performance and, thus, the state’s associated ranking. (A change in tax policy could change performance, but not necessarily rankings, as Connecticut cannot assume its brethren will not make similar adjustments.)
A shift-share analysis using Connecticut data and national data provides a basis for evaluating Connecticut performance vis-à-vis the nation. The objective was to eliminate national influences for purposes of identifying and targeting local trends. The particular focus for this report is the New Haven Region and employment performance for certain sectors from June 2009, which marked the end of the Great Recession, through September 2016. At its most elementary, the analysis allows us to interpret change in a particular economic variable, in this case, regional jobs, as the sum of three components: (i) National Growth; (ii) Industry Mix; and (iii) Regional Shift component. The foregoing is represented as follows:
Actual Job Losses = (National + Industry Mix) + Regional,
where (National + Industry Mix) constitutes the expected job performance and, thus, a basis against which to compare our regional performance. This analytical framework potentially provides an identification of sector-specific comparative advantage for the New Haven Region. The regional component constitutes the balance of job losses or gains after the national and industry-mix component. The national and industry components are the Expected Jobs portion of the analysis. The regional performance is the residual.
For illustrative purposes, we found that, in the Education and Health Services sector, employment increased 16.3% nationally and 5.8% regionally; there were 71,700 jobs in this sector in the region at the outset of the period. Nationally, employment grew by 10.77%. Based upon national growth (a rising tide lifts all boats), an additional 7,720 jobs would have been expected in the region. From a sector-specific perspective, taking into account the national growth rate, the Education and Health Services growth rate would project, for the New Haven region, an increase in 3,961 jobs. To arrive at the sector-specific growth rate, the national growth rate is subtracted from the sector-specific growth rate (16.295% - 10.77%); thus, the New Haven region sector-specific growth rate is 5.525%. In light of the foregoing, we would expect a regional performance increase of 11,681 jobs (7,720 + 3,961) as opposed to an increase of 5,800 jobs, representing a shortfall of 5,881 (5,800 – 11,681). The following table and chart, Figure 11, right, summarizes the results:
Sector Expected Regional
Mining, Logging & Construction 964 236
Manufacturing 1,283 (5,483)
Trade, Transportation & Utilities 4,691 (991)
Education & Health Services 11,684 (5,884)
Information (45) (3,255)
Leisure & Hospitality 4,095 (1,495)
Professional & Business Services 5,819 1,881
Other Services 677 (477)
Government (566) (10,934)
Net Total 28,602 (26,202)
GREATER NEW HAVEN ECONOMIC ACTIVITY REPORT10
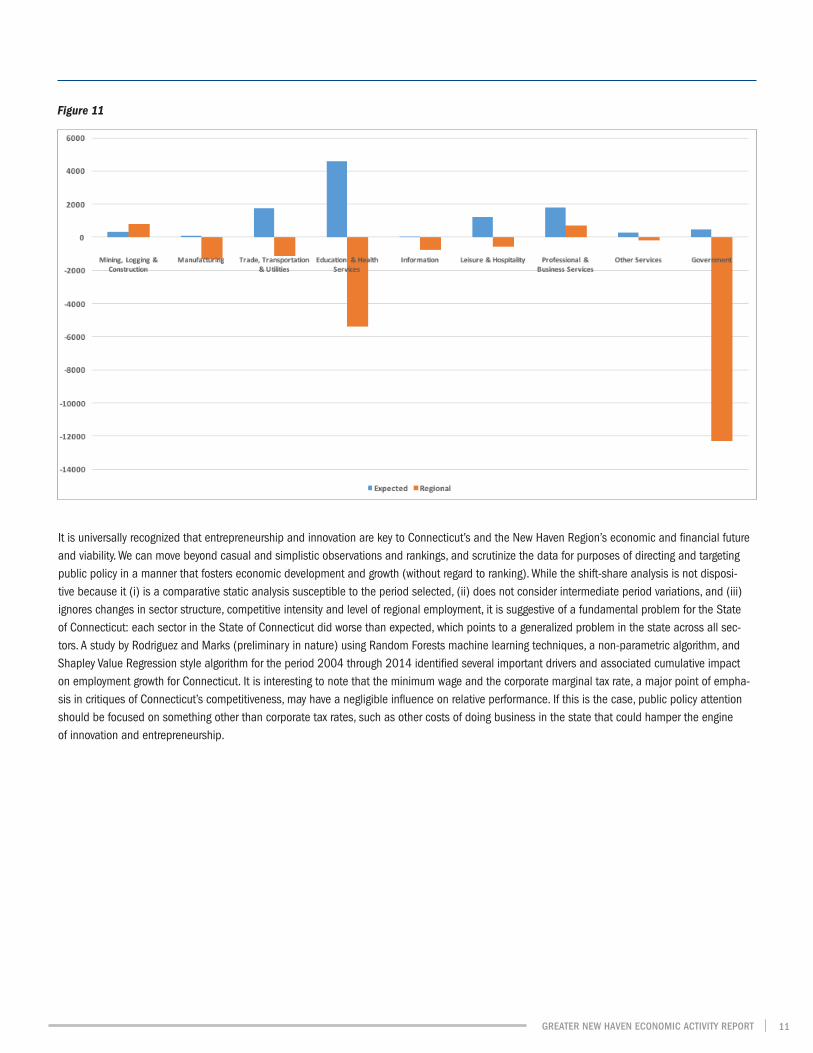
It is universally recognized that entrepreneurship and innovation are key to Connecticut’s and the New Haven Region’s economic and financial future and viability. We can move beyond casual and simplistic observations and rankings, and scrutinize the data for purposes of directing and targeting public policy in a manner that fosters economic development and growth (without regard to ranking). While the shift-share analysis is not disposi-tive because it (i) is a comparative static analysis susceptible to the period selected, (ii) does not consider intermediate period variations, and (iii) ignores changes in sector structure, competitive intensity and level of regional employment, it is suggestive of a fundamental problem for the State of Connecticut: each sector in the State of Connecticut did worse than expected, which points to a generalized problem in the state across all sec-tors. A study by Rodriguez and Marks (preliminary in nature) using Random Forests machine learning techniques, a non-parametric algorithm, and Shapley Value Regression style algorithm for the period 2004 through 2014 identified several important drivers and associated cumulative impact on employment growth for Connecticut. It is interesting to note that the minimum wage and the corporate marginal tax rate, a major point of empha-sis in critiques of Connecticut’s competitiveness, may have a negligible influence on relative performance. If this is the case, public policy attention should be focused on something other than corporate tax rates, such as other costs of doing business in the state that could hamper the engine of innovation and entrepreneurship.
Figure 11
GREATER NEW HAVEN ECONOMIC ACTIVITY REPORT 11
The University of New Haven Economics Collective is an online space for faculty, students and business professionals to connect by sharing content, whether it be report analysis, political commentary or anything else on their mind. Members are able to comment on each other’s posts, creating a meaningful and enriching dialogue that extends beyond the classroom. On the Collective, all members are economists, whether the poster is a freshman student or Nobel Prize winner. The lines of stature are blurred through the medium of the internet, lending to a more thoughtful and genu-ine discussion. These moments of connectivity construct social capital, which helps build the Economics Department as more than a department of the University of New Haven, but rather a community that cares for one another beyond the academic setting. The Collective has already been used as a method of surveying, and will be in the future to further employ the method of using the wisdom of crowds. The following selections are just a glimpse of content shared on the Collective. Benjamin Atwater, a student who minors in Economics, serves as the Student Executive Director of the Collective. Comments should be directed to Benjamin at [email protected].
The Italian Referendum: The Next Step for the EU: “As the EU continues its unsettling rounds of referendums and elections, it is now bracing for Italy’s constitutional referendum on December 4. This referendum is not about the EU but simply about changing the constitution to make the government less prone to deadlocks. So, why a concern? Simply, because the referendum ‘has […] become a confidence vote on the government.’ Matteo Renzi, the Prime Minister, has suggested that he would step down if the ‘no’ vote were to prevail. Meanwhile, the rising populist 5-Star Move-ment has vowed to organize a referendum on Italy remaining in the euro-zone should it come into power.” — CC
http://unheconomicscollective.ning.com/blog/the-upcoming-test-for-the-eu-the-italian-referendum
New Haven Employment: “Throughout the last 60 years, New Haven’s Economic Climate has been changing from a mainly manufacturing based economy to one dominated by health, business and financial services, most of this transformation happening in the last 10 years. The city’s economy benefits from being equidistant from New York and Boston. I decided to take data from after the 2008 financial crisis, to show the con-stant growth in the area. One major event that impacted the region was the moving of General Electric to Boston. On one hand, this could lead to job loss in the New Haven Region, but fortunately, the economy is changing, so hopefully the region can rely on the shift into health, business and financial services. My projection shows steady increase over the following years, but this doesn’t account for GE’s move. I predict a slight decrease with a big jobs increase immediately following.” — MM
http://unheconomicscollective.ning.com/blog/new-haven-employment-necta
Does Globalization Create Easier Security Breach?: “Apple has recently reported that it has enabled Apple in Japan. This comes a couple weeks after making the same announcement for Russia. Overall, Apple has over 12 countries that use this technology for contact-less pay. One key characteristic about these countries is that they are all developed countries. Therefore, we see them maintaining the most up to date tech-nology and sharing the highest technological qualities of life not found in developing countries. With that, it can be assumed to see the latest consumer technology in the USA, in those countries as well.” — KP
http://unheconomicscollective.ning.com/blog/does-globalization-create-easier-security-breach
Election’s Effect on the Economy: “With the upcoming election, people have been in a slight panic with the presidential candidates and what is going to happen to the economy in the United States. Businesses of all kinds have started to say that the upcoming election has affected their business, some for the positive and some for the negative. In the article, commercial real estate brokers said the election was causing businesses to hold off on new office leases, and auto dealers said the results could determine how many people buy cars.” — SS
http://unheconomicscollective.ning.com/blog/the-election-s-effect-on-the-economy-doughnut-sales-are-probably-
Environmental Policy Heavy in New Godzilla Flick: “Shin Godzilla might be the best Godzilla film made since the 1954 film. Shin is certainly the most similar in tone and execution. The political environment is very heavily present. Rather than nuclear weapons giving Godzilla his invulnerability, this Godzilla has fed off nuclear waste dumped into the waters of Tokyo Bay, bringing in a whole new timely issue. This element makes it a strong commentary on the recent Fukushima disaster, where an earthquake caused the biggest nuclear meltdown since Chernobyl in 2011. With this nuclear threat still felt by the Japanese people, Shin Godzilla is incredibly timely, just as Gojira was after the Lucky Dragon incident. The characters of the government are very well fleshed out, as each person is working on different ways to bring Godzilla down as well as crisis management and evacuation plans, which were needed for the Fukushima response.” — BA
http://unheconomicscollective.ning.com/blog/environmental-nuclear-policy-heavy-in-new-godzilla-flick
A Collection from the Collective
GREATER NEW HAVEN ECONOMIC ACTIVITY REPORT12

About the New Haven Economic Performance Laboratory
The Southern Connecticut Economic Activity Report (www.nhepl.org) is a publication of the Department of Economics, College of Business, University of New Haven, 300 Boston Post Road, West Haven, Connecticut 06516.
The Research Staff are upperclassmen and -women in the Department of Economics. Although each student works under the auspices of the Supervising Faculty and Research Directors, each student is individually responsible for interpreting and analyzing the data. The Laboratory is a teaching space, and this report reflects a product of that space. In addition, staff members work closely with the University of New Haven Economic Collective (http://unheconomicscollective.ning.com), which brings together students, faculty, alumni and members of the broader community, to foster a meaningful and relevant exchange of ideas. A fundamental focus of the Laboratory: to formulate, construct and examine non-traditional socioeconomic metrics applicable to the Southern Region of Connecticut by employing traditional empirical methods as well as data and text mining methods.
The New Haven Economic Performance Laboratory is affiliated with the University of New Haven Department of Economics and the Entrepreneur-ship and Innovation Program. Any opinions contained herein are not to be construed as reflecting the opinion of the University of New Haven, its College of Business, or the Entrepreneurship and Innovation Program. The printing of the report is funded by the College of Business. Should you be interested in supporting this student initiative in collaboration with faculty, please contact Ms. Mary F. Murphy, Director, Office of Development, University of New Haven, at [email protected] or 203.932.7174.
Research Staff (2016–2017)
Steven Gillette
Jurgena Hysolli
Sean P. Kingsepp
Vanessa Lopez
Miles Mortali
David A. Ortone
Nathan J. Pitruzzello
Executive and Technical Support
Kathleen Mazzeo
Benjamin Atwater
Benjamin F. Miles
Supervising Faculty and Research Directors
Esin Cakan, Ph.D., Associate Professor
Claude Chereau, Ph.D., Practitioner-in-Residence
Molly Jacobs, Ph.D., Visiting Assistant Professor
Brian A. Marks, J.D., Ph.D., Practitioner-in-Residence
Armando E. Rodriquez, Ph.D., Associate Professor
Kamal Upadhyaya, Ph.D., Professor
Administration and Editorial Board
Armando E. Rodriguez, Ph.D., Chair, Department of Economics
Brian A. Marks, J.D., Ph.D., Executive Director, Entrepreneurship and Innovation Program
GREATER NEW HAVEN ECONOMIC ACTIVITY REPORT 13
COLL
EGE
OF B
USI
NESS
300
Bost
on P
ost R
oad
Wes
t Hav
en, C
onne
ctic
ut 0
6516