Embed Size (px)
Citation preview
C O M P R E H E N S I V E H O U S I N G M A R K E T A N A L Y S I S
Green Bay, Wisconsin
Oconto
Marinette
BrownOutagamie
DoorShawano
Kewaunee
Men
omin
ee
Manitowoc
Men
omin
ee
Forest
CalumetWinnebago
Waupaca
Lan
glad
e
Lak
e M
ichi
gan
Wisconsin
Michigan
Green B
ay
U.S. Department of Housing and Urban Development Office of Policy Development and Research As of July 1, 2014
Housing Market Area
The Green Bay Housing Market Area (HMA) is coterminous with the Green Bay, WI Metropolitan Statistical Area (MSA), consisting of Brown, Kewaunee, and Oconto Counties in northeast Wisconsin. The city of Green Bay is at the south end of Green Bay, an arm of Lake Michigan, and is known for football and as a center for manufacturing, primarily paper packaging and dairy processing. The current estimated population of the HMA is 314,500.
Market DetailsEconomic Conditions ............... 2
Population and Households ..... 5
Housing Market Trends ............ 6
Data Profile ............................. 10
SummaryEconomy Economic conditions have been improving since the end of the national recession in mid2009, and the Green Bay HMA has recovered the number of jobs lost in 2008 and 2009. During the 12 months ending June 2014, nonfarm payrolls increased by 1,800 jobs, or 1.1 percent, to 170,100 jobs compared with payrolls during the same period a year earlier. Manufacturing is the largest employment sec tor, but the fastest growth has been in the education and health services sector. The education and health services sector is expected to continue to lead growth during the next 3 years. Healthcare provider Humana Inc. is the largest employer in the HMA, with 3,175 employees.
Sales MarketSales housing market conditions in the HMA are currently soft, with a sales vacancy rate of 2.3 percent, partly because the inventory of Real Estate Owned (REO) homes remains elevated. During the 12 months ending May 2014, approximately 4,900 new and existing homes sold and the aver age sales price was $133,900 compared with 4,850 homes sold during the same period a year earlier at an average sales price of $130,600 (CoreLogic, Inc.). During the 3year forecast period, de mand is expected for 1,875 new homes.
The 220 homes currently under con struction and a portion of the 9,800 other vacant units that may return to the market will meet some of the demand (Table 1).
Rental MarketThe overall rental housing market in the HMA is currently balanced, with a rental vacancy rate of 5.0 percent, a decrease from 7.4 percent in 2010. Apartment market conditions are cur rently tight, with a vacancy rate of 3.1 percent (Reis, Inc.). The average apart ment rent in June 2014 was $660, an increase of 3 percent compared with the average rent a year earlier. During the next 3 years, demand is expected for 1,725 new rental units; 810 units are currently under construction (Table 1).
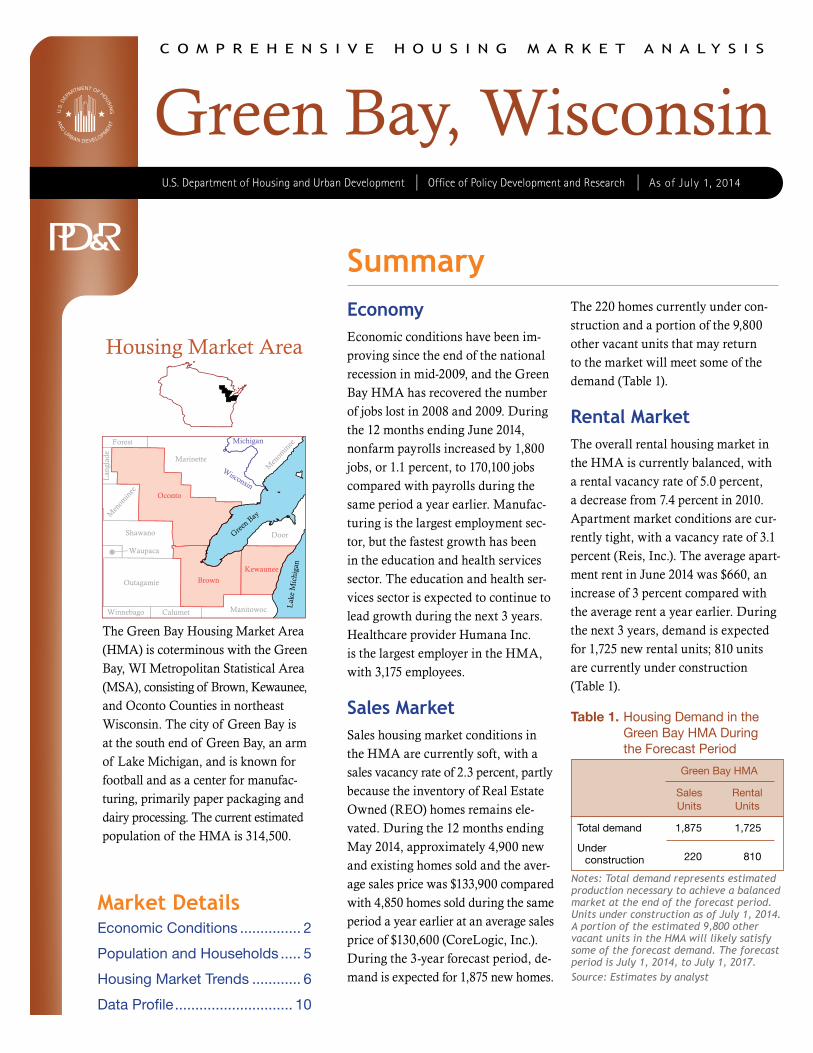
Green Bay HMA
Sales RentalUnits Units
Total demand 1,875 1,725
Under construction 220 810
Table 1. Housing Demand in the Green Bay HMA During the Forecast Period
Notes: Total demand represents estimated production necessary to achieve a balanced market at the end of the forecast period. Units under construction as of July 1, 2014. A portion of the estimated 9,800 other vacant units in the HMA will likely satisfy some of the forecast demand. The forecast period is July 1, 2014, to July 1, 2017.Source: Estimates by analyst
Gre
en
Ba
y,
WI
• C
OM
PR
EH
EN
SIV
E H
OU
SIN
G M
AR
KE
T A
NA
LYS
IS
2Economic Conditions
Since 2010, economic conditions in the Green Bay HMA have
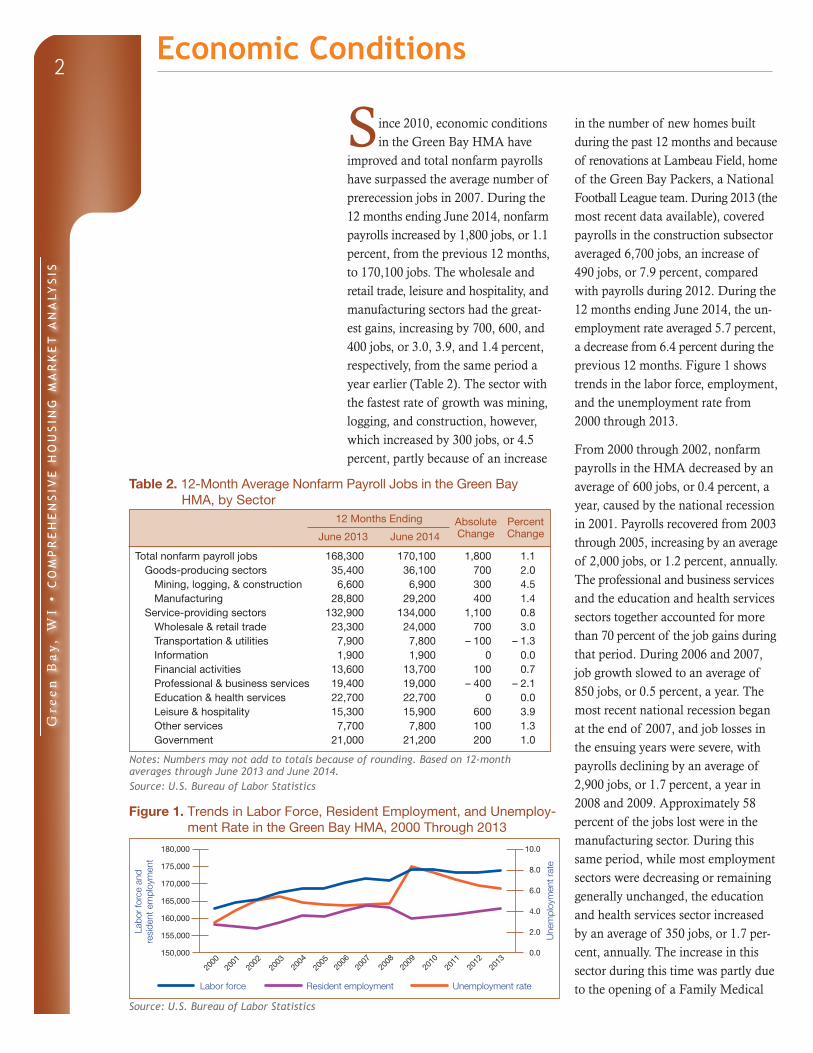
improved and total nonfarm payrolls have surpassed the average number of prerecession jobs in 2007. During the 12 months ending June 2014, nonfarm payrolls increased by 1,800 jobs, or 1.1 percent, from the previous 12 months, to 170,100 jobs. The wholesale and retail trade, leisure and hospitality, and manufacturing sectors had the greatest gains, increasing by 700, 600, and 400 jobs, or 3.0, 3.9, and 1.4 percent, respectively, from the same period a year earlier (Table 2). The sector with the fastest rate of growth was mining, logging, and construction, however, which increased by 300 jobs, or 4.5 percent, partly because of an increase
in the number of new homes built during the past 12 months and because of renovations at Lambeau Field, home of the Green Bay Packers, a National Football League team. During 2013 (the most recent data available), covered payrolls in the construction subsector averaged 6,700 jobs, an increase of 490 jobs, or 7.9 percent, compared with payrolls during 2012. During the 12 months ending June 2014, the un employment rate averaged 5.7 percent, a decrease from 6.4 percent during the previous 12 months. Figure 1 shows trends in the labor force, employment, and the unemployment rate from 2000 through 2013.
From 2000 through 2002, nonfarm payrolls in the HMA decreased by an average of 600 jobs, or 0.4 percent, a year, caused by the national recession in 2001. Payrolls recovered from 2003 through 2005, increasing by an average of 2,000 jobs, or 1.2 percent, annually. The professional and business services and the education and health services sectors together accounted for more than 70 percent of the job gains during that period. During 2006 and 2007, job growth slowed to an average of 850 jobs, or 0.5 percent, a year. The most recent national recession began at the end of 2007, and job losses in the ensuing years were severe, with payrolls declining by an average of 2,900 jobs, or 1.7 percent, a year in 2008 and 2009. Approximately 58 percent of the jobs lost were in the manufacturing sector. During this same period, while most employment sectors were decreasing or remaining generally unchanged, the education and health services sector increased by an average of 350 jobs, or 1.7 per cent, annually. The increase in this sector during this time was partly due to the opening of a Family Medical
Table 2. 12-Month Average Nonfarm Payroll Jobs in the Green Bay HMA, by Sector
12 Months Ending
June 2013 June 2014
Total nonfarm payroll jobs 168,300 170,100
Absolute Change
1,800
Percent Change
1.1Goods-producing sectors 35,400 36,100 700 2.0
Mining, logging, & construction 6,600 6,900 300 4.5Manufacturing 28,800 29,200 400 1.4
Service-providing sectors 132,900 134,000 1,100 0.8Wholesale & retail trade 23,300 24,000 700 3.0Transportation & utilities 7,900 7,800 – 100 – 1.3Information 1,900 1,900 0 0.0Financial activities 13,600 13,700 100 0.7Professional & business services 19,400 19,000 – 400 – 2.1Education & health services 22,700 22,700 0 0.0Leisure & hospitality 15,300 15,900 600 3.9Other services 7,700 7,800 100 1.3Government 21,000 21,200 200 1.0
Une
mpl
oym
ent r
ate
Labo
r fo
rce
and
resi
dent
em
ploy
men
t
180,000
175,000
170,000
165,000
160,000
155,000
150,000
2000
2002
2004
Labor force Resident employment Unemployment rate
10.0
8.0
6.0
4.0
2.0
0.0
2006
2001
2003
2005
2007
2009
2010
2008
2012
2013
2011
Notes: Numbers may not add to totals because of rounding. Based on 12-month averages through June 2013 and June 2014.Source: U.S. Bureau of Labor Statistics
Figure 1. Trends in Labor Force, Resident Employment, and Unemploy-ment Rate in the Green Bay HMA, 2000 Through 2013
Source: U.S. Bureau of Labor Statistics
Gre
en
Ba
y,
WI
• C
OM
PR
EH
EN
SIV
E H
OU
SIN
G M
AR
KE
T A
NA
LYS
IS
3Economic Conditions Continued
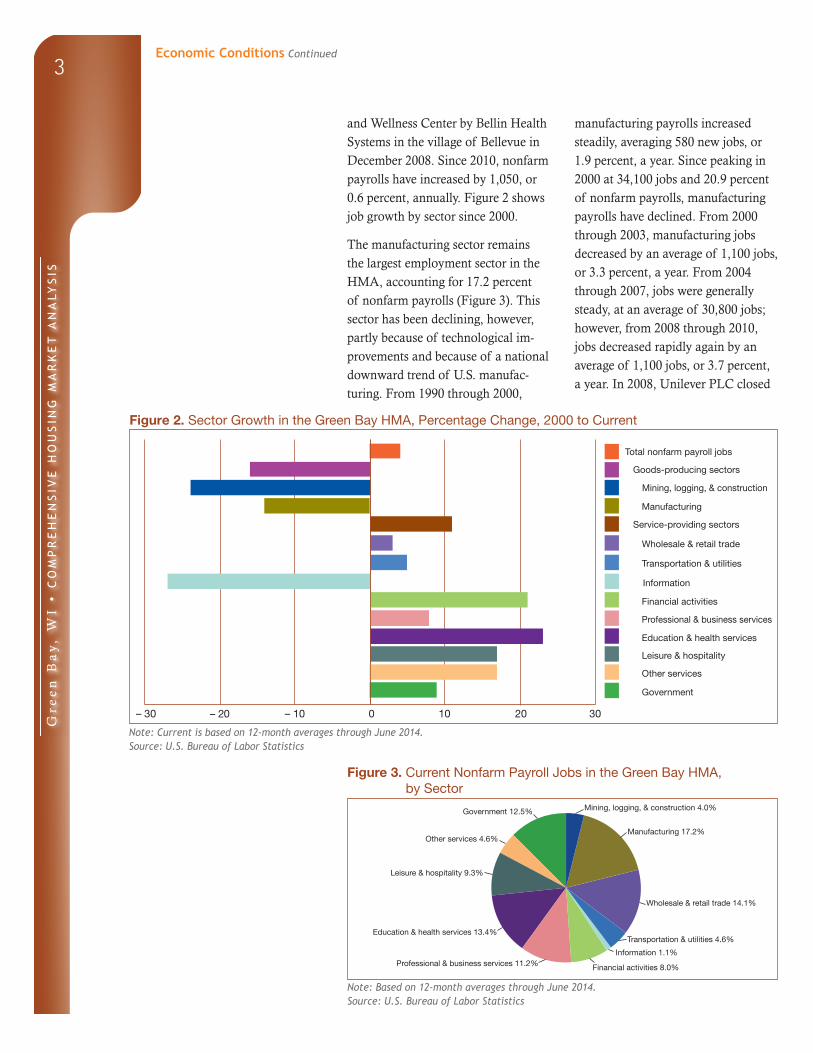
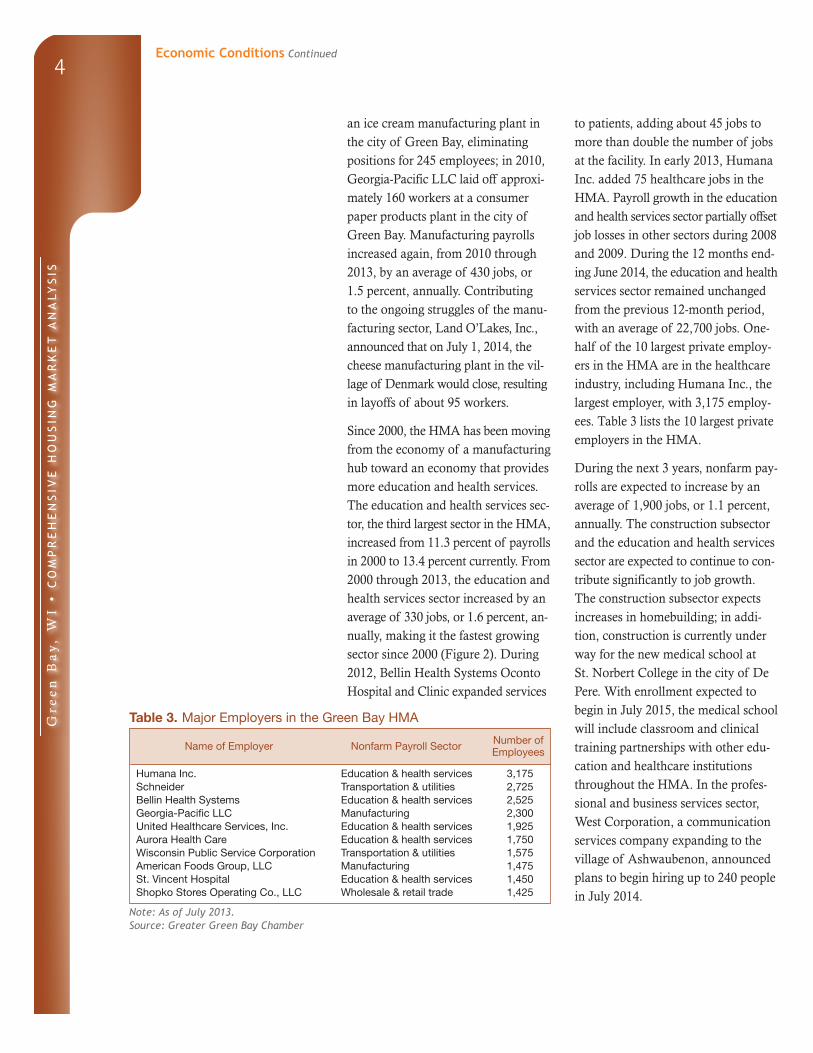
and Wellness Center by Bellin Health Systems in the village of Bellevue in December 2008. Since 2010, nonfarm payrolls have increased by 1,050, or 0.6 percent, annually. Figure 2 shows job growth by sector since 2000.
The manufacturing sector remains the largest employment sector in the HMA, accounting for 17.2 percent of nonfarm payrolls (Figure 3). This sector has been declining, however, partly because of technological improvements and because of a national downward trend of U.S. manufacturing. From 1990 through 2000,
manufacturing payrolls increased steadily, averaging 580 new jobs, or 1.9 percent, a year. Since peaking in 2000 at 34,100 jobs and 20.9 percent of nonfarm payrolls, manufacturing payrolls have declined. From 2000 through 2003, manufacturing jobs decreased by an average of 1,100 jobs, or 3.3 percent, a year. From 2004 through 2007, jobs were generally steady, at an average of 30,800 jobs; however, from 2008 through 2010, jobs decreased rapidly again by an average of 1,100 jobs, or 3.7 percent, a year. In 2008, Unilever PLC closed
Figure 2. Sector Growth in the Green Bay HMA, Percentage Change, 2000 to Current
Note: Current is based on 12-month averages through June 2014.Source: U.S. Bureau of Labor Statistics
Total nonfarm payroll jobs
Goods-producing sectors
Mining, logging, & construction
Manufacturing
Service-providing sectors
Information
Financial activities
Professional & business services
Education & health services
Government
Other services
Leisure & hospitality
Transportation & utilities
Wholesale & retail trade
– 20 – 10 200 10– 30 30
Government 12.5%
Leisure & hospitality 9.3%
Other services 4.6%
Education & health services 13.4%
Professional & business services 11.2%
Wholesale & retail trade 14.1%
Manufacturing 17.2%
Mining, logging, & construction 4.0%
Information 1.1%
Transportation & utilities 4.6%
Financial activities 8.0%
Figure 3. Current Nonfarm Payroll Jobs in the Green Bay HMA, by Sector
Note: Based on 12-month averages through June 2014.Source: U.S. Bureau of Labor Statistics
Gre
en
Ba
y,
WI
• C
OM
PR
EH
EN
SIV
E H
OU
SIN
G M
AR
KE
T A
NA
LYS
IS
4
an ice cream manufacturing plant in the city of Green Bay, eliminating positions for 245 employees; in 2010, GeorgiaPacific LLC laid off approximately 160 workers at a consumer paper pro ducts plant in the city of Green Bay. Manufacturing payrolls increased again, from 2010 through 2013, by an average of 430 jobs, or 1.5 percent, annually. Contributing to the ongoing struggles of the manufacturing sector, Land O’Lakes, Inc., announced that on July 1, 2014, the cheese manufacturing plant in the village of Denmark would close, resulting in layoffs of about 95 workers.
Since 2000, the HMA has been moving from the economy of a manufacturing hub toward an economy that provides more education and health services. The education and health services sec tor, the third largest sector in the HMA, increased from 11.3 percent of payrolls in 2000 to 13.4 percent currently. From 2000 through 2013, the education and health services sector increased by an average of 330 jobs, or 1.6 percent, an nually, making it the fastest growing sector since 2000 (Figure 2). During 2012, Bellin Health Systems Oconto Hospital and Clinic expanded services
Economic Conditions Continued
to patients, adding about 45 jobs to more than double the number of jobs at the facility. In early 2013, Humana Inc. added 75 healthcare jobs in the HMA. Payroll growth in the education and health services sector partially offset job losses in other sectors during 2008 and 2009. During the 12 months end ing June 2014, the education and health services sector remained unchanged from the previous 12month period, with an average of 22,700 jobs. Onehalf of the 10 largest private employers in the HMA are in the healthcare industry, including Humana Inc., the largest employer, with 3,175 employees. Table 3 lists the 10 largest private employers in the HMA.
During the next 3 years, nonfarm payrolls are expected to increase by an average of 1,900 jobs, or 1.1 percent, annually. The construction subsector and the education and health services sector are expected to continue to con tribute significantly to job growth. The construction subsector expects increases in homebuilding; in addition, construction is currently under way for the new medical school at St. Norbert College in the city of De Pere. With enrollment expected to begin in July 2015, the medical school will include classroom and clinical training partnerships with other edu cation and healthcare institutions throughout the HMA. In the professional and business services sector, West Corporation, a communication services company expanding to the village of Ashwaubenon, announced plans to begin hiring up to 240 people in July 2014.
Table 3. Major Employers in the Green Bay HMA
Name of Employer Nonfarm Payroll Sector Number of Employees
Humana Inc. Education & health services 3,175Schneider Transportation & utilities 2,725Bellin Health Systems Education & health services 2,525Georgia-Pacific LLC Manufacturing 2,300United Healthcare Services, Inc. Education & health services 1,925Aurora Health Care Education & health services 1,750Wisconsin Public Service Corporation Transportation & utilities 1,575American Foods Group, LLC Manufacturing 1,475St. Vincent Hospital Education & health services 1,450Shopko Stores Operating Co., LLC Wholesale & retail trade 1,425
Note: As of July 2013.Source: Greater Green Bay Chamber
Gre
en
Ba
y,
WI
• C
OM
PR
EH
EN
SIV
E H
OU
SIN
G M
AR
KE
T A
NA
LYS
IS
5
2,000
1,800
1,600
1,400
1,200
1,000
800
600
400
200
02000 to 2010 2010 to current Current to forecast
Ave
rage
ann
ual c
hang
e
Net natural change Net migration
Population Households
2,500
2,000
1,500
1,000
500
02000 to 2010 2010 to current Current to forecast
Ave
rage
ann
ual c
hang
e
Population and Households
As of July 1, 2014, the estimated population of the Green Bay
HMA was 314,500. Since 2010, pop ulation growth has averaged 1,950 people, or 0.6 percent, annually. By comparison, from 2000 to 2010, popu lation growth averaged 2,375 people annually, or 0.8 percent.
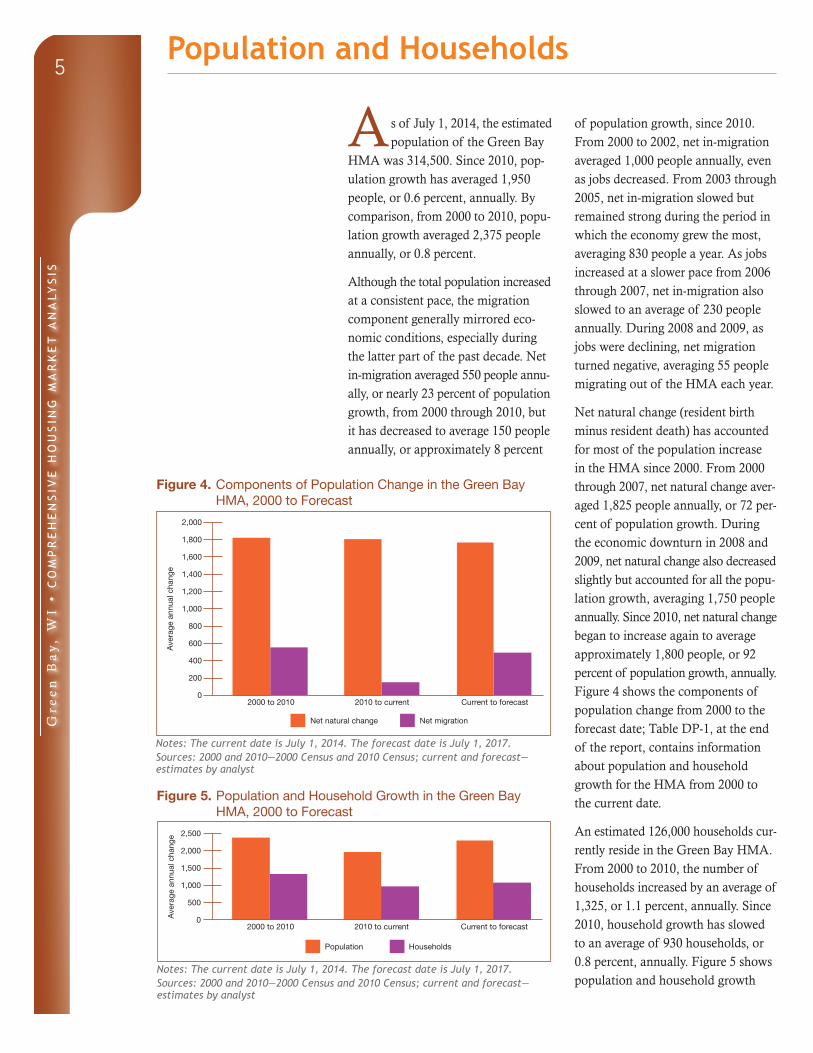
Although the total population increased at a consistent pace, the migration component generally mirrored eco nomic conditions, especially during the latter part of the past decade. Net inmigration averaged 550 people annu ally, or nearly 23 percent of population growth, from 2000 through 2010, but it has decreased to average 150 people annually, or approximately 8 percent
of population growth, since 2010. From 2000 to 2002, net inmigration averaged 1,000 people annually, even as jobs decreased. From 2003 through 2005, net inmigration slowed but remained strong during the period in which the economy grew the most, averaging 830 people a year. As jobs increased at a slower pace from 2006 through 2007, net inmigration also slowed to an average of 230 people annually. During 2008 and 2009, as jobs were declining, net migration turned negative, averaging 55 people migrating out of the HMA each year.
Net natural change (resident birth minus resident death) has accounted for most of the population increase in the HMA since 2000. From 2000 through 2007, net natural change aver aged 1,825 people annually, or 72 per cent of population growth. During the economic downturn in 2008 and 2009, net natural change also decreased slightly but accounted for all the popu lation growth, averaging 1,750 people annually. Since 2010, net natural change began to increase again to average ap proximately 1,800 people, or 92 percent of population growth, annually. Figure 4 shows the components of population change from 2000 to the forecast date; Table DP1, at the end of the report, contains information about population and household growth for the HMA from 2000 to the current date.
An estimated 126,000 households cur rently reside in the Green Bay HMA. From 2000 to 2010, the number of households increased by an average of 1,325, or 1.1 percent, annually. Since 2010, household growth has slowed to an average of 930 households, or 0.8 percent, annually. Figure 5 shows population and household growth
Figure 4. Components of Population Change in the Green Bay HMA, 2000 to Forecast
Notes: The current date is July 1, 2014. The forecast date is July 1, 2017.Sources: 2000 and 2010—2000 Census and 2010 Census; current and forecast—estimates by analyst
Figure 5. Population and Household Growth in the Green Bay HMA, 2000 to Forecast
Notes: The current date is July 1, 2014. The forecast date is July 1, 2017.Sources: 2000 and 2010—2000 Census and 2010 Census; current and forecast—estimates by analyst
Gre
en
Ba
y,
WI
• C
OM
PR
EH
EN
SIV
E H
OU
SIN
G M
AR
KE
T A
NA
LYS
IS
6
2000 2010 Current
Renter Owner
90,000
80,000
70,000
60,000
50,000
40,000
30,000
20,000
10,000
0
Population and Households Continued
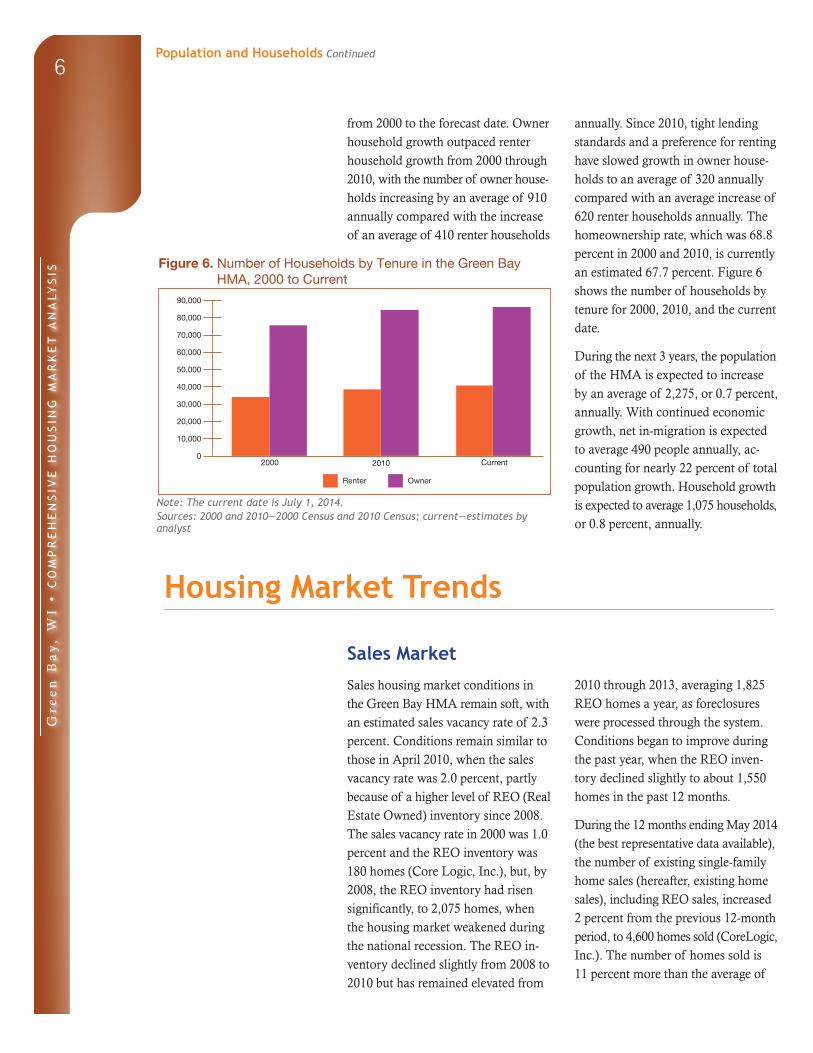
from 2000 to the forecast date. Owner household growth outpaced renter household growth from 2000 through 2010, with the number of owner house holds increasing by an average of 910 annually compared with the increase of an average of 410 renter households
annually. Since 2010, tight lending standards and a preference for renting have slowed growth in owner house holds to an average of 320 annually compared with an average increase of 620 renter households annually. The homeownership rate, which was 68.8 percent in 2000 and 2010, is currently an estimated 67.7 percent. Figure 6 shows the number of households by tenure for 2000, 2010, and the current date.
During the next 3 years, the population of the HMA is expected to increase by an average of 2,275, or 0.7 percent, annually. With continued economic growth, net inmigration is expected to average 490 people annually, ac counting for nearly 22 percent of total population growth. Household growth is expected to average 1,075 households, or 0.8 percent, annually.
Figure 6. Number of Households by Tenure in the Green Bay HMA, 2000 to Current
Note: The current date is July 1, 2014.Sources: 2000 and 2010—2000 Census and 2010 Census; current—estimates by analyst
Housing Market Trends
Sales Market
Sales housing market conditions in the Green Bay HMA remain soft, with an estimated sales vacancy rate of 2.3 percent. Conditions remain similar to those in April 2010, when the sales vacancy rate was 2.0 percent, partly because of a higher level of REO (Real Estate Owned) inventory since 2008. The sales vacancy rate in 2000 was 1.0 percent and the REO inventory was 180 homes (Core Logic, Inc.), but, by 2008, the REO inventory had risen significantly, to 2,075 homes, when the housing market weakened during the national recession. The REO inventory declined slightly from 2008 to 2010 but has remained elevated from
2010 through 2013, averaging 1,825 REO homes a year, as foreclosures were processed through the system. Conditions began to improve during the past year, when the REO inventory declined slightly to about 1,550 homes in the past 12 months.
During the 12 months ending May 2014 (the best representative data available), the number of existing singlefamily home sales (hereafter, existing home sales), including REO sales, increased 2 percent from the previous 12month period, to 4,600 homes sold (CoreLogic, Inc.). The number of homes sold is 11 percent more than the average of
Gre
en
Ba
y,
WI
• C
OM
PR
EH
EN
SIV
E H
OU
SIN
G M
AR
KE
T A
NA
LYS
IS
7
4,150 homes sold annually from 2010 through 2013 and 2 percent more than the average of 4,525 homes sold an nually from 2007 through 2009. By comparison, the number of homes sold during the 12 months ending May 2014 is 36 percent less than the average of 7,200 existing homes sold annually from 2002 through 2006.
Although the proportion of sales that are REO properties in the HMA is less than the national average, an elevated level of REO sales since 2009 nega tively affected the average sales price in the HMA. The average existing home sales price was $131,500 during the 12 months ending May 2014, an increase of nearly 3 percent compared with $128,100 during the previous 12month period. This increase in the average sales price occurred partly because the proportion of total sales that were REO homes decreased during the past 12 months. During the 12 months ending May 2014, REO sales accounted for 8 percent of existing home sales, down from an average of 12 percent during 2010 through 2013. By comparison, from 2000 through 2005, REO sales accounted for only 1 percent of sales. The current existing sales price is also 3 percent higher than the average sales price from 2010 through 2013, but it remains 2 percent less than the aver age price of $134,200 from 2007 through 2009.
The rate of distressed mortgages and REO properties in the HMA is less than the national rate, partly because home prices in the HMA did not have the large increase and subsequent de crease as did the rest of the nation. As of June 2014, 3.4 percent of home loans in the HMA were 90 or more days delinquent, were in foreclosure, or transitioned into REO status, down
from 4.5 percent in June 2013 (Black Knight Financial Services, Inc.). The rate was 4.9 percent nationally as of June 2014. Distressed loans and REO properties peaked in February 2010 at 6.1 percent in the HMA and 9.2 percent in the nation.
Whereas the economy of the HMA is still recovering from the most recent economic downturn, the population is increasing and the demand for existing homes is strengthening; however, new home sales and construction remain subdued in the HMA. During the 12 months ending May 2014, approximately 300 new singlefamily homes, townhomes, and condominiums sold, a 7percent decrease from the previous 12month period (CoreLogic Inc.). New home sales remain 31 percent less than the peak period from 2002 to 2006 when an average of 440 new homes sold annually. The average new home sales price in the HMA during the 12 months ending May 2014 was $170,300, an increase of 3 percent from the previous 12 months. This price is 7 percent higher than the average sales price from 2007 through 2012, but it remains 5 percent less than the aver age new home sales price from 2002 through 2006, the recent peak during which the new home sales price averaged $180,100. Singlefamily home construction activity, as measured by the number of homes permitted, increased slightly during the past 12 months. During the 12 months ending June 2014, 530 new homes were per mitted compared with the 520 homes permitted during the previous 12 months, an increase of nearly 2 per cent (preliminary data). From 2008 through 2013, an average of 610 homes were built annually, approximately onethird the average permitted from
Housing Market TrendsSales Market Continued
Gre
en
Ba
y,
WI
• C
OM
PR
EH
EN
SIV
E H
OU
SIN
G M
AR
KE
T A
NA
LYS
IS
8
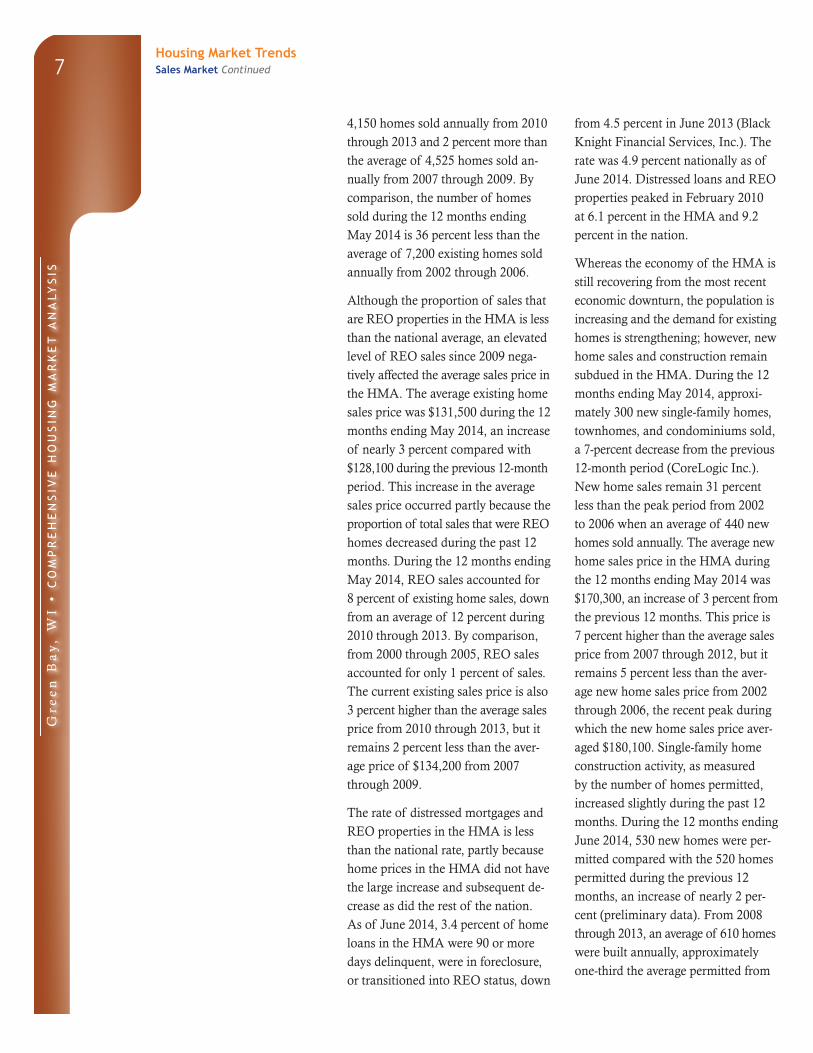
2000 through 2007, when 1,800 new homes were permitted annually (Fig ure 7). Singlefamily permitting was strongest from 2003 through 2007, partly because of a household preference to own that was supported by strong economic conditions and net inmigration.
Less than 3 percent of owner house holds in the HMA lived in condominiums in 2012, essentially unchanged since 2000. No large condominium developments have been built since 2004. The 132unit Riverside Place apartments built in 1999 in downtown Green Bay are currently undergoing conversion to condominiums, with onebedroom units starting at about $84,900 and twobedroom units start ing at $104,900.
The price for a new singlefamily home in the HMA typically starts at approxi mately $150,000. The village of Hobart, directly west of the city of Green Bay, is among the most active areas for resi dential construction in the state. The local government in Hobart provides incentives to encourage economic and residential development, primarily in the Centennial Centre at Hobart, a mixeduse development established as a Tax Increment District in 2009. Since 2010, the village of Hobart has led singlefamily home permitting in the HMA, accounting for approximately 12 percent of home construction. Field stone Estates, within the Centennial Centre at Hobart, began construction on Phase 2 in 2012, and has completed 36 of 117 planned homes. Prices for a new threebedroom, twobathroom home in this subdivision start at $184,900.
During the 3year forecast period, de mand is expected for 1,875 new homes (Table 1). The 220 homes currently under construction and a portion of the 9,800 other vacant units in the HMA that may reenter the market will satisfy some of the forecast demand. Corresponding to the forecast trends in economic conditions and net migration, demand is expected to increase through the next 3 years. Most new homes should be timed to enter the market beginning in the second and third years of the forecast period. Approximately twothirds of the demand for new homes is expected to be for homes priced at less than $200,000. Table 4 shows demand, by price range, for new homes in the HMA.
Housing Market TrendsSales Market Continued
Figure 7. Single-Family Homes Permitted in the Green Bay HMA, 2000 to Current
2000
2001
2002
2003
2004
2005
2006
2,500
2,000
1,500
1,000
500
0
2008
2009
2010
2011
2013
2014
2012
2007
Notes: Includes townhomes. Current includes data through June 2014.Sources: U.S. Census Bureau, Building Permits Survey; estimates by analyst
Table 4. Estimated Demand for New Market-Rate Sales Housing in the Green Bay HMA During the Forecast Period
Price Range ($) Units of Percent
From To Demand of Total
150,000 199,999 1,250 67.0200,000 249,999 390 21.0250,000 299,999 110 6.0300,000 and higher 110 6.0
Notes: The 220 homes currently under construction and a portion of the estimated 9,800 other vacant units in the HMA will likely satisfy some of the forecast demand. The fore-cast period is July 1, 2014, to July 1, 2017.Source: Estimates by analyst
Gre
en
Ba
y,
WI
• C
OM
PR
EH
EN
SIV
E H
OU
SIN
G M
AR
KE
T A
NA
LYS
IS
9Housing Market Trends Continued
2000
2001
2002
2003
2004
2005
2006
1,200
1,000
800
600
400
200
0
2008
2009
2010
2011
2013
2014
2012
2007
2000 Current2010
4.0
5.0
7.48.0
7.0
6.0
5.0
4.0
3.0
2.0
1.0
0.0
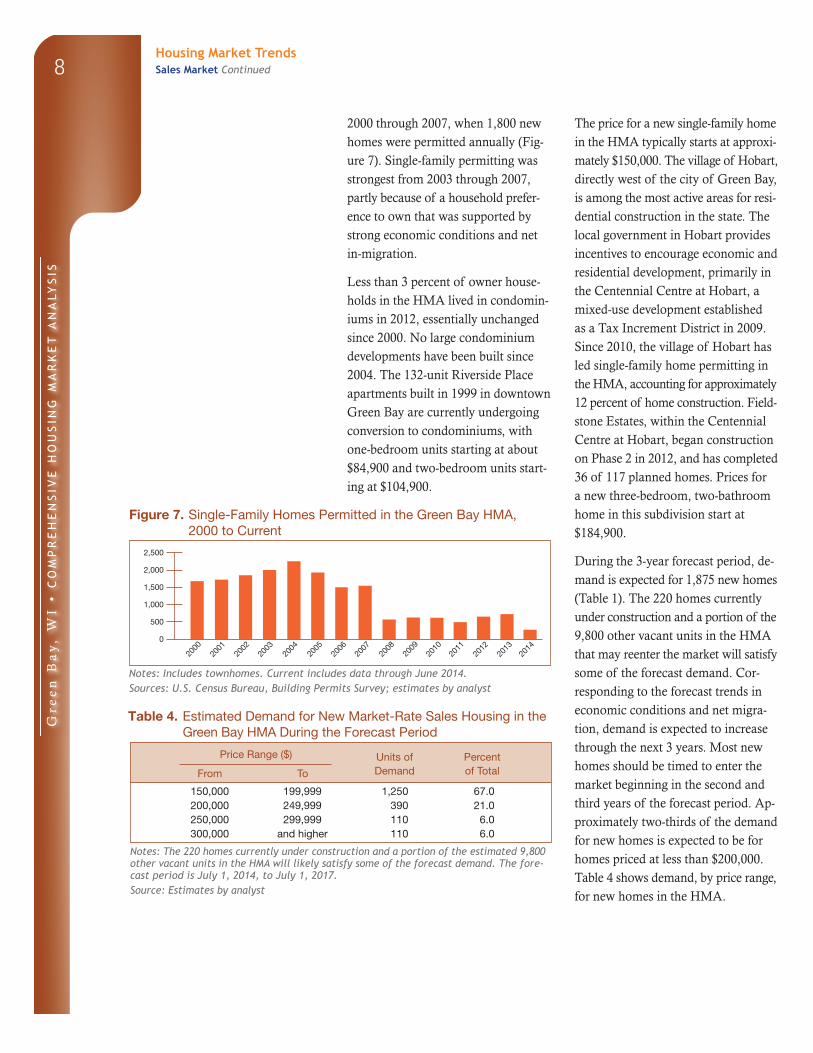
Rental MarketRental housing market conditions are balanced in the Green Bay HMA, with an estimated vacancy rate for all rental units (including apartments, singlefamily homes, and mobile homes) of 5.0 percent, a decrease from 7.4 percent in 2010 (Figure 8). Construction of rental units remains somewhat subdued, allowing for the absorption of available units, and contributing to the lower rental vacancy rate.
Approximately 73 percent of renter households live in apartments, and the apartment market is currently tight. Since 2010, improved economic conditions, an increasing preference among households for renting, and a smaller volume of apartment con struction have contributed to fewer vacancies. The apartment vacancy rate decreased to 3.1 percent in the
second quarter of 2014 from 3.9 per cent a year earlier (Reis, Inc.). The average rent for apartments in the HMA during the second quarter of 2014 was $660, an increase of nearly 2 percent from a year earlier.
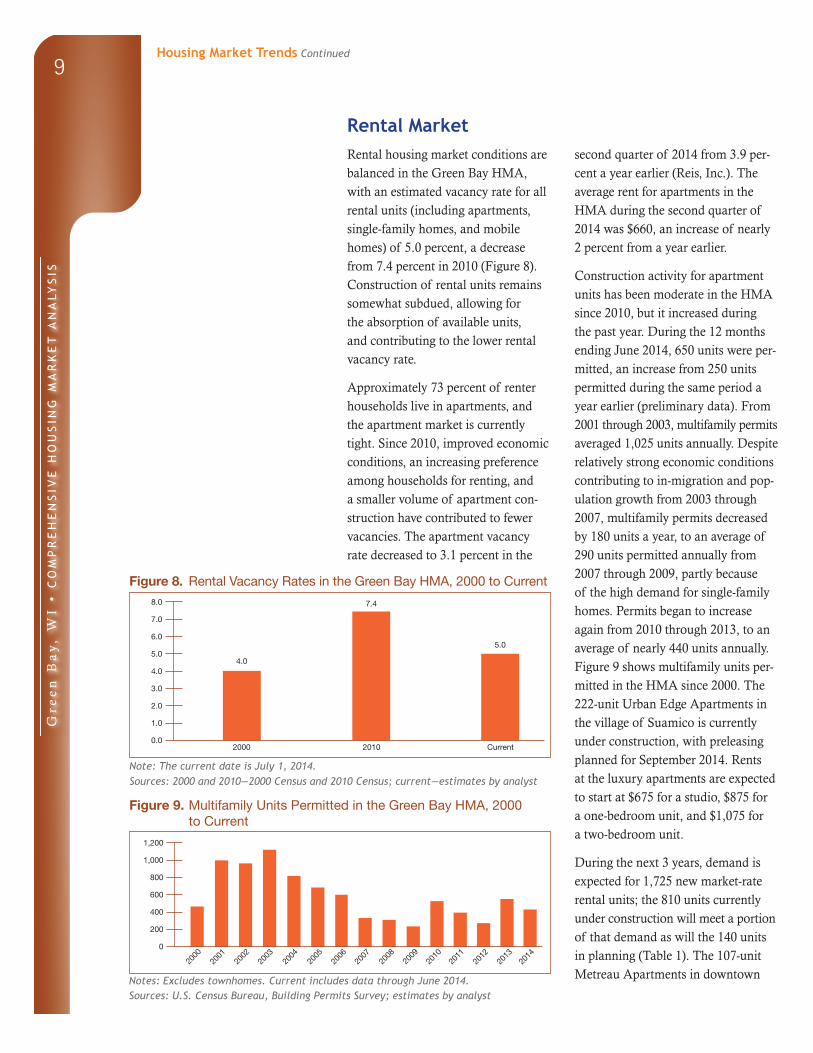
Construction activity for apartment units has been moderate in the HMA since 2010, but it increased during the past year. During the 12 months ending June 2014, 650 units were per mitted, an increase from 250 units permitted during the same period a year earlier (preliminary data). From 2001 through 2003, multifamily permits averaged 1,025 units annually. Despite relatively strong economic conditions contributing to inmigration and pop ulation growth from 2003 through 2007, multifamily permits decreased by 180 units a year, to an average of 290 units permitted annually from 2007 through 2009, partly because of the high demand for singlefamily homes. Permits began to increase again from 2010 through 2013, to an average of nearly 440 units annually. Figure 9 shows multifamily units per mitted in the HMA since 2000. The 222unit Urban Edge Apartments in the village of Suamico is currently under construction, with preleasing planned for September 2014. Rents at the luxury apartments are expected to start at $675 for a studio, $875 for a onebedroom unit, and $1,075 for a twobedroom unit.
During the next 3 years, demand is expected for 1,725 new marketrate rental units; the 810 units currently under construction will meet a portion of that demand as will the 140 units in planning (Table 1). The 107unit Metreau Apartments in downtown
Figure 8. Rental Vacancy Rates in the Green Bay HMA, 2000 to Current
Note: The current date is July 1, 2014.Sources: 2000 and 2010—2000 Census and 2010 Census; current—estimates by analyst
Figure 9. Multifamily Units Permitted in the Green Bay HMA, 2000 to Current
Notes: Excludes townhomes. Current includes data through June 2014.Sources: U.S. Census Bureau, Building Permits Survey; estimates by analyst
Gre
en
Ba
y,
WI
• C
OM
PR
EH
EN
SIV
E H
OU
SIN
G M
AR
KE
T A
NA
LYS
IS
10Housing Market TrendsRental Market Continued
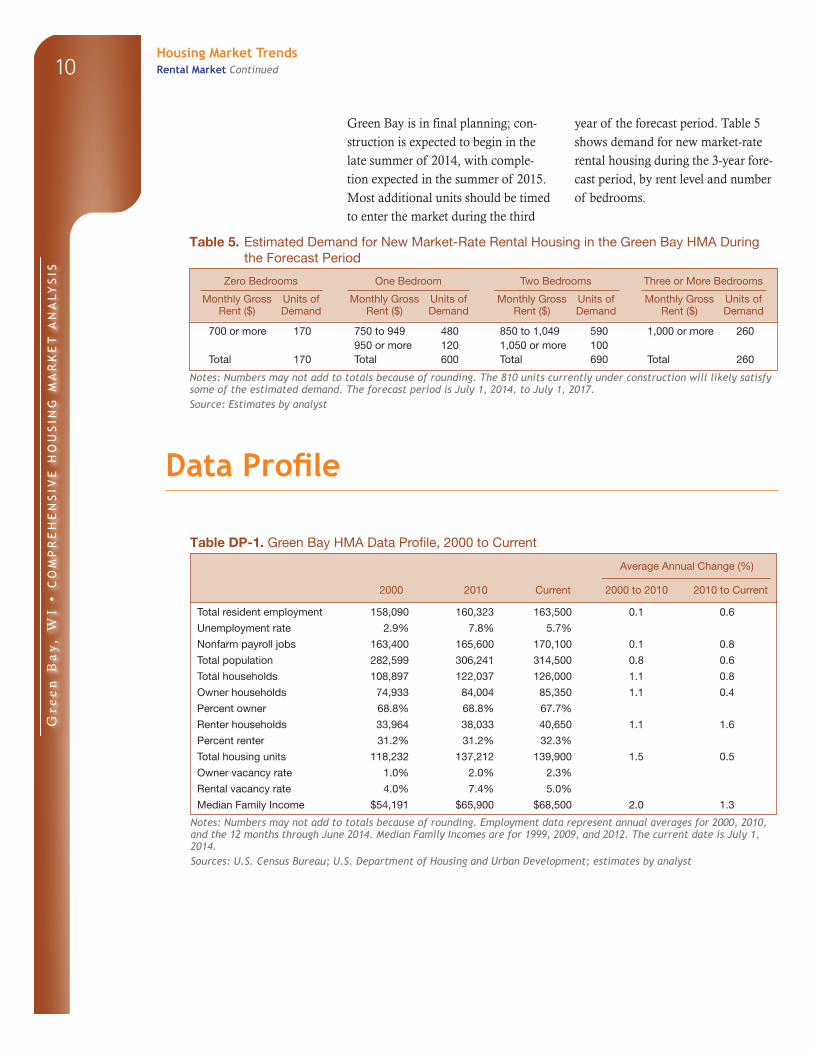
Green Bay is in final planning; con struction is expected to begin in the late summer of 2014, with completion expected in the summer of 2015. Most additional units should be timed to enter the market during the third
year of the forecast period. Table 5 shows demand for new marketrate rental housing during the 3year forecast period, by rent level and number of bedrooms.
Table 5. Estimated Demand for New Market-Rate Rental Housing in the Green Bay HMA During the Forecast Period
Zero Bedrooms One Bedroom Two Bedrooms Three or More Bedrooms
Monthly Gross Units of Monthly Gross Units of Monthly Gross Units of Monthly Gross Units of Rent ($) Demand Rent ($) Demand Rent ($) Demand Rent ($) Demand
700 or more 170 750 to 949 480 850 to 1,049 590 1,000 or more 260950 or more 120 1,050 or more 100
Total 170 Total 600 Total 690 Total 260
Notes: Numbers may not add to totals because of rounding. The 810 units currently under construction will likely satisfy some of the estimated demand. The forecast period is July 1, 2014, to July 1, 2017.Source: Estimates by analyst
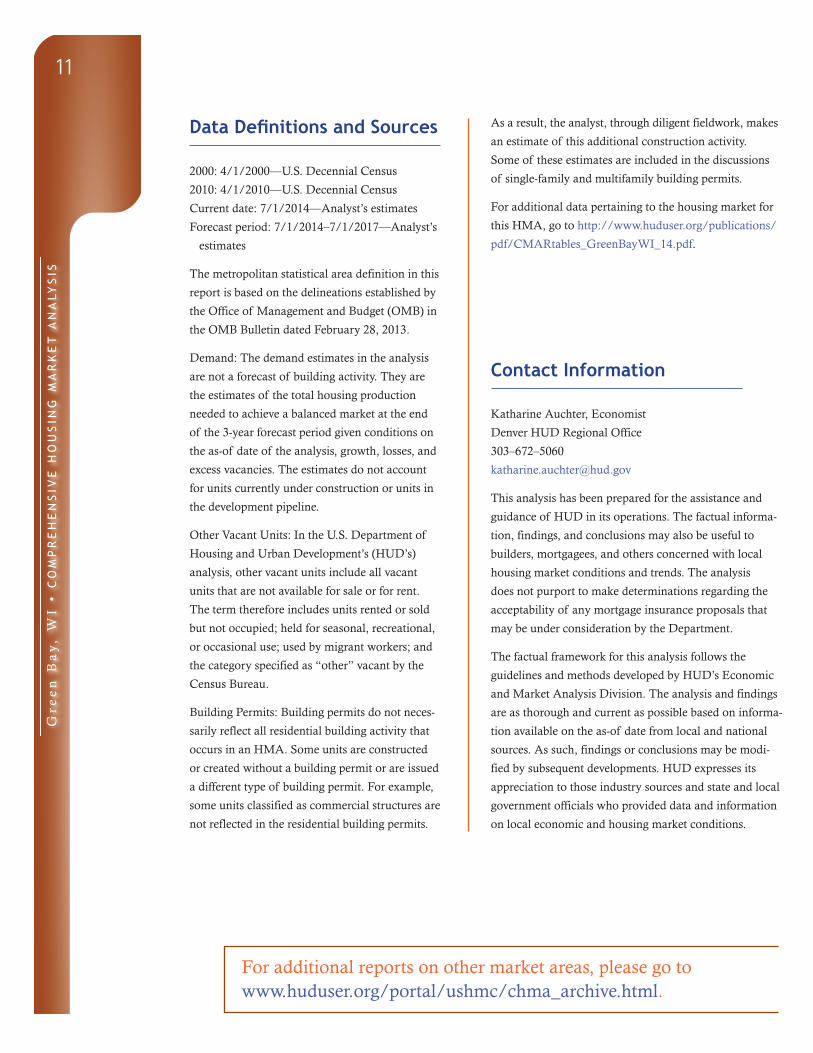
Data Profile
Table DP-1. Green Bay HMA Data Profile, 2000 to Current
2000 2010 Current
Average Annual Change (%)
2000 to 2010 2010 to Current
Total resident employment 158,090 160,323 163,500 0.1 0.6
Unemployment rate 2.9% 7.8% 5.7%
Nonfarm payroll jobs 163,400 165,600 170,100 0.1 0.8
Total population 282,599 306,241 314,500 0.8 0.6
Total households 108,897 122,037 126,000 1.1 0.8
Owner households 74,933 84,004 85,350 1.1 0.4
Percent owner 68.8% 68.8% 67.7%
Renter households 33,964 38,033 40,650 1.1 1.6
Percent renter 31.2% 31.2% 32.3%
Total housing units 118,232 137,212 139,900 1.5 0.5
Owner vacancy rate 1.0% 2.0% 2.3%
Rental vacancy rate 4.0% 7.4% 5.0%
Median Family Income $54,191 $65,900 $68,500 2.0 1.3
Notes: Numbers may not add to totals because of rounding. Employment data represent annual averages for 2000, 2010, and the 12 months through June 2014. Median Family Incomes are for 1999, 2009, and 2012. The current date is July 1, 2014.Sources: U.S. Census Bureau; U.S. Department of Housing and Urban Development; estimates by analyst
Gre
en
Ba
y,
WI
• C
OM
PR
EH
EN
SIV
E H
OU
SIN
G M
AR
KE
T A
NA
LYS
IS
11
Data Definitions and Sources
2000: 4/1/2000—U.S. Decennial Census
2010: 4/1/2010—U.S. Decennial Census
Current date: 7/1/2014—Analyst’s estimates
Forecast period: 7/1/2014–7/1/2017—Analyst’s
estimates
The metropolitan statistical area definition in this
report is based on the delineations established by
the Office of Management and Budget (OMB) in
the OMB Bulletin dated February 28, 2013.
Demand: The demand estimates in the analysis
are not a forecast of building activity. They are
the estimates of the total housing production
needed to achieve a balanced market at the end
of the 3year forecast period given conditions on
the asof date of the analysis, growth, losses, and
excess vacancies. The estimates do not account
for units currently under construction or units in
the development pipeline.
Other Vacant Units: In the U.S. Department of
Housing and Urban Development’s (HUD’s)
analysis, other vacant units include all vacant
units that are not available for sale or for rent.
The term therefore includes units rented or sold
but not occupied; held for seasonal, recreational,
or occasional use; used by migrant workers; and
the category specified as “other” vacant by the
Census Bureau.
Building Permits: Building permits do not neces
sarily reflect all residential building activity that
occurs in an HMA. Some units are constructed
or created without a building permit or are issued
a different type of building permit. For example,
some units classified as commercial structures are
not reflected in the residential building permits.
Contact Information
Katharine Auchter, Economist
Denver HUD Regional Office
303–672–5060
This analysis has been prepared for the assistance and
guidance of HUD in its operations. The factual informa
tion, findings, and conclusions may also be useful to
builders, mortgagees, and others concerned with local
housing market conditions and trends. The analysis
does not purport to make determinations regarding the
acceptability of any mortgage insurance proposals that
may be under consideration by the Department.
The factual framework for this analysis follows the
guidelines and methods developed by HUD’s Economic
and Market Analysis Division. The analysis and findings
are as thorough and current as possible based on informa
tion available on the asof date from local and national
sources. As such, findings or conclusions may be modi
fied by subsequent developments. HUD expresses its
appreciation to those industry sources and state and local
government officials who provided data and information
on local economic and housing market conditions.
For additional reports on other market areas, please go to www.huduser.org/portal/ushmc/chma_archive.html.
As a result, the analyst, through diligent fieldwork, makes
an estimate of this additional construction activity.
Some of these estimates are included in the discussions
of singlefamily and multifamily building permits.
For additional data pertaining to the housing market for
this HMA, go to http://www.huduser.org/publications/
pdf/CMARtables_GreenBayWI_14.pdf.