Embed Size (px)
Citation preview
GREEN BOND PRICING IN THE PRIMARY MARKET: January 2016 - March 2017
Additional funding was received from: the Ministry of Finance of Japan and the Government of the Kingdom of Denmark through the Ministry of Foreign Affairs.
0 5 10 15 20 25 30 35-0.5
0.0
0.5
1.0
1.5
2.0
2.5
Report highlights• Green bonds attract a broader
range of investors• We looked at USD and EUR issuance
over a 15-month period• Over-subscription and tight pricing
is the norm• Some green bonds do not have new
issue premiums• Green bonds tighten in the immediate
secondary market and on average out perform benchmarks in the first month
Prepared by: With support and funding from:
Green Bond Pricing in the Primary Market: January 2016 – March 2017 PAGE 2
Anecdotal evidence has suggested that green bonds are heavily oversubscribed and may price tighter than expected. This report explores the data to discover whether or not this is happening.
• Green bonds attract a broader range of investors but overall behave in line with vanilla equivalents. • Data remains too limited to make definite conclusions but results indicate that it is worth ongoing
exploration - we intend to continue to explore this through quarterly reports on the topic.
GlossaryBps – Basis points; 1bp = 100th of a percent IPT – Initial Price TalkOAT – Obligations assimilables du Trésor, government bonds issued by the French Treasury.
• Spread performance compared to a corresponding broad market bond index: seven (7) days after announcement date, 70% of green bonds had tightened more than their corresponding index, 71% after twenty-eight (28) days. This suggests that green bonds within our sample perform better than the market within the first 28 calendar days.
• USD corporate green bonds within our sample priced on average 22.2bps tighter than Initial Price Talk (IPT) when compared to corporate vanilla bonds (16 to 17bps) issued during the same period.
• Green bonds tend to attract a broader range of investors including those looking to comply with ESG focused mandates.
Pricing difference existsSome indicators show differences between green and vanilla bonds
• Average oversubscription in our sample is 3 times. Oversubscription of 3-4 times is not unusual in the corporate bond market.
• EUR corporate green bonds in our sample price on average 13.4bps tighter than IPT. This is within the normal range of 13-14bps for vanilla bonds over the same period.
• Spread performance: 70% of green bonds had tighter spreads 7 days after announcement date, 63% 28 days after*. Bonds often tighten in the immediate secondary market.
• The Greenium – some green bonds in the sample priced inside their own credit curves, some priced on their own credit curves, and some priced outside their own credit curves. This is broadly comparable to vanilla bonds.
*Swap spreads used for EUR denominated, US Treasury spreads used for USD-denominated.
Methodology notesTo be included, bonds had to meet the following parameters (see more detailed methodology on page 8):
• Currency: USD or EUR only• Date: announcement 01/01/2016 - 31/03/2017• Size: > = USD200 million • Rating: Investment grade rated • Maturity: Minimum term of 3 years
ESG Related Assessments
ESG risks are increasingly being taken into consideration by institutional investors. The number of markets participants committing to the UN Princiles for Responsible Investment stood at 1750 signatories as of July 2017. This represents around USD 70 trillion in assets under management (AUM) in over 50 countries.Green bonds can be incorporated into responsible investment strategies, and some large fixed income investors, including Nikko AM, BlackRock, PIMCO, Amundi, Axa AM, Mirova and Calvert, now have dedicated ESG portfolios focusing exclusively on ESG compliant instruments including green bonds.
No pricing difference existsSome indicators show green bonds behave in line with vanilla bonds
A
AA
A
AABBB
Govt. & Quasi Govt. Govt. &
Quasi Govt.
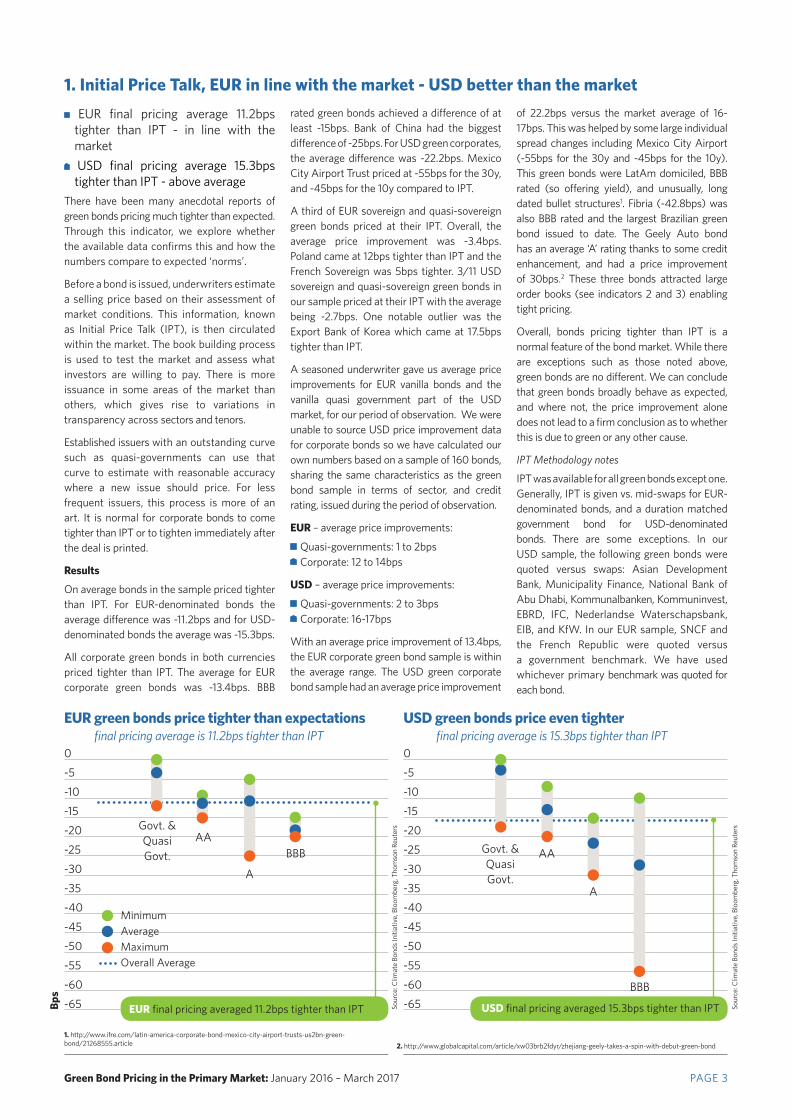
• EUR final pricing average 11.2bps tighter than IPT - in line with the market
• USD final pricing average 15.3bps tighter than IPT - above average
There have been many anecdotal reports of green bonds pricing much tighter than expected. Through this indicator, we explore whether the available data confirms this and how the numbers compare to expected ‘norms’.
Before a bond is issued, underwriters estimate a selling price based on their assessment of market conditions. This information, known as Initial Price Talk (IPT), is then circulated within the market. The book building process is used to test the market and assess what investors are willing to pay. There is more issuance in some areas of the market than others, which gives rise to variations in transparency across sectors and tenors.
Established issuers with an outstanding curve such as quasi-governments can use that curve to estimate with reasonable accuracy where a new issue should price. For less frequent issuers, this process is more of an art. It is normal for corporate bonds to come tighter than IPT or to tighten immediately after the deal is printed.
Results
On average bonds in the sample priced tighter than IPT. For EUR-denominated bonds the average difference was -11.2bps and for USD- denominated bonds the average was -15.3bps.
All corporate green bonds in both currencies priced tighter than IPT. The average for EUR corporate green bonds was -13.4bps. BBB
EUR green bonds price tighter than expectationsfinal pricing average is 11.2bps tighter than IPT
Green Bond Pricing in the Primary Market: January 2016 – March 2017 PAGE 3
Minimum AverageMaximum Overall Average
USD green bonds price even tighter final pricing average is 15.3bps tighter than IPT
-65 -65
-60 -60
-55 -55
-50 -50
-45 -45
-40 -40
-35 -35
-30 -30
-25 -25
-20 -20
-15 -15
-10 -10
-5 -5
0 0
rated green bonds achieved a difference of at least -15bps. Bank of China had the biggest difference of -25bps. For USD green corporates, the average difference was -22.2bps. Mexico City Airport Trust priced at -55bps for the 30y, and -45bps for the 10y compared to IPT.
A third of EUR sovereign and quasi-sovereign green bonds priced at their IPT. Overall, the average price improvement was -3.4bps. Poland came at 12bps tighter than IPT and the French Sovereign was 5bps tighter. 3/11 USD sovereign and quasi-sovereign green bonds in our sample priced at their IPT with the average being -2.7bps. One notable outlier was the Export Bank of Korea which came at 17.5bps tighter than IPT.
A seasoned underwriter gave us average price improvements for EUR vanilla bonds and the vanilla quasi government part of the USD market, for our period of observation. We were unable to source USD price improvement data for corporate bonds so we have calculated our own numbers based on a sample of 160 bonds, sharing the same characteristics as the green bond sample in terms of sector, and credit rating, issued during the period of observation.
EUR – average price improvements:
• Quasi-governments: 1 to 2bps • Corporate: 12 to 14bps
USD – average price improvements:
• Quasi-governments: 2 to 3bps • Corporate: 16-17bps
With an average price improvement of 13.4bps, the EUR corporate green bond sample is within the average range. The USD green corporate bond sample had an average price improvement
of 22.2bps versus the market average of 16-17bps. This was helped by some large individual spread changes including Mexico City Airport (-55bps for the 30y and -45bps for the 10y). This green bonds were LatAm domiciled, BBB rated (so offering yield), and unusually, long dated bullet structures1. Fibria (-42.8bps) was also BBB rated and the largest Brazilian green bond issued to date. The Geely Auto bond has an average ‘A’ rating thanks to some credit enhancement, and had a price improvement of 30bps.2 These three bonds attracted large order books (see indicators 2 and 3) enabling tight pricing.
Overall, bonds pricing tighter than IPT is a normal feature of the bond market. While there are exceptions such as those noted above, green bonds are no different. We can conclude that green bonds broadly behave as expected, and where not, the price improvement alone does not lead to a firm conclusion as to whether this is due to green or any other cause.
IPT Methodology notes
IPT was available for all green bonds except one. Generally, IPT is given vs. mid-swaps for EUR-denominated bonds, and a duration matched government bond for USD-denominated bonds. There are some exceptions. In our USD sample, the following green bonds were quoted versus swaps: Asian Development Bank, Municipality Finance, National Bank of Abu Dhabi, Kommunalbanken, Kommuninvest, EBRD, IFC, Nederlandse Waterschapsbank, EIB, and KfW. In our EUR sample, SNCF and the French Republic were quoted versus a government benchmark. We have used whichever primary benchmark was quoted for each bond.
USD final pricing averaged 15.3bps tighter than IPTEUR final pricing averaged 11.2bps tighter than IPTBps
1. http://www.ifre.com/latin-america-corporate-bond-mexico-city-airport-trusts-us2bn-green-bond/21268555.article 2. http://www.globalcapital.com/article/xw03brb2fdyr/zhejiang-geely-takes-a-spin-with-debut-green-bond
BBB
Sour
ce: C
limat
e Bo
nds
Initi
ativ
e, B
loom
berg
, Tho
mso
n Re
uter
s
Sour
ce: C
limat
e Bo
nds
Initi
ativ
e, B
loom
berg
, Tho
mso
n Re
uter
s
1. Initial Price Talk, EUR in line with the market - USD better than the market
SEB
Cais
se d
e D
epot
s
Green Bond Pricing in the Primary Market: January 2016 – March 2017 PAGE 4
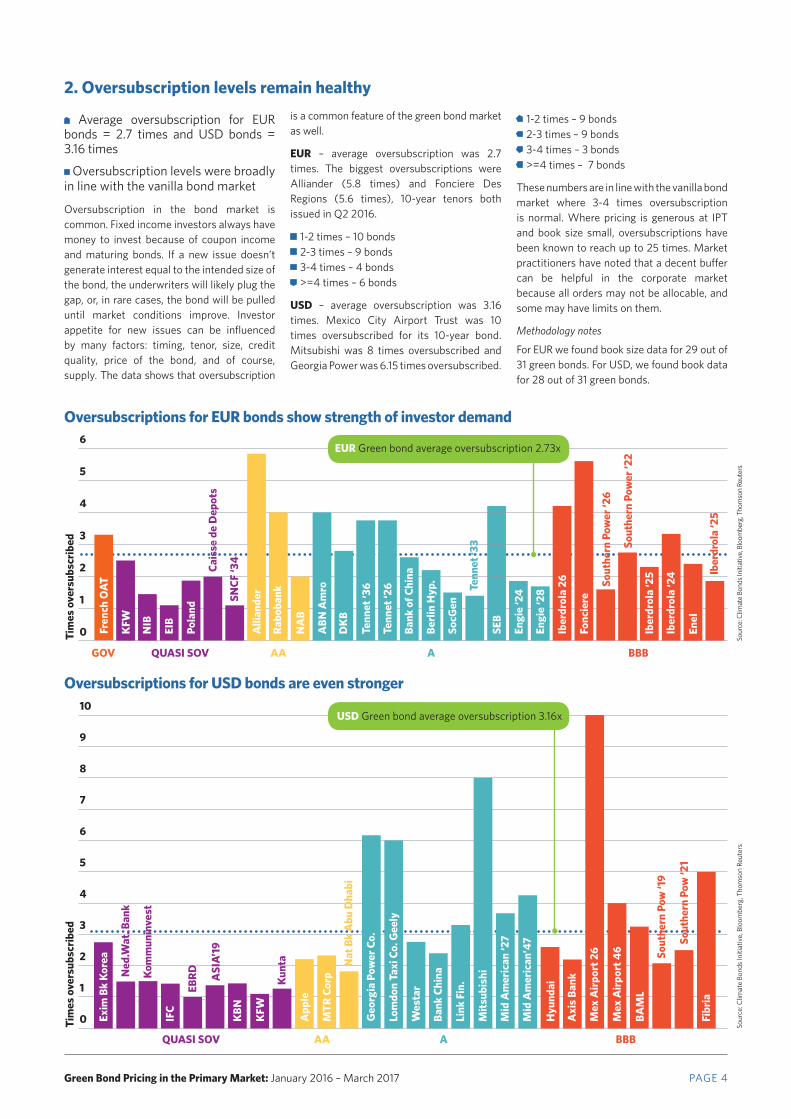
• Average oversubscription for EUR bonds = 2.7 times and USD bonds = 3.16 times
• Oversubscription levels were broadly in line with the vanilla bond market
Oversubscription in the bond market is common. Fixed income investors always have money to invest because of coupon income and maturing bonds. If a new issue doesn’t generate interest equal to the intended size of the bond, the underwriters will likely plug the gap, or, in rare cases, the bond will be pulled until market conditions improve. Investor appetite for new issues can be influenced by many factors: timing, tenor, size, credit quality, price of the bond, and of course, supply. The data shows that oversubscription
2
4
3
3
6
5
4
8
7
0
0
AA
GOV
QUASI SOV A
QUASI SOV
BBB
AA A
6
Iber
drol
a 26
App
le
Exim
Bk
Kore
a
Tim
es o
vers
ubsc
ribed
Tim
es o
vers
ubsc
ribed
Alli
ande
r
Hyu
ndai
Fonc
iere
Ned
.Wat
. Ban
kK
FW
IFC
Kom
mun
inve
st
Geo
rgia
Pow
er C
o.
ABN
Am
ro
DK
B
Lom
don
Taxi
Co.
Gee
ly
NIB
Axi
s Ba
nk
Tenn
et ‘3
6 Sout
hern
Pow
er ‘2
6
Sout
hern
Pow
er ‘2
2
Bank
Chi
na
Tenn
et ‘2
6
EBRD
Link
Fin
.
Iber
drol
a ‘2
5
ASI
A’19
Berli
n H
yp.
Mits
ubis
hi
SocG
en
Mex
Airp
ort 2
6
Mex
Airp
ort 4
6
Wes
tar
Rabo
bank
KBN
Tenn
et ‘3
3
MTR
Cor
p
Iber
drol
a ‘2
4
BAM
L
Pola
nd
Sout
hern
Pow
‘19
Kunt
a
Fren
ch O
AT
Sout
hern
Pow
‘21
Enel
KFW
Fibr
ia
Mid
Am
eric
an ‘2
7
NA
B
Mid
Am
eric
an’4
7
Iber
drol
a ‘2
5
Nat
Bk
Abu
Dha
bi
Engi
e ‘2
4
Engi
e ‘2
8SNCF
‘34
5
10
9
1
2
1
Oversubscriptions for EUR bonds show strength of investor demand
Oversubscriptions for USD bonds are even stronger
is a common feature of the green bond market as well.
EUR – average oversubscription was 2.7 times. The biggest oversubscriptions were Alliander (5.8 times) and Fonciere Des Regions (5.6 times), 10-year tenors both issued in Q2 2016.
• 1-2 times – 10 bonds • 2-3 times – 9 bonds • 3-4 times – 4 bonds • >=4 times – 6 bonds
USD – average oversubscription was 3.16 times. Mexico City Airport Trust was 10 times oversubscribed for its 10-year bond. Mitsubishi was 8 times oversubscribed and Georgia Power was 6.15 times oversubscribed.
• 1-2 times – 9 bonds • 2-3 times – 9 bonds • 3-4 times – 3 bonds • >=4 times – 7 bonds
These numbers are in line with the vanilla bond market where 3-4 times oversubscription is normal. Where pricing is generous at IPT and book size small, oversubscriptions have been known to reach up to 25 times. Market practitioners have noted that a decent buffer can be helpful in the corporate market because all orders may not be allocable, and some may have limits on them.
Methodology notes
For EUR we found book size data for 29 out of 31 green bonds. For USD, we found book data for 28 out of 31 green bonds.
EIB
USD Green bond average oversubscription 3.16x
Sour
ce: C
limat
e Bo
nds
Initi
ativ
e, B
loom
berg
, Tho
mso
n Re
uter
sSo
urce
: Clim
ate
Bond
s Ini
tiativ
e, B
loom
berg
, Tho
mso
n Re
uter
s
2. Oversubscription levels remain healthy
BBB
Bank
of C
hina
EUR Green bond average oversubscription 2.73x
Green Bond Pricing in the Primary Market: January 2016 – March 2017 PAGE 5
Researching news reports, we encountered claims suggesting that the green label gives additional appeal to new issues, a demand enhanced by the responsible investment community coupled with a scant supply of labelled green bonds.
One may presume that the extra investors from the responsible investment community might be balanced out by plain investors anxious to avoid the perceived cost of the green label but this is not borne out by the evidence.
Market commentary and company websites tell us that corporate treasurers are overwhelmingly
3. Diversification of investor base: Extra investor interest can lower the cost of fundinghappy with how the green bonds in our sample placed. This is frequently attributed to what syndicate managers term the ‘green angle’. The appeal of green bonds is broader than it would be for a comparable vanilla bond because of interest from responsible investors. Treasurers like a diverse investor base because it offers more stability during volatile times. Dedicated green bond investors like to buy and hold green bonds because they are difficult to replace given the limited supply. Further, bookrunners are quoted as saying that the ‘green angle’ can help them to price more tightly than otherwise, due to the extra interest they receive.
Geographical and investor type data is readily available for most placements, but the percentage of green investors is not uniformly published, so we cannot take an analytical approach to this indicator.
For the next edition of this document, we will approach corporate treasurers to see whether we can obtain that data. For now, we illustrate this indicator using quotes from issuer websites and post issuance reports. We do not have enough space to publish all of them, but did find such quotes for all bonds in our sample except 2. The tone was uniformly positive with emphasis on the diversification of the investor base.
Berlin Hyp 0.5% Sep 2023 EUR – Announced 19th September 2016
The bookrunner said:
We had 145 involved in the transaction and 29 of them were pure green investors. Also, 35 investors participated for the first time in a Berlin Hyp issuance, meaning the issuer was able to broaden its investor base among top European credit accounts.3
The Treasurer said:One feature of particular note is that 41% of the bond went to sustainable investors. In addition, 35 investors invested in a Berlin Hyp bond for the first time.4
SNCF Reseau 1.875% March 34 EUR - Announced 22nd March 2017
The bookrunner said:
The green component was an important part of the success of this deal. It definitely attracted some solid orders from French, German and Dutch SRI investors, which allowed us to print at the top end of the size range and tighten pricing from guidance.
There was no price sensitivity. Books kept growing after we fixed the spread.5
DKB 0.625% June 2021 EUR - Announced 1st June 2016
DKB said:
The DKB’s debut mission hit an extraordinarily high demand of over 1.4 billion euros. As a result, the first green bond issued by DKB in the format of senior unsecured was nearly tripled by nearly 200 investors.
“We are enthusiastic about the great demand for our green bond,” says Stefan Unterlandstättner, Chairman of the Board of DKB. “The extensive preparations have paid off. The great interest shown by the investors shows that the sustainable business model of DKB is honored and that we have taken the right path with the Green Bond in the diversification of our capital market refinancing.“6
ENEL 1% Sept 2024 EUR – Announced 9th January 2017
ENEL said:
The transaction received subscriptions in an amount of approximately 3 billion euros, with considerable interest from Social Responsible Investors (“SRI”), enabling Enel to further diversify its investor base.7
Kommuninvest 1.5% April 2019 USD – Announced 14th March 2016
Kommuninvest said:
We started book building with indications of interest in excess of $500m. Demand kept coming during the morning and we closed near $900m. We upsized to $600m in order to ease the pressure on the allocation process and be more accommodative to investors.One of the bookrunners said:The issuer was targeting $500m but grew the deal so as not to disappoint some very high quality environmental accounts.10
Upsizing If there is strong demand, the size of a bond can be increased at issue (upsized). Issuers often have the flexibility to increase the size of a deal, thus taking advantage of cheaper capital. Some examples over the past fifteen months:
• Iberdrola issued its second green bond in Q2 2016, a euro-denominated 10-year bond. The book closed at EUR 4.2bn and the bond was upsized from EUR 750m to EUR 1bn, with a primary spread of swaps +63, which was 17bp tighter than IPT. In Q3, Iberdrola came to the market with its third green bond, a 9-year. Strong investor appetite resulted in a size increase from
EUR 600m to EUR 700m at swaps +32, a price improvement of 18bp versus IPT. Market reports claim that this was the best price yet obtained by Iberdrola with a coupon set at 0.375%.13 Iberdrola is on the European Central Bank buying list which may have further enhanced its appeal, and that would also apply to a vanilla Iberdrola bond.
• In Q3 EBRD issued a USD 650m green bond with a 3-year tenor, originally planned to be USD 500m, but increased due to demand with a 1bp price improvement to mid-swaps +9bp.
• KFW issued a USD denominated bond in Q4. The 2% 5-year was upsized to USD 1.5bn from USD 1bn after the order book
topped USD 1.7bn.
• In December 2016, Poland became the first Sovereign to issue a green bond. The 0.5% 5-year increased from EUR 500m to EUR 750m on order books of EUR 1.4bn and realised a price improvement of 12bp compared to IPT.
• At the end of January 2017, France issued the longest green bond to date, with a 22-year tenor. The bond was originally slated to be at least EUR 2.5bn, with ambitions of EUR 3bn. Eventually, the bond settled at EUR 7.5bn, after the book closed at EUR 23bn. The bond priced at OAT+13 against IPT of OAT+18.
Green Bond Pricing in the Primary Market: January 2016 – March 2017 PAGE 6
Iberdrola 1% March 2024 EUR - Announced 24th November 2016
Iberdrola said:
The issuance price is very competitive in an environment affected by the volatility in interest rates and credit in the wake of the U.S. elections. The placement was completed very satisfactorily thanks to the high demand from investors in green fixed securities.
The bond issuance today was over three times oversubscribed. In this regard, green bonds usually generate higher demand due to the additional interest from socially responsible investors (SRI). In fact, most of the placement was subscribed by this type of investors, thereby enabling Iberdrola to go on diversifying its investor base and increasing the demand that improves these placements at times of market volatility.8
Municipality Finance (KUNTA) 1.375% Sept 2021 USD - Announced 26th September 2016
MuniFin said:
MuniFin’s inaugural USD 500 million green bond was well received by the markets. The book was oversubscribed within a few hours.
It was a strategic decision for MuniFin to access the Green Bond markets. We wanted to offer a new product to the capital markets and further expand our investor base. We are extremely pleased with today’s transaction, which serves as a base to build future transactions on. Amongst the almost 50 investors that the transaction attracted, there were a very large number of new investors who have not invested in MuniFin before, says Esa Kallio, Executive Vice President, Head of Capital Markets.9
Fibria 5.5% Jan 2027 USD – Announced 11th Jan 2017
The press said:
The green bonds were issued at a spread of T+334.5bp, representing a new issue premium (NIP) of 10bp after taking into account the credit curve extension on its existing 2024s, meaning the JLMs were able to price at half the average NIP paid by Brazilian issuers in 2016.
About 71% of the notes were allocated to accounts based in the US, while 22% was allocated to Europe and 7% Latin America, with many of the accounts in Europe comprised of dedicated green funds. Overall, about 40% of the notes were allocated to dedicated green funds.11
Fibria said:Our green bonds registered 40% of investors with profiles focused on sustainability, which is a record for this type of operation.12
3. http://www.globalcapital.com/article/znh0bd3bn510/berlin-hyp-eur500m-0587-may-23-green4. file:///C:/Users/carol/Downloads/2016_09_20_Berlin_Hyp_Green_Senior_Unsecured_EN.pdf5. http://www.globalcapital.com/article/b127y6zk9jqhc9/sncf-r233seau-eur1bn-1875-mar-34-green-bond6. https://www.dkb.de/groups/presse/pressemitteilungen/pm_160602.html
7. Enel web site https://www.enelgreenpower.com/en/media/press/d201701-enel-group-launches-its-first-green-bond-totalling-1250-million-euros-on-european-market-.html8. https://www.iberdrola.com/sala-comunicacion/noticias/detalle/iberdrola-cierra-su-cuarta-emision-de-bonos-verdes-por-un-importe-de-750-millones-de-euros-84104873201611259. https://www.munifin.fi/recents/news/2016/09/28/first-finnish-green-bond-was-success
10. http://www.globalcapital.com/article/wyx268d6r8x7/kommuninvest-usd600m-15-april-19-green-bond11. http://www.bondsloans.com/news/article/1174/case-study-fibria-breaks-ground-with-well-tim12. http://www.fibria.com.br/en/midia/releases/fibria-ends-2016-with-higher-sales-strong-net-income-growth-and-robust-cash-position/13. http://www.globalcapital.com/article/zg6rypz00148/negative-nip-for-iberdrolas-new-green-bond
Green Bond Pricing in the Primary Market: January 2016 – March 2017 PAGE 7
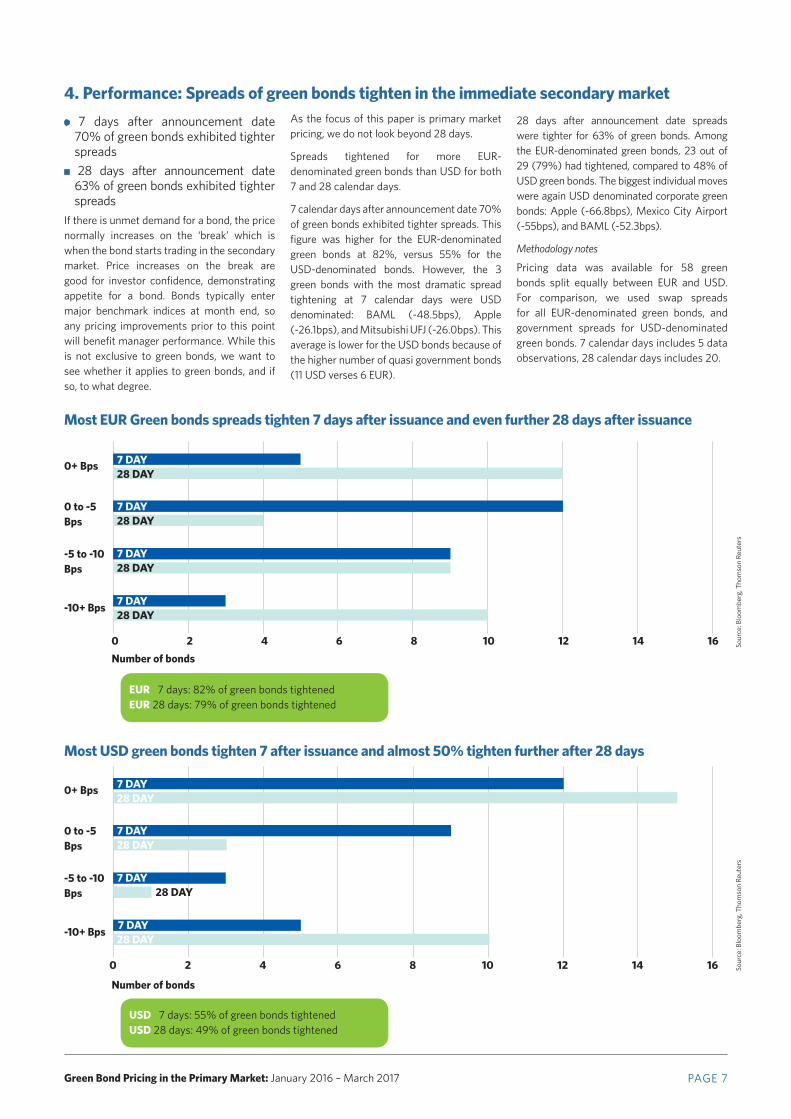
4. Performance: Spreads of green bonds tighten in the immediate secondary market
• 7 days after announcement date 70% of green bonds exhibited tighter spreads
• 28 days after announcement date 63% of green bonds exhibited tighter spreads
If there is unmet demand for a bond, the price normally increases on the ‘break’ which is when the bond starts trading in the secondary market. Price increases on the break are good for investor confidence, demonstrating appetite for a bond. Bonds typically enter major benchmark indices at month end, so any pricing improvements prior to this point will benefit manager performance. While this is not exclusive to green bonds, we want to see whether it applies to green bonds, and if so, to what degree.
As the focus of this paper is primary market pricing, we do not look beyond 28 days.
Spreads tightened for more EUR-denominated green bonds than USD for both 7 and 28 calendar days.
7 calendar days after announcement date 70% of green bonds exhibited tighter spreads. This figure was higher for the EUR-denominated green bonds at 82%, versus 55% for the USD-denominated bonds. However, the 3 green bonds with the most dramatic spread tightening at 7 calendar days were USD denominated: BAML (-48.5bps), Apple (-26.1bps), and Mitsubishi UFJ (-26.0bps). This average is lower for the USD bonds because of the higher number of quasi government bonds (11 USD verses 6 EUR).
28 days after announcement date spreads were tighter for 63% of green bonds. Among the EUR-denominated green bonds, 23 out of 29 (79%) had tightened, compared to 48% of USD green bonds. The biggest individual moves were again USD denominated corporate green bonds: Apple (-66.8bps), Mexico City Airport (-55bps), and BAML (-52.3bps).
Methodology notes
Pricing data was available for 58 green bonds split equally between EUR and USD. For comparison, we used swap spreads for all EUR-denominated green bonds, and government spreads for USD-denominated green bonds. 7 calendar days includes 5 data observations, 28 calendar days includes 20.
Most EUR Green bonds spreads tighten 7 days after issuance and even further 28 days after issuance
0+ Bps
0+ Bps
0 to -5 Bps
0 to -5 Bps
-5 to -10 Bps
-5 to -10 Bps
-10+ Bps
-10+ Bps
0
0
2
2
4
4
6
6
8
8
10 14
10 14
12 16
12 16
28 DAY
28 DAY
28 DAY
28 DAY
28 DAY
28 DAY
28 DAY
28 DAY
7 DAY
7 DAY
7 DAY
7 DAY
7 DAY
7 DAY
7 DAY
7 DAY
USD 7 days: 55% of green bonds tightened USD 28 days: 49% of green bonds tightened
EUR 7 days: 82% of green bonds tightened EUR 28 days: 79% of green bonds tightened
Most USD green bonds tighten 7 after issuance and almost 50% tighten further after 28 days
Number of bonds
Number of bonds
Sour
ce: B
loom
berg
, Tho
mso
n Re
uter
sSo
urce
: Blo
ombe
rg, T
hom
son
Reut
ers
Green Bond Pricing in the Primary Market: January 2016 – March 2017 PAGE 8
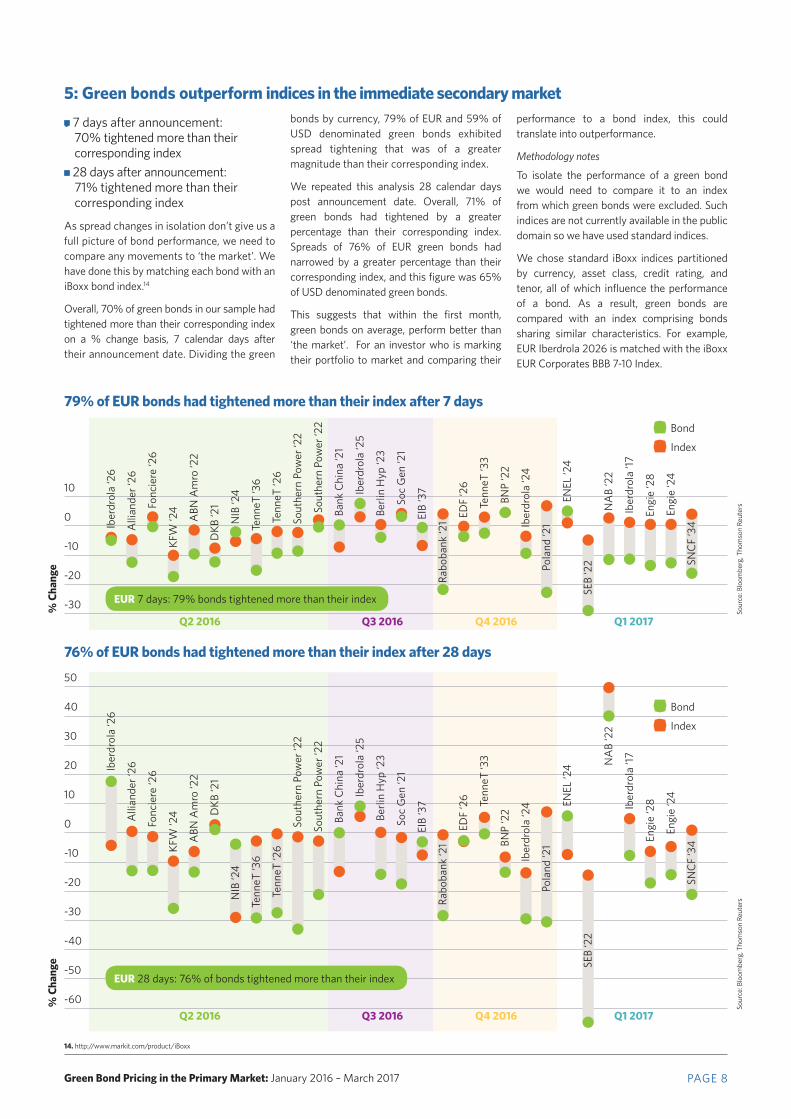
•7 days after announcement: 70% tightened more than their corresponding index
• 28 days after announcement: 71% tightened more than their corresponding index
As spread changes in isolation don’t give us a full picture of bond performance, we need to compare any movements to ‘the market’. We have done this by matching each bond with an iBoxx bond index.14
Overall, 70% of green bonds in our sample had tightened more than their corresponding index on a % change basis, 7 calendar days after their announcement date. Dividing the green
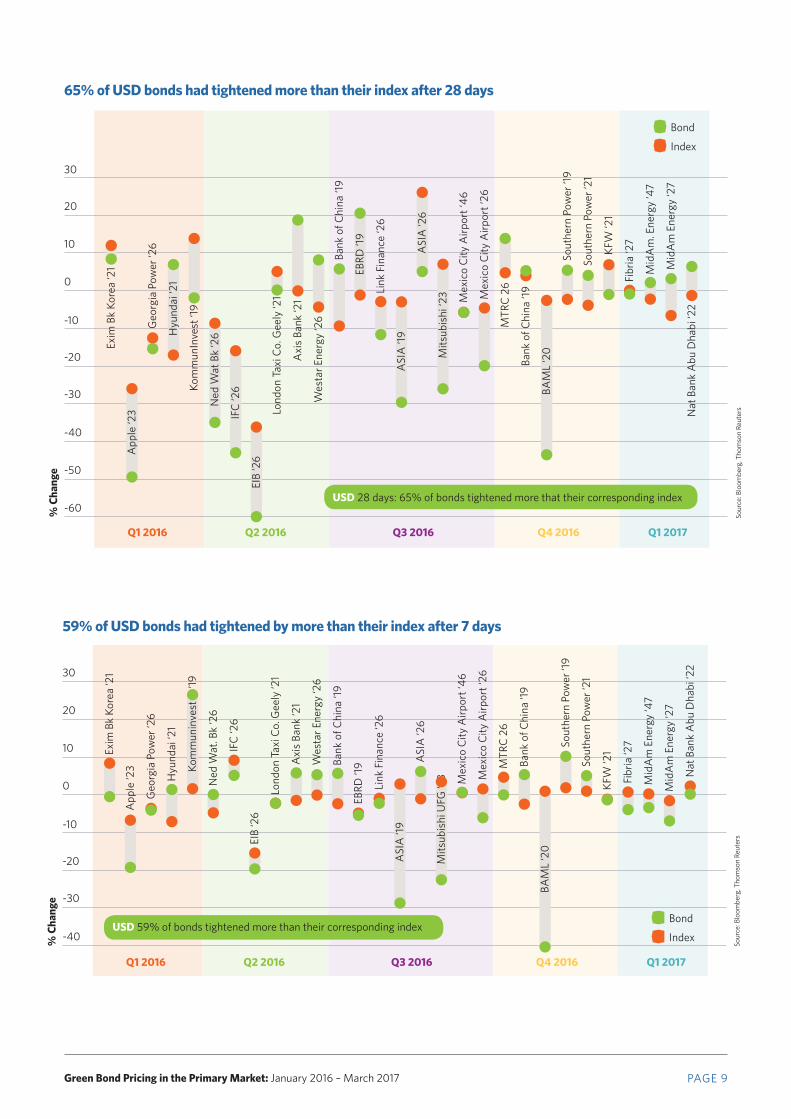
bonds by currency, 79% of EUR and 59% of USD denominated green bonds exhibited spread tightening that was of a greater magnitude than their corresponding index.
We repeated this analysis 28 calendar days post announcement date. Overall, 71% of green bonds had tightened by a greater percentage than their corresponding index. Spreads of 76% of EUR green bonds had narrowed by a greater percentage than their corresponding index, and this figure was 65% of USD denominated green bonds.
This suggests that within the first month, green bonds on average, perform better than ‘the market’. For an investor who is marking their portfolio to market and comparing their
performance to a bond index, this could translate into outperformance.
Methodology notes
To isolate the performance of a green bond we would need to compare it to an index from which green bonds were excluded. Such indices are not currently available in the public domain so we have used standard indices.
We chose standard iBoxx indices partitioned by currency, asset class, credit rating, and tenor, all of which influence the performance of a bond. As a result, green bonds are compared with an index comprising bonds sharing similar characteristics. For example, EUR Iberdrola 2026 is matched with the iBoxx EUR Corporates BBB 7-10 Index.
5: Green bonds outperform indices in the immediate secondary market
-10
-10
0
0
10
20
30
40
50
10
-30
-40
-50
-60
-30
-20
-20
76% of EUR bonds had tightened more than their index after 28 days
79% of EUR bonds had tightened more than their index after 7 days
• Bond
• Index
• Bond
• Index
Iber
drol
a ‘2
6Ib
erdr
ola
‘26
Alli
ande
r ‘26
Alli
ande
r ‘26
Fonc
iere
‘26
Fonc
iere
‘26
KFW
‘24
KFW
‘24
ABN
Am
ro ‘2
2A
BN A
mro
‘22
DKB
‘21
DKB
‘21
NIB
‘24
Tenn
eT ‘3
6Te
nneT
‘36
Tenn
eT ‘2
6Te
nneT
‘26
Sout
hern
Pow
er ‘2
2So
uthe
rn P
ower
‘22
Sout
hern
Pow
er ‘2
2So
uthe
rn P
ower
‘22
Bank
Chi
na ‘2
1Ba
nk C
hina
‘21
Iber
drol
a ‘2
5Ib
erdr
ola
‘25
Berli
n H
yp ‘2
3Be
rlin
Hyp
‘23
Soc
Gen
‘21
Soc
Gen
‘21
EIB
‘37
EIB
‘37
Rabo
bank
‘21
Rabo
bank
‘21
EDF
‘26
EDF
‘26
Tenn
eT ‘3
3Te
nneT
‘33
BNP
‘22
BNP
‘22
Iber
drol
a ‘2
4Ib
erdr
ola
‘24
Pola
nd ‘2
1Po
land
‘21
ENEL
‘24
ENEL
‘24
SEB
‘22
SEB
‘22
NA
B ‘2
2N
AB
‘22
Iber
drol
a ‘17
Iber
drol
a ‘17
Engi
e ‘2
8En
gie
‘28
Engi
e ‘2
4En
gie
‘24
SNC
F ‘3
4SN
CF
‘34
Q2 2016
Q2 2016
Q3 2016
Q3 2016
Q4 2016
Q4 2016
Q1 2017
Q1 2017
EUR 7 days: 79% bonds tightened more than their index
EUR 28 days: 76% of bonds tightened more than their index
NIB
‘24
% C
hang
e%
Cha
nge
14. http://www.markit.com/product/iBoxx
Sour
ce: B
loom
berg
, Tho
mso
n Re
uter
sSo
urce
: Blo
ombe
rg, T
hom
son
Reut
ers
Q2 2016Q1 2016 Q3 2016 Q4 2016 Q1 2017
-10
0
10
20
30
-30
-40
-50
-60
-20
65% of USD bonds had tightened more than their index after 28 days
• Bond
• Index
Exim
Bk
Kore
a ‘2
1
App
le ‘2
3
Geo
rgia
Pow
er ‘2
6
Hyu
ndai
‘21
Kom
mun
Inve
st ‘1
9
Ned
Wat
Bk
‘26
IFC
‘26
EIB
‘26
Lond
on T
axi C
o. G
eely
‘21
Axi
s Ba
nk ‘2
1
Wes
tar E
nerg
y ‘2
6
Bank
of C
hina
‘19
EBRD
‘19
Link
Fin
ance
‘26
ASI
A ‘1
9
ASI
A ‘2
6
Mits
ubis
hi ‘2
3 Mex
ico
City
Airp
ort ‘
46
Mex
ico
City
Airp
ort ‘
26
MTR
C 2
6
Bank
of C
hina
‘19
BAM
L ‘2
0
Sout
hern
Pow
er ‘1
9
Sout
hern
Pow
er ‘2
1
KFW
‘21
Fibr
ia ‘2
7
Mid
Am
. Ene
rgy
‘47
Mid
Am
Ene
rgy
‘27
Nat
Ban
k A
bu D
habi
‘22
Green Bond Pricing in the Primary Market: January 2016 – March 2017 PAGE 9
USD 28 days: 65% of bonds tightened more that their corresponding index
% C
hang
e
Q2 2016Q1 2016 Q3 2016 Q4 2016 Q1 2017
-10
0
10
20
30
-30
-40
-20
Exim
Bk
Kore
a ‘2
1
App
le ‘2
3
Geo
rgia
Pow
er ‘2
6
Hyu
ndai
‘21
Kom
mun
inve
st
‘19
Ned
Wat
. Bk
‘26
IFC
‘26
EIB
‘26
Lond
on T
axi C
o. G
eely
‘21
Axi
s Ba
nk ‘2
1
Wes
tar E
nerg
y ‘2
6
Bank
of C
hina
‘19
EBRD
‘19
Link
Fin
ance
‘26
ASI
A ‘1
9
ASI
A ‘2
6
Mits
ubis
hi U
FG ‘2
3 Mex
ico
City
Airp
ort ‘
46
Mex
ico
City
Airp
ort ‘
26
MTR
C 2
6
Bank
of C
hina
‘19
BAM
L ‘2
0
Sout
hern
Pow
er ‘1
9
Sout
hern
Pow
er ‘2
1
KFW
‘21
Fibr
ia ‘2
7
Mid
Am
Ene
rgy
‘47
Mid
Am
Ene
rgy
‘27
Nat
Ban
k A
bu D
habi
‘22
59% of USD bonds had tightened by more than their index after 7 days
• Bond
• IndexUSD 59% of bonds tightened more than their corresponding index
% C
hang
e
Sour
ce: B
loom
berg
, Tho
mso
n Re
uter
sSo
urce
: Blo
ombe
rg, T
hom
son
Reut
ers
Green Bond Pricing in the Primary Market: January 2016 – March 2017 PAGE 10
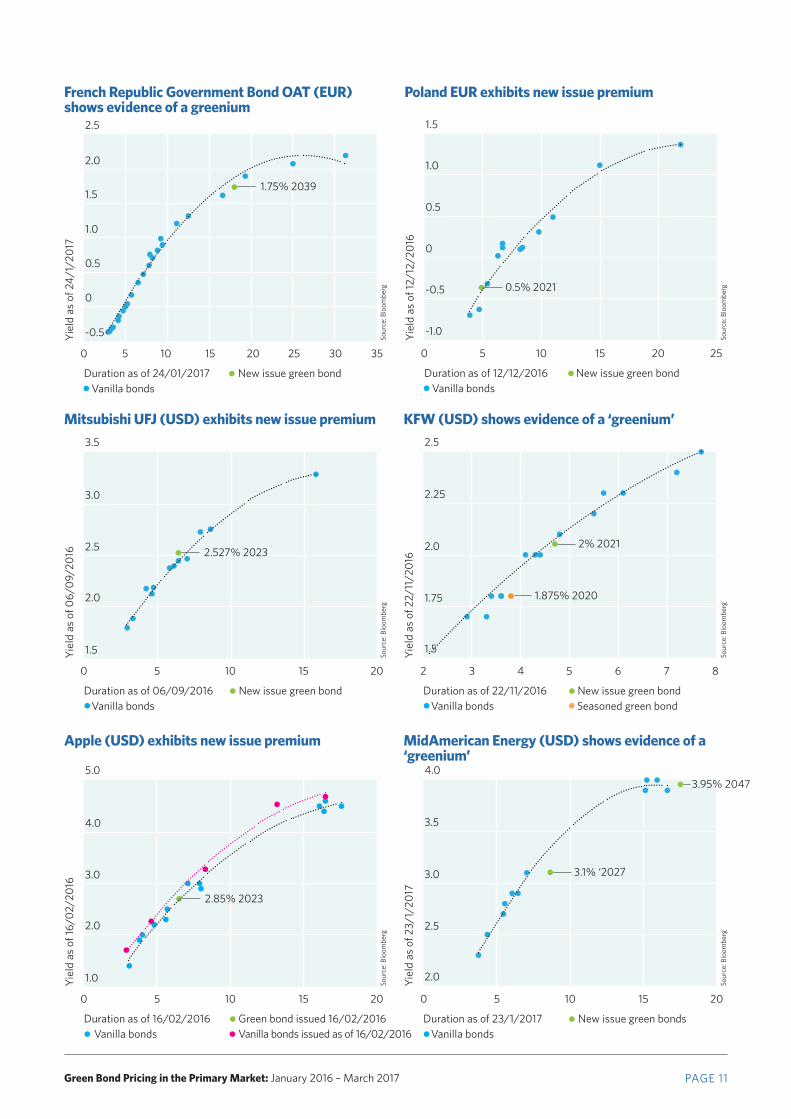
• 6 bonds priced inside their own yield curve so do not have a new issue premium
• 4 bonds priced on their own yield curve which suggests the absence of a new issue premium
• 4 bonds priced outside their own yield curve indicating clear new issue premium
There is speculation about whether green bonds price inside their own credit curves, and if so, to what level. Ordinarily, a new issue vanilla bond would price slightly cheaper than seasoned bonds, offering a higher yield that sits outside its own credit curves. This is known as the new issue premium and the cost of the additional yield is borne by the issuer to attract investment.
The greenium is the opposite scenario, whereby a bond will be issued at a higher price, with a lower yield hence sitting inside its own credit curve. In this instance, the issuer benefits from the cheaper cost of funding. This appears counterintuitive because green bonds rank pari passu (on equal footing) with bonds of the same rank from the same issuer. There is no credit enhancement to warrant pricing differences. Further, issuers of green bonds may incur minor additional costs such as certification and third-party review.
We have looked at 14 green bonds issued over the last five quarters to determine whether there is any evidence of a greenium. For some green bonds there seems to be, while for others, there is not. While our sample is limited, we can only look at available data.
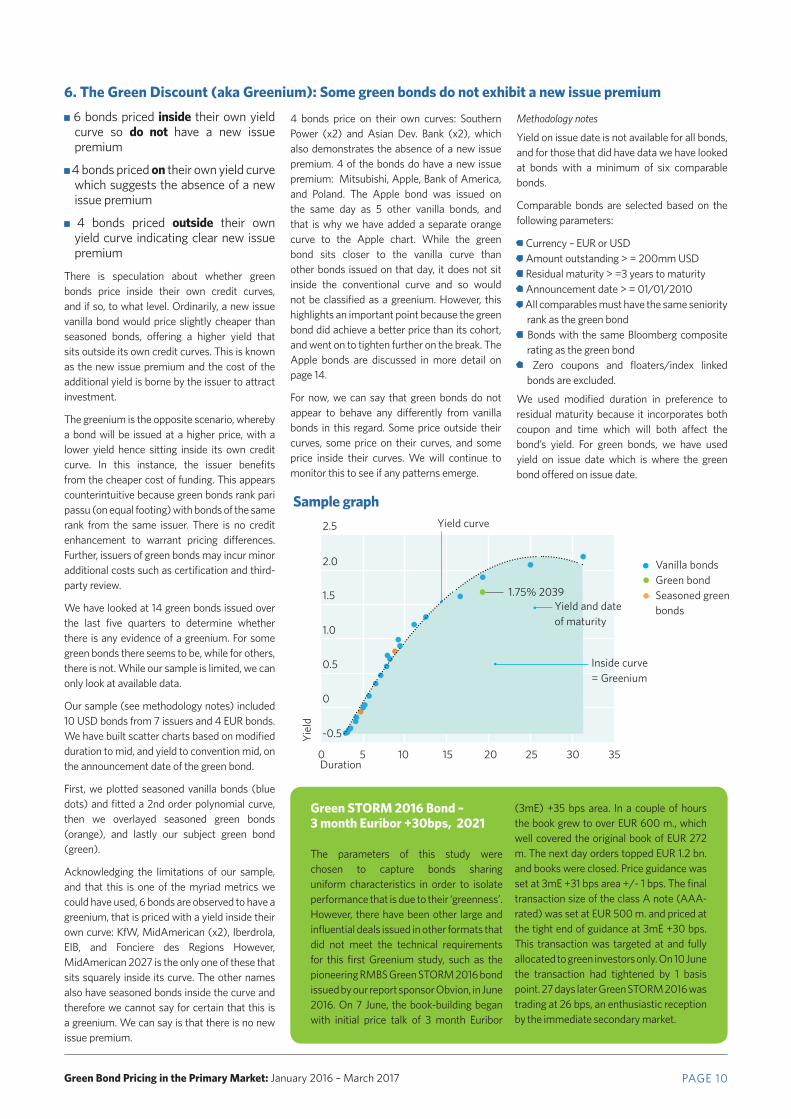
Our sample (see methodology notes) included 10 USD bonds from 7 issuers and 4 EUR bonds. We have built scatter charts based on modified duration to mid, and yield to convention mid, on the announcement date of the green bond.
First, we plotted seasoned vanilla bonds (blue dots) and fitted a 2nd order polynomial curve, then we overlayed seasoned green bonds (orange), and lastly our subject green bond (green).
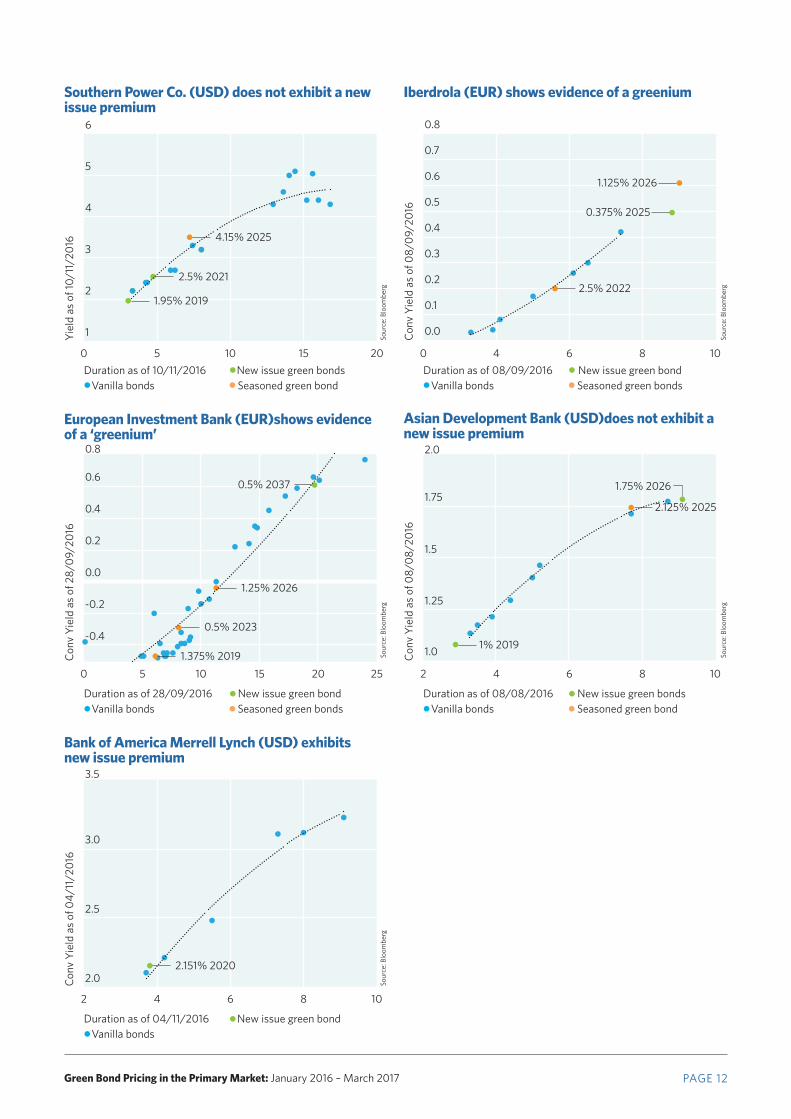
Acknowledging the limitations of our sample, and that this is one of the myriad metrics we could have used, 6 bonds are observed to have a greenium, that is priced with a yield inside their own curve: KfW, MidAmerican (x2), Iberdrola, EIB, and Fonciere des Regions However, MidAmerican 2027 is the only one of these that sits squarely inside its curve. The other names also have seasoned bonds inside the curve and therefore we cannot say for certain that this is a greenium. We can say is that there is no new issue premium.
4 bonds price on their own curves: Southern Power (x2) and Asian Dev. Bank (x2), which also demonstrates the absence of a new issue premium. 4 of the bonds do have a new issue premium: Mitsubishi, Apple, Bank of America, and Poland. The Apple bond was issued on the same day as 5 other vanilla bonds, and that is why we have added a separate orange curve to the Apple chart. While the green bond sits closer to the vanilla curve than other bonds issued on that day, it does not sit inside the conventional curve and so would not be classified as a greenium. However, this highlights an important point because the green bond did achieve a better price than its cohort, and went on to tighten further on the break. The Apple bonds are discussed in more detail on page 14.
For now, we can say that green bonds do not appear to behave any differently from vanilla bonds in this regard. Some price outside their curves, some price on their curves, and some price inside their curves. We will continue to monitor this to see if any patterns emerge.
Methodology notes
Yield on issue date is not available for all bonds, and for those that did have data we have looked at bonds with a minimum of six comparable bonds.
Comparable bonds are selected based on the following parameters:
• Currency – EUR or USD• Amount outstanding > = 200mm USD • Residual maturity > =3 years to maturity• Announcement date > = 01/01/2010• All comparables must have the same seniority
rank as the green bond• Bonds with the same Bloomberg composite
rating as the green bond • Zero coupons and floaters/index linked
bonds are excluded.
We used modified duration in preference to residual maturity because it incorporates both coupon and time which will both affect the bond’s yield. For green bonds, we have used yield on issue date which is where the green bond offered on issue date.
6. The Green Discount (aka Greenium): Some green bonds do not exhibit a new issue premium
Green STORM 2016 Bond – 3 month Euribor +30bps, 2021
The parameters of this study were chosen to capture bonds sharing uniform characteristics in order to isolate performance that is due to their ‘greenness’. However, there have been other large and influential deals issued in other formats that did not meet the technical requirements for this first Greenium study, such as the pioneering RMBS Green STORM 2016 bond issued by our report sponsor Obvion, in June 2016. On 7 June, the book-building began with initial price talk of 3 month Euribor
(3mE) +35 bps area. In a couple of hours the book grew to over EUR 600 m., which well covered the original book of EUR 272 m. The next day orders topped EUR 1.2 bn. and books were closed. Price guidance was set at 3mE +31 bps area +/- 1 bps. The final transaction size of the class A note (AAA-rated) was set at EUR 500 m. and priced at the tight end of guidance at 3mE +30 bps. This transaction was targeted at and fully allocated to green investors only. On 10 June the transaction had tightened by 1 basis point. 27 days later Green STORM 2016 was trading at 26 bps, an enthusiastic reception by the immediate secondary market.
2.5
2.0
1.5
1.0
0.5
0
-0.5
Vanilla bonds Green bond Seasoned green bonds
Yiel
d
0 5 10 15 20 25 30 350 5 10 15 20 25 30 35-0.5
0.0
0.5
1.0
1.5
2.0
2.5
1.75% 2039
Yield curve
Yield and date of maturity
Inside curve = Greenium
Sample graph
Duration
Vanilla bonds Green bond Seasoned green bonds
Green Bond Pricing in the Primary Market: January 2016 – March 2017 PAGE 11
3.5
5.0
2.5
4.0
3.0
4.0
2.25
3.5
2.5
3.0
2.0
2.0
2.0
3.0
1.5
1.0
1.75
2.5
1.5
2.0
Duration as of 06/09/2016 New issue green bond Vanilla bonds
Duration as of 16/02/2016 Green bond issued 16/02/2016 Vanilla bonds
Duration as of 22/11/2016 New issue green bond Vanilla bonds Seasoned green bond
Duration as of 23/1/2017 New issue green bonds Vanilla bonds
Yiel
d as
of 0
6/09
/201
6Yi
eld
as o
f 16/
02/2
016
Yiel
d as
of 2
2/11
/201
6Yi
eld
as o
f 23/
1/20
17
0
0 0
25
5 5
310
10 10
415
15 15
520
20 20
6 7 80 5 10 15 201.5
2.0
2.5
3.0
3.5
0 5 10 15 201
2
3
4
5
2 3 4 5 6 7 81.5
2.0
2.5
Mitsubishi UFJ (USD) exhibits new issue premium
Apple (USD) exhibits new issue premium
KFW (USD) shows evidence of a ‘greenium’
MidAmerican Energy (USD) shows evidence of a ‘greenium’
2.527% 2023
2.85% 2023
1.875% 2020
2% 2021
0 5 10 15 202.0
2.5
3.0
3.5
4.0
1.5
1.0
0.5
0
-0.5
-1.0
Duration as of 12/12/2016 New issue green bond Vanilla bonds
Yiel
d as
of 1
2/12
/201
6
0 5 10 15 20 250 5 10 15 20 250.0
0.5
1.0
1.5
2.0
2.5
Poland EUR exhibits new issue premium
0.5% 2021
3.1% ‘2027
3.95% 2047
Vanilla bonds issued as of 16/02/2016
French Republic Government Bond OAT (EUR) shows evidence of a greenium
2.5
2.0
1.5
1.0
0.5
0
-0.5
Duration as of 24/01/2017 New issue green bond Vanilla bonds
Yiel
d as
of 2
4/1/
2017
0 5 10 15 20 25 30 350 5 10 15 20 25 30 35-0.5
0.0
0.5
1.0
1.5
2.0
2.5
1.75% 2039
Sour
ce: B
loom
berg
Sour
ce: B
loom
berg
Sour
ce: B
loom
berg
Sour
ce: B
loom
berg
Sour
ce: B
loom
berg
Sour
ce: B
loom
berg
Green Bond Pricing in the Primary Market: January 2016 – March 2017 PAGE 12
0.8 2.0
0.6
1.75
0.2
0.4
-0.2
0.0
1.5
-0.4
1.25
1.0
Duration as of 28/09/2016 New issue green bond Vanilla bonds Seasoned green bonds
Duration as of 08/08/2016 New issue green bonds Vanilla bonds Seasoned green bond
Conv
Yie
ld a
s of
28/
09/2
016
Conv
Yie
ld a
s of
08/
08/2
016
0 25 10 415 2520 6 8 100 5 10 15 20 25
-0.5-0.4-0.3-0.2-0.10.00.10.20.30.40.50.60.70.8
2 4 6 8 101.0
1.5
2.0
European Investment Bank (EUR)shows evidence of a ‘greenium’
Asian Development Bank (USD)does not exhibit a new issue premium
0.5% 2037
1.25% 2026
0.5% 2023
1.375% 20191% 2019
2.125% 2025
1.75% 2026
6
5
0.8
4
0.7
3
0.6
2
0.5
1
0.4
0.3
0.2
0.1
0.0
Duration as of 10/11/2016 New issue green bonds Vanilla bonds Seasoned green bond
Duration as of 08/09/2016 New issue green bond Vanilla bonds Seasoned green bonds
Yiel
d as
of 1
0/11
/201
6
Conv
Yie
ld a
s of
08/
09/2
016
0 05 410 615 8 10200 5 10 15 201
2
3
4
5
6
2 4 6 8 100.0
0.1
0.2
0.3
0.4
0.5
0.6
0.7
0.8
Southern Power Co. (USD) does not exhibit a new issue premium
Iberdrola (EUR) shows evidence of a greenium
4.15% 2025
2.5% 2021
1.95% 20192.5% 2022
0.375% 2025
1.125% 2026
3.5
3.0
2.5
2.0
Duration as of 04/11/2016 New issue green bond Vanilla bonds
Conv
Yie
ld a
s of
04/
11/2
016
2 4 6 8 102 4 6 8 102.0
2.5
3.0
3.5
Bank of America Merrell Lynch (USD) exhibits new issue premium
2.151% 2020
Sour
ce: B
loom
berg
Sour
ce: B
loom
berg
Sour
ce: B
loom
berg
Sour
ce: B
loom
berg
Sour
ce: B
loom
berg
Disclaimer: The information contained in this communication does not constitute investment advice in any form and the Climate Bonds Initiative is not an investment adviser. Any reference to a financial organisation or investment product is for information purposes only. Links to external websites are for information purposes only. The Climate Bonds Initiative accepts no responsibility for content on external websites.
The Climate Bonds Initiative is not endorsing, recommending or advising on the merits or otherwise of any investment or investment product and no information within this communication should be taken as such, nor should any information in this communication be relied upon in making any investment decision.
A decision to invest in anything is solely yours. The Climate Bonds Initiative accepts no liability of any kind, for any investment an individual or organisation makes, nor for any investment made by third parties on behalf of an individual or organisation, based in whole or in part on any information contained within this, or any other Climate Bonds Initiative public communication.
One of the reasons why a bond buyer would be willing to pay a greenium is scarcity of the green label. Investors may be compelled to buy green bonds to meet a mandate. Treasurers and bookrunners are on record as saying that green bonds attract a higher number, and a broader range of investors than conventional bonds which they believe offers stability to their debt in times of market volatility. Green bonds are oversubscribed and price better than expectations, as one would expect in current market conditions. During our period of observation interest rates have remained at historical lows therefore investors have been looking for yield. Sometimes, green bonds price outside their curves, sometimes, they price inside, and sometimes, they price
on their curves. In this respect, green bonds perform no differently from other categories of bonds as far as we can tell.
We have however, seen that after generating good demand, and pricing tight, for many green bonds, spreads tightened materially in the first seven and twenty-eight days after the announcement date, both on an absolute basis, and when measured against a corresponding index. This suggests that many green bonds are under-priced at issuance. We are not able to say whether this market behaviour will persist, but this could point towards tighter pricing in the future.
For the time being, this data should allay concerns among investors about longer
term underperformance by green bonds, since there doesn’t seem to be any. There is certainly no penalty attached to holding green bonds as opposed to other bonds of the same issuer and, in some instances, our analysis suggests there may be a reward.
This publication is part of an ongoing series. Our next publication will monitor qualifying bonds issued in Q2 2017, April to June. As well as the metrics we have included here, we will explore other ways of comparing green bonds to a vanilla sample.
If you would like to discuss this paper in more detail, please contact [email protected].
Conclusion
www.climatebonds.net
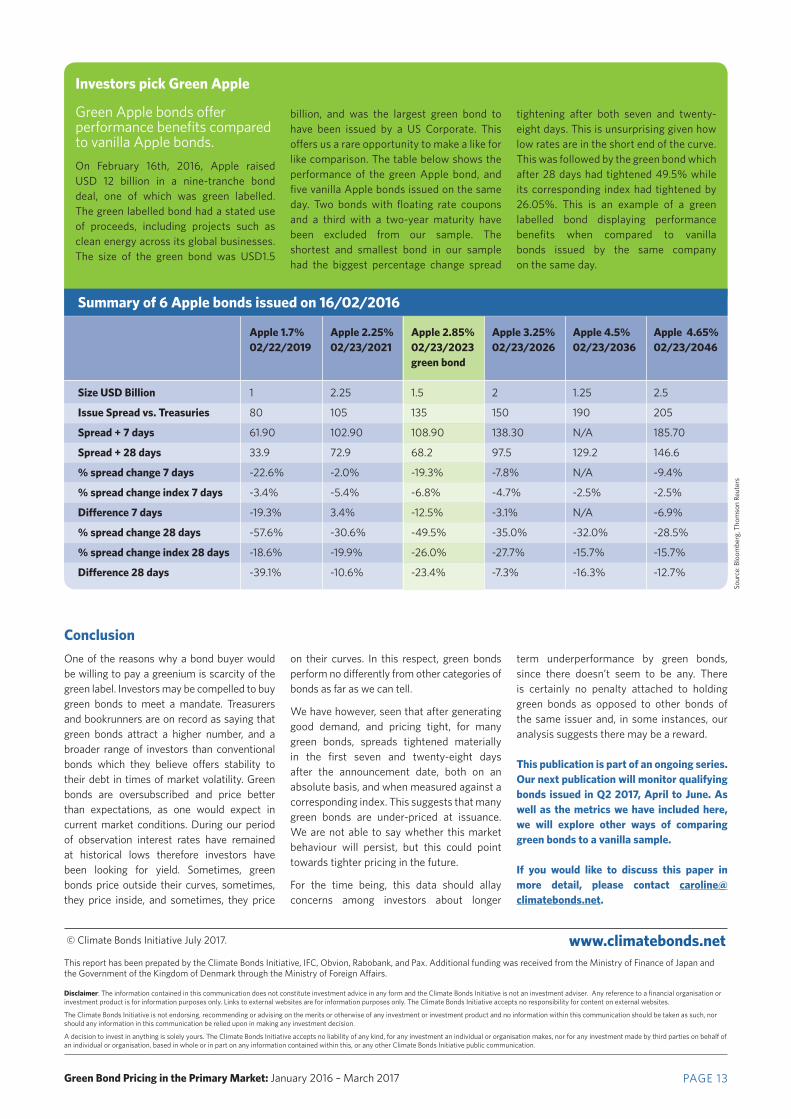
Green Apple bonds offer performance benefits compared to vanilla Apple bonds. On February 16th, 2016, Apple raised USD 12 billion in a nine-tranche bond deal, one of which was green labelled. The green labelled bond had a stated use of proceeds, including projects such as clean energy across its global businesses. The size of the green bond was USD1.5
Size USD Billion
Issue Spread vs. Treasuries
Spread + 7 days
Spread + 28 days
% spread change 7 days
% spread change index 7 days
Difference 7 days
% spread change 28 days
% spread change index 28 days
Difference 28 days
Apple 1.7% 02/22/2019
1
80
61.90
33.9
-22.6%
-3.4%
-19.3%
-57.6%
-18.6%
-39.1%
Apple 2.25% 02/23/2021
2.25
105
102.90
72.9
-2.0%
-5.4%
3.4%
-30.6%
-19.9%
-10.6%
Apple 2.85% 02/23/2023 green bond
1.5
135
108.90
68.2
-19.3%
-6.8%
-12.5%
-49.5%
-26.0%
-23.4%
Apple 3.25% 02/23/2026
2
150
138.30
97.5
-7.8%
-4.7%
-3.1%
-35.0%
-27.7%
-7.3%
Apple 4.5% 02/23/2036
1.25
190
N/A
129.2
N/A
-2.5%
N/A
-32.0%
-15.7%
-16.3%
Apple 4.65% 02/23/2046
2.5
205
185.70
146.6
-9.4%
-2.5%
-6.9%
-28.5%
-15.7%
-12.7%
Summary of 6 Apple bonds issued on 16/02/2016
billion, and was the largest green bond to have been issued by a US Corporate. This offers us a rare opportunity to make a like for like comparison. The table below shows the performance of the green Apple bond, and five vanilla Apple bonds issued on the same day. Two bonds with floating rate coupons and a third with a two-year maturity have been excluded from our sample. The shortest and smallest bond in our sample had the biggest percentage change spread
tightening after both seven and twenty-eight days. This is unsurprising given how low rates are in the short end of the curve. This was followed by the green bond which after 28 days had tightened 49.5% while its corresponding index had tightened by 26.05%. This is an example of a green labelled bond displaying performance benefits when compared to vanilla bonds issued by the same company on the same day.
Green Bond Pricing in the Primary Market: January 2016 – March 2017 PAGE 13
Investors pick Green Apple
Sour
ce: B
loom
berg
, Tho
mso
n Re
uter
s
This report has been prepated by the Climate Bonds Initiative, IFC, Obvion, Rabobank, and Pax. Additional funding was received from the Ministry of Finance of Japan and the Government of the Kingdom of Denmark through the Ministry of Foreign Affairs.
© Climate Bonds Initiative July 2017.
Methodology This paper includes labelled green bonds issued during the last five quarters from January 2016 to March 2017.
We have included all green labelled bonds meeting the following specifications:
• Announcement date between 01/01/2016 and 31/03/2017
• Bonds issued prior to 01/01/2016 are excluded due to inadequate data
• Denominated in either USD or EUR. A critical mass of green bonds has been issued in these currencies, enabling us to draw reliable conclusions
• Size > = 200 million
• Investment grade rated
• Minimum term of three (3) years maturity
• Consistent with Climate Bonds taxonomy
• Amortising bonds are excluded
We have carefully set these parameters to capture the most liquid portion of the market for which data availability is sufficiently robust.
During 2016 and 2017, a handful of local currency green bonds exceeding USD 200m equivalent were issued in SEK, INR, AUD, and CAD.
Green Bond Pricing in the Primary Market: January 2016 – March 2017 PAGE 14
China issued around 30 RMB bonds, and we may explore the viability of a pricing study on these later this year.
All historical spread data is based on asset swap spreads for EUR denominated bonds, and a US Treasury curve for USD. All historical spread data is taken from EIKON Thomson Reuters.
The green bonds included in the data set are summarised in Table 1.
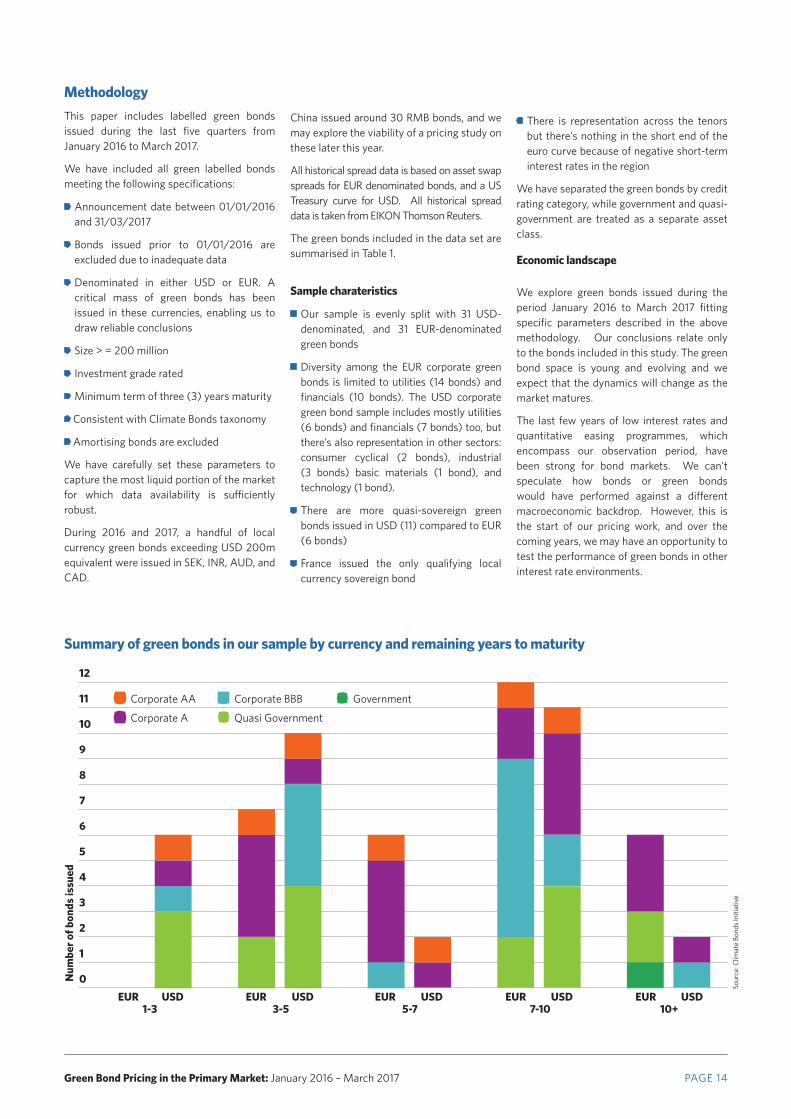
Sample charateristics
• Our sample is evenly split with 31 USD-denominated, and 31 EUR-denominated green bonds
• Diversity among the EUR corporate green bonds is limited to utilities (14 bonds) and financials (10 bonds). The USD corporate green bond sample includes mostly utilities (6 bonds) and financials (7 bonds) too, but there’s also representation in other sectors: consumer cyclical (2 bonds), industrial (3 bonds) basic materials (1 bond), and technology (1 bond).
• There are more quasi-sovereign green bonds issued in USD (11) compared to EUR (6 bonds)
• France issued the only qualifying local currency sovereign bond
EUR USD EUR USD EUR USDEUR USDEUR USD
2
8
3
9
4
10
6
12
5
11
1
0Num
ber o
f bon
ds is
sued
7
• Corporate AA
• Corporate A
Summary of green bonds in our sample by currency and remaining years to maturity
10+7-105-73-51-3
• Corporate BBB
• Quasi Government• Government
Sour
ce: C
limat
e Bo
nds
Initi
ativ
e
• There is representation across the tenors but there’s nothing in the short end of the euro curve because of negative short-term interest rates in the region
We have separated the green bonds by credit rating category, while government and quasi-government are treated as a separate asset class.
Economic landscape
We explore green bonds issued during the period January 2016 to March 2017 fitting specific parameters described in the above methodology. Our conclusions relate only to the bonds included in this study. The green bond space is young and evolving and we expect that the dynamics will change as the market matures.
The last few years of low interest rates and quantitative easing programmes, which encompass our observation period, have been strong for bond markets. We can’t speculate how bonds or green bonds would have performed against a different macroeconomic backdrop. However, this is the start of our pricing work, and over the coming years, we may have an opportunity to test the performance of green bonds in other interest rate environments.