Embed Size (px)
Citation preview

0
GREEN CITIES METHODOLOGY – FINAL REPORT – 20 MAY 2016

1
This document (the “Report”) is based on work prepared by the OECD and ICLEI (the ‘Experts’) for the European
Bank for Reconstruction and Development (the “EBRD”). The views, opinions, assumptions, statements and
recommendations expressed in this Report are those of the Experts and do not necessarily reflect the official policy or
position of the EBRD.

2
TABLE OF CONTENTS
EXECUTIVE SUMMARY ............................................................................................................................ 5
1. The multiplicity and diversity of urban environmental activities in the world ........................................ 5
2. Definition of a green city ......................................................................................................................... 5
3. Benchmarking and prioritising green city challenges and actions ........................................................... 6
4. Methodology for Green City Action Plans (GCAPs) .............................................................................. 7
SECTION 1 – URBAN ENVIRONMENTAL ACTIVITIES IN THE WORLD ........................................... 8
1.1. EBRD’s strategic orientations ............................................................................................................... 8
1.2. Existing environmental activities in cities in the world ........................................................................ 9
1.3. Review of environmental activities in Tbilisi and Yerevan ................................................................ 12
Tbilisi, Georgia ....................................................................................................................................... 12
Yerevan, Armenia .................................................................................................................................. 13
SECTION 2 – DEFINITION OF A GREEN CITY ...................................................................................... 14
2.1. Definition of a green city and approach for EBRD ............................................................................ 14
2.2. Environmental, economic and social objectives of a green city ......................................................... 15
2.3. Key economic activities and services to be addressed under a Green City Approach, and relevance to
EBRD’s mandate ....................................................................................................................................... 17
2.4. The Pressure-State-Response approach: conceptualising the causal linkages between green city
components ................................................................................................................................................ 19
SECTION 3 - GREEN CITY STRATEGIC PLANNING INSTRUMENTS (BENCHMARKING AND
PRIORITISATION) ...................................................................................................................................... 21
3.1. Review of existing international best practices on green city strategic planning instruments
(indicators, benchmarking and prioritisation) ............................................................................................ 21
Green city indicators: the need for a conceptual framework .................................................................. 21
IADB’s ESCI provides a complete benchmarking and prioritisation approach ..................................... 22
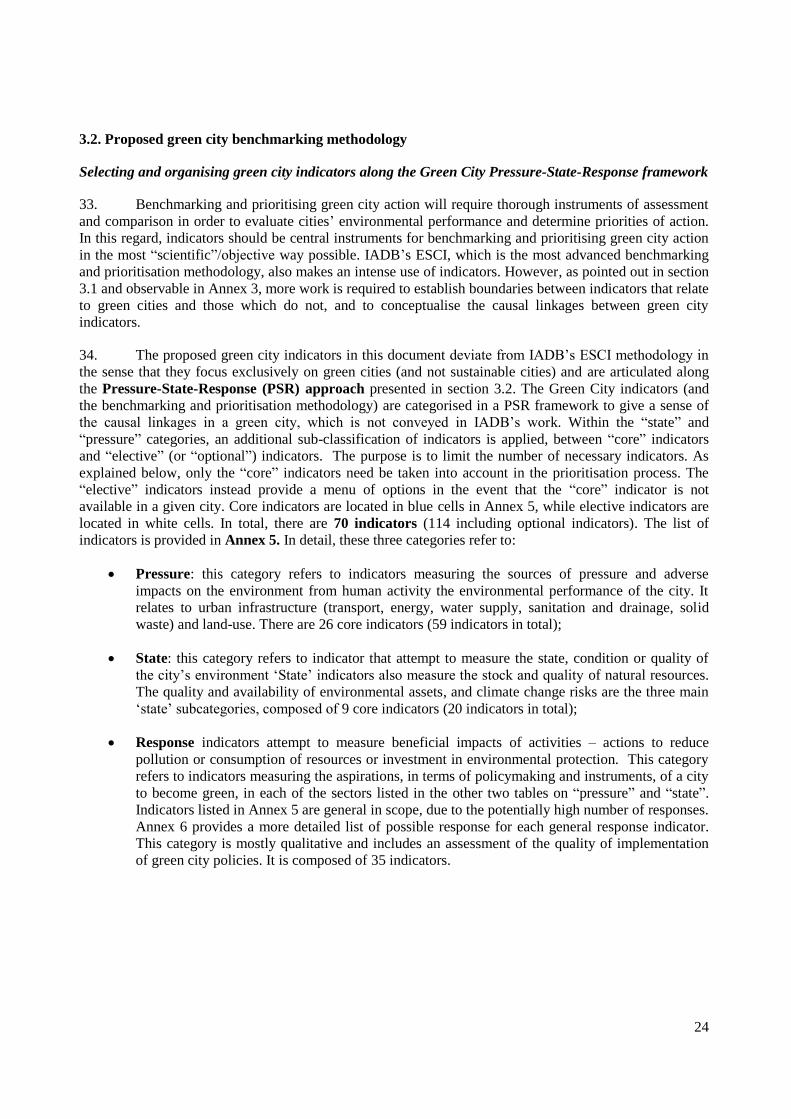
3.2. Proposed green city benchmarking methodology ............................................................................... 24
Selecting and organising green city indicators along the Green City Pressure-State-Response
framework .............................................................................................................................................. 24
Criteria for indicator selection and potential indicator challenges ......................................................... 25
Benchmarking methodology: “traffic light” screening of state and pressure indicators ....................... 26
3.3. Proposed green city action prioritisation methodology ...................................................................... 27
1. Collection of indicators (cf. Step 1.2 in Table 11 and Annex 7) ........................................................ 28
2. Prioritisation of green city challenges (cf. Step 1.3 in Table 11 and Annex 7) – Identifying baseline
conditions ............................................................................................................................................... 28
1.3.1 Technical analysis undertaken internally within the municipality’s workforce ........................ 28
1.3.2 Stakeholder-based analysis of green city challenges ................................................................. 30
1.3.3 Political assessment of green city challenges ............................................................................ 30
3. Prioritisation of green city actions (cf. Step 2.2 in Table 11 and Annex 7) ....................................... 30
2.2.1 (Second) Technical analysis - select and prioritise green city actions (undertaken internally
within the municipality’s workforce) ................................................................................................. 30
SECTION 4 – METHODOLOGY FOR DEVELOPING GREEN CITY ACTION PLANS ....................... 34
4.1. The structure of Green City Action Plans ........................................................................................... 34

3
4.2. The contents of the main sections of Green City Action Plans ........................................................... 35
4.3. Indicative timelines for developing Green City Action Plans ............................................................ 40
4.4. Range of skill sets, both within a city administration and external support, required to develop
GCAPs ....................................................................................................................................................... 42
Coordinating the effort ........................................................................................................................... 43
Co-ordination Board ............................................................................................................................... 43
Co-ordination (Team) ............................................................................................................................. 44
Internal Auditor ...................................................................................................................................... 45
External Auditor ..................................................................................................................................... 45
Capacity Building and Motivation ......................................................................................................... 45
ANNEX 1. EXISTING ENVIRONMENTAL ACTIVITIES IN CITIES IN THE WORLD ....................... 47
ANNEX 2. ENVIRONMENTAL ACTIVITIES IN TBILISI AND YEREVAN ......................................... 62
ANNEX 3. GREEN CITY INDICATORS: LITERATURE REVIEW ........................................................ 68
ANNEX 4. INTERNATIONAL BEST PRACTICES FOR PRIORITISING AND BENCHMARKING
GREEN CITY ACTIONS ............................................................................................................................. 72
ANNEX 5. PRESSURE-STATE-RESPONSE INDICATORS FOR GREEN CITIES ................................ 77
ANNEX 6. DEFINITION OF GREEN CITY INDICATORS ...................................................................... 89
ANNEX 7. GREEN CITY ACTION PLAN METHODOLOGY ............................................................... 103
ANNEX 8. REFERENCES USED FOR THE GREEN CITY ACTION PLAN METHODOLOGY ........ 116
Tables
Table 1. EBRD's strategic orientations ........................................................................................................... 8 Table 2. Main lessons from urban environmental activities in the world ...................................................... 9 Table 3. Green cities' environmental dimensions ......................................................................................... 15 Table 4. Green cities' economic and social dimensions and objectives ....................................................... 16 Table 5. Key environmental dimensions and related economic activities and policies to be addressed under
a Green City Approach (by targeted environmental objective) ............................................................ 17 Table 6. Key environmental challenges and related economic activities and services to be addressed under
a Green City Approach (by sector) ....................................................................................................... 18 Table 7. Menu of green city policy prioritisation filters ............................................................................... 31 Table 8. Template of green city policy filter application – example with four filters selected by a
municipality from the menu given in Table 7 ...................................................................................... 32 Table 9. Structure and contents of Green City Action Plans ........................................................................ 34 Table 10. Translation of the main aspects of Green City Action Plans into the methodology ..................... 35 Table 11. Summary of the methodology for developing Green City Action Plans ...................................... 36 Table 12. Timelines in international references for management methodologies similar to GCAP ............ 40 Table 13. Timelines of the Green City Action Plan methodology ............................................................... 41
Figures
Figure 1. Green city Pressure-State-Response framework ........................................................................... 20 Figure 2. Summary of the benchmarking and prioritisation process ............................................................ 27 Figure 3. Green city baseline problem "tree" using the traffic light benchmarking methodology ............... 29 Figure 4. Example of web of four filters applied to a given policy measure................................................ 32

4
Figure 5. Green cities’ environmental dimensions and the cyclical process of Green City Action Plans.... 36 Figure 6. Green City Action Plan - Summary Diagram ............................................................................... 40
Boxes
Box 1. Important administrative considerations according to international / European experience .......... 42 Box 2. Example of administrative skills: What a Chief Resilience Officer Does? .................................... 44
5
EXECUTIVE SUMMARY
1. The multiplicity and diversity of urban environmental activities in the world
1. The European Bank for Reconstruction and Development (EBRD) is committed to promoting
environmentally sound development as expressed in the Agreement Establishing the EBRD. This
commitment is demonstrated in the Bank’s Environmental and Social Policy (ESP), the Municipal and
Environmental Infrastructure (MEI) Sector Strategy and more recently in its Green Economy Transition
(GET) approach, which targets to have ‘green’ projects represent 40% of the EBRD’s investment by 2020.
Given cities’ environmental impacts and their important economic role, the Bank should further implement
these strategies and accelerate transition in its Countries of Operations (COOs) by developing a green cities
programme.
2. A review of existing green cities initiatives by international actors reveals the growing
importance given to the urban environmental agenda and the increasingly decentralised character of green
(or sustainable) city actions, which underlines the importance of EBRD’s MEI investments for GET and
ESP. Another critical finding is the growing attention paid to a comprehensive approach to green cities.
That is, most programmes take a systematic approach to cities covering the broad range of environmental
issues and linking these issues to economic and social objectives (e.g. inclusiveness). There are two major
hurdles impeding the dissemination of a common, systematic green cities approach: i) it is challenging to
translate such comprehensive approaches into investment projects, which tend to focus on single urban
sectors; ii) there is a lack of agreement on the definition and approach to developing a green city , which
is reflected in the numerous terminologies and contents of existing urban environmental activities (e.g.
green cities, sustainable cities, resilient cities etc.).
2. Definition of a green city
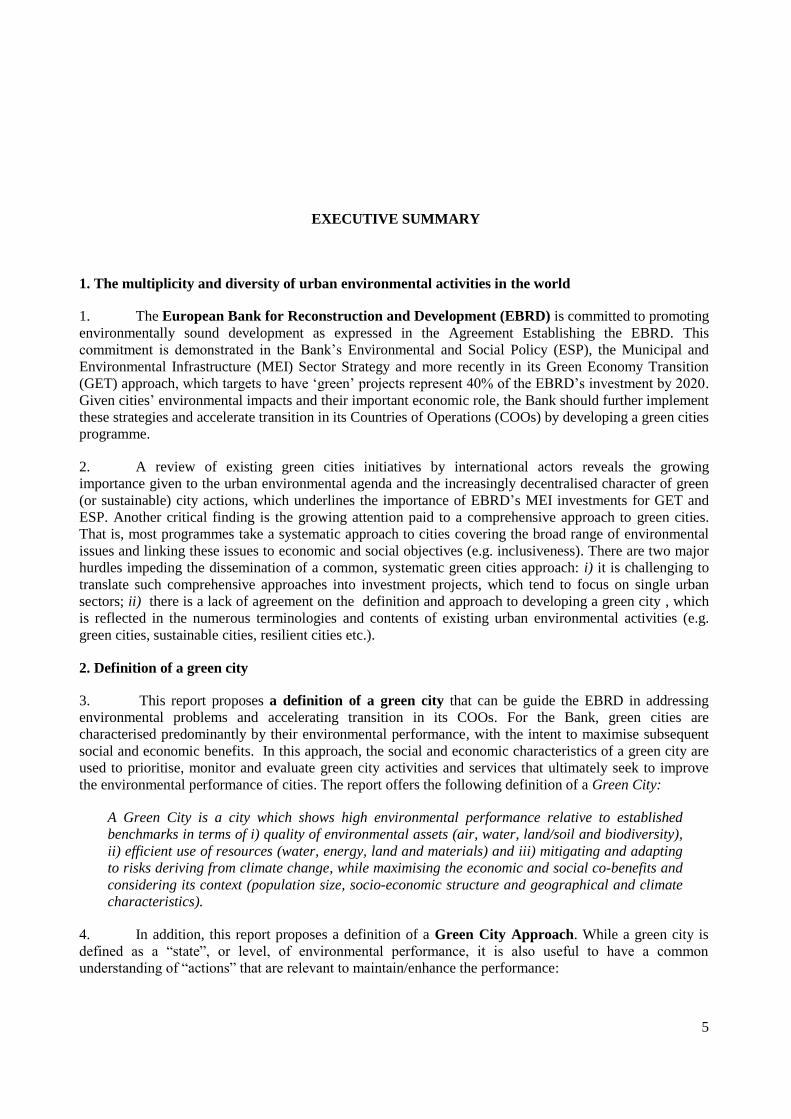
3. This report proposes a definition of a green city that can be guide the EBRD in addressing
environmental problems and accelerating transition in its COOs. For the Bank, green cities are
characterised predominantly by their environmental performance, with the intent to maximise subsequent
social and economic benefits. In this approach, the social and economic characteristics of a green city are
used to prioritise, monitor and evaluate green city activities and services that ultimately seek to improve
the environmental performance of cities. The report offers the following definition of a Green City:
A Green City is a city which shows high environmental performance relative to established
benchmarks in terms of i) quality of environmental assets (air, water, land/soil and biodiversity),
ii) efficient use of resources (water, energy, land and materials) and iii) mitigating and adapting
to risks deriving from climate change, while maximising the economic and social co-benefits and
considering its context (population size, socio-economic structure and geographical and climate
characteristics).
4. In addition, this report proposes a definition of a Green City Approach. While a green city is
defined as a “state”, or level, of environmental performance, it is also useful to have a common
understanding of “actions” that are relevant to maintain/enhance the performance:

6
A Green City Approach is an integrated, multi-sector process whereby a city’s environmental
challenges are periodically identified, prioritised and addressed through targeted investments
and services, regulations and other relevant policy instruments with the aim to enhance the city’s
environmental performance in a cost-efficient and financially sustainable manner, while at the
same time seeking to maximise the economic and social co-benefits .
5. In order to apply such a Green City Approach to the methodology, this report proposes a Green
City Pressure-State-Response (PSR) framework, adapted from a framework developed by the OECD.
The Green City PSR framework identifies human activities that exert pressures on the urban environment
(categorised by the following six sectors: transport, energy, building, industry, water, solid waste, and
land-use) and change its state in terms of environmental performance. It also identifies how society
responds to these changes through general environmental, economic and sectoral policies, and through
changes in behaviour, thus affecting the pressures caused by human activities. The Green City PSR
framework therefore builds causal linkages between the environmental performance of a green city; the
key associated economic activities; and investment, services and policy instruments to respond to these
challenges.
3. Benchmarking and prioritising green city challenges and actions
6. There is little consensus on which urban environmental measures and implementation methods
cities should employ, including benchmarking and prioritisation tools, which are critical for a city to
identify challenges and suitable actions. For example, to date existing green city indicators vary
significantly from one initiative to another, reflecting the lack of uniformity of approaches in existing
urban environmental activities.
7. This report recommends developing green city indicators and a benchmarking and prioritisation
process following the structure of the Green City PSR framework. The proposed green city benchmarking
methodology is inspired by the Emerging and Sustainable Cities Initiative (ESCI) developed by the Inter-
American Development Bank (IADB) and involves applying a traffic light screening over the green city
indicators with benchmarks corresponding to traffic light thresholds (“green”; “amber”; “red”). While
some indicative benchmarks are suggested, it is recommended that EBRD establishes country-specific
benchmarks data in order to follow national standards and laws, thereby taking the context of its COOs
into account. The traffic light benchmarking will be used to identify priority green city challenges and in
prioritising green city actions/policy options. Both the prioritisation of green city challenges and green city
actions/policy options will follow a three-step assessment:
Technical assessment, executed by city employees and other experts. In prioritising green city
challenges, this assessment will include the use of the traffic light screening on the PSR
indicators, which also evaluate indicators’ individual, projected trends. Another technical
assessment will take place in the drafting of the Green City Action Plan and will consist in
selecting policy options and applying priority filters (environmental, economic, and social
impacts; budget cost estimates).
Stakeholder-based prioritisation: local experts and relevant stakeholders will complement the
technical assessment by verifying and/or editing green city challenges and actions identified.
Political assessment: this is a formal assessment of the results of the previous steps in order to
provide a final prioritisation of challenges to address and priority actions to take.

7
4. Methodology for Green City Action Plans (GCAPs)
8. The Green City Action Plan (GCAP) presents the results of benchmarking and prioritisation
exercises and defines the long-term Green City vision – within a timeframe of 10-15 years – and strategic
objectives for each priority area. It focuses on the priority environmental dimensions, using relevant
indicators and time-related targets and measures for cities’ operations. The GCAP also outlines the scope
of actions, the targets set and the major actions developed, and the initial steps of implementing the Plan
for a period of 1-3 years. It is an overarching strategic document which contains the guiding principles
offering orientation for cities’ decision-making and the administration’s implementation work in the mid-
term, i.e. within 3-5 years.
9. The overall timeline for developing the GCAP is 12-24 months for the introductory period (first
GCAP cycle), and 12-18 months for the following regular periods. Implementation of GCAP cycles is on a
continuous basis, i.e. individual steps are partly implemented overlapping with other steps. Its four main
stages/steps are:
Green City Baseline (6 months for the introductory period, then 1-3 months when
revisited): aims to inform policy and strategic decision-making at the start of the process (or the
review phase for advanced local governments) and provide the reference scenario for the
business-as-usual against the Green City approach and action. The prioritisation of green city
challenges is included in this step.
Green City Action Plan (6 months for the introductory period, then 3 months): aims to
compile and present the agreed development vision and objectives for a period of 10-15 years,
the priorities to work upon in a period of 3-5 years, and the scope of actions and targets for
priority programmes and actions proposed. The prioritisation of green city actions is included in
this step.
Green City Implementation (12-36 months): aims to operationalise and implement the Green
City Action Plan, break it down into concrete tasks, allocate budget, time and staff, and monitor
the contribution of each measure to the objectives and targets established in the GCAP. This
stage will also link to provisions made in municipal budgets, and formally establish the reference
base for mayors, councillors, and administrative decision makers with regard to further
development & investment decisions.
Green City Reporting (3 months): aims to analyse the successes and failures of the
implementation period, provide the basis for taking further political decisions and inform city
officials, stakeholders and the public on what the city has done and achieved.

8
SECTION 1 – URBAN ENVIRONMENTAL ACTIVITIES IN THE WORLD
1.1. EBRD’s strategic orientations
10. The European Bank for Reconstruction and Development (EBRD) is a multilateral
development investment bank founded in 1991. It aims to promote market economies in 30 countries from
central Europe to central Asia. The Agreement Establishing the EBRD also states that the Bank is
committed to promoting “environmentally sound and sustainable development”. Over the past few years,
environmental objectives have gained critical importance in the Bank’s strategies and operations. The
Green Economy Transition approach (GET), the Municipal and Environmental Infrastructure (MEI) Sector
Strategy and the Environmental and Social Policy (ESP) are main vectors of environmental promotion in
this regard. Economic Inclusion and Gender Equality are also two major objectives of the Bank. Although
they do not support environmental objectives directly, they are closely related to the GET, MEI Sector
Strategy and ESP (Table 1).
Table 1. EBRD's strategic orientations
Name of Strategy Description
Green Economy Transition (GET)
The Green Economy Transition (GET) approach aims to scale up green finance to achieve
EUR 4 billion per year by 2020, or about 40% of total Bank annual business volume, up from the current target of 25. The increase in green financing will be achieved by scaling up current activities in sustainable energy and resource finance such as the EBRD’s Sustainable Energy Finance Facilities (SEFF) programme. In parallel, the Bank will support governments at different levels (national and local) to introduce improved legislation, regulations and investment planning to ensure maximum impact. The Bank is working to integrate the Green Economy Transition approach into its Transition Impact Monitoring System (TIMS). TIMS is used by the Country Sector Economics team to assess the transition impact of every project as part of the process of choosing, preparing and appraising projects. While the tool has been used in the past to promote market-based transitions, it is now incorporating other evaluation dimensions such as reduction in greenhouse gas emissions.
Municipal and Environmental Infrastructure (MEI) Sector Strategy
The objective of the Municipal and Environmental Infrastructure (MEI) Sector Strategy is
to achieve the sustainable delivery of essential services, notably in water wastewater, public transport, urban roads and lighting, solid waste management, district heating and energy efficiency, throughout the EBRD region. To reach this goal, the core themes of the Bank’s actions are: decentralisation, commercialisation, and environmental improvement. The Municipal and Environmental Infrastructure Sector Strategy will be a core instrument to ensure the Green Economy Transition, considering cities’ impacts on the local and global
environments.
Environmental and Social Policy
Through the Environmental and Social Policy, the EBRD is committed to promoting
“environmentally sound and sustainable development” in the full range of its investment and technical co-operation activities. All projects financed by the EBRD shall be structured to meet the requirements of this Policy, and meet a set of specific Performance Requirements
(PRs).
Economic Inclusion
EBRD is promoting Economic Inclusion in view of growing youth unemployment, low
participation of women in the workforce – especially in southern and eastern Mediterranean (SEMED) countries – and the stark differences in economic performance between regions, particularly in south-eastern Europe (SEE). For these reasons, the EBRD has extended its transition methodology to incorporate economic inclusion into its assessment of structural transition gaps. Examples of EBRD projects that promote economic inclusion include credit lines for women entrepreneurs; retail developments that help young people gain skills and

9
find jobs; and investments that facilitate access to safe drinking water for rural communities.
Strategy for the Promotion of Gender Equality
The Strategy for the Promotion of Gender Equality aims to increase women’s economic
empowerment and equality of opportunities in the countries where the EBRD invests, as an important contributor to well-functioning market economies and inclusive societies – a core component of sustainable and equitable transition. The Strategy focuses on three specific objectives: i) To increase access to finance and business support for women-led businesses; ii) To increase access to employment opportunities and skills for women; and iii) To improve equitable access to services for women. These will be achieved by: enhancing the EBRD’s performance through increasing operations and improving delivery, with the aim of mainstreaming gender equality into EBRD operations by 2020; and by contributing to the creation of an enabling environment that can address the constraints which gender inequality places on transition.
Local climate initiatives
EBRD is supporting local climate initiatives. The EBRD launched an assignment supporting
the Municipality of Gaziantep in Turkey to update its Climate Change Action Plan (GCCAP). It is the first local action plan of such kind that the EBRD provided support for; the project is completed and the CCAP was published.
Source: EBRD's website and strategic documents
11. Cities are sources of important environmental impacts, such as air pollution and pressure on
water resources, and are also often vulnerable to climate change induced disasters. Such urban
environmental issues are particularly acute in EBRD’s Countries of Operations (COOs), and reinforced by
patterns of urbanisation. In this regard, a “Green Cities” approach seems critical to translate EBRD’s
environmental agenda at the local level. This section will review the main urban environmental activities in
the world as a starting point of a Green Cities methodological development.
1.2. Existing environmental activities in cities in the world
12. The promotion of environmental activities in cities has become a core activity of many
stakeholders. This report reviewed major initiatives recently undertaken by different actors. The review
considered the following aspects:
Type of organisation: international organisations, NGOs, development partners, national and
local governments, private sector, research centres and local communities.
Type of activity (e.g. study, action plan, or infrastructure project). While some organisations only
focus on one aspect, many organisations and governments address all the steps of green city
actions (from study to implementation).
Targeted sector (e.g. what type of infrastructure). While many institutions take a comprehensive
approach, there is a substantial diversity in terms of sectors targeted by each initiative.
13. The results are listed in Annex 1. Key observations from the reviews and lessons for EBRD are
listed in Table 2 below.
Table 2. Main lessons from urban environmental activities in the world
Observation Lessons
More decentralised actions. The promotion of environmental
activities in cities is increasingly undertaken directly with and by local governments, in line with the growing recognition of the critical role they play in shaping the economy. In parallel, local capacity-building programmes for environmental actions are part of many initiatives listed in Annex 1.
This reinforces the importance of EBRD’s MEI,, which adopted decentralisation and environmental improvement as two missions, and also other EBRD’s local initiatives (GCCAP in Gaziantep, Green Cities Methodology), to realise GET’s objectives. GET recognises the importance of public

10
channels but does not develop much on city initiatives. City initiatives listed in Annex 1 can provide inspiration and best practices for EBRD when supporting national and local governments in designing local action plans, and in introducing regulations and planning reforms.
Growing attention to a comprehensive approach, but which is difficult to undertake on the ground. Although there is no
commonly adopted approach of environmental actions in cities, there is a notable evolution of the approach and understanding of urban environmental activities over time, from an emphasis on green spaces and biodiversity to an emphasis on every sector that affects the urban environment. This comprehensive approach has a broad scope, covering issues from urban utility systems (transport, energy, solid waste, water etc.), for example, to the impacts of the environment on cities (i.e. disaster risk resilience). In addition, there is a growing attempt to link environmental activities with economic and social objectives (e.g. inclusiveness) and understand green / sustainable cities as a system. The necessity to adopt a comprehensive approach to green / sustainable cities has created gaps between the scope of studies – which tend to be wide – and the scope of investment projects – which tend to be specific to some urban sectors (e.g. transport, energy…).
EBRD’s Environmental and Social Policy integrates many environmental dimensions but does not always recognise all the aspects that can relate to green cities. GET is more comprehensive in this regard. The gap between the scope of studies and projects on the ground shows the importance of the GET as a comprehensive strategy to be translated into investment. This first observation also reflects well the connections between some of EBRD’s strategic orientations, in particular the importance of MEI and its various components to achieve GET, but also the fact that green cities can also support EBRD’s Economic Inclusion Strategy and Gender Equality to some extent (e.g. access to public transport).
The broad scope and lack of uniformity of approaches is reflected
in the numerous terminologies used by environmental activities: green cities, sustainable cities, resilient cities, urban green growth are examples of major initiatives that place environmental performance of cities as a core objective, but often with different scope or conceptual approaches;
The green cities methodology needs to adopt a clear definition identifying objectives, and a clear conceptual framework.
The need for indicators: the complexity and broad scope of green
cities (or sustainable cities) associated with a recognition of the necessity to adopt a comprehensive approach has generated interest in developing indicators as concrete tools of diagnostic and basis for action. As explained in Annex 3 and section 3.3 however, existing indicators vary substantially and there is a lack of clarity on what indicators should be considered as green city indicators. This illustrates the diversity of urban environmental approaches, as mentioned earlier in this Table.
Further work on green cities indicator is necessary and should be integrated with a clear green city definition and action plan methodology.
Growing recognition that governance systems have a substantial impact on the feasibility of city-based green actions
(OECD, 2013). Many activities have acknowledged the necessity to integrate issues such as co-ordination between the national, regional and local governments, metropolitan governance, involvement of communities and private sector, for instance, to green cities. In particular, the role of national governments to create enabling environments cannot be overstated. Finance has also gained high attention worldwide as a lever to enable cities to become green. This includes cities’ financial capacity generally speaking but also more targeted means to promote green cities, at the international (official development finance) national (e.g. fossil fuel (dis)incentives) and local levels (e.g. tariff and fees in transport, water, solid waste, energy). Attracting private investment in green city sectors (e.g. Public-Private-Partnership) is also critical in many initiatives.
Support for institutional reforms to achieve transition is needed at both the national and local level, as expressed in the GET. Likewise, attention should be paid to cities’ financial capacities and financial instruments to promote green cities in the green city action planning. Municipal finance are already seen as incremental activities in the GET, and issues of tariffs and fees and cost recovery are mentioned in the MEI. This observation also supports EBRD’s strategies to unlock green finance for cities and to support cities’ green action plans at different levels of government.

11
Stakeholder engagement is also one of the objectives of the MEI, and could support the Gender Equality Strategy.
Growing involvement of the private sector in enhancing cities’ environmental performance. Such involvement has taken different
forms. The most common type of activity is the development and management of urban utilities (energy, buildings, transport and water). Other activities include consulting services for green cities, and corporate social responsibility (although the latter is not specific to cities). There is also a growing recognition of the concept of sustainable / green cities as a whole (e.g. Siemens), although this is still not well translated into multi-sectoral investment. The growth of the market for smart city services
1 mainly developed and offered by
multinational companies such as Siemens, Cisco, and IBM, and traditional utility companies is a critical trend. Some of these tools may positively impact cities’ environmental performance This is promising thanks to the dramatic increase in the global market, the rise in national and local governments’ interest in these technological solutions, and their potential impact on city greening and economic benefits (especially considering the speed of change of digital technologies/ICT).
This shows the importance of involving private stakeholders in green city planning processes, and the need to tap on the opportunities offered by the private sector in terms of utility management. In other words, this illustrates some potential benefits of promoting market development for green cities. Involvement of the private sector is expressed in the GET but there is no mention of urban technologies. MEI emphasises the need for PPP in water, wastewater, transport, district heating and solid waste. Privatisation and outsourcing are also mentioned in the MEI. The private sector can also be an important vector to raise citizens’ awareness on green cities.
Civil society organisations (CSOs) and local non-government organisations (NGOs) have also undertaken environmental
initiatives, mainly support for solid waste collection and treatment, urban farming, tree planting and volunteering for public space cleaning. It is difficult to track these initiatives as they are small in
scope and do not have much visibility. Many existing activities show growing acknowledgement of municipalities of the necessity to involve local communities in green policymaking and implementation, or to support existing green community practices. Many successful examples result of a collaboration between the city authorities and the communities (for instance, the municipality creates regulations to allow urban farming to take place in more areas like rooftops).
Municipalities should ensure that CSOs are engaged in the Green City Action Plan process. They can be important actors of a green city, although the impact may be hard to assess. They can also be important vectors to raise public awareness.
Source: Authors
14. The most relevant initiatives to EBRD listed in Annex 1 are as follows:
In terms of green city approach and methodology: the Inter-American Development Bank
(IADB)’s Environmental and Sustainable Cities Initiative (ESCI) provides a comprehensive
conceptual framework for sustainable cities, including benchmarking and prioritisation. It is
broader than the scope of green cities but the methodology is nonetheless useful (see next section
for more details). The Asian Development Bank (ADB)’s Green City Development Toolkit and
the Cities Development Initiative for Asia (CDIA)’s Toolkit for Infrastructure Prioritisation also
provide interesting methodological approaches in terms of green city prioritisation processes (see
next sections for more details).
1 The concept of smart city (also known as or similar to other concepts such as “digital city”, “intelligent city”
or “knowledge-based city”) has often been used in different and inconsistent ways, resulting in some
confusion about its added value. A common understanding, as articulated in recent studies of the OECD
Green Cities Programme (Green Growth in Bandung, Indonesia, forthcoming), is that smart cities use
Information and Communication Technologies (ICT), or digital technologies, to make the critical
infrastructure components and services of a city more interconnected and efficient. There are many
applications and potential objectives of using such digital technologies, and not only to improve cities’
environmental performance.

12
In terms of networking / potential synergies on the ground (for any future application of the
green cities methodology): the Rockefeller Foundation’s 100 Resilient Cities (disaster risk
resilience), the Covenant of Mayors (energy and climate change), C40 Cities (climate change)
ICLEI (urban sustainability in general) and the World Bank’s Europe and Central Asia (ECA)’s
Sustainable Cities Initiatives (SCI) are influent organisations with wide network, including in
some parts of EBRD’s Countries of Operations. Some of them undertake technical assistance on
the ground in this region – in particular World Bank’s SCI – and EBRD could build partnerships
or tap on existing projects to ensure higher impact. The TRACE pilot in Gaziantep, Turkey, is an
example of synergy.
In terms of green city policy best practices: OECD’s Green Cities Programme, ADB’s Green
Cities (2012), World Bank’s Eco2Cities, World Wild Fund’s Sustainable cities database and
some individual city initiatives could be sources of inspiration for green city policy best practices
that EBRD could use when assisting cities to develop their green city plans. Some private sector
and CSO’s initiatives listed in Annex 1 could also be sources of inspiration if relevant to a city’s
needs.
1.3. Review of environmental activities in Tbilisi and Yerevan
15. EBRD has identified the cities of Tbilisi, Georgia, and Yerevan, Armenia, as potential pilot cities
for the Green Cities Approach and Methodology developed in this report. In this regard, this section
reviews the main environmental activities undertaken by IFIs, NGOs and governments in the recent years
in these two cities. The list of activities for each city is provided in Annex 2.
Tbilisi, Georgia
16. From 2008 up to now, a range of projects supporting green / sustainable city objectives has ben
undertaken in Tbilisi, Georgia. The most critical ones are the City Development Strategy (CDS) 2030 and
the 2011-2020 Sustainable Energy Action Plan (SEAP). In these two projects, but also other activities, the
municipality has received the support of the following international organisations:
The World Bank (through Cities Alliance), UNDP and the German Technical Co-operation
Agency (GTZ) have assisted the municipality of Tbilisi in designing the CDS 2030.
The Covenant of Mayors has supported the municipality of Tbilisi in designing the 2011-2020
SEAP;
ADB has completed the Tbilisi Sustainable Urban transport (SUT) Strategy (study) in 2015 and
deisgned a tender for a pre-feasibility study on Bus Rapid Transit (BRT) in 2010. However, there
is no information available online to confirm/infirm that an interest for express for this tender;
GIZ’s has completed the report “Prospects for an Establishment of an Energy Agency in Tbilisi”
in 2011;
UNEP has been leading the Geo-Tbilisi project since 2011, a capacity-building programme to
assist policymakers to tackle environmental issues;
The World Bank’s Europe and Central Asia Programme has completed a study on energy
efficiency in 2011. In 2015, the Bank also published the report Georgia Environmental
Sustainability Analysis for the whole country.

13
17. The City Development Strategy 2030 and the 2011-2020 SEAP are the two most comprehensive
activities related to green cities that have been undertaken in Tbilisi recently. These two projects can be
qualified of development / action plans. The CDS is broader in scope and includes aspects of economic
development and governance. There is a “green city” objective in the CDS 2030, but it is only aiming to
increase the green space areas. The contents of the SEAP are in this regard closer to the green city
definition and approach given in this report. Most of the other projects have been studies, except UNEP’s
Geo-Tbilisi capacity-building programme, and the Tbilisi Sea Eco-Green City, and have rather focused on
specific urban sectors. Overall, activities (except CDS 2030) have placed the greatest emphasis on energy
and transport, due to air pollution issues, high private transport modal share, inefficient public transport
system, climate change commitments and low energy efficiency in buildings. However, river pollution,
poor wastewater and sewerage treatment system, and risk of natural disasters (landslides, earthquakes)
have been reported in the CDS and the SEAP, Water sanitation and disaster risk reduction should therefore
receive more attention in terms of studies and infrastructure development projects. It would be interesting,
in this regard, to update knowledge of the green city challenges of Tbilisi (the data given in the CDS and
SEAP tend to be old, before 2010) and prioritise issues thoroughly. The SEAP would be a solid basis to do
this work.
Yerevan, Armenia
18. From 2010 up to now, Yerevan, Armenia, has also benefitted from a range of projects related to
green / sustainable cities, supported by the following international organisations:
The Covenant of Mayors and the Foundation to Save Energy has been supporting the
municipality of Yerevan in developing a Sustainable Energy Action Plan (SEAP).
UNDP has been particularly active in Yerevan. It is collaborating with the municipality within
the framework of a project on energy efficiency in buildings (thermal refurbishment), of a project
to clean contaminated sites (with GEF), and of a project on green urban lighting (also with GEF).
UNDP also conducted a Strategic Environmental Assessment (SEA) of Yerevan’s Master Plan in
2005.
ADB has undertaken a Sustainable Urban Investment project and a Sustainable Urban Transport
project in 12 Armenian cities including Yerevan. However both projects have focused on road
improvement.
Additionally, USAID (through the Alliance for Energy) has completed two studies on i) energy
efficiency and renewable energy, and ii) heating policy, in Armenia.
19. Contrary to Tbilisi, there seems to be a lack of comprehensive studies, development and action
plans about the environmental issues in the city. The SEAP, if similar in scope to Tbilisi’s SEAP, should
comprehensively tackle green city challenges, but it is still in development and cannot be consulted. There
is no other remarkable study at the local level. The most promising infrastructure projects are the energy
efficiency and urban lighting projects undertaken with UNDP and GEF. Sustainable transport seems absent
of infrastructure projects: while ADB is involved in the transport sector in Yerevan, the current projects
seem only to address road quality and quantity. Sustainable transport could be a potential area of
investment. At this stage, it may be helpful to wait for the release of the SEAP or ask access to it to get
updated data on green city challenges.

14
SECTION 2 – DEFINITION OF A GREEN CITY
2.1. Definition of a green city and approach for EBRD
20. There is no universally accepted definition for what a green city is, or universally observed
practical approach to it. As shown in Annex 1 and Table 1, many stakeholders have contributed to
environmental activities in cities but often through different angles, for instance by working on specific
urban sectors, or by adopting a broader approach of urban sustainability where economic, social and
financial sustainability are primary parameters on equal footing as environmental indicators. As a result,
there is a lack of consensus and clarity on what could be defined as a green city.
21. This report proposes a definition of a green city emphasising the environmental performance of
such a city. Social and economic performance are therefore not the primary target – although they also
constitute important characteristics of a green city and will be useful to consider in priority setting,
monitoring and evaluation of green city activities and services (cf. next sections for more details).
A Green City is a city which shows high environmental performance relative to established
benchmarks in terms of i) quality of environmental assets (air, water, land/soil and biodiversity),
ii) efficient use of resources (water, energy, land and materials) and iii) mitigating, and adapting
to, risks deriving from climate change, while maximising the economic and social co-benefits and
considering its context (population size, socio-economic structure and geographical and climate
characteristics).
22. It is important to give clear distinction to a green city from the following existing concepts,
although partly overlapping:
Sustainable city: this concept is broader in scope and includes objectives of economic growth
and social equity and justice as primary parameters alongside environmental performance. It is
also more ambitious and applying a concrete methodology may be more challenging.
Smart city (also known as or similar to other concepts such as “digital city”, “intelligent city” or
“knowledge-based city”): this concept has often been used in different and inconsistent ways,
resulting in some confusion about its added value. A common understanding, as articulated in
recent studies of the OECD Green Cities Programme (Green Growth in Bandung, Indonesia,
forthcoming), is that smart cities use Information and Communication Technologies (ICT), or
digital technologies, to make the critical infrastructure components and services of a city more
interconnected and efficient. There are many applications and potential objectives of using such
digital technologies, and not only to improve cities’ environmental performance. In other words,
smart city tools can be a means to support green cities.
Resilient city: the basic idea behind the concept is that resilient cities are prepared for and able to
withstand shocks of different natures (environmental, economic, political, social etc.). The
concept is still vague and lacks a practical definition. One of the most concrete aspects of this
approach is resilience to natural disaster risks, which is a sub-set of the above green city
definition and the approach below.

15
23. In addition, this report proposes a definition of a Green City Approach. While a green city is
defined as a “state”, or level, of environmental performance, it is also useful to have a common
understanding of “actions” that are relevant to maintain/enhance the environmental performance. There are
indeed a range of actions to address cities’ environmental problems, with some more relevant to EBRD’s
Green Economy Transition mandate, its Municipal Environmental and Infrastructure Strategy, and cities’
policymaking responsibilities:
A Green City Approach is an integrated, multi-sector process whereby a city’s environmental
challenges are periodically identified, prioritised and addressed through targeted investments
and services, regulations and other relevant policy instruments with the aim to enhance the city’s
environmental performance in a cost-efficient and financially sustainable manner, while at the
same time seeking to maximise the economic and social co-benefits .
2.2. Environmental, economic and social objectives of a green city
24. The proposed Green City definition and approach considers three environmental dimensions to
be addressed in priority: i) quality of environmental assets; ii) efficient use of resources, and iii) climate
change risks. This can be translated into more targeted objectives as listed in Table 3 below.
Table 3. Green cities' environmental dimensions
General environmental dimension Targeted environmental dimension
Quality of environmental assets
Air quality
Water quality
Land/Soil quality
Stock of resources
Water resources availability
Green space availability
Biodiversity and ecosystems
Climate change risks Mitigation (greenhouse gas emissions)
Adaptation (resilience to climate change risks)
Source: Authors
25. The proposed definition also includes economic and social dimensions linked to the
environmental dimensions which should be taken into account to fully grasp the ins and outs of a green
city. The main economic and social dimensions and objectives relevant to a green city are listed in Table 4.
As outlined in the definition of a Green City Approach, actions to enhance a city’s environmental
performance should also seek to maximise economic and social co-benefits. These links between economic,
social and environmental objectives will provide additional motives for city leaders to undertake green city
actions. For instance, a green city activity which can generate substantial employment co-benefits can
easily be justified and prioritised compared with other green city activities with less positive economic
impact. Also, providing access to clean and efficient water, energy and solid waste collection services to all
urban residents (including in slums) will not only enhance cities’ environmental performance but also meet
social objectives. Conversely, an urban population with high environmental awareness will be more likely
to use sustainable infrastructure systems (public transport, use of separation garbage) and encourage
elected governments to adopt a green city agenda.

16
Table 4. Green cities' economic and social dimensions and objectives
Economic and social dimensions
Examples of economic and social dimensions that green city actions contribute to improving
Economic Economic growth and employment
Development of green city sectors contributes to GDP output and employment (see Table 6 for a list of sectors and specific activities)
Innovation in green city sectors contributes to GDP output
Economic resilience
Resilience to the impacts of climate change improves economic resilience
Revenue and expenditure
Green infrastructure and services provision, financial incentives, charges and taxes to promote green cities generate expenditures and revenues for a municipality
Social Public health Improvements in water and air quality reduce public health issues
Access to urban services (indirectly: poverty, equality)
Enhancement of the efficiency and coverage of water supply infrastructure/network increases access of such services for the urban population and may participate in poverty and inequality reduction efforts
Enhancement of the efficiency and coverage of low-emission (in terms of air pollutants and GHG) electricity and heat supply network increases access of such services for the urban population and may participate in poverty and inequality reduction efforts
Enhancement of the efficiency and coverage of sustainable modes of transport (low-emission public and private transport, cycling, walking) increases access of such services for the urban population and may participate in poverty and inequality reduction efforts
Enhancement of the efficiency and coverage solid waste collection system increases access of such services for the urban population and may participate in poverty and inequality reduction efforts
Enhancement of the efficiency and coverage of safe and energy-efficient housing increases access of such services for the urban population and may participate in poverty and inequality reduction efforts
Affordable basic services for all the urban population may participate in poverty and inequality reduction efforts
Enhancement of the quantity of green spaces increases access of such services for all the urban population and generate well-being
Behaviour and awareness
“Green” behaviours increase the use of existing sustainable urban utility systems (transport, solid waste recycling systems)
High public awareness on natural disaster risk enhances the civil society’s preparedness to such events
Citizens with “green” behaviours are more likely to preserve habitats and ecosystems
“Green” behaviours result in lower consumption of water and energy resources
Citizen engagement
Involving citizens in green city planning processes helps to achieve public participation objectives and buy-in of the population
Community involvement in green city actions (e.g. solid waste, nature conservation) can be an effective implementation means and provide social benefits
Social resilience Tackling the vulnerability of poor communities to natural disaster risk can have high benefits on a city’s resilience and avoid further urban inequalities

17
Gender equality Enhancement of the safety and accessibility of public transport participates in promoting gender equality
Source: Authors
2.3. Key economic activities and services to be addressed under a Green City Approach, and
relevance to EBRD’s mandate
26. A Green City Approach requires identifying, prioritising and addressing a city’s environmental
challenges through targeted investment and services and other relevant policy instruments (regulations,
etc.). In this regard, there is a wide range of urban economic activities and services that can be targeted to
address urban environmental challenges. Table 5 builds on the targeted environmental dimensions listed in
Table 1 by identifying sources of pressure on urban environmental performance and their relevant sector.
Table 6 expands this approach and provides a more specific list of economic activities and services
categorised by the following seven sectors identified in Table 5: transport (public transport, fuel efficiency,
traffic and parking management), buildings (energy efficiency [EE] in buildings), industries (energy
efficiency [EE] in industry), energy (energy supply, renewable energy [RE])2, water (water supply,
wastewater, efficiency of water use, and drainage), solid waste (collection, treatment), and land-use. The
same table also identifies responses to each economic activity and service factor that are relevant to cities
or EBRD.
Table 5. Key environmental dimensions and related economic activities and policies to be addressed under a Green City Approach (by targeted environmental objective)
General environmental dimension
Targeted environmental dimension
Source of pressure Sector
Quality of environmental assets
Air quality
Pollution from urban transport Transport
Pollution from electricity and heat generation
Energy (RE)
Industries (EE)
Buildings (EE)
Pollution from industrial processes Industries
Pollution from solid waste incineration Solid Waste
Water quality
Pollution from wastewater discharge from energy generation, industrial, residential and commercial activities
Industries Buildings
Pollution from solid waste dumping in water bodies Solid waste
(Low) quality of drinking water pre-treatment and wastewater treatment
Water
Land/Soil quality Pollution from wastewater discharge Water
Pollution from solid waste dumping Solid waste
Stock of resources
Water availability
Water consumption in industries, buildings and energy generation activities
Industries Buildings Water
(In)efficiency and low coverage of water supply networks
Water
2 In this report and in Annex 5 on green city indicators, the energy sector will be defined only under the
aspects of energy provision (electricity, heating) and renewable energy (RE). Energy efficiency (EE) will
be considered separately in the building and industry sectors.

18
Green space availability
Loss of green spaces Land-use
Biodiversity and ecosystems
3
Air, water and soil pollution (see above)
Transport Energy Industries Buildings
Water
Solid Waste
Land-use
Depletion of water and green space resources Water Land-use
Climate change risks
Mitigation (greenhouse gas emissions)
GHG emissions from urban transport Transport
GHG emissions from electricity and heat generation
Energy (RE)
Industries (EE)
Buildings (EE)
GHG emissions from industrial processes Industries
Methane emissions from landfill Solid waste
Lack of green space Land-use
Adaptation (resilience to climate change risks)
Lack of green space/infrastructure Land-use
Lack of drainage and polder infrastructure Water
Resilience of urban service networks Transport Energy Water
Uncollected solid waste (health hazard) Solid waste
Source: Authors
Table 6. Key environmental challenges and related economic activities and services to be addressed under a Green City Approach (by sector)
Sector (from Table 5)
Source of pressure (from Table 5)
Examples of EBRD or city responses
Transport
Pollution from transport (use of fossil fuels, energy efficiency, choice of transport, congestion)
Resilience of transport systems
Fuel Switching
Vehicle Energy Efficiency
Public and Non-Motorised Transport
Electric, hybrid, LPG, CNG vehicles
Transport Tariff
Traffic and Parking Management
Emergency Transport Management
Buildings Pollution from electricity and heat
consumption in industries (energy efficiency)
Building Energy Efficiency
Metering technologies
Energy Tariff and Billing
Industries Pollution from industrial processes
Pollution from electricity and heat
Industrial Energy Efficiency
Energy Tariff and Billing
3 Table 5 illustrates the peculiar relationship of biodiversity and ecosystems with the other environmental
dimensions. It is not a sectoral dimension but rather a cross-cutting, overarching dimension affected by all
the others (i.e. biodiversity is affected by air and water pollution)

19
consumption in industries (energy efficiency)
Solid waste generation in industries
Discharge of wastewater from industries
Metering technologies
Industrial Material Recycling
Industrial Material Reuse
Industrial Material Efficiency technologies
Water efficiency and reuse / recycle technologies in industries
Energy
Provision of energy (electricity, heating)
Pollution from electricity and heat consumption in industries (i.e. use of fossil fuels / renewable energy for electricity and heat provision)
Resilience of electricity networks
Renewable Energy
Energy tariff and billing
Provision of electricity and heat; efficiency and resilience of supply networks
Street lighting
Access to cleaner energy sources
Water
Water consumption in households
(In)efficiency of water supply networks Discharge of wastewater (residential and commercial activities)
Drinking water pre-treatment
Low resilience to natural disasters (lack of drainage and polder infrastructure, resilience of water supply networks)
Reduction in water supply losses
Water supply coverage, continuity and resilience of network
Drinking water pre-treatment
Wastewater Treatment
Drinking Water and wastewater treatment technologies
Water supply, wastewater treatment and sewerage tariff and billing
Water efficiency and reuse technologies (energy generation, buildings)
Drainage and polder systems
Metering technologies
Solid Waste
Solid waste generation
Uncollected solid waste Solid waste treatment (incineration
of solid waste, landfill overcapacity etc.)
Methane emissions from landfills
Solid waste collection (including hazardous waste)
Material Recycling
Material Reuse
Waste to Energy
MSW Methane Reduction
Solid waste collection and treatment tariff and billing
Land-Use
Lack of green spaces / infrastructure Compactness
Integration with other sectors (transport, energy etc.)
Green space and infrastructure preservation/provision
Urban density
Transit Oriented Development
Source: Authors
2.4. The Pressure-State-Response approach: conceptualising the causal linkages between green city
components
27. The causal linkages elaborated above support the need to adopt a Pressure-State-Response
(PSR) approach to conceptualise green cities. The PSR approach was developed by the OECD in the
1990s and re-used in the OECD’s Green Growth in Cities (2013). Human activities exert pressures on the
environment (cf. Table 4 and 5), and change its state in terms of its quality and its stocks of resources (cf.
Table 2). Society responds to these changes through general environmental, economic and sectoral policies,
and through changes in behaviour, thus affecting the pressures caused by human activities. The original

20
PSR framework is adapted to the city level and made coherent with the green city definition as well as the
environmental dimensions and sources of pressure conceptualised in section 3.2. Figure 1 presents the
Green City Pressure-State-Response framework. The Green City PSR framework will be critical to
organise indicators and develop a green city action prioritisation methodology (cf. section 3.3).
Figure 1. Green city Pressure-State-Response framework
Source: Adapted from OECD (1994), Environmental Indicators, OECD Core Set

21
SECTION 3 - GREEN CITY STRATEGIC PLANNING INSTRUMENTS (BENCHMARKING
AND PRIORITISATION)
3.1. Review of existing international best practices on green city strategic planning instruments
(indicators, benchmarking and prioritisation)
28. There is little consensus on which urban environmental measures and implementation methods
cities should employ for green city development. Many studies have attempted to conceptualise green city
or sustainable city models and elaborate on how to translate them into action at the city level by analysing
green city / sustainable city indicators, policy instruments and action planning. This report reviewed
existing studies and research on indicators and action planning. The results are listed in Annexes 3 (review
of green city indicators) and 4 (review of green city actions benchmarking and prioritising).
Green city indicators: the need for a conceptual framework
29. Annex 3 reviews the literature on green city indicators. There are several key observations from
the results. A general overview of indicators’ characteristics is below:
The comprehensive character of environmental activities (in particular studies) and the lack of
uniformity of approaches to promote green / sustainable cities, as mentioned in the previous
section, are reflected in the heterogeneity of existing indicators. This is easily observable from
Annex 3. While some studies have only included a few indicators which are purely
environmental (e.g. air quality, pollution of the environment), others have included a broader
range of indicators covering topics other than the environmental performance of cities. The
OECD’s work promotes the green growth concept, with indicators focusing on economic growth
and some social considerations. The IADB uses a sustainable city concept and employs one of
the most comprehensive sets of indicators which include governance indicators. ISO 3721 also
employs a broad range of indicators (e.g. economy, education, environment, governance, urban
planning…)
Another factor of heterogeneity is the inclusion (or not) and the inconsistent use of
indicators referring to the response (i.e. policies, investment, behaviour) of municipalities.;
For example, Siemens’ Green City Index includes indicators on the presence of environmental
master plans. IADB’s ESCI also included some response indicators (e.g. disaster risk master plan,
early warning systems) but only sporadically. The OECD, taking a different approach, did not
include indicators on policies. Instead, OECD green city indicators refer to the quality and
availability of environmental assets and their causes from the performance of urban infrastructure
and the economy. Specific policy response are not measured but rather analysed in depth and
recommended in each relevant sector for green growth.
In this regard, a review of existing indicators suggests the need for a conceptual framework
guiding indicator selection and use for green city action planning processes. Such conceptual
framework should be linked to a clear green city definition and make sense of causal linkages
between indicators, which is rarely the case in existing activities. In Section 3.2, this report
proposed the Pressure-State-Response (PSR) framework as a green city diagnostic tool.

22
There is a general lack of baseline/benchmark. This is due in part to the complexity of
conceptualising green / sustainable cities (which may imply a large number of indicators) and the
lack of established standards. Likewise, there are few attempts to track the evolution and progress
of cities’ environmental performance over time. IADB’s ESCI’s benchmark effort is the most
comprehensive of existing studies. OECD has tried to come up with indicators which are
internationally comparable (using Functional Urban Areas4), although the data availability is an
obstacle to develop such a methodology.
There is a lack of standard means of displaying results. Some indexes have attempted to
visualise the results in a performance “web” (Siemens), others have adopted a traffic light
approach (IADB); others have not applied any scoring methodology (OECD, ADB).
Overall, the most recommendable pieces of work on indicators are ISO 37120, IADB’s ESCI,
OECD Green Cities Programme, and Siemens Green City Index.
IADB’s ESCI provides a complete benchmarking and prioritisation approach
30. The study identified four international practices for green city action prioritisation (including
initiatives which covers broader policy areas): the Asian Development Bank’s Green City Development
Toolkit; the Inter-American Development Bank’s Environmental and Sustainable Cities Initiatives
(ESCI), the Clean Development Initiative for Asian Cities’ City Infrastructure Investment
Programming and Prioritisation Toolkit and the Centre for Low Carbon Futures (CLCF)’s
Economics of Low Carbon Cities Series. These three approaches are summarised in Annex 4. Only IADB
makes a thorough use of indicators as a support within a broader framework of prioritising action. In
addition, it is the only study which has developed a benchmarking methodology embedded in a complete
prioritisation process. The main lessons are:
IADB’s ESCI is the most complete methodology for benchmarking and prioritisation, thanks to a
scientific and thorough use of indicators and also the application of five filters (the traffic light
scoring of indicators, public opinion, climate change, economic impact, and multi-sectorality). It
links the indicator section to the planning process more clearly than ADB’s Green City
Development Toolkit, for instance. Indicators are part of a wider green city action process which
includes in order: preparation (e.g. form work teams), analysis and diagnostics (i.e. the traffic
light exercise), prioritisation (integrating variables such as economic cost), and formulating the
action plan. It could serve as a basis for a green city action benchmarking and prioritisation for
our purpose, although their indicators are not specifically focusing on green cities (they are
aiming to cover wider issues). The use of response indicators is inconsistent, however and should
be refined. Another possible caveat is that, whereas the prioritisation filters are applied to identify
problems, no methodological process is proposed to select policy options to address problems. In
other words, there is a policy gap in this methodology (the programme helps you to identify
problems but does not tell what to do). In addition, the application of filters may also need to be
simplified to make sure this can be used by city administrators;
ADB’s Green City Development Toolkit adopts an assessment matrix promoting
comprehensive approach of prioritisation by not only looking at a city’s environmental
performance in each sector of infrastructure related to green cities, but also looking at financial,
governance and implementation obstacles by sector. A traffic light methodology is recommended
4 Identification of cities as functional economic units, characterised by a densely inhabited “urban core” and
a “hinterland” whose labour market is highly integrated with the “urban core” (OECD’s Compact City
Policies, A Comparative Assessment (2012). Identification of FUAs is mostly based on commuting data.

23
to score these elements in each sector; however, the link between the choice of colour and the
indicators is unclear and is mostly left to city administrators’ appraisal. There is no indicated
benchmark for each indicator. Also, there is no additional filter (e.g. economic and social impacts,
public opinion) to further prioritise action;
Cities Development Initiative for Asia (CDIA)’s Infrastructure Prioritisation Toolkit’s
principles could also be applied to green cities. The approach is however different from ADB and
IADB in the sense that there is no assessment of needs through indicators as the initial step.
Instead, the selection of projects is made as a wish list by city administrators, and refined through
an assessment of the city’s financial capacity. This approach will not be retained here as more
thorough green city diagnostic is recommended to prioritise action.
The Centre for Low Carbon Future’s Economics of Low Carbon Cities Series has developed a
model for assessing the costs and carbon effectiveness of a wide range of the low carbon options
that could be applied at the local level in households, industry, commerce and transport. It is
more a detailed scientific study focused on CO2 emissions and cost-benefit of low carbon
measures. Replicating it for every green city sector is probably too ambitious and not practical.
31. In summary, IADB’s ESCI is a good model for green city action prioritisation. It must however
be narrowed down to specific environmental issues. Additional filters such as financing and
implementation issues – as used by ADB and CDIA – but also social impacts to build links between
EBRD’s Green Economy Transition Approach and Social strategies could be used. It must also be noted
that none of the above studies analyse green city policies on a sector by sector basis. They instead propose
a methodology to identify environmental issues and their sources, yielding an action plan. However, there
is no discussion in the same studies of what kind of policies should be undertaken to tackle each
sustainability issue. The response aspect of their framework is therefore weak or absent.
32. There are a few more practices which could be relevant for green city action benchmarking.
However these studies do not use indicators as an instrument for prioritising green city actions. The two
main specific initiatives on green city benchmarking are Siemens’ Green City Index and the European
Green Capital Award. Another noticeable initiative is City Blueprints on water management. However,
both mostly benchmark cities’ environmental performance and not green city action. There is no best
practice in benchmarking green city action. The three initiatives mentioned above are summarised also in
Annex 4. The main lessons are:
Siemens’ Green City Index (also referred to as Economic Intelligence Unit (EIU)’s Green City
Index) is the most complete benchmark for green city. Siemens also created a similar version was
created for other continents. A more meaningful approach however would be to give a score to
each city’s green sector only, and not an overall score. In addition, it is more suitable to drop the
‘response” (policy) aspects from the methodology, as it is difficult to give an objective rating.
The European Green Capital Award is less thorough and rather “ranks” cities relatively to one
another, without benchmarking based on a set of measurable indicators.
City Blueprints’ methodology is a bit more similar to Siemens’ Green City Index, but also less
thorough as there is no clear link between the indicators used and the ranking 0 to 10. The
performance web could be useful to replicate if any benchmarking on green city is to be done.
24
3.2. Proposed green city benchmarking methodology
Selecting and organising green city indicators along the Green City Pressure-State-Response framework
33. Benchmarking and prioritising green city action will require thorough instruments of assessment
and comparison in order to evaluate cities’ environmental performance and determine priorities of action.
In this regard, indicators should be central instruments for benchmarking and prioritising green city action
in the most “scientific”/objective way possible. IADB’s ESCI, which is the most advanced benchmarking
and prioritisation methodology, also makes an intense use of indicators. However, as pointed out in section
3.1 and observable in Annex 3, more work is required to establish boundaries between indicators that relate
to green cities and those which do not, and to conceptualise the causal linkages between green city
indicators.
34. The proposed green city indicators in this document deviate from IADB’s ESCI methodology in
the sense that they focus exclusively on green cities (and not sustainable cities) and are articulated along
the Pressure-State-Response (PSR) approach presented in section 3.2. The Green City indicators (and
the benchmarking and prioritisation methodology) are categorised in a PSR framework to give a sense of
the causal linkages in a green city, which is not conveyed in IADB’s work. Within the “state” and
“pressure” categories, an additional sub-classification of indicators is applied, between “core” indicators
and “elective” (or “optional”) indicators. The purpose is to limit the number of necessary indicators. As
explained below, only the “core” indicators need be taken into account in the prioritisation process. The
“elective” indicators instead provide a menu of options in the event that the “core” indicator is not
available in a given city. Core indicators are located in blue cells in Annex 5, while elective indicators are
located in white cells. In total, there are 70 indicators (114 including optional indicators). The list of
indicators is provided in Annex 5. In detail, these three categories refer to:
Pressure: this category refers to indicators measuring the sources of pressure and adverse
impacts on the environment from human activity the environmental performance of the city. It
relates to urban infrastructure (transport, energy, water supply, sanitation and drainage, solid
waste) and land-use. There are 26 core indicators (59 indicators in total);
State: this category refers to indicator that attempt to measure the state, condition or quality of
the city’s environment ‘State’ indicators also measure the stock and quality of natural resources.
The quality and availability of environmental assets, and climate change risks are the three main
‘state’ subcategories, composed of 9 core indicators (20 indicators in total);
Response indicators attempt to measure beneficial impacts of activities – actions to reduce
pollution or consumption of resources or investment in environmental protection. This category
refers to indicators measuring the aspirations, in terms of policymaking and instruments, of a city
to become green, in each of the sectors listed in the other two tables on “pressure” and “state”.
Indicators listed in Annex 5 are general in scope, due to the potentially high number of responses.
Annex 6 provides a more detailed list of possible response for each general response indicator.
This category is mostly qualitative and includes an assessment of the quality of implementation
of green city policies. It is composed of 35 indicators.

25
Criteria for indicator selection and potential indicator challenges
35. Indicators were selected assuming they respond to the following criteria: relevance to the green
city conceptual framework laid out in section 3.2, measurability, analytical validity, cost effectiveness, and
practicability (i.e. indicators are not too complex). However, the proposed indicators need to be tested on
the ground with several cities and refined if necessary. The data source will be recorded to ensure data
quality, comparability and consistency of the baseline (review). For the same reason, the source of
benchmark will also be recorded. Assessing and benchmarking a city’s green performance, and
establishing priorities through indicators will meet a range of issues related to data availability, collection
and quality. Any city undertaking to assess its green performance must bear in mind the following
obstacles:
Availability: Some detailed indicators such as the proportion of population living within 20
minutes of everyday services, may not be available in some cities (i.e. it has never been produced
by anyone / any stakeholder). The practicability of collecting the proposed indicators should
therefore be frequently assessed with tests on the ground;
Reliability: For instance, air quality measurement is often taken in only a few spots in the city,
and is not frequent. Some indicators may be difficult to measure (e.g. percentage of households at
risk). Available but unreliable indicators could be flagged by municipalities for improvement in
the next green city planning cycles;
Scale: If covering only the core city of a metropolitan area, some indicators may be misleading
and do not reflect the environmental performance or urban pressure on the environment (e.g. the
quantity of green spaces may be low within urban centres but be compensated by large forests
right outside city limits).
Ownership: The previous point raises the issue of ownership: collecting and gathering data will
require contacting a range of agencies (national and local government, state or provincial
government, private utility firms…). This may also create obstacles to harmonise the scale of
indicators (e.g. indicators are produced by different agencies and stakeholders working which
operate sometimes on territories of different sizes). The main likely sources of indicators are:
statistical yearbooks; academic studies, private utilities, national government agencies.
Comparability (if two or more cities’ green performance are compared): comparing some
indicators such as water consumption per capita or renewable energy supply as a share of total
energy consumption may be misleading if comparing cities with very different geographical and
climate context. The proposed methodology should be restrained to comparing cities with similar
characteristics as much as possible.
36. The proposed indicators tables in Annex 5 also include complementary information located in
three extra columns on the right, in particular:
A “trend” column informing about the evolution of the value for each indicator over the past 5
to 10 years. This should be useful in order to understand dynamics of green cities over time and
the evolution of the city’s performance. Concretely, the information provided will be used to
further prioritise green city challenges, if necessary (see Section 3.3 for more details).
Indicators informing on the sources of environmental degradation identified in the “state”
indicator table. These should be particularly useful to understand the links between the

26
environmental issues in the “state” table and which “pressure factors” exert the most influence on
them.
37. The projected timeframe for the collection of the green city PSR indicators is 4 months for the
first green city action plan cycle (12-24 months). The first data collection process is more demanding due
to need to organise the workforce, locate the necessary data or produce it out of other statistical knowledge.
The indicator collection process in the following green city action plan cycles will draw upon the first
inventory, therefore it is estimated that from the second cycle, the indicator collection process can be
reduced to 2 months. Due to the crucial importance of indicators to identify green city challenges and
prioritise action, and the intense work that will be required to collect them, the cost estimate of the
collection process is around EUR 50 000.
Benchmarking methodology: “traffic light” screening of state and pressure indicators
38. Green city indicators will be used to benchmark cities’ performance. The benchmarking exercise
will also be used as one of the steps of green city action prioritisation, as explained in the next section. This
section will elaborate in more details on the benchmarking methodology first.
39. The state and pressure indicators should be used to benchmark cities. Response indicators are
difficult to benchmark because they are entirely qualitative and “respond” to existing problems. A city
does not need to respond to a problem that does not exist (for instance, a city does not need a disaster risk
master plan if it scientifically proven that it is safe from all type of natural disasters). Instead, response
indicators should be used in a second screening step to identify policy options that should be considered in
order to tackle the state and pressure issues initially identified (cf. prioritisation methodology below).
Likewise, additional supporting indicators (sources and trends) are not used for benchmarking.
40. A traffic light screening, as used by IADB, is applied to each indicator to simplify the
assessment (green light = high performance; amber light = medium performance; red light = low
performance) and compare cities’ performance against established benchmarks or proposed indicative
benchmarks. Annex 5 presents starting point boundaries for this benchmarking exercise. The thresholds for
the traffic light screening should be established combining the following methods:
Use international standards (such as WHO air quality standards), EU Directives and national laws,
when applicable.
When standards and laws are not applicable, it is recommended that the proposed boundaries
between each of the three “lights” be checked within the EBRD. They should follow data ranges
extracted from the literature for quantitative indicators, and subjective boundaries for qualitative
indicators. Benchmarks could be established based on literature indications on cities’
performance in the world, or according to national averages, if the data is available. The latter
option would help to avoid comparing a city performance with benchmarks established from data
in cities with very different demographic, geographic, economic and climate profiles.
From the above remarks, it is recommended that EBRD establishes country-specific benchmarks
data in order to follow national standards and laws.
41. Such visualisation will help to better assess priorities and transfer the data into the technical and
political decision-making process as well as to communicate and engage relevant stakeholders as effective
as possible given their (commonly) limited time availability. The application of a traffic light screening to
the Green City state indicators will help to identify the most urgent environmental problems (topics) faced
by the city marked as “red”, while highlighting areas of compliance and green city quality marked as

27
“green”. As such, the traffic light screening is a central step of the green city action prioritisation process
detailed below.
42. The indicators and benchmarking methodology will not only be used for prioritisation but also
evaluation and monitoring of green city actions. For instance, if a city wants to assess the effectiveness of
extending the local bus system in order to reduce GHG emissions from the transport sector, the following
aspects should be measured using the benchmarking methodology:
How many buses and new connections have been introduced (response);
The impact of the measure on the number of passengers in public transport, or on the use of
private transport modes (cars, motorcycles) (pressure);
The impact of the measure on air quality and CO2 emissions (state).
3.3. Proposed green city action prioritisation methodology
43. Indicators and proposed benchmarks using the traffic light screening will be used in the process
of prioritising green city actions. The whole process is summarised in Figure 2 below and subsequent text,
and is also described in the full Green City Action Plan process developed in Section 4.
Figure 2. Summary of the benchmarking and prioritisation process
Source: Authors
1. Collection of indicators
• Collection of contextual information
• Collection of all Pressure-State-Response indicators and application of the traffic light benchmarking and trend analysis
2.Prioritisation of green city challenges
• Technical analysis: identification of priority green city challenges based on the assessment of PSR indicators carried out in the previous step
• Stakeholder-based prioritisation
• Political assessment
3.Prioritisation of green city
actions
• Technical analysis: select and prioritise policy options through the application of technical filters
• Stakeholder-based priorisation
• Final prioritisation: political assessment

28
1. Collection of indicators (cf. Step 1.2 in Table 11 and Annex 7)
1.2.1 Map external framework conditions
This includes financial status, governance and management inventory and analysis.
1.2.2 Map environmental and linked infrastructure challenges:
This is the step when the city staff collects and assesses the “state” and “pressure” indicators,
including additional indicators in the “state” indicator table. The assessment is done by applying the
benchmarking methodology (traffic light screening) and the analysis of trend over time
1.2.3 Map local policy framework:
This is the step when the city staff collects and assesses the “response” indicators. The assessment is
done by applying the traffic light approach which uses in this case more qualitative thresholds
compared to the “state” and “response” indicators (cf. Annex 5).
2. Prioritisation of green city challenges (cf. Step 1.3 in Table 11 and Annex 7) – Identifying baseline
conditions
1.3.1 Technical analysis undertaken internally within the municipality’s workforce5
1. Select “state” indicators which show urgent need for action. “Core” state indicators (highlighted
in blue-coloured cells) marked as “red” from the application of the traffic light screening should
be selected. If a city fails to provide a “core” indicator, one of the elective indicators from the
same category in Annex 5 can be used. If the traffic light benchmarking results in a great number
of red-flagged indicators, the trend analysis can be used to further prioritise among the red-
flagged indicators (e.g. only red-flagged indicators with declining and / or stable trends are
selected). If, on the contrary, the traffic light benchmarking results in no or very few red-flagged
indicators, amber indicators should be considered and the trend analysis can also be used to
further prioritise among the amber-flagged indicators, if there are many of them (i.e. only amber-
flagged indicators with declining trends are selected).
2. Select “pressure” indicators which show urgent need for action. The first step to do so is to link
the selected “state” indicators (i.e. those that show need for urgent action) to the corresponding
categories of “pressure” indicators (e.g. air pollution issue linked to transport sector) through the
use of the additional indicators located in the right column in Annex 5. Once this is done, “core”
pressure indicators (highlighted in blue-coloured cells) marked as “red” from the application of
the traffic light screening should be selected. If a city fails to provide a “core” indicator, one of
the elective indicators from the same category in Annex 5 can be used. If the traffic light
benchmarking results in a great number of red-flagged pressure indicators, the trend analysis can
be used to further prioritise among the red-flagged indicators (e.g. only red-flagged indicators
with declining and / or stable trends are selected). If, on the contrary, the traffic light
benchmarking results in no or very few red-flagged pressure indicators, amber pressure indicators
should be considered and the trend analysis can also be used to further prioritise among the
5 The technical analysis may be carried out with the guidance of an external consultant.

29
amber-flagged indicators, if there are many of them (i.e. only amber-flagged indicators with
declining trends are selected).
3. Identify “response” gaps. This should be done by selecting “response” indicators corresponding
to the pressure indicators marked as red6, by applying a qualitative traffic light screening. The
result is not specific response gaps but general ones (lack of investment, lack of regulations etc.).
However, it is important to note that the traffic light screening of response indicators should aim,
as much as possible, to indicate both the presence or absence of policies and the quality of those
policies. Further, analysis will sometimes be necessary to understand the response “gaps”. For
instance, some pressure indicators may be identified as a priority while the response table shows
that there are already policies and/or investment in this area. A more detailed analysis may reveal
that existing policies are not well implemented, or not ambitious enough.
4. At this stage, a diagram of indicator “traffic light” could be drawn as a way to visualise the main
green city challenges. Such diagram can also serve a sort of “problem tree” to visualise the causal
linkages between the red-flagged PSR indicators. Figure 3 below provides an example.
Figure 3. Green city baseline problem "tree" using the traffic light benchmarking methodology
Note: This diagram shows the outcome of the technical analysis under a scenario where there is no need to further prioritise with the trend analysis. In other cases, some red indicators may be discarded or some amber indicators may be selected through the trend analysis (see text above for more explanations).
Source: Authors
6 Annex 5 indicates which category of pressure indicators each response category refers to.

30
1.3.2 Stakeholder-based analysis of green city challenges
The green city challenges identified as a result of the technical analysis within the city administration
– i.e. the green city baseline problem “tree” – should be checked and complemented through a
stakeholder consultation. External experts and citizens representatives will confirm or dispute the
relevance of identified green city challenges. Critical economic and social dimensions linked to the
environmental dimensions will be taken into account to refine the prioritisation of the challenges. This
can be done in a larger group that involves a broader range of stakeholders, gathered in a workshop. A
SWOT analysis has proven to be an appropriate tool for this assessment, but other methods can also
be applied. Guiding questions can help to set links between socio-economic development and
environmental dimensions and derive priorities (e.g. which environmental dimensions impact socio-
economic development of the city at most?). Results will be thoroughly documented.
1.3.3 Political assessment of green city challenges
Political assessment: this is a formal assessment of the results of all previous steps in order to
politically determine priorities to address in the Green City Action Plan. The assessment will take due
consideration of available means, financial resources and personnel and technical capacities available
for the forthcoming implementation period. Findings of the baseline review will be presented in
different ways depending on the targeted audience. Political ratification of priorities set by relevant
bodies is advantageous, with the aim to obtain a strong mandate for continued action. This does not
necessarily require a formal Council approval yet, but offers an opportunity for political debate,
review and recommendations. In any case, the Council should formally ‘take note’ of the Green City
Baseline.
3. Prioritisation of green city actions (cf. Step 2.2 in Table 11 and Annex 7)
2.2.1 (Second) Technical analysis - select and prioritise green city actions (undertaken internally
within the municipality’s workforce)7
1. Review existing green city policy instruments. Strategic objectives of the vision will be
transformed in operations and actions. The first step in this process is a consideration of the
response gaps identified in the prioritisation of green city challenges. Existing instruments
and procedures in these areas will be confirmed or adapted to more efficiently and effectively
achieve the objectives of the Green City Action Plan. Also, gaps within locally applied policy
instruments’ purview for addressing the strategic objectives will be identified as a basis for
the next step.
2. Select new green city policy options. Following on from the identification of response gaps to
address the strategic objectives, new policy options and measures will be reviewed,
considered and adopted by relevant bodies including stakeholders. It is recommended to
organise an interactive workshop to do so. The selected options should ideally be arranged
into “packages” reflecting financial, policy, operational, technological requirements.
3. Prioritise green city policy options. Each policy option selected in the previous step should
have “filters” applied to it in order to determine the degree to which it will bring
environmental, economic and social benefits. Once the filters have been applied to all policy
options, the City can select those that receive the highest scores. Existing prioritisation
methodologies used by other organisations (described in section 3.1) have all adopted a filter
7 The second technical analysis may be carried out with the guidance of an external consultant.

31
screening methodology to prioritise green city actions. A similar methodology is included in
the green city action prioritisation methodology, based on a new set of filters. The filters
proposed to reflect the types of “benefits” that green city actions should aim for are listed in
Table 7 below. These are mostly taken from the table on environmental dimensions, and
economic and social collaterals of green cities in the previous section 3.2 (cf. Tables 3 and 4).
The choice of prioritisation filters should be flexible, and reflect the prioritisation of green
city challenges (or baseline conditions) carried out in Step 1.3. For instance, selected
environmental filters should reflect the main environmental challenges identified as priorities
(e.g. air pollution, climate change mitigation).
The degree to which each policy option addresses improvements in performance of each
selected filter could be measured from 0 to 3, 3 meaning “highest” and 0 “lowest” (Table 8).
A similar approach is adopted by IADB’s ESCI. ESCI also aggregate each numerical value
using a mathematical formula in order to show an overall prioritisation score for item. The
present report rather recommends visualising the values given in each filter in a web
integrating all filters (Figure 4). Applying a mathematical formula to integrate all filters may
create unnecessary biases in the assessment of priorities. Visualising the filters in a web
instead give a more practical approach to policymakers. If a city nonetheless insists to weight
the different filter categories, separate webs could be created according to the importance
given by the municipality to each filters. For instance, a web on filters given high priority
could be made separately from two webs of filters given medium priority and low priority.
Another option could be to separate webs according to environmental, economic and social
filters.
Table 7. Menu of green city policy prioritisation filters
Type of filter # Menu of specific filters to be selected by the municipality (impact of the selected measures on…)
Filter score (3=high; 2=medium; 1=low; 0=none)
Environment 1 Air quality 3
2 Water quality 2
3 Soil quality 0
4 Biodiversity 0
5 Water use 1
6 Energy use 2
7 Land use 3
8 Material use 1
9 Climate change mitigation 0
10 Climate change adaptation 1
Economic 11 Economic returns for investor 2
12 Economic growth 2
13 Employment 0
14 Economic inclusion 3
Social 17 Public health 3
18 Access to basic services (public transport, energy, water, solid waste collection, green spaces)
1
19 Safety 2
20 Gender equality 0
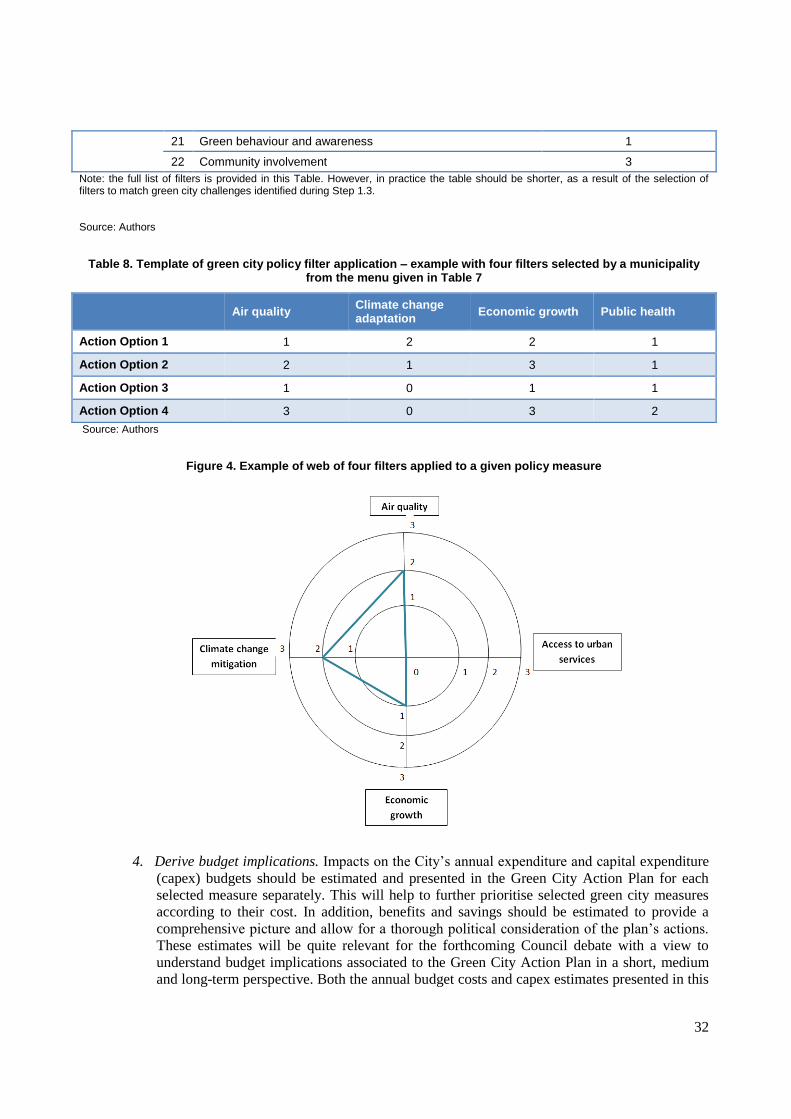
32
21 Green behaviour and awareness 1
22 Community involvement 3
Note: the full list of filters is provided in this Table. However, in practice the table should be shorter, as a result of the selection of filters to match green city challenges identified during Step 1.3.
Source: Authors
Table 8. Template of green city policy filter application – example with four filters selected by a municipality from the menu given in Table 7
Air quality
Climate change adaptation
Economic growth Public health
Action Option 1 1 2 2 1
Action Option 2 2 1 3 1
Action Option 3 1 0 1 1
Action Option 4 3 0 3 2
Source: Authors
Figure 4. Example of web of four filters applied to a given policy measure
4. Derive budget implications. Impacts on the City’s annual expenditure and capital expenditure
(capex) budgets should be estimated and presented in the Green City Action Plan for each
selected measure separately. This will help to further prioritise selected green city measures
according to their cost. In addition, benefits and savings should be estimated to provide a
comprehensive picture and allow for a thorough political consideration of the plan’s actions.
These estimates will be quite relevant for the forthcoming Council debate with a view to
understand budget implications associated to the Green City Action Plan in a short, medium
and long-term perspective. Both the annual budget costs and capex estimates presented in this

33
step are indicative only. They do not lead to a compulsory investment plan. More concrete
and reliable cost calculations will be refined as part of the in-depth project implementation
plan in the next phase: Green City Action. Based on international experience, the following
estimates are commonly provided in Draft Green City Action Plans:
Estimated annual implementation and capital expenditure costs per measure
Estimated annual savings and (economic) benefits per measure
Total estimated annual budget cost for the Green City Action Plan including all
measures across the environmental dimensions spread across entire duration and per
year
Total estimated savings and (economic) benefits for the Green City Action Plan
Estimated cost of pre-investment (for research, feasibility and impact studies, etc.)
Considerations regarding spread of financing across any combination of local and
national government, multilateral agencies, public-private partnerships, development
organisations, other private (financial) sector investments, as well as financing models
In most cases budgetary resources are needed to effectively implement a project and monitor
developments (to cover the costs of human resources, capital investment, etc.). Not all
measures require huge upfront capital investment, but many will deliver cost savings over
time but only after initial costs. A wide variety of funding sources, innovations and ideas will
have to be explored to successfully implement the wide range of actions identified in the
Green City Action Plan. External grant or donor funding may be available for specific projects.
Private sector partners may be interested in specific projects with financial return on
investment or with return in terms of protection of their key assets.
2.2.2 Stakeholder-based prioritisation of green city actions.
The green city actions identified as a result of the technical analysis within the city administration
should be checked and complemented through additional stakeholder consultation. External experts
and citizens representatives will confirm or dispute the relevance of identified green city policies. This
can be done in a larger group that involves a broader range of stakeholders, gathered in a workshop.
Public opinion is particularly important, as it is likely to be followed by city leaders, and should
therefore not be neglected. In addition, undertaking policy which is favourably viewed by citizens is
likely to be more easily implemented. This step is different from the stakeholder-based prioritisation
of green city challenges (cf. Step 1.3.2) in the sense that it aims to prioritise green city actions, and not
challenges.
2.2.3 Final prioritisation: political assessment of green city actions
This is a formal assessment of the policies selected for the Green City Action Plan Political. Political
assessment could help to select some policy options which meet the political agenda of the city, the
national government or the international community (climate change). This step would help to ensure
final leadership from the Mayor and Council.

34
SECTION 4 – METHODOLOGY FOR DEVELOPING GREEN CITY ACTION PLANS
4.1. The structure of Green City Action Plans
44. The Green City Action Plan (GCAP) presents the findings of all above-mentioned activities and
defines the long-term Green City vision and strategic objectives for each priority area. It is structured
according to affected environmental dimensions and significant aspects, using indicators and time-related
targets and measures for the Council’s operations related to the environmental dimensions. The GCAP also
outlines the scope of actions, the targets set and the major actions developed, and the initial steps of
implementing the Plan for a period of 1-3 years. It is an overarching strategic document which contains the
guiding principles offering orientation for the Council’s decision-making and the administration’s
implementation work in the mid-term, i.e. within 3-5 years. Table 9 provides an overview of the contents
of contents of a GCAP.
Table 9. Structure and contents of Green City Action Plans
Sections Content
Messages / presentation Foreword /messages to present Green City Plan on behalf of the Mayor
About the plan Background of the plan
‘How to read’
Work team Authors of the plan
Coordination team
Contributors to the process (according to the different stakeholder groups)
Summary Green City Baseline
Development forecast or scenario
Key programmes and strategic objectives
Priority Challenges and Actions
Green City Action Plan Methodology
Basic concept
Phases
Key activities
Primary outcomes
Green City Baseline
City Profile
Activities / studies implemented in the Green City Baseline
Environmental Challenges / Analysis of indicators (PSR) (benchmarks)
Socio-economic impacts
Priority areas/challenges for action
Green City Action Plan Strategic objectives
Key programmes
Key measures to address environmental challenges
Future targets
Timelines
Responsibilities
Investment needs: Pre-investment and long-term financing
Green City Monitoring, Verification & Reporting
Description of MRV and benchmarking
Aspects of Reporting
Citizen engagement
Conclusions Main findings
Next steps and timelines

35
Opportunities for engagement
References Reference used in the document
Annexes Green City Baseline details with results for each indicator, including benchmarking and traffic light analysis
Source: Authors, based on the ESCI Methodological Guide presented by IDB, July 2014
4.2. The contents of the main sections of Green City Action Plans
45. The critical aspects of the Green City Action Plan, and how they will be integrated in the
complete methodology, are listed in Table 10. The main aspects to be envisaged for the GCAP were
initially suggested by EBRD, and also discussed during a workshop with OECD and ICLEI. This will help
to understand how broad objectives of GCAP are implemented and can be identified in Table 11 and
Annex 7.
Table 10. Translation of the main aspects of Green City Action Plans into the methodology
Main aspects of the GCAP Implementation in the GCAP methodology
GCAPs will be strategic planning documents that balance high-level aspirations with pragmatic actions and investment priorities for cities;
The method will integrate a short-term, medium-term and long-term perspective in the action plan;
Step 1.3-2.3: Implemented by introducing a prioritisation process and both strategic objectives for key programmes and medium- to short-term operational targets for key actions applying specific timelines:
strategic objectives (10-15 years)
mid-term targets (ca. 5 years)
short-term operational targets (1-3 years)
GCAPs could be complemented by sector- focused plans and build on existing multi-sector environmental programmes where such exist that define and analyse in greater detail the investments required to achieve the vision set out in the GCAP. Note that the Consultant is not required to work on the method or content of these more detailed sector plans;
Step 2.3: The Green City Action plan triggers or links to sectoral-focus action plans for different sectors, which define short-term operational targets and suitable measures that serve as stepping stones to reach the medium targets and long-term objectives.
This method for developing GCAPs will be able to be applied to any city in the EBRD COOs;
The suggested GCAP methodology and the environmental dimensions and indicators selected involving EBRD experiences will allow to be used by any city. The process applied would be in line with requirements of international standards such as ISO 37101 on Sustainable Development in Communities. However, then, further dimensions would need to be considered.
This method for developing GCAPs will be written in a way that will provide guidance to city officials and their advisers on how to develop a GCAP;
A mostly visual guidance is being introduced allowing to easily grasp the methodology.
The method to develop GCAPs will advise on how to include civil society, businesses and government officials and all relevant stakeholders;
Starting with step 1.1, involvement of stakeholders in horizontal and vertical manners is made an essential and ongoing activity in the methodology.
The method will also define the institutional/policy framework relevant for a well-structured GCAP approach;
The method is based on experiences in applying policy and management cycles in city administrations.
The method to develop GCAPs will outline a menu The environmental dimensions and indicators

36
of relevant indicators and data requirements that a city can draw on to measure GCAP progress;
have been selected involving EBRD, OECD and ICLEI experiences. Focus is on environmental indicators applying a (widely known and applied) Pressure – State – Response approach.
The method will adopt a cycle approach of green city action planning instead of a linear approach (Figure 5).
The methodology adopts a cyclic and integrated approach based on policy and management cycle knowledge. The process applied would be in line with requirements of international standards such as ISO 14001 (on Environmental Management) or 37101 (on Sustainable Development in Communities). However, then, further dimensions and indicators may need consideration. Figure 5 below illustrates the cyclical process of GCAPs.
Source: Authors
Figure 5. Green cities’ environmental dimensions and the cyclical process of Green City Action Plans
Source: Authors
46. The proposed Green City Action Plan methodology is summarised in Table 11 and Figure 6.
Annex 7 elaborates on each section in further details. The GCAP methodology is based on work
previously implemented by ICLEI together with numerous partners in different contexts, supplement by
consideration of the IADB’s ESCI methodology. References considered for the elaboration of the GCAP
methodology are listed in Annex 8.
Table 11. Summary of the methodology for developing Green City Action Plans
Step Sub-step Short description
Step 1 Green City Baseline
Key question of step 1:
- What is the current state of the environment?
Aim:
- The “Green City Baseline” aims to inform policy and strategic decision-making at the start of the process (or the review phase for advanced local governments) and provide the reference scenario for the business-as-usual against the Green City approach and action.
Primary outcomes:
- Commitment to Green City development for the local community.
- Process initiated within local government and community.

37
- Overview of status quo (understanding situation, constraints and capabilities).
- Priorities identified to address environmental challenges most effectively and in an integrated manner.
Indicative timeline:
- 1st (introductory) GCAP cycle: 6 months
- Following (regular) GCAP cycles: 1-3 months
1.1 Prepare & organise
1.1.1 Secure initial commitment - agreement with the Council
1.1.2 Set up team & institutional structures
1.1.3 Identify & engage stakeholder group(s)
1.2 Map local situation (preparation phase in the prioritisation process elaborated in Section 3)
1.2.1 Map external framework conditions – including financial status , governance and management inventory and analysis
1.2.2 Map environmental and infrastructure challenges (collection and assessment of state and response indicators)
1.2.3 Map local policy framework (collection and assessment of response indicators)
1.3 Assess & prioritise (green city challenges prioritisation process elaborated in Section 3)
1.3.1 Conduct technical analysis
1.3.2 Stakeholder-based prioritisation
1.3.3 Political assessment & Green City Baseline
Step 2 Green City Action Plan
Key question of step 2:
- Where do we want to go and how do we get there?
Aim:
- The “Green City Action Plan” compiles and presents the agreed development vision and objectives for a period of 10-15 years, the priorities to work upon in a period of 3-5 years, and the scope of actions and targets for priority programmes and actions proposed.
Primary outcomes:
- Strategic objectives outlined according to environmental and socio-economic dimensions
- Policy options assessed for addressing environmental challenges
- Priority programmes and key actions defined
- Medium-term targets for Green City Actions determined
- Draft Green City Action Plan compiled
Indicative timeline:
- 1st (introductory) GCAP cycle: 6 months
- Following (regular) GCAP cycles: 3 months
2.1 Develop a vision (10-15 years)
2.1.1 Develop strategic objectives for priority areas
2.1.2 Determine key programmes within the priority areas
2.1.3 Consider scope incl. territory and stakeholders
2.2 Select and prioritise green city policy measures (green city action prioritisation process elaborated in Section 3)
2.2.1 Technical analysis (review existing green city response; select new green city policy options; prioritisation of selected green city policy options; derive budget implications)
2.2.2. Stakeholder-based prioritisation of green city policy options
2.2.3. Final prioritisation of green city policy options
2.3 Draft Green City Action Plan (3-5 years)
2.3.1 Determine medium-term targets
2.3.2 Draft Green City Action Plan
2.3.3 Present Green City Action Plan

38
Step 3 Green City Implementation
Key question of step 3:
- How do we operationalise the plan, and what are resources available to assist?
Aim:
- The “Green City Implementation” will operationalise the Green City Action Plan, break it down into concrete tasks, allocate budget, time and staff, and monitor the contribution of each measure to the objectives and targets established in the Plan. This will include building political support for the Plan’s targets and actions by linking to municipal budget resources and reaching out to key government members.
Primary outcomes:
- Initiating and running projects as part of a comprehensive Green City Action Plan.
- Monitoring of implementation of actions and progress towards objectives and targets.
- Political Commitment to Green City Action Plan.
- Mitigation of environmental challenges and risks / environmental improvements started.
- Consideration of financial resources in municipal budget.
- Established implementation partnerships.
Indicative timeline:
- 12 - 36 months
3.1 Engage politicians and their bodies
3.1.1 Prepare political framework
3.1.2 Inform political debates
3.2 Prepare council resolution
3.2.1 Consider formal requirements
3.2.2 Draft council resolution
3.2.3 Prepare presentation and council meeting
3.3 Establish implementation partnerships
3.3.1 Publish Green City Action Plan
3.3.2 Engage stakeholders and form alliances
3.3.3 Formalise action and implementation partnerships
3.4 Implementation Plan for key measures
3.4.1 Refine generic Green City Action Plan and mobilise
3.4.2 Plan implementation of selected key measures
3.4.3 Execute measures
3.5 Monitor implementation and progress
3.5.1 Set up monitoring scheme
3.5.2 Implementation monitoring
3.5.3 Control progress
3.6 Implement corrective measures
3.6.1 Consider monitoring results
3.6.2 Plan and implement corrective measures
3.6.3 Monitor impact of corrective measures
Step 4 Green City Reporting
Key question of step 4:
- What have we been able to achieve – and how?
Aim:
- The “Green City Report” will analyse successes and failures during the implementation period, provide the basis for taking further political decisions and inform Council, stakeholders & the public on what the city has done and achieved
Primary outcomes:
- Institutionalized evaluation, audit and reporting system in use.

39
- Green City Report reflecting achievements based on objectives and targets established in the Green City Action Plan.
- On-going and increasing environmental improvements.
- New policy options identified to accelerate Green City development.
Indicative timeline:
- Suggested to implement as annual report, i.e. 12 months from Council decision
- Duration of phase ca. 3 months
4.1 Evaluate process and achievements
4.1.1 Evaluate effectiveness of process
4.1.2 Green City Benchmarking
4.1.3 Evaluate effectiveness of measures/investments to address environmental challenges and risks
4.2 Implement audit
4.2.1 Implement internal audit
4.2.2 Implement external audit
4.2.3 Audit response action
4.3 Report results
4.3.1 Draft Green City report
4.3.2 Present Green City report
4.3.3 Draw conclusions and prepare for subsequent cycle
Note: phases corresponding to the prioritisation processes developed in Section 3 are marked in orange.
Source: Authors

40
Figure 6. Green City Action Plan - Summary Diagram
Source: Authors
4.3. Indicative timelines for developing Green City Action Plans
47. Table 12 summarises the indicative timelines provided in existing green cities action plan
methodologies (Aalborg Commitments, ESCI, ADB, 100 Resilient Cities, ecoBUDGET, Integrated
Management Systems). Table 13 indicates the timelines for each of the four sections of the Green City
Action Plan. As can be seen, the EBRD GCAP process timeline is consistent with other approaches.
Table 12. Timelines in international references for management methodologies similar to GCAP
Reference Timelines
Aalborg Commitments
Baseline 12 months
Strategy 12 months
ÊSCI / ADB
Overall timeline 48-60 months

41
1st stage: Preparation (5 %), Prioritisation (5%), Action Plan (30 %) 12 months
2nd stage: Pre-investment (50 %), Monitoring (10%), Action Plan (n.n.) 36-48 months
100 Resilient Cities
Overall timeline Not specified
Preliminary resilience assessment Strategy Initiation (1 month), Stakeholder Engagement Plan (1 month), City Context & Preliminary Resilience Assessment (3 months), Focus Areas and Custom City Approach (1 month)
3 months
Resilience Strategy: priorities and initiatives Phase II Initiation (1 month), Focus Area Analysis & Diagnostic (3 months), Opportunity Assessment (2 months), City Resilience Strategy (1 month)
6-9 months
Implementation and evaluation Not specified
ecoBUDGET
Overall timeline annual (first cycle 16 – 24 months)
initial set-up and diagnosis
draft ecoBudget
implementation
evaluation
4 months
2 months
12 months
2 months
Integrated Management System
Overall timeline Annual (first cycle 18-25 months)
Baseline Review
Target Setting
Commitment
Implementation & Monitoring
Evaluation & Reporting
3 months
3 months
2 months
12 months
2 months
Source: Authors
Table 13. Timelines of the Green City Action Plan methodology
Step Timeline
Overall timeline 1st (introductory period) 12 – 24 months
Following regular periods: 12-18 months
Note:
Implementation of Green City Action Plan cycles will be on a continuous basis, i.e. individual steps will partly be implemented overlapping with other steps.
Green City Baseline 1st (introductory) period: 6 months (including 4 months for the collection of the
green city PSR indicators)
Following (regular) period: 1-3 months (including 2 months for the collection of the green city PSR indicators)
Notes:
The establishment of the first Green City Baseline is obviously more demanding due to need to map all aspects of the Baseline and develop an inventory of eg. data storages and owners etc. Also, participants will need to be trained on the contributions. Subsequent similar exercises will draw upon the first inventory and training

42
A full revision of the Green City Baseline will be needed either in the occurrence of significant changes or demands. Otherwise, updates will be sufficient, reducing the time and effort for subsequent cycles.
Regardless of significant changes, a full revision is suggested to be implemented every 3 years (TBC).
Green City Action Plan 1st period: 6 months
Following (regular periods): 3 months
Notes:
The establishment of the first Green City Action Plan is obviously more demanding due to new requirements and involvement, but most importantly of the agreement on long- and medium-term targets.
In following years, targets and actions will be reconsidered based on the monitoring and evaluation concluding the previous cycle and in case of significant changes in framework conditions (following the Green City Baseline).
A full revision is due every 3-5 years (TBC).
Green City Implementation 12-36 months
Notes:
Timelines for the implementation of individual actions will be determined when developing the Green City Action Plan. These might reach beyond individual implementation periods, in which case interim results will be considered in the evaluation.
Green City Reporting 12-36 months
Notes:
Includes whole preparation and execution
Source: Authors
4.4. Range of skill sets, both within a city administration and external support, required to develop
GCAPs
48. A Green City Action Plan management needs to allow for maintenance of the system,
communication with all relevant actors and support for political strategy and decision-making. The local
administration is seen as the only body able to promise all three aspects. The strategic approach suggests a
central position for this co-ordination function.
49. Success of the approach is best supported by a city administration that perceives itself to be a
‘learning administration’ and a partner to other stakeholders involved in the process. The city
administration is considered the ‘engine’ of the process. To efficiently implement the rather complex
dimensions, a capable, efficient and motivated administration is key, even more so under condition of
budgets constraints. It will be important for the city administration to be prepared for continual change and
adopt requirements from societal transition. Box 1 below provides a list of administrative considerations
found to be relevant in international and European contexts.
Box 1. Important administrative considerations according to international / European experience
A list of administrative considerations found to be relevant in international and European contexts is provided below:
Senior management and Council back up the Green City Action Plan;
The Green City Action Plan will be integrated with the overall city development;

43
A cross-cutting, integrated organisation structure and management;
Management style is cooperative and staff oriented with clear objectives in all departments. Superiors are positive examples with regard to engagement, creativity and motivation
Employees are encouraged and motivated and are given room for their own initiatives and decisions. They feel in line with their tasks and do not feel overburdened or unchallenged
Employees feel identified with “their” administration (corporate identity)
Horizontal and vertical interconnectedness of relevant actors;
Transparency and active information policy towards the public (good service for the customer is more important than to fulfil bureaucratic rules)
Communication is clear and transparent and does not depend on hierarchies. Oral communication is as important as written documentation
Topical and financial integration of financing programmes;
District-level representatives and contact points;
Qualitative analysis of framework conditions;
Regular and objective control of results and objectives approved allows to react on time in the case of variations, and to face new pressures and challenges
Changes emerging from these assessments must be communicated in order to avoid misunderstandings
Respectful feed-back and contacts with civil stakeholders engaged.
Source : Authors
Coordinating the effort
50. It is important that the City establishes an effective coordination structure to oversee the GCAP
development. The GCAP is necessarily comprehensive, and as such crosses many departmental interests.
In response to this, it is important that the coordination structure is inclusive and cross-departmental.
International experience suggests that two groups are important in this regard: coordination board and
coordination team.
Co-ordination Board
51. The Co-ordination Board is responsible for supervising the whole Green City Action Plan.
Ideally, it is a group of about 10-15 high-level local government politicians and managers. However, the
number depends on the size of the administration and it is gradually expanding together with expanding
scope and contents of the system. Participation in the Co-ordination Board should follow a cross-
departmental approach comprising representatives from all departments relevant for resource management
– be it natural, human or financial resources. Participants could represent departments responsible for the
different sectors addressed, e.g. mobility, public works, energy supply, culture and social issues, etc., but in

44
a case, the financial department. Additionally, representatives of relevant local authority services
(municipal companies) and stakeholder groups should be involved.
Co-ordination (Team)
52. The Co-ordination (Team) should be established centrally in the City administration for the
operational activities. Often this is best situated within the Mayor’s Office. Furthermore, it is advisable that
a separate entity be responsible for drawing up and implementing the Green City Action Plan. This
separate entity may be an existing department or a department or office specially created for the task. The
Co-ordination Team is likely to consist of a few persons according to volume of the objectives to be
managed and the size of the city. The head of the team is the Green City Co-ordinator, who will need to
comply with particular demands and skills as follows:
A change agent, that can rally resources, support, and buy-in for innovative work while working
in an environment where resources are scarce, where they may be starting with almost nothing
(100 Resilient cities)
Capable to bridge between policy and implementation and able to build partnerships and
alliances of diverse stakeholders able to resolve conflicts;
A strategic, innovative, cooperative and collaborative personality and ‘good listener’;
Excellent manager with good overview and coordination skills;
Powerful ‘driver’ able to set clear goals and persevere;
An excellent communicator and inspirational ambassador;
An excellent facilitator of activities between different stakeholder groups able to organise and
implement inspiring events
53. The Rockefeller Foundation’s 100 Resilient Cities initiative recommends a similar approach,
with the nomination of a Chief Resilience Officer (Box 2).
Box 2. Example of administrative skills: What a Chief Resilience Officer Does?
The Green City team and its Co-ordinator could be inspired by the Chief Resilience Officer (CRO) of Rockefeller Foundation’s 100 Resilient Cities initiative. The CRO is the centerpiece of 100RC’s vision for helping cities deal with their challenges, while empowering them to develop improved urban resilience. To be effective in this instrumental role, a CRO:
1. Works across government departments to help a city improve internal communications, and to address its own complexities. By facilitating communication that reaches across sometimes-significant internal divisions, the CRO promotes new collaboration; makes sure that offices aren’t wasting resources doing duplicative work; and promotes synergy between the various projects and the plans that agencies are drafting.
2. Brings together a wide array of stakeholders to learn about the city’s challenges and help build support for individual initiatives, and for resilience building in general. These stakeholders include government officials, and it is critical that representatives from the private sector, non-profits, and civil society are also included.
3. Leads the resilience strategy, a six-to-nine-month process during which the CRO brings in a wide variety of stakeholders, to help identify the city’s resilience challenges, its capabilities and plans to address them, and then to identify the gaps between these two. At the end of this process, the CRO will have a series of resilience-building initiatives that he or she will then work to put in to action, with assistance from 100RC and

45
our platform partners.
4. At the same time, the CRO acts as the “resilience point person,” ensuring that the city applies a resilience lens so that resources are leveraged holistically and projects planned for synergy. This lets the city get the most “bang for its buck” on its projects, potentially achieving multiple resilience goals with one project. This could include, for example, a flood barrier also serves as a bike path, promoting healthy citizens and cohesive communities.
Effective CROs perform all these functions, helping their cities manage their own complexities to make resilience efforts more impactful, and collaborating externally to identify and integrate lessons other cities have learned, so solutions scale globally.
Source : http://www.100resilientcities.org/blog/entry/what-is-a-chief-resilience-officer1#/-_/
Internal Auditor
54. The internal auditor needs to be a person with profound knowledge regarding structure and
competences of a local authority and independent from the coordination team. This person could come
from the Strategic Department of the local authority, from a regional authority or from another city (Peer to
Peer Review). Within an annual procedure, the internal auditor evaluates the Green City Plan management
process and achievements as the basis for a subsequent cycle.
External Auditor
55. If the city decides that it wishes to have an ISO 14001 or ISO 37101 certification and/or EMAS
registration, an external auditor performs an audit of the system according to the resp. requirements.
Capacity Building and Motivation
56. The expertise of every employee is of great importance for a successful Green City Action Plan
management. The employees’ level of competency should be continually improved, in particular through
training courses as a complement to their job-related education and job experience. For this reason, careful
and targeted personnel and organisational development incl. education, level of awareness and competency
are important fields for the implementation and success of the Green City Action Plan. Key to this is the
motivation of staff members. Improving their understanding of the problems to be solved increases their
motivation and the level of participation. Also, along with training courses for job-related topics,
employees should regularly receive information about sustainability management and its progress in the
organisation. A coherent approach to personnel and organisational development would apply instruments
such as:
Personnel management and supervision (including related evaluation mechanism, and ”leading
by objectives”;
Personnel development (incl. targeted facilitation of performance and learning capacities of staff);
Increased targeted training and professional education;
Staff maintenance programmes;
Recruitment and selection strategies to ensure job profile and skills match;
Controlling of personnel costs;

46
Continual organisational improvement process;
Change management approach with internal facilitation capacity;
Professional project management;
Benchmarking and structural comparison with peer cities.

47
ANNEX 1. EXISTING ENVIRONMENTAL ACTIVITIES IN CITIES IN THE WORLD
Annex 1 lists existing environmental activities in cities in the world. A summary table and a detailed table are displayed below.
Summary Table
Name of initiative Type of activity
Sectors8
Detailed information
publicly available
URL
INTERNATIONAL ACTIVITIES
Eco2Cities, World Bank
Study T/ SW / WSS / E
Yes http://web.worldbank.org/WBSITE/EXTERNAL/TOPICS/EXTURBANDEVELOPMENT/0,,contentMDK:22501973~pagePK:148956~piPK:216618~theSitePK:337178,00.html
OECD Green Cities Programme and OECD Metropolitan Reviews
Study T/ SW / WSS / D / E
Yes http://www.oecd.org/regional/greening-cities-regions/citiesclimatechangeandgreengrowth.htm http://www.oecd.org/gov/regional-policy/urbanmetroreviews.htm
ADB’s Green Cities Initiative and Green Development Toolkit
Study T/ SW / WSS / D / E
Yes http://www.adb.org/publications/green-cities http://www.adb.org/documents/green-city-development-tool-kit
UNEP – UN HABITAT Greener Cities Partnership
Technical assistance
T / WSS / D Yes http://unhabitat.org/unep-and-un-habitat-greener-cities-partnership/
Rockefeller Foundation’s 100 Resilient Cities and ACCCRN
Technical assistance and awareness
S / WSS / D Yes http://www.100resilientcities.org/#/-_/ http://acccrn.net/
World Bank’s ECA SCI
Technical assistance
T / SW/ WSS / E
Yes http://web.worldbank.org/archive/website01419/WEB/0__CO-18.HTM
ICLEI’s Urban LEDS Technical T/ SW / WSS Yes http://urbanleds.iclei.org/
8 T = transport; L = land-use; SW = solid waste; WSS = water supply and sanitation; D = drainage; E = energy

48
Programme assistance / D / E
Covenant of Mayors Technical assistance
T/ WSS / E Yes http://www.covenantofmayors.eu/index_en.html
IADB’s ESCI Technical assistance
T/ SW / WSS / D / E
Yes http://www.iadb.org/en/topics/emerging-and-sustainable-cities/emerging-and-sustainable-cities-initiative,6656.html
CDIA Technical assistance
T/ SW / WSS / D / E
Yes http://cdia.asia/
Global Platform for Sustainable Cities, World Bank
Technical assistance
T/ SW / WSS / D / E
Little http://www.worldbank.org/en/news/press-release/2016/03/09/world-bank-and-global-environment-facility-gef-launch-new-multi-million-dollar-global-platform-for-sustainable-cities
E5P Grants E Yes http://e5p.eu/
Urban Clean Development Mechanism
Grants and Study
T / SW / E Yes http://www.unep.org/urban_environment/PDFs/UNEP_UrbanCDMreport.pdf
European Green Cities Network
Awareness / Networking
E Yes http://europeangreencities.com/
WWF’s Sustainable Cities
Awareness / Networking
T / SW / WSS / D / E
Yes http://wwf.panda.org/what_we_do/footprint/cities/
C40 Cities Awareness / Networking
T / D / E Yes http://www.c40.org/
UCLG Awareness / Networking
WSS / D / E Yes http://www.uclg.org/
CITY INITIATIVES (SELECTED)
Singapore’s Four National Tap
- WSS / D Yes http://www.pub.gov.sg/water/Pages/default.aspx
Yokohama’s waste management
- SW Little http://citynet-ap.org/wp-content/uploads/2011/10/Intergrated_solid_waste_management_in_Yokohama.pdf
Tokyo’s Cap and Trade Programme
- E Yes https://www.kankyo.metro.tokyo.jp/en/climate/cap_and_trade.html
Stockholm’s eco-district
- T Little https://mjscapes.wordpress.com/2016/03/11/stockholms-eco-district/
Reykjavik’s renewable energy policy
- E Little http://www.go100percent.org/cms/index.php?id=70&tx_ttnews%5Btt_news%5D=33
Lyon’s eco-district - E Yes http://www.lyon-confluence.fr/en/living-in-la-confluence/going-green.html
Kitakyushu’s clean industrial policy
- E Yes http://www.city.kitakyushu.lg.jp/english/file_0064.html
PRIVATE SECTOR INITIATIVES (SMART CITY)
Veolia Environnement - E / WSS / SW
Yes http://www.veolia.com/en/our-customers/achievements/municipalities
Cisco’s - T / E Yes http://www.cisco.com/c/en/us/solutions/industries/smart-connected-communities.html

49
Smart+Connected
Siemens’s Green City Index
- T / E Yes https://www.siemens.com/global/en/home.html
Google Sidewalk Labs
- ? Yes http://www.sidewalklabs.com/
IBM - T / WSS / D / E
Yes http://www.ibm.com/smarterplanet/us/en/smarter_cities/overview/
Schneider Electric - E Yes http://www.schneider-electric.com/b2b/en/solutions/for-business/smart-cities/explore-our-offer/
Intel - T / E Yes https://newsroom.intel.com/news-releases/san-jose-implements-intel-technology-for-a-smarter-city/
Microsoft CityNext - T / WSS / E Yes https://enterprise.microsoft.com/en-us/industries/citynext/sustainable-cities/
McKinsey & Company’s Sustainable Cities
- T/ SW / WSS / D / E
Little http://www.mckinsey.com/business-functions/sustainability-and-resource-productivity/how-we-help-clients/sustainable-cities
CIVIL SOCIETY ACTIVITIES
Solid waste collection in Surabaya, Indonesia
- SW Little http://www.slideshare.net/ummikhairia/surabaya-waste-management-system
Urban farming in Boston, USA
- L Little http://inhabitat.com/top-10-cities-in-the-us-for-urban-farming/
Source: Authors
Detailed Table

50
Outline Description Type of Activity
Urban Infrastructure of Application
9
Target countries /
cities
Relevance to EBRD’s green cities agenda T L S
W WSS
D E
MULTI-LATERAL / INTERNATIONAL INITIATIVES
“Eco2Cities: Ecological Cities as Economic Cities”, World Bank, 2011
Eco2Cities is a programme to help cities
in developing countries achieve greater ecological and economic sustainability. The program will provide practical and scalable, analytical and operational support to cities. The program also aims to build a global partnership among forward-looking cities in developing countries, global best-practice cities, academia, and international development communities.
Study x x x x x The study covers all countries (including policy analysis of OECD countries). The operation is for WB countries.
This programme is oriented towards practical action planning and solutions for integrated urban development. It also proposes a range of resources in each sector as a support to cities. It is more of a general methodology for a green city, but does not address the benchmarking and prioritisation approaches requested by EBRD. WB does not have particular project finance tools based on this programme, but several countries have applied it in the normal operation of the Bank.
OECD Green Cities Programme, OECD, 2010 – (ongoing)
This OECD programme aims to assess
how urban green growth and sustainability policies can contribute to improve the economic performance and environmental quality of metropolitan areas and thus enhance the contribution of urban areas to national growth, quality of life and competitiveness. Mostly, it aims to provide a review and evaluation across multiple cities of the impact of urban sustainability and green growth policies on jobs growth, economic attractiveness and environmental quality. It provides policy assessments and recommendations for both OECD and non-OECD cities, across a range of geographical, economic and national
Study x x x x x x All countries and cities. The first phase analysed four cities from OECD. The second phase (ongoing) covers 5 cities in Southeast Asia.
This programme is focused on the environment – economy nexus. It contains detailed analysis of green growth benefits with best policy practices in both developed and emerging countries based on multi-city comparisons of green city indicators, providing policymakers with strong evidence-based information for policy prioritisation. It also proposes reforms of governance structures. The OECD does not provide financial support. Monitoring of policy recommendations can be conducted after a research
9 T = transport; L = land-use; SW = solid waste; WSS = water supply and sanitation; D = drainage; E = energy

51
regulatory contexts. project. It does not contain green city action planning methodology but can be used in several steps of the methodology proposed in Annex 7 (e.g. review and evaluation process).
OECD Metropolitan Reviews
OECD Metropolitan Reviews are conducted in collaboration with local governments (cities, regions and other sub-national levels of government) and central governments, in pursuit of the following objectives:
enhance the city’s economic competitiveness and attractiveness;
improve the policies put in place to strengthen social inclusion and environmental sustainability;
assess the city’s environmental performance and its vulnerability to climate change, and explore ways in which environmental and economic development policies can foster more sustainable development; and
identify obstacles to competitiveness and sustainable development within the spheres of governance and local finance, and make recommendations for overcoming them
Study x x x x x x All metropolitan areas, potentially (depending on interest).
OECD Metropolitan Reviews are not specifically focused on green cities, but often tackle urban environmental issues and infrastructure challenges. It does not contain green city action planning methodology but can be used in several steps of the methodology proposed in Annex 7 (e.g. review and evaluation process).
ADB’s Green Cities Initiative (2012) and Green Development Toolkit (2016)
ADB’s Green Cities Initiative: the book
directs the green agenda toward compact, multifunctional, and efficient urban areas. It thus focuses on “greening” of a number of urban infrastructure services such as urban transport, and provision of water and sanitation services, waste management, and energy sources for urban areas. The Green City Development Toolkit
adopts a more practical approach and focuses on providing advice on how to develop green city action plans (see
Study x x x x x x Asian cities ADB’s Green Cities programme focus on infrastructure and environmental issues. The Toolkit provides an approach to policy prioritisation and action plan methodology for green cities that could provide guidance for the EBRD. The work on green city indicators is not strong.

52
Annex 2).
UNEP-UNHABITAT Greener Cities Partnership (2014-now)
The UNEP-UNHABITAT Greener Cities Partnership is envisaged to upscale the
successful collaboration between UNEP and UN-Habitat. Initially covering the period 2014-2016 leading up to the Third United Nations Conference on Housing and Sustainable Urban Development (Habitat III) in 2016, “Greener Cities” is expected to continue beyond Habitat III. It aims to strengthen synergies between the two agencies and among their partners. Broadly, the objective of this cooperation is to mainstream the environmental perspective into urban policymaking and incorporate urban perspectives into environmental policy-making, as well as to highlight the local-global linkages of environmental issues.
Technical assistance
x x x All countries This programme focuses mainly on resilience, sustainable transport and mobility, and water supply and sanitation.
Rockefeller Foundation’s 100 Resilient Cities (100RC) and ACCCRN
Cities in the 100RC network are
provided with the resources necessary to develop a roadmap to resilience along four main pathways: i) Financial and logistical guidance for establishing an innovative new position in city government, a Chief Resilience Officer, who will lead the city’s resilience efforts; ii) Expert support for development of a robust resilience strategy; iii) Access to solutions, service providers, and partners from the private, public and NGO sectors who can help them develop and implement their resilience strategies; and iv) Membership of a global network of member cities who can learn from and help each other. The Rockefeller Foundation also pioneered the Asian Cities Climate Change Resilience Network (ACCRN), which aims to improve capacities of 50 cities in Southeast Asia.
Technical assistance (100RC) and awareness raising (ACCCRN)
x x x x 100 cities from all over the world
These 2 initiatives focus on disaster risk resilience, and therefore emphasise first and foremost climate change adaptation. These networks could be useful for the EBRD’s work on adaptation.
World Bank’s Europe and Central Asia
The World Bank’s ECA Sustainable Cities Initiative (SCI) is a multi-year
program designed to support cities and
Technical assistance (mainly)
x x x x x Europe and Central Asian countries
Although in its conceptual framework the project aims to be integrated, the specific support to

53
(ECA) Sustainable Cities Initiative (SCI)
governmental programs at the national level in pursuing an agenda of enhancing the sustainability of ECA cities. SCI aims at encouraging approaches to optimise the economic, financial, social, and environmental sustainability goals of cities in ECA. SCI is organised around four core activities called the Applied Knowledge Framework (AKF) which include: (i) orientation, awareness, and exposure workshops; (ii) development and implementation of local diagnostic tools; (iii) Policy Reforms and Investment Strategies; and (iv) project financing, technical assistance and implementation support.
cities is disaggregated. There is also an emphasis on action planning. No link between ECA SCI and the Bank’s Integrated Approach Pilot has been found. However, Gaziantep, Turkey, is one of the pilot cities for the Tool for Rapid Assessment of City Energy (TRACE).
ICLEI’s Urban LEDS Programme
ICLEI is an international association of
local and metropolitan governments dedicated to sustainable development. ICLEI counts 12 mega-cities, 100 super-cities and urban regions, 450 large cities, and 450 small and medium-sized cities and towns in 84 countries dedicated to sustainable development. ICLEI provides technical consulting, training, and information services to build capacity, share knowledge, and support local government in the implementation of sustainable development at the local level. One of the current programmes is Urban LEDS, funded by the European Commission, and implemented by UN-Habitat and ICLEI, whose objective is to integrate the GreenClimateCities methodology into all sectors of urban planning and development in emerging economy countries
Technical assistance
x x x x x x 84 countries and 1012 cities
ICLEI is particularly looking at governance and has developed practical expertise through its assistance to local governments. They also provided guidance on indicators and green city action planning processes.
Covenant of Mayors - 2008
After the adoption, in 2008, of the 2020 EU Climate and Energy Package, the European Commission launched the Covenant of Mayors to endorse and
support the efforts deployed by local authorities in the implementation of
Technical assistance
x x x x Europe The Covenant of Mayors provides technical support in the design and monitoring of the implementation of each SECAP. Each SECAP contains analysis of sectors relevant to the objectives

54
sustainable energy policies. The new integrated Covenant of Mayors for Climate & Energy was launched by the European Commission on 15 October 2015 during a Ceremony in the European Parliament in Brussels. The three pillars of the strengthened Covenant - mitigation, adaptation, and secure, sustainable and affordable energy - were symbolically endorsed on this occasion. In order to translate their political commitment into practical measures and projects, Covenant signatories commit to submitting, within two years following the date of the local council decision, a Sustainable Energy and Climate Action Plan (SECAP) outlining the key actions they plan to undertake. The plan will feature a Baseline Emission Inventory to track mitigation actions and a Climate Risks and Vulnerability Assessment.
of the Covenant, including current situation, CO2 emissions tracking, and actions to be taken. The approach is centred around energy use and climate change (in some plans the climate change adaptation aspect is missing), and not necessarily on access to urban services and water, solid waste and land resource use.
IADB’s Emerging and Sustainable Cities Initiative (ESCI) - 2014
The Emerging and Sustainable Cities Initiative (ESCI) is the IDB’s non-
reimbursable technical assistance program providing direct support to national and subnational governments in the development and execution of city Action Plans. ESCI employs a multidisciplinary approach to identify, organise and prioritise urban interventions to tackle the main roadblocks that prevent the sustainable growth of emerging cities in Latin
America and the Caribbean. This transversal approach is based on three pillars: (i) environmental and climate change sustainability, (ii) urban sustainability, and (iii) fiscal sustainability and governance.
Technical assistance
x x x x x x Latin America and the Caribbean’s (LAC)
Clear focus on developing and implementing City Action Plans. The ESCI considers cities’ sustainability in a broad approach, i.e. not only environment but also economic, social, financial, and institutional. The benchmarking and scoring approach is very complete. The conceptual framework for sustainability indicators is a bit weak: they are laid out on the same plan without attempt to explain the causal linkages between indicators (see Annex 2 for more details).
Cities Development Initiative for Asia (CDIA)
CDIA provides assistance to medium-
sized Asian cities to bridge the gap between their development plans and the implementation of their infrastructure
Technical assistance
x x x x x Asia CDIA possesses a database of best practices for cities’ development as well as a city infrastructure prioritisation toolkit

55
investments. (Annex 3 for more details)
Projects of development banks and agencies
Project financing by multi-lateral banks and development agencies (World Bank, ADB, JICA, USAID, AFD, GIZ)
Grants and loans
x x x x x x Developing countries
These approaches are project by project, with focus on one type of infrastructure. It usually responds to basic infrastructure gap or inefficiency. The national governments are usually the main interlocutors, so direct collaboration with cities is still limited.
E5P (2009-now) The E5P is a EUROS 168 million multi-
donor fund initiated during the Swedish Presidency of the European Union in 2009 to encourage municipal investments in energy efficiency and environmental projects in the Eastern Partnership region. Initially active in Ukraine, in 2014 the fund formally extended its activities to Armenia, Georgia, Moldova and will also endeavour to operate in Azerbaijan and Belarus. The contributions are used as grants to support municipal sector projects. The grant allocations are flexible and recognise priorities of each recipient country with the overall aim to reduce energy use, pollution and GHG. The fund also supports policy dialogue and regulatory reform.
Grants x This approach is project by project, with focus on one type of infrastructure. Climate Change and air pollution are the main priority.
Urban Clean Development Mechanism (CDM) - 2012
The Clean Development Mechanism (CDM) allows emission-reduction
projects in developing countries to earn certified emission reduction (CER) credits, each equivalent to one tonne of CO2. These CERs can be traded and sold, and used by industrialised countries to a meet a part of their emission reduction targets under the Kyoto Protocol. In 2012, a study was prepared on the quality of access of cities to CDM, making recommendations for the establishment of an Urban CDM.
Grants and Study
x x x The study mentioned has not been followed by the creation of any specific Urban CDM yet
Global Platform The Global Platform for Sustainable Technical x x x x x x 23 cities in 11 None of the 23 cities are part of

56
for Sustainable Cities, World Bank, 2016
Cities (GPSC) was launched in March
2016 in Singapore. Co-ordinated by the World Bank and supported by multilateral development banks, UN organisations, think tanks and various city networks, the GPSC is a knowledge sharing program that will provide access to cutting-edge tools and promote an integrated approach to sustainable urban planning and financing. It will be implemented by the World Bank in partnership with the African Development Bank, the Asian Development Bank, the Development Bank of South Africa, the Inter-American Development Bank, the United Nations Environment Programme, the United Nations Development Programme, and the United Nations Industrial Development Organization. EBRD is now a formal partner of the GPSC.
assistance / knowledge-sharing
developing countries for the technical assistance (Brazil, Cote D’Ivoire, China, India, Malaysia, Mexico, Paraguay, Peru, Senegal, South Africa, Vietnam)
the EBRD’s COOs. It may however be interesting to check the database for best practices, and consider options to join the network to expand the core cities to the COOs.
European Green Cities Network (EGCN)
European Green Cities Network (EGCN) is a network of cities,
organisations and companies focusing on contributing to the development of green cities and buildings in a sustainable Europe. EGCN is working with innovation projects, implementation of best practice in planning and building projects, education and dissemination. Actual activities include arranging seminars, editing newsletters and magazines for European research and Development projects.
Awareness / Networking
x Europe (Bulgaria, Hungary, Poland, Slovenia)
This network has limited influence.
World Wild Fund’s Sustainable Cities
WWF advocates for cities to reduce their
ecological footprints and protect biodiversity. The website provides 100+ inspiring examples of how cities around the world are stretching and innovating to meet the overall goal.
Awareness / Networking
x x x x x All countries The website is a convenient interface to check green city initiatives in the world by sector. However, none of the listed initiatives are found in EBRD’s COOs.
C40Cities C40Cities is a network of the world’s
megacities committed to addressing climate change.C40 offers cities a forum where they can collaborate, share
Awareness / Networking
x x x All continents (83 affiliated cities)
Among member cities are Amman, Cairo, Athens, Istanbul, Moscow and Warsaw, which are also in EBRD COOs.

57
knowledge and drive action on climate change. The work of C40Cities focuses on research and publications, measurement of CO2 emissions and planning, case studies and open data portal.
United Cities and Local Government (UCLG)
United Cities and Local Governments
supports international cooperation between cities and their associations, and facilitates programmes, networks and partnerships to build the capacities of local governments. UCLG advocates and builds partnerships in the areas of water and sanitation, disaster risk management, climate change, among a broader range of topics.
Awareness / Networking
x x x 143 countries, more than 240 000 cities, towns and regions are members
UCLG works as a network of cities and diffuse knowledge on urban policy. There is no emphasis on green city but they tackle urban environmental issues through separate sectors (WSS, climate change, disaster risk reduction)
CITY INITIATIVES
Singapore’s water supply, sanitation and resilience policy
Singapore’s Four National Taps is a
programme set up in the late 1990s to tackle high water stress in the island. It is based on desalinisation, reclamation of used water, water imports and rainwater collection and storage. It is a great illustration of green infrastructure complemented by advanced technology, to create a “water loop” that encourages water conservation and protection of ecosystems.
Municipal initiatives
x x Singapore An inspiration for Green City Action Plans Possibility of technology diffusion in EBRD cities?
Yokohama’s waste management
The City of Yokohama, Japan’s second
largest city, has demonstrated how an integrated approach to waste management, combined with stakeholder engagement, could reduce solid waste by 38.7% and during a period when population actually grew by 170 000. This significant waste reduction allowed Yokohama to save USD 1.1 billion which was otherwise required for the renewal of two incinerators, as well as USD 6 million annual operation and maintenance costs.
Municipal initiatives
x Yokohama An inspiration for Green City Action Plans. This is a good example of the need to stress other aspects than infrastructure in the type of green city policies to be designed. Public awareness and behaviour have conditioned in many cases the success or behaviours of green city actions.
City of Tokyo’s Cap and Trade
The Tokyo cap-and-trade program is the
world’s first urban cap-and-trade Municipal initiatives
x Tokyo An inspiration for Green City Action Plans

58
programme: launched on April 1, 2010,
program, requiring CO2 reductions from large commercial, government and industrial buildings through on-site energy efficiency measures or participation in the emissions trading scheme.
Stockholm’s eco-district
Stockholm has demonstrated how
integrated and collaborative planning and management can transform an old inner city industrial area into an attractive and ecologically sustainable district - based on a cyclical urban metabolism. The district is seamlessly integrated into the larger urban fabric, and has provided inspiration for more initiatives in the city and catalysed change. Some of the initial results have been a 30% reduction in non-renewable energy use, a 41% reduction in water use, and a 29% reduction in global warming potential.
Municipal initiatives
x Stockholm An inspiration for Green City Action Plans. The case of Stockholm shows the importance of land-use
Reykjavik’s use of renewable energy
In the City of Reykjavik, 100% of
electricity comes from geothermal energy, and 81% in the transport and heat sectors.
Municipal initiatives
x Reykjavik Probably not a useful inspiration for EBRD cities, unless some cities possess similar geothermal resources. But it shows well the impact of cities’ specific profiles on its ability to go green.
Lyon’s eco-district
The City of Lyon has re-developed an
old industrial and logistics area into new eco-district called Confluence, in the 2
nd
district (“arrondissement”). Within this new district, three buildings named “Hikari” (“light”, in Japanese) have been developed as positive-energy buildings. By combining smart architectural design, ICT such as sensors and energy-efficient technology, these building can produce more energy than they consume
Municipal initiatives
x Lyon An inspiration for Green City Action Plans Possibility of technology diffusion in EBRD cities?
Kitakyushu’s clean industries policy
In addition to environmental benefits, the energy efficiency of Kitakyushu’s iron
and steel manufacturing makes this sector an asset for the city’s green growth agenda. Kitakyushu’s iron and steel industry offers a range of products
Municipal initiatives
x Kitakyushu An example of economic benefits associated with green policies (here energy efficiency in industries). It also shows that realising the green city is not necessarily a trade-off between

59
with advanced energy performance, such as flat rolls, magnetic steel sheets, thin sheets or surface-treated steel sheets. Besides iron and steel, successful energy-efficient and resource-saving products from a number of traditional local industries contribute strongly to Kitakyushu’s growth. The local ceramic, chemical and electric manufacturing industries successfully sell resource-saving products to national and international markets
growth and green.
PRIVATE SECTOR INITIATIVES
Veolia Environnement
Veolia Environnement is a branch of
Veolia, a multinational utility company. The main stakes identified by Veolia Environnement include: climate change, natural resources, sustainable urban development, and ecosystem and biodiversity. Their business in sustainable urban development includes traditional models (management of water, power, solid waste services) and creative solutions, which mainly involve digital technologies or ICT.
Infrastructure management
x x x All continents (the presence in Eastern Europe and Central Asia is not strong, however)
This is a good example of how private companies may contribute to green cities through urban utility management in the world.
Cisco’s Smart+Connected
Cisco’s Smart+Connected solution
portfolio includes remote access to government services as well as Infrastructure Management solutions for connected parking, traffic, and safety and security. Smart+Connected solutions include:
Smart city x x All countries (potentially)
To be considered for the green city action plan
Siemens’ Green Cities Index
Siemens’ Green Cities Index scores
cities across 8 categories and 30 individual indicators (see Annex 2) Siemens also promotes IT and automation for transport, energy management and green buildings
Smart city x x All countries (potentially)
To be considered for the green city action plan
Google Sidewalk Labs
Google has recently launched in 2015
the Sidewalk Labs focusing on smart cities.
Smart city All countries (potentially)
Too recent for assessment, but promising
IBM intelligent IBM has developed integrated intelligent Smart city x x x x All countries To be considered for the green
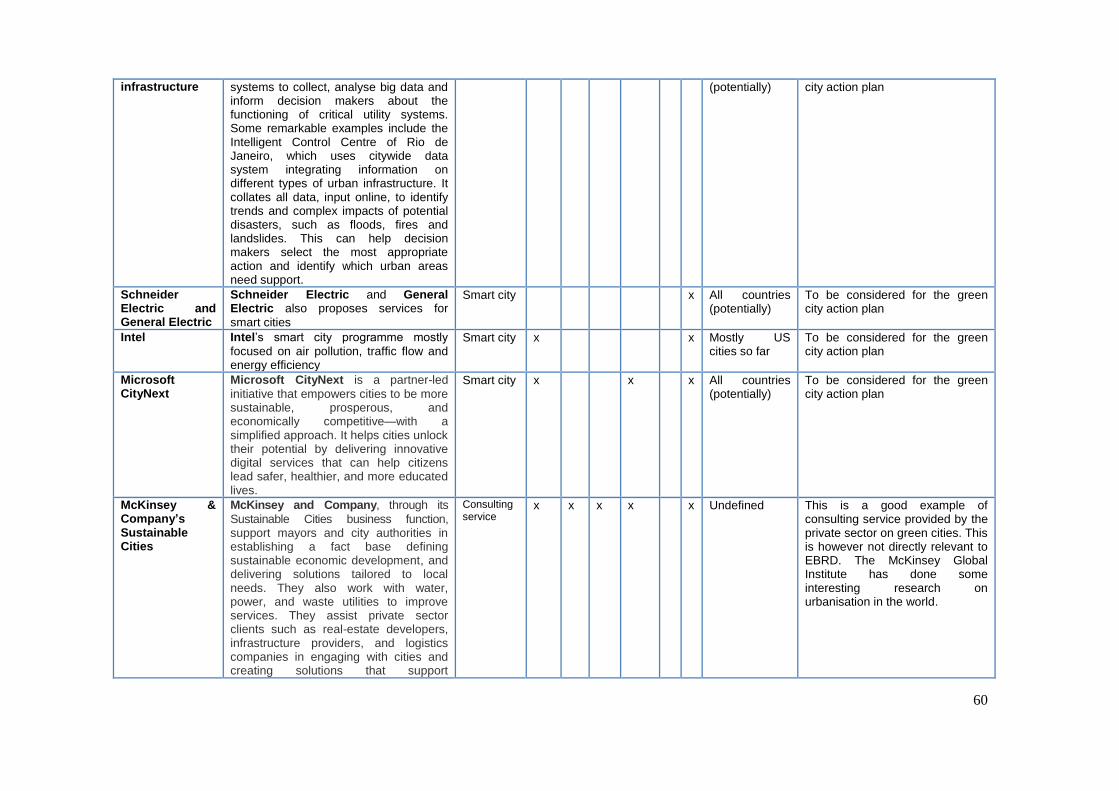
60
infrastructure systems to collect, analyse big data and inform decision makers about the functioning of critical utility systems. Some remarkable examples include the Intelligent Control Centre of Rio de Janeiro, which uses citywide data system integrating information on different types of urban infrastructure. It collates all data, input online, to identify trends and complex impacts of potential disasters, such as floods, fires and landslides. This can help decision makers select the most appropriate action and identify which urban areas need support.
(potentially) city action plan
Schneider Electric and General Electric
Schneider Electric and General Electric also proposes services for
smart cities
Smart city x All countries (potentially)
To be considered for the green city action plan
Intel Intel’s smart city programme mostly
focused on air pollution, traffic flow and energy efficiency
Smart city x x Mostly US cities so far
To be considered for the green city action plan
Microsoft CityNext
Microsoft CityNext is a partner-led
initiative that empowers cities to be more sustainable, prosperous, and economically competitive—with a simplified approach. It helps cities unlock their potential by delivering innovative digital services that can help citizens lead safer, healthier, and more educated lives.
Smart city x x x All countries (potentially)
To be considered for the green city action plan
McKinsey & Company’s Sustainable Cities
McKinsey and Company, through its
Sustainable Cities business function, support mayors and city authorities in establishing a fact base defining sustainable economic development, and delivering solutions tailored to local needs. They also work with water, power, and waste utilities to improve services. They assist private sector clients such as real-estate developers, infrastructure providers, and logistics companies in engaging with cities and creating solutions that support
Consulting service
x x x x x Undefined This is a good example of consulting service provided by the private sector on green cities. This is however not directly relevant to EBRD. The McKinsey Global Institute has done some interesting research on urbanisation in the world.

61
sustainability goals. Finally, they help shape strategies to capture growth opportunities by developing district development plans, revitalising older cities, and building greenfield cities.
CIVIL SOCIETY ACTIVITIES
Solid waste collection in Surabaya, Indonesia
Surabaya is the capital of the East Java
Province and the second largest city in Indonesia. Rapid and uncontrolled urbanisation resulted in a range of environmental issues in the city by the mid-2000s, including solid waste pollution due to unsorted garbage and open waste disposal. The city set up a solid waste management programme base on community involvement. 420 Environmental Facilitators were appointed and trained by the local government. They were recruited from community leaders, young generation and cadres of the Family Welfare Programme (PKK). They role is to further raise awareness of the population about the need to preserve the environment and drop habits that result in local pollution, such as open waste dumping.
Civil society activity initiated by the municipality
x Surabaya, Indonesia
A potential inspiration for the green city action plan, if a city faces high problems of solid waste collection. This exampled shows how a municipality can take leadership in creating CSO activities for green cities.
Urban farming in Boston, USA
Boston is home to at least 200
community gardens with another 100 or so in local schools. Two of the most well-known are the Fenway Victory Gardens, the oldest continuously operating WWII “Victory Gardens” in the country, and the Boston Food Forest Coalition, which is pioneering biodiverse food ecosystems to help bring healthy produce to underserved neighbourhoods. In 2013, a city ordinance allowed the diversification of such activities (to beekeeping for instance) and their expansion on rooftops.
Community initiative supported by the municipality
x Boston, USA This example takes a reverse approach from Surabaya. It shows that municipalities can support existing community initiatives through regulations and incentives.

62
ANNEX 2. ENVIRONMENTAL ACTIVITIES IN TBILISI AND YEREVAN
Tbilisi, Georgia
Organisation Description Type of activity Sector of relevance
Date / Timeframe
URL
Municipality of Tbilisi / World Bank (Cities Alliance) / UNDP / GTZ
The City Development Strategy 2030 sets four
broad objectives: worldwide connectivity competitiveness, liveability, and governance. It integrates objectives of the SEAP (cf. below). In order to support the CDS, the World Bank set up the Participatory Capital Investment Planning and Budgeting project in 2011 (until 2013).
Development plan + Action plan
Transport Housing provision Green spaces WSS Solid waste Disaster risk
2010 https://www.google.fr/url?sa=t&rct=j&q=&esrc=s&source=web&cd=1&cad=rja&uact=8&ved=0ahUKEwjK9aCI4MDMAhWJcBoKHfL3BawQFggcMAA&url=http%3A%2F%2Fwww.economicforum.ge%2Fupload%2Ffiless%2Fled_forum_7%2FMr.%2520Zviad%2520Archuadze_ENG.pdf&usg=AFQjCNHI-QZglYJrO55K6U_tH-M3-69WCg&sig2=KMCV7VaZ4FEmHCh9NV3vjw&bvm=bv.121099550,d.d2s&safe=active
Municipality of Tbilisi and Covenant of Mayors
The 2011-2020 Sustainable Energy Action Plan (SEAP) supports Tbilisi’s objective of
becoming a low-carbon city by 2020, in line with the objective of the Covenant of Mayors
Action plan Transport Energy efficiency in buildings Power supply Solid waste Wastewater Green Spaces
2011-2020 http://www.energy-cities.eu/db/Tbilisi_SEAP_2011_en.pdf
Municipality of Tbilisi
Tbilisi Sea Eco-Green City aims to be a new
green eco-district with energy efficient housing supplied at 90% by renewable energy
Infrastructure project
Renewable energy Energy efficiency
2016 http://cbw.ge/business/1-billion-to-be-invested-in-tbilisi-sea-eco-green-city/
Municipality of Tbilisi
The Energy Efficiency Concept Paper
contains estimation of energy saving potential and energy analyses for various energy consuming sectors in Tbilisi region.
Study Energy efficiency (transport, buildings, water supply, street lighting, solid waste)
2008 Not available online.

63
ADB The updated Tbilisi Sustainable Urban Transport (SUT) Strategy defines policy
directions and prioritizes interventions along a multimodal and integrated approach to be gradually implemented between 2015 and 2030, phased over short (2015-2017), medium (2018-2021) and long (2022-2030) terms.
Study Transport (all modes)
2015 Not available online.
ADB A bid for a pre-feasibility Study (PFS) on BRT
was prepared following the first Tbilisi SUT strategy 2015-2030. There is no information whether expressed was interest by a consulting firm. The deadline was February 2016.
Study Transport (BRT) 2010
https://www.devex.com/projects/tenders/supporting-the-cities-development-initiative-for-asia-geo-tbilisi-bus-network-improvement-and-bus-rapid-transit-pre-feasibility-47285-001/198693
GIZ The report Prospects for an Establishment of an Energy Agency in Tbilisi assesses how to
establish a unit that implements the projects listed in the SEAP, as required by the rules of the Covenant of Mayors
Study Energy 2011 http://www.economicforum.ge/upload/filess/Energy%20Agency%20Tbilisi_Feasibility%20Study_Final%20Version_21_12_2011.pdf
Mobility Consultants / MLA+ / Move Mobility
Three Dutch companies delivered the report Smart Mobility Tbilisi, financed by the
Embassy of the Netherlands in Tbilisi. The report makes recommendations on strategic network planning, bicycle infrastructure, public space, and parking.
Study Transport Land-use
2014 Not available online.
UNEP The goal of Geo-Cities Tbilisi is to improve
environmental decision-making and promote integrated environmental assessment as a key instrument for informed decision making on important municipal-level environment and security issues. Furthermore, the project aims at building capacity of municipalities in urban environmental planning and management, and integrated environmental assessment (IEA) at the local level, in cooperation with civil society organisations.
Study + capacity building
WSS Solid Waste Energy Green spaces Transport Disaster risk
2011 http://www.unep.org/geo/pdfs/GEO-Cities_Tbilisi_Full-report.pdf
World Bank ECA The report Improving energy efficiency in Tbilisi uses TRACE (Tool for Rapid
Assessment of City Energy), a simple and quick diagnostic tool that is used to assess a city’s energy performance in six service areas (urban transport, municipal buildings, water and wastewater, solid waste management, public
Study Energy efficiency (in transport, WSS, Solid Waste, Buildings) Power supply and heat Street lighting
2011 https://databox.worldbank.org/Energy-Efficient-Cities/TRACE-Georgia-Tbilisi-Deployment/gqug-h75d
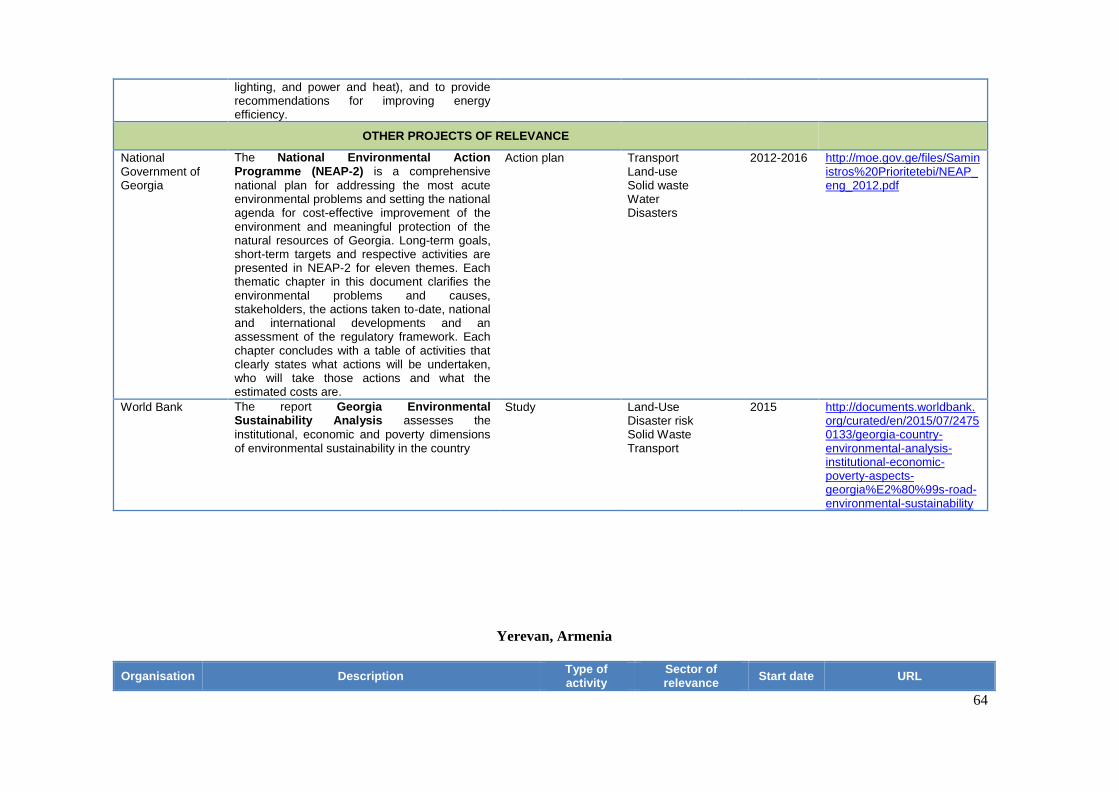
64
lighting, and power and heat), and to provide recommendations for improving energy efficiency.
OTHER PROJECTS OF RELEVANCE
National Government of Georgia
The National Environmental Action Programme (NEAP-2) is a comprehensive
national plan for addressing the most acute environmental problems and setting the national agenda for cost-effective improvement of the environment and meaningful protection of the natural resources of Georgia. Long-term goals, short-term targets and respective activities are presented in NEAP-2 for eleven themes. Each thematic chapter in this document clarifies the environmental problems and causes, stakeholders, the actions taken to-date, national and international developments and an assessment of the regulatory framework. Each chapter concludes with a table of activities that clearly states what actions will be undertaken, who will take those actions and what the estimated costs are.
Action plan Transport Land-use Solid waste Water Disasters
2012-2016 http://moe.gov.ge/files/Saministros%20Prioritetebi/NEAP_eng_2012.pdf
World Bank The report Georgia Environmental Sustainability Analysis assesses the
institutional, economic and poverty dimensions of environmental sustainability in the country
Study Land-Use Disaster risk Solid Waste Transport
2015 http://documents.worldbank.org/curated/en/2015/07/24750133/georgia-country-environmental-analysis-institutional-economic-poverty-aspects-georgia%E2%80%99s-road-environmental-sustainability
Yerevan, Armenia
Organisation Description Type of activity
Sector of relevance
Start date URL
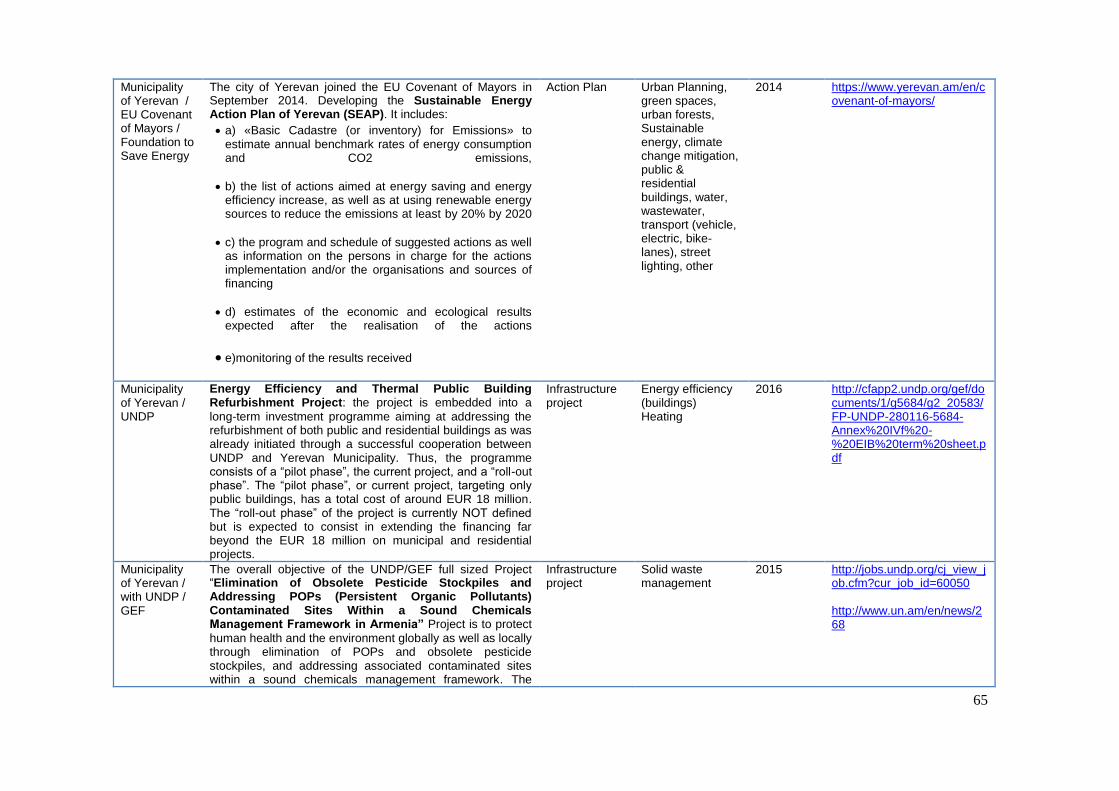
65
Municipality of Yerevan / EU Covenant of Mayors / Foundation to Save Energy
The city of Yerevan joined the EU Covenant of Mayors in September 2014. Developing the Sustainable Energy Action Plan of Yerevan (SEAP). It includes:
a) «Basic Cadastre (or inventory) for Emissions» to estimate annual benchmark rates of energy consumption and CO2 emissions,
b) the list of actions aimed at energy saving and energy efficiency increase, as well as at using renewable energy sources to reduce the emissions at least by 20% by 2020
c) the program and schedule of suggested actions as well as information on the persons in charge for the actions implementation and/or the organisations and sources of financing
d) estimates of the economic and ecological results expected after the realisation of the actions
e)monitoring of the results received
Action Plan Urban Planning, green spaces, urban forests, Sustainable energy, climate change mitigation, public & residential buildings, water, wastewater, transport (vehicle, electric, bike-lanes), street lighting, other
2014 https://www.yerevan.am/en/covenant-of-mayors/
Municipality of Yerevan / UNDP
Energy Efficiency and Thermal Public Building Refurbishment Project: the project is embedded into a
long-term investment programme aiming at addressing the refurbishment of both public and residential buildings as was already initiated through a successful cooperation between UNDP and Yerevan Municipality. Thus, the programme consists of a “pilot phase”, the current project, and a “roll-out phase”. The “pilot phase”, or current project, targeting only public buildings, has a total cost of around EUR 18 million. The “roll-out phase” of the project is currently NOT defined but is expected to consist in extending the financing far beyond the EUR 18 million on municipal and residential projects.
Infrastructure project
Energy efficiency (buildings) Heating
2016 http://cfapp2.undp.org/gef/documents/1/g5684/g2_20583/FP-UNDP-280116-5684-Annex%20IVf%20-%20EIB%20term%20sheet.pdf
Municipality of Yerevan / with UNDP / GEF
The overall objective of the UNDP/GEF full sized Project “Elimination of Obsolete Pesticide Stockpiles and Addressing POPs (Persistent Organic Pollutants) Contaminated Sites Within a Sound Chemicals Management Framework in Armenia” Project is to protect
human health and the environment globally as well as locally through elimination of POPs and obsolete pesticide stockpiles, and addressing associated contaminated sites within a sound chemicals management framework. The
Infrastructure project
Solid waste management
2015 http://jobs.undp.org/cj_view_job.cfm?cur_job_id=60050 http://www.un.am/en/news/268

66
Global Environment Facility (GEF) provided a USD 4.7 million grant to initiate the project, while an additional USD 19 million co-funding will be provided by the Government of Armenia, international organisations and the private sector in order to successfully accomplish this project’s goals. The City of Yerevan.
Municipality of Yerevan / UNDP / GEF
The overarching goal of the Green Urban Lighting project
is to save energy and to reduce emissions of greenhouse gases by increasing energy efficiency of municipal lighting in the cities of Armenia via implementation of municipal investment programs and national policies. The project focuses on urban lighting sector, which covers all lighting installations managed and paid for by municipalities, such as lighting of streets, outside public areas, illumination of city buildings, lighting system in municipally-owned and operated buildings and facilities, and yards in residential areas
Infrastructure project
Energy 2015 http://www.am.undp.org/content/armenia/en/home/operations/projects/environment_and_energy/green-urban-lighting.html
Municipality of Yerevan
The municipality of Yerevan announced that green areas
will be expanded starting from 2012. There is no information available on the status of this project.
Infrastructure project
Green spaces 2012 http://news.am/eng/news/94296.html
Government of Armenia / ADB
The Government of Armenia has received a loan from the Asian Development Bank (ADB) to finance the Sustainable Urban Development Investment Program (SUDIP) –
Project 1 and Project 2. This project derives from a request from the Yerevan Municipality (YM) to ADB to define a strategic plan to improve urban transport in Yerevan aligned with the urban master plan of Yerevan city. However, the infrastructure project in Yerevan is mainly focused on road construction and extension.
Infrastructure project and capacity building
Road construction and extension
2015-2020 http://www.sudipyerevan.am/en/ http://www.adb.org/projects/42417-023/main http://www.adb.org/projects/42417-023/main
ADB Through the Sustainable Urban Transport Project, ADB is
helping Armenia upgrade its urban transport services in 12 major and secondary cities. The first tranche of the multi-tranche financing facility includes road improvements in the capital, Yerevan, and institutional development and capacity building.
Infrastructure project (road)
Transport 2009-2011 (closed)
http://www.adb.org/projects/42417-012/main#project-pds
UNDP UNDP has completed a Strategic Environmental Assessment (SEA) of Yerevan’s Master Plan in 2005. The
main objective was to provide recommendations for environmental optimising and modifications of the Yerevan City Master Plan.
Study Air pollution Water Solid waste Green areas
2005 https://www.unece.org/fileadmin/DAM/env/eia/documents/SEA_CBNA/Armenia_SEA_Yerevan_en.pdf
OTHER PROJECTS OF RELEVANCE (NON-SPECIFIC TO YEREVAN)
National Government /
The main purpose of the National Program on Energy Saving and Renewable Energy is to set targets for the
Development Plan
Energy efficiency Renewable energy
2007 http://www.ase.org/sites/ase.org/files/national_program_e

67
USAID / Alliance to Save Energy
energy saving and renewable energy development in Armenia and to determine the means for their realisation. It is directed at solving the following problems: 1. Plan the development of energy resources of the
country parallel to the advancement of energy saving and renewable energy, taking into account that increased energy efficiency usually has a low-cost nature.
2. Synchronise the state policy on development of fuel-energy resources with the growth of the economy as a whole. This guarantees country-wide sustainable development through the introduction of regulatory reforms and an increase in public participation throughout the process.
3. Direct the finance and credit policy of the country to energy saving and renewable energy development, providing equal conditions for capital investment.
4. Establish and maintain an active market structure through introduction and explanation of energy efficiency benefits, providing an effective choice mechanism for market participants.
5. Organise, promote and provide equal accessibility to modern technologies for all members of society, consumer and corporate alike.
The project was also supported by the Alliance to Save Energy.
nglish.pdf
USAID / Alliance to Save Energy
Armenia’s Urban Heating Policy Assessment report
describes the evolution and current state of Armenia’s heat supply system, and the recent policy developments in the country’s heat supply rehabilitation in the context of energy sector legislation. The paper further summarises the involvement of international organisations, donor-funded heat sector programs and pilot projects, and the centralised and individual heat supply options available to urban households
Study Heating 2006 https://www.habitat.org/sites/default/files/heating20-armenia_uh_analysis.pdf

68
ANNEX 3. GREEN CITY INDICATORS: LITERATURE REVIEW
Name of organisation / study
Description Category of indicator Assessment
International Standard Organisation (ISO)
ISO 37120:2014 defines and establishes methodologies for a set of indicators to steer and measure the performance of city services and quality of life. The standard’s uniform approach will enable cities to seamlessly compare where they stand in relation to other cities. This information can in turn be used to identify best practice and learn from one another.
Economy
Education
Energy
Environment
Finance
Fire and Emergency Response
Governance
Health
Recreation
Shelter
Solid Waste
Telecommunication and Innovation
Transportation
Urban Planning
Wastewater
Water and Sanitation
ISO 37120 is very comprehensive and assesses cities’ performance beyond the scope of the green city concept.
Siemens’ Green City Index
Siemens’ European Green City Index scores cities
across eight categories – CO2 emissions, energy, building, transport, water, waste and land-use, air quality and environmental governance – and 30 individual indicators (16 quantitative indicators measuring how a city is currently performing and 14 qualitative indicators assessing the cities’ aspirations to reduce their future environmental impacts). Siemens also applied similar index to other continents.
CO2
Energy
Buildings
Transport
Waste and land-use
Water
Air Quality
Environmental Governance
Siemens’s Index is much focused on the environment, and also integrates the “response” aspects (i.e. policies) into the indicators.
It does not contain analysis of green city action planning, although the case studies of cities analysed provide information on the type of policies undertaken there
European Green Participating cities are judged on an evolving indicator set: Contribution to climate change Emphasis is placed on improving

69
Capital Award 37 indicators that cover nine categories of urban environmental sustainability. The Award is based on 12 indicators related to environmental areas.
Transport
Green urban areas
Nature and biodiversity
Air quality
Noise
Waste production and management
Water consumption
Wastewater treatment
Eco-innovation and sustainable employment
Local environmental governance
Energy performance
performance over time, which is rather innovative. There is no specific indicator provided however and seems a bit too subjective. The policy aspect is also central to the indicators.
Global City Indicators Programme
This focuses on two main themes: city services and quality of life. The tool covers all aspects of urban life, with an emphasis on economic and social measures of sustainability.
Education
Governance
Health
Recreation
Urban Planning
Safety
Solid Waste
Transport
Wastewater
Water
Electricity
Finance
Fire and Emergency Response
Civic engagement
Culture
Economy
Environment
Shelter
Social Equity
Technology and Innovation
It does not measure pollution or air quality and there is little mention of renewable energy sources.
Star Community Rating System
The Sustainability Tools for Assessing and Rating Communities (STAR) Community Rating System is a toolbox developed for community leaders in the USA to assess the sustainability of their community, set targets for the future, and measure progress along the way.
Built Environment
Equity and Improvement
Climate and Energy
Health and Safety
The indicators were developed over time by a number of technical advisory committees, and will continue to be adjusted as necessary. The tool includes economic, environmental and social aspects of
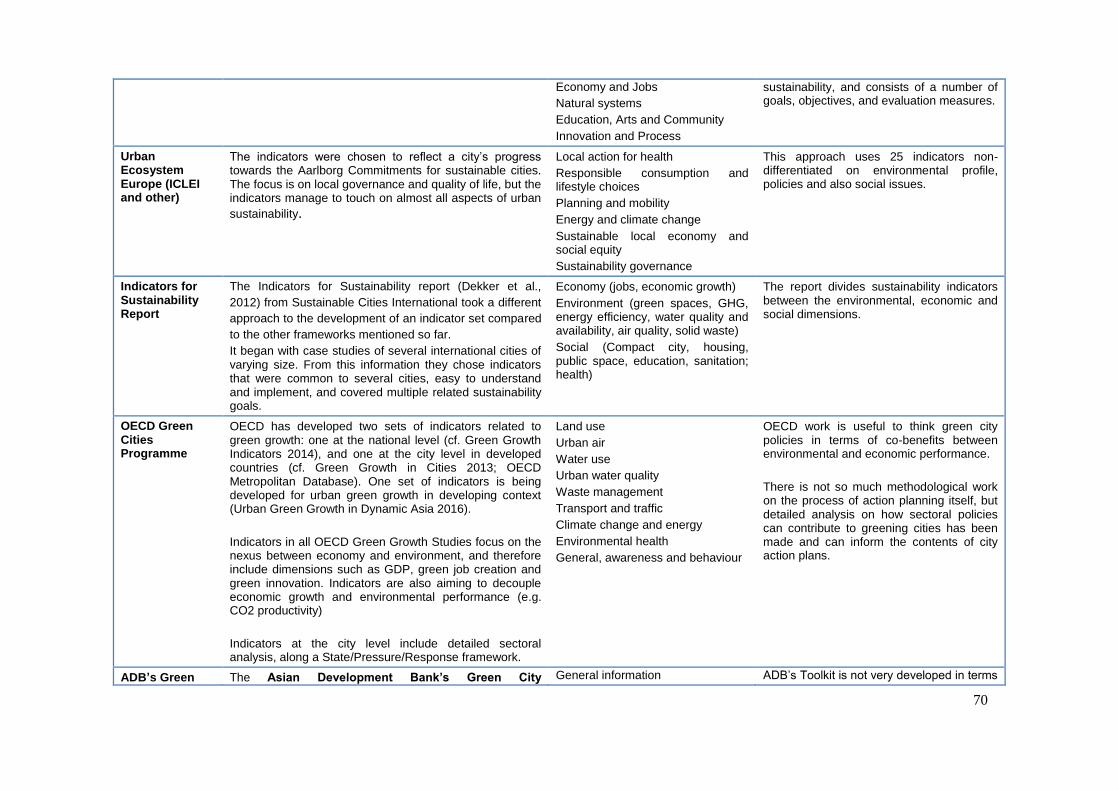
70
Economy and Jobs
Natural systems
Education, Arts and Community
Innovation and Process
sustainability, and consists of a number of goals, objectives, and evaluation measures.
Urban Ecosystem Europe (ICLEI and other)
The indicators were chosen to reflect a city’s progress towards the Aarlborg Commitments for sustainable cities. The focus is on local governance and quality of life, but the indicators manage to touch on almost all aspects of urban
sustainability.
Local action for health
Responsible consumption and lifestyle choices
Planning and mobility
Energy and climate change
Sustainable local economy and social equity
Sustainability governance
This approach uses 25 indicators non-differentiated on environmental profile, policies and also social issues.
Indicators for Sustainability Report
The Indicators for Sustainability report (Dekker et al.,
2012) from Sustainable Cities International took a different
approach to the development of an indicator set compared
to the other frameworks mentioned so far.
It began with case studies of several international cities of varying size. From this information they chose indicators that were common to several cities, easy to understand and implement, and covered multiple related sustainability goals.
Economy (jobs, economic growth)
Environment (green spaces, GHG, energy efficiency, water quality and availability, air quality, solid waste)
Social (Compact city, housing, public space, education, sanitation; health)
The report divides sustainability indicators between the environmental, economic and social dimensions.
OECD Green Cities Programme
OECD has developed two sets of indicators related to green growth: one at the national level (cf. Green Growth Indicators 2014), and one at the city level in developed countries (cf. Green Growth in Cities 2013; OECD Metropolitan Database). One set of indicators is being developed for urban green growth in developing context (Urban Green Growth in Dynamic Asia 2016).
Indicators in all OECD Green Growth Studies focus on the nexus between economy and environment, and therefore include dimensions such as GDP, green job creation and green innovation. Indicators are also aiming to decouple economic growth and environmental performance (e.g. CO2 productivity)
Indicators at the city level include detailed sectoral analysis, along a State/Pressure/Response framework.
Land use
Urban air
Water use
Urban water quality
Waste management
Transport and traffic
Climate change and energy
Environmental health
General, awareness and behaviour
OECD work is useful to think green city policies in terms of co-benefits between environmental and economic performance.
There is not so much methodological work on the process of action planning itself, but detailed analysis on how sectoral policies can contribute to greening cities has been made and can inform the contents of city action plans.
ADB’s Green The Asian Development Bank’s Green City General information ADB’s Toolkit is not very developed in terms

71
City Development Toolkit
Development Toolkit (2015) adopts an approach in 3
steps for green cities: i) establishment of the city profile and context; ii) prioritisation and option; and iii) Project design and evaluation.
In the first step, ADB recommends to establish a general profile of the city that includes not only key infrastructure to be considered but also other contextual information such as geography and finance. The Toolkit does not provide detailed indicators to assess the city’s needs but rather give an example of city profile template that should be developed by each city to establish its profile. ADB then proposes to complement it with a needs/gaps assessment matrix for each infrastructure sector, with information on environment, policy and governance, financial management and implementation.
The prioritisation step is based on the needs assessment matrix in each sector, and includes three thematic areas for investment: improvement of existing services, new proposals and special projects.
Location and climate Land use composition Ecological / natural features Financial profile Infrastructure services Housing Green initiatives Land-use Planning and urban management system Disaster management and mitigation
of indicators, scoring and benchmarking. They have a traffic light approach but there are no baseline definitions or benchmarking, therefore the assessment is mostly left to cities’ appraisal. It also means the prioritisation process is a bit subjective.
IADB’s ESCI ESCI employs a multidisciplinary approach to identify, organise and prioritise urban interventions to tackle the main roadblocks that prevent the sustainable growth of emerging cities in Latin America and the Caribbean.
This transversal approach is based on three pillars: (i) environmental and climate change sustainability, (ii) urban sustainability, and (iii) fiscal sustainability and governance. The approach is broader than green city.
Environmental Sustainability and Climate Change (water, sanitation and drainage, solid waste, energy, air quality, mitigation of climate change, noise, vulnerability to climate change disasters)
Urban Sustainability (land-use, inequality, transportation, competitiveness of the economy, employment, connectivity, education, security, health)
Fiscal Sustainability and Governance (participatory public management, modern public management, transparency, tax and financial autonomy, expenditure management, debt)
ESCI provides comprehensive indicators that can apply to a green city but also include other indicators to grasp the whole concept of sustainability (e.g. finance, institutions, social issues) which may not all be relevant for EBRD work. A lot of efforts have been made on benchmarking and scoring each indicator, which should be useful for the present report. The work lacks a prioritisation between all indicators which are all considered equally important.
ESCI also includes recommendations on action planning. The proposal may be too linear and does not take into account the cyclical process of city action planning.

72
ANNEX 4. INTERNATIONAL BEST PRACTICES FOR PRIORITISING AND BENCHMARKING GREEN CITY ACTIONS
Reference Description Assessment
Asian Development Bank (ADB)’s Green City Development Toolkit
The Asian Development Bank’s Green City Development Toolkit (2015)
adopts an approach in 3 steps for green cities: i) establishment of the city profile and context; ii) prioritisation; and iii) project design and evaluation. There is no benchmarking methodology in this study.
The prioritisation step is based on an assessment matrix identifying strategic interventions, implementation mechanisms, and preliminary ranking by priority. The matrix analyses priorities in each green city sector according to three types of projects: existing services, new proposals and special interventions. The goal of the matrix is to carry a detailed green city gap analysis. First, it highlights current deficiencies in green city investment (infrastructure, service delivery, resources, etc.); and second, it highlights where information or data is absent and what additional work is required to enable robust decision making and investment programming. In each of the three types of projects, the priority matrix assesses four elements: i) environment, ii) policy and governance, iii) financial, and iv) implementation. A traffic light approach is recommended to assess each of these four elements.
An interesting aspect of this methodology is that it combines directly environment assessment with policy, financial and governance assessments in each green city sector. It gives a more specific understanding of the need and range of implementation issues by sector (IADB’s ESCI for instance has indicators on institutional aspects but not specifically tied to green city sectors).
The prioritisation methodology is not straightforward. There are some inconsistencies between the explanations in the text and the methodology presented in the priority matrix. Also, the category “environment” in the matrix is unclear. The traffic light approach is also very subjective, and not very much based on scientific baseline or literature (the three “lights” do not correspond to a quantitative division). There is no information on whether such toolkit was actually applied and what the lessons learnt are.
Inter-American Development Bank (IADB)’s Environmental and Sustainable Cities Initiative (ESCI)
ESCI employs a multidisciplinary approach to identify, organise and prioritise urban interventions to tackle the main roadblocks that prevent the sustainable growth of emerging cities in Latin America and the Caribbean.
One of the steps of the methodology is the establishment of cities’ profile, based on a set of indicators in (i) environmental and climate change sustainability, (ii) urban sustainability, and (iii) fiscal sustainability and governance. A traffic light scanner is applied to each indicator to classify their value as “green” (sustainable, good performance), “yellow” (potentially
This study is not specifically about benchmarking, although the thorough indicator methodology could be used to compare cities’ performance.
Nonetheless, IADB’s ESCI appears to be the most complete methodology on prioritisation, through a robust indicator base and legible filter approach to identify priorities.

73
problematic performance), or “red” (unsustainable, highly problematic performance). This step is eventually considered as one filter for prioritisation (out of 5 in total). The topics that are classified red, or critical, are then evaluated and prioritised based on four filters: i) public opinion (how important this issue is to the citizens), ii) economic impacts, iii) vulnerability to climate change (impact of climate change on this topic or mitigation problems associated with this topic), and iv) multi-sectorality. The performance of each indicator reading each filter is given a performance from 1 to 5. In total, there are 5 filters. The final prioritisation step is to give an overall priority score to each topic, based on the performance on the 5 filters. The overall figure is calculate using coefficient for each filter (e.g. traffic light = 30%). With the city’s input and approval, the three to five topics with the highest scores after these prioritisation exercises are selected to be the subject of the action plan.
The study is broader than green cities, but the specific part on “environmental and climate change sustainability” could be used in the green cities methodology. Some elements in the “urban sustainability” part are however also relevant to green cities and this is confusing. A “state-pressure-response” approach integrating both may help to make more sense of the relationships that link green city indicators together.
The filter approach can also be used for the green cities methodology as a prioritisation strategy. Social impacts could be used as an additional filter.
The filter methodology may be too complicated or time-consuming. There is a strange discrepancy between the filters used to prioritise in the general guide and those in the Annex on Indicators.
Clean Development Initiative for Asian Cities (CDIA)’s City Infrastructure Investment Programming and Prioritisation Toolkit
The aim of the toolkit is to help city governments in Asia undertake the task of programming and prioritising strategic urban investments, in order to make a priority investment package ready to be presented to financiers and project developers. The process is composed of 3 steps: i) Analysis of the city/local government’s financial condition and capacity to finance future capital projects (It comprises a (quantitative) assessment of the municipality’s fiscal data as well as a (qualitative) assessment of the financial management capacity). The data are used to make a projection of the local budget available for investment; ii) Assessment of the quality of proposed projects. Uses both qualitative and quantitative data. It requires input from a variety of people and agencies within the city administration; and iii) Based on the outcomes of Steps 1 and 2, develop investment packages with a 5-year horizon. The second step starts with a wish list of projects of city administrators, and is not based on a review of the performance of the city in different sectors. The prioritisation in step 2 is based on 40 questions grouped in 5 filters: project purpose, public response, environmental impact, socio-economic impacts, and feasibility of implementation. Each filter is given a score from 0 to 10; each filter has an equal weight (20%) in the final score.
The methodology is not very specific to green cities, despite the mandate of CDIA. But the principles can also be applied to environmental projects.
The methodology is relatively different from ADB and IADB as it starts with an assessment of financial capacity, and not of environmental issues.
CDIA’s methodology is less thorough and scientific than IADB’s ESCI. The initial identification of projects is subjective (a wish list of city administrators) and there is no room in the process for the integration of “needs” based on indicators (the “impacts” aspect is given more importance).
Centre for Low Carbon The approach of the CLCF has been to develop a robust model for This is a study meant to prioritise low carbon city
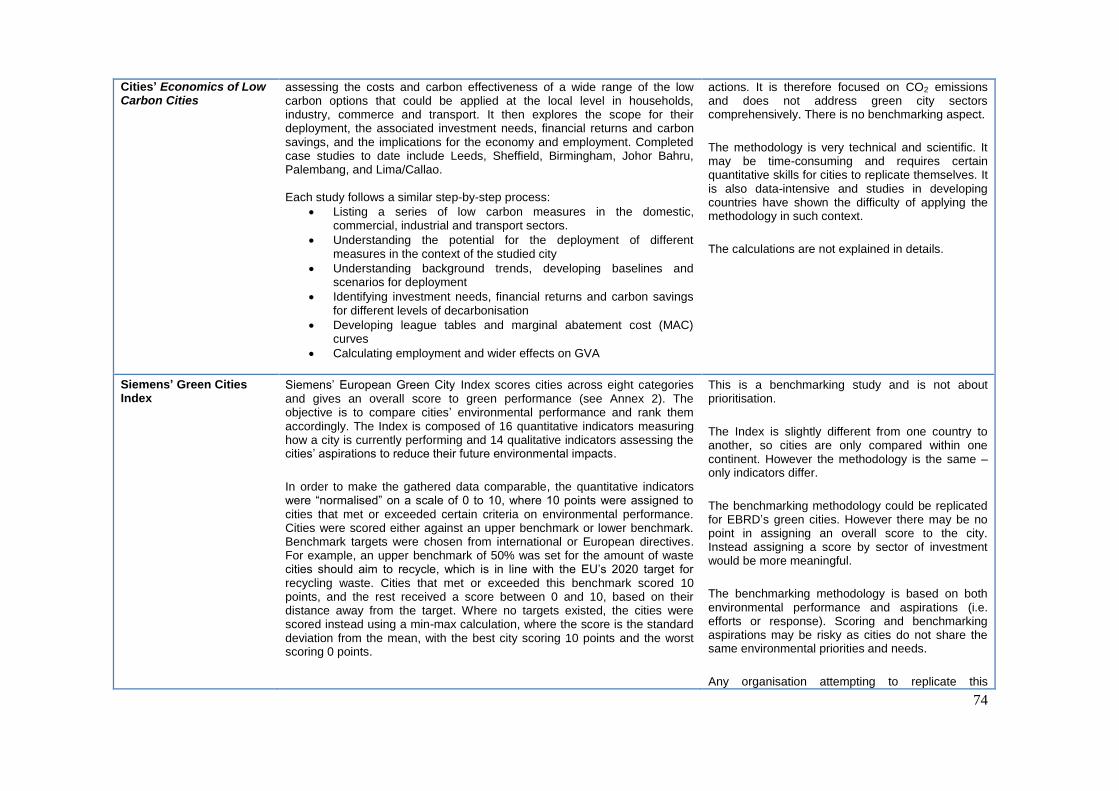
74
Cities’ Economics of Low Carbon Cities
assessing the costs and carbon effectiveness of a wide range of the low carbon options that could be applied at the local level in households, industry, commerce and transport. It then explores the scope for their deployment, the associated investment needs, financial returns and carbon savings, and the implications for the economy and employment. Completed case studies to date include Leeds, Sheffield, Birmingham, Johor Bahru, Palembang, and Lima/Callao. Each study follows a similar step-by-step process:
Listing a series of low carbon measures in the domestic, commercial, industrial and transport sectors.
Understanding the potential for the deployment of different measures in the context of the studied city
Understanding background trends, developing baselines and scenarios for deployment
Identifying investment needs, financial returns and carbon savings for different levels of decarbonisation
Developing league tables and marginal abatement cost (MAC) curves
Calculating employment and wider effects on GVA
actions. It is therefore focused on CO2 emissions and does not address green city sectors comprehensively. There is no benchmarking aspect.
The methodology is very technical and scientific. It may be time-consuming and requires certain quantitative skills for cities to replicate themselves. It is also data-intensive and studies in developing countries have shown the difficulty of applying the methodology in such context.
The calculations are not explained in details.
Siemens’ Green Cities Index
Siemens’ European Green City Index scores cities across eight categories and gives an overall score to green performance (see Annex 2). The objective is to compare cities’ environmental performance and rank them accordingly. The Index is composed of 16 quantitative indicators measuring how a city is currently performing and 14 qualitative indicators assessing the cities’ aspirations to reduce their future environmental impacts.
In order to make the gathered data comparable, the quantitative indicators were “normalised” on a scale of 0 to 10, where 10 points were assigned to cities that met or exceeded certain criteria on environmental performance. Cities were scored either against an upper benchmark or lower benchmark. Benchmark targets were chosen from international or European directives. For example, an upper benchmark of 50% was set for the amount of waste cities should aim to recycle, which is in line with the EU’s 2020 target for recycling waste. Cities that met or exceeded this benchmark scored 10 points, and the rest received a score between 0 and 10, based on their distance away from the target. Where no targets existed, the cities were scored instead using a min-max calculation, where the score is the standard deviation from the mean, with the best city scoring 10 points and the worst scoring 0 points.
This is a benchmarking study and is not about prioritisation.
The Index is slightly different from one country to another, so cities are only compared within one continent. However the methodology is the same – only indicators differ.
The benchmarking methodology could be replicated for EBRD’s green cities. However there may be no point in assigning an overall score to the city. Instead assigning a score by sector of investment would be more meaningful.
The benchmarking methodology is based on both environmental performance and aspirations (i.e. efforts or response). Scoring and benchmarking aspirations may be risky as cities do not share the same environmental priorities and needs.
Any organisation attempting to replicate this

75
Qualitative indicators were scored by Economist Intelligence Unit analysts with expertise in the city in question, based on objective scoring criteria that considered concrete actions, strategies and targets being taken and set by cities.
The index is composed of aggregate scores of all of the underlying indicators. The index is first aggregated by category — creating a score for each area of infrastructure and policy (for example, energy) — and finally. Overall, based on the composite of the underlying category scores. To create the category scores, each underlying indicator was aggregated according to an assigned weighting. To build the overall index scores, the Economist Intelligence Unit assigned even weightings on each category score, and the index is essentially the sum of all category scores, rebased out of 100. A performance “web’ is also displayed to see the performance of each city by sector.
methodology must bear in mind that it requires some significant quantitative skills.
European Green Capital Award
The European Green Capital Award assesses cities according to 12 environmental indicator areas.
Each applicant cities is asked to provide data in each of the 12 areas. An expert panel from EDCA then provides a ranking of cities’ green performance. This ranking is derived as a result of primary expert assessment, clarification from the cities and peer review from another expert. This information is now presented to the Jury in the form of this report together with a number of proposed shortlisted cities. The number and list of shortlisted cities chosen to proceed to the next stage will be the ultimate decision of the Jury. The Jury will assess the shortlisted cities based on the following evaluation criteria: i) The city’s overall commitment, vision and enthusiasm as conveyed through the presentation; ii) The city’s capacity to act as a role model to inspire other cities, promote best practices and spread the EGC model further – bearing in mind city size and location; and iii) The city’s communication actions.
Experts use a defined ranking system. Under this ranking system a position of 1st, 2nd, 3rd etc. is applied to each city per indicator. Since there are 12 applications to be evaluated then each city must be ranked from 1st as the best to 12th the weakest. These are not quantitative scores but rankings. The overall ranking of the city is calculated computing the 12 scores.
This is a benchmarking study and is not about prioritisation.
EGCA is less scientific and thorough than Siemens’ Green Cities Index. There is no absolute scoring but rather a comparative ranking of cities. Required indicators are sometimes quantitative but there is no clear link between the data and the ranking of applicant cities in each of the 12 environmental areas. The ranking is therefore largely left to experts’ appraisal.
This methodology clearly shows the difficulty of basing benchmarking on scientific procedures. The lack of comparative data is also mentioned as an issue.
City Blueprints The City Blueprints study covers 24 key indicators divided over eight broad categories: water security, water quality, drinking water, sanitation, infrastructure, climate robustness, biodiversity and attractiveness as well as governance. The indicators are scored on a scale between 0 (very poor
This is a benchmarking study and is not about prioritisation.

76
performance) to 10 (excellent performance).
The overall score of the sustainability of UWCS of the city is expressed as Blue City Index (BCI). The BCI is the arithmetic mean of the 24 indicators comprising the City Blueprint and has a theoretical minimum and maximum of 0 and 10, respectively. The BCI is represented as a performance web to visualise the performance of the city with regard to each of the 24 indicators.
City Blueprints is also less scientific and thorough than Siemens’ Green Cities Index. Required indicators are sometimes quantitative but there is no clear link between the data and the 0-10 score applied to each indicator. The benchmarking methodology is therefore not very accurate.
Source: Authors

77
ANNEX 5. PRESSURE-STATE-RESPONSE INDICATORS FOR GREEN CITIES
Green City indicators are structured along the Pressure-State-Response framework laid out in Section 3.2. An additional sub-classification between
“core” indicators (highlighted in blue-coloured cells) and “elective” or “optional” indicators (white-coloured cells) is proposed for the “state” and
“pressure” categories only, so as to narrow down the number of indicators to be used for the benchmarking and prioritisation process. The “optional”
indicators corresponding to each “core” indicator are listed in terms of priority (i.e. if Indicator 1 is not available, Indicator 1.1 should be the first
choice to replace it, then 1.2 etc.). In total, there are 70 proposed indicators (9 in the “state” category; 26 in the “pressure” category; and 35 in the
“response” category). Adding optional indicators, there are 114 proposed indicators (20 in the “state” category; 59 in the “pressure” category; 35 in
the response category).
State indicators10
Topic Indicator Unit Benchmarks Source of
benchmark Trend
Additional indicator (example)
QUALITY OF ENVIRONMENTAL ASSETS
AIR
1 Average annual concentration of PM2.5
µg/m3 < 10 (annual) 10–20 (annual) > 20 (annual)
Based on WHO
Sources of air pollution (in %) for each particle (PM10, PM2.5, SO2, NOx)
1.1 Average annual concentration of PM10
µg/m3 < 20 (annual) 20–50 (annual) > 50 (annual)
1.2 Average daily concentration of SO2
µg/m3 < 20 (24 hour) 20–50 (24 hour) > 50 (24 hour)
1.3 Average annual concentration of NOx
µg/m3 < 40 (annual) 40–80 (annual) > 80 (annual)
WATER 2 Biochemical Oxygen Demand (BOD) in
mg/L < 2 2–4 > 4 Based on
Sources of water
10
Blue-coloured cells refer to core indicators; white-coloured cells refer to elective (or optional) indicators

78
BODIES rivers and lakes EEA pollution (in surface and ground water)
2.1 Ammonium (NH4) concentration in rivers and lakes
µg/L < 150 150–200 > 200
DRINKING WATER
3
Percentage of water samples in a year that comply with national potable water quality standards
% > 97 90–97 < 90 IADB
SOIL
4 Number of contaminated sites
CSs / 1000 inh.(or km
2)
< 10 10–20 > 20 Based on
EEA
Sources of soil contamination
4.1a
Concentration of mercury in soil
mg/kg < 0.3 0.3 – 10 > 10 Dutch Values
4.1b
Concentration of cadmium in soil
mg/kg < 0.8 0.8 – 12 > 12 Dutch Values
4.1c
Concentration of zinc in soil
mg/kg < 140 140 – 720 > 720 Dutch Values
4.2 Concentration of mineral oil in soil (using infrared spectroscopy)
mg/kg < 50 50 – 5000 > 5000 Dutch Values
AVAILABILITY OF RESOURCES
WATER USE 5 Water Exploitation Index
% < 20 20–40 > 40 Based on
EEA
Total water consumption
Water consumption by sector (domestic, commercial, industrial, agriculture)
LAND USE
6 Open green space area ratio per 100 000 inhabitant
Hectares > 10 7–10 < 7 IADB
Share of population within 15 minutes of open green space by foot 6.1
Share of green space areas within urban limits
% > 50 30–50 < 30 OECD/ICLE
I

79
BIODIVERSITY AND ECOSYSTEMS
7 Abundance of bird species (all species)
Annual % of change
Positive or stable
Slight decline (of 0%-2%)
Strong decline (> 2%)
OECD / ICLEI
Sources of biodiversity degradation
Biodiversity index of specific species 7.1
Abundance of other species
Annual % of change
Positive or stable
Slight decline Strong decline OECD / ICLEI
CLIMATE CHANGE RISKS
MITIGATION (GHG EMISSIONS)
8 Annual CO2 equivalent emissions per capita
Tonne / year / capita
< 5 5–10 >10 IADB
Total CO2 emissions
CO2 emissions by sector 8.1
Annual CO2 emissions per unit of GDP
Tonne / USD of GDP
< 0.35 0.35–0.8 > 0.8 IADB
ADAPTATION (RESILIENCE TO NATURAL DISASTER RISKS)
9
Estimated economic damage from natural disasters (floods, droughts, earthquakes etc.) as a share of GDP
% < 0.5 0.5–1 > 1 OECD / ICLEI
Human casualties
Main type of disaster that hit the city
9.1 Percentage of public infrastructure at risk
% < 10% 10–20% > 20% IADB Type of
infrastructure at risk
9.2 Percentage of households at risk
% < 10% 10–20% > 20% IADB
Type of household at risk (by income level and by location)
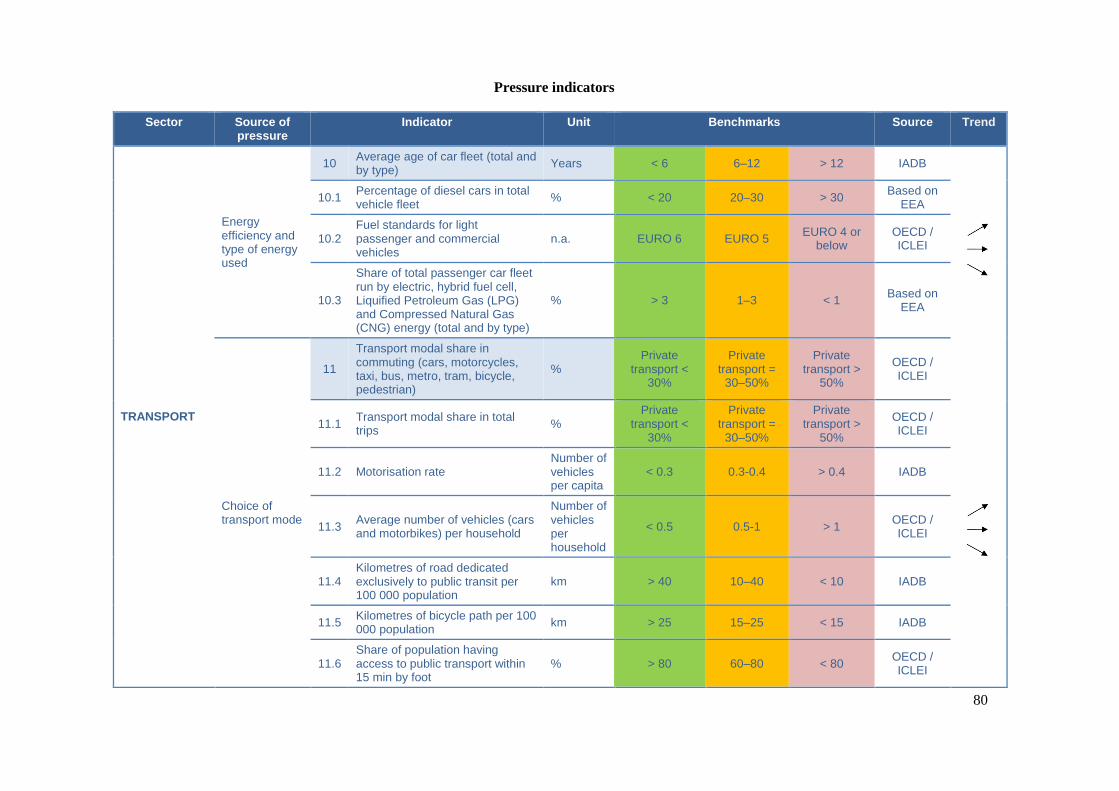
80
Pressure indicators
Sector Source of pressure
Indicator Unit Benchmarks Source Trend
TRANSPORT
Energy efficiency and type of energy used
10 Average age of car fleet (total and by type)
Years < 6 6–12 > 12 IADB
10.1 Percentage of diesel cars in total vehicle fleet
% < 20 20–30 > 30 Based on
EEA
10.2 Fuel standards for light passenger and commercial vehicles
n.a. EURO 6 EURO 5 EURO 4 or
below OECD / ICLEI
10.3
Share of total passenger car fleet run by electric, hybrid fuel cell, Liquified Petroleum Gas (LPG) and Compressed Natural Gas (CNG) energy (total and by type)
% > 3 1–3 < 1 Based on
EEA
Choice of transport mode
11
Transport modal share in commuting (cars, motorcycles, taxi, bus, metro, tram, bicycle, pedestrian)
% Private
transport < 30%
Private transport =
30–50%
Private transport >
50%
OECD / ICLEI
11.1 Transport modal share in total trips
% Private
transport < 30%
Private transport =
30–50%
Private transport >
50%
OECD / ICLEI
11.2 Motorisation rate Number of vehicles per capita
< 0.3 0.3-0.4 > 0.4 IADB
11.3 Average number of vehicles (cars and motorbikes) per household
Number of vehicles per household
< 0.5 0.5-1 > 1 OECD / ICLEI
11.4 Kilometres of road dedicated exclusively to public transit per 100 000 population
km > 40 10–40 < 10 IADB
11.5 Kilometres of bicycle path per 100 000 population
km > 25 15–25 < 15 IADB
11.6 Share of population having access to public transport within 15 min by foot
% > 80 60–80 < 80 OECD / ICLEI
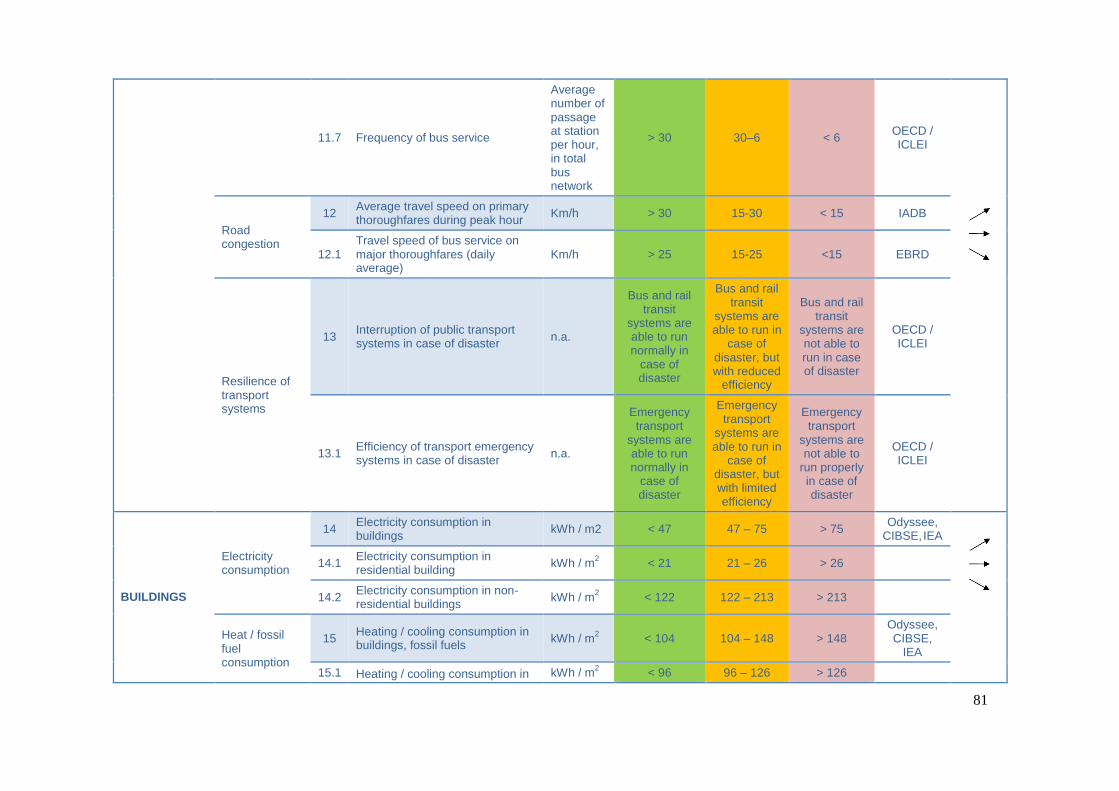
81
11.7 Frequency of bus service
Average number of passage at station per hour, in total bus network
> 30 30–6 < 6 OECD / ICLEI
Road congestion
12 Average travel speed on primary thoroughfares during peak hour
Km/h > 30 15-30 < 15 IADB
12.1 Travel speed of bus service on major thoroughfares (daily average)
Km/h > 25 15-25 <15 EBRD
Resilience of transport systems
13 Interruption of public transport systems in case of disaster
n.a.
Bus and rail transit
systems are able to run normally in
case of disaster
Bus and rail transit
systems are able to run in
case of disaster, but with reduced
efficiency
Bus and rail transit
systems are not able to run in case of disaster
OECD / ICLEI
13.1 Efficiency of transport emergency systems in case of disaster
n.a.
Emergency transport
systems are able to run normally in
case of disaster
Emergency transport
systems are able to run in
case of disaster, but with limited efficiency
Emergency transport
systems are not able to
run properly in case of disaster
OECD / ICLEI
BUILDINGS
Electricity consumption
14 Electricity consumption in buildings
kWh / m2 < 47 47 – 75 > 75 Odyssee,
CIBSE, IEA
14.1 Electricity consumption in residential building
kWh / m2 < 21 21 – 26 > 26
14.2 Electricity consumption in non-residential buildings
kWh / m2 < 122 122 – 213 > 213
Heat / fossil fuel consumption
15 Heating / cooling consumption in buildings, fossil fuels
kWh / m2
< 104 104 – 148 > 148 Odyssee, CIBSE,
IEA
15.1 Heating / cooling consumption in kWh / m2 < 96 96 – 126 > 126

82
residential buildings, fossil fuels
15.2 Heating / cooling consumption in non-residential buildings, fossil fuels
kWh / m2 < 127 127 – 210 > 210
Building standards
15.3 Share of city enterprises with ISO50001/EMAS certification or similar
% NA NA NA
15.4
Total value of projects with green building certification as a share of the total value of projects granted a building permit per year
% > 50 25-50 < 25 OECD / ICLEI
INDUSTRIES
Electricity consumption
16 Electricity consumption in industries, per unit of industrial GDP
kWh / 2010 USD
< 0.3 0.3 - 0.4 > 0.4 OECD / ICLEI
Heat consumption
17 Heat consumption in industries, per unit of industrial GDP
MJ / 2010 USD
< 0.1 0.1 – 0.25 > 0.25 OECD / ICLEI
Consumption of fossil fuels in industrial processes
18 Heavy metals (Pb) emission intensity of manufacturing industries
kg heavy metals equivalent released per million USD GVA
< 0.02 0.02-0.04 > 0.04 Based on
EEA
18.1 Fossil fuel combustion in industrial processes, per unit of industrial GDP
MJ / USD < 1.4 1.4 – 2.2 > 2.2 OECD / ICLEI
18.2 Share of industrial energy consumption from renewable energy
% > 20 10–20 < 10 OECD / ICLEI
Industrial waste treatment
19 Share of industrial waste recycled as a share of total industrial waste produced
% > 95% (90%) 80 – 95%
(90%) < 80%
OECD / ICLEI
Industrial wastewater
20
Percentage of industrial wastewater that is treated according to applicable national standards
% > 60 40–60 < 40 OECD / ICLEI
ENERGY Electricity provision
21 Share of population with an authorised connection to electricity
% > 90 70–90 < 70 IADB
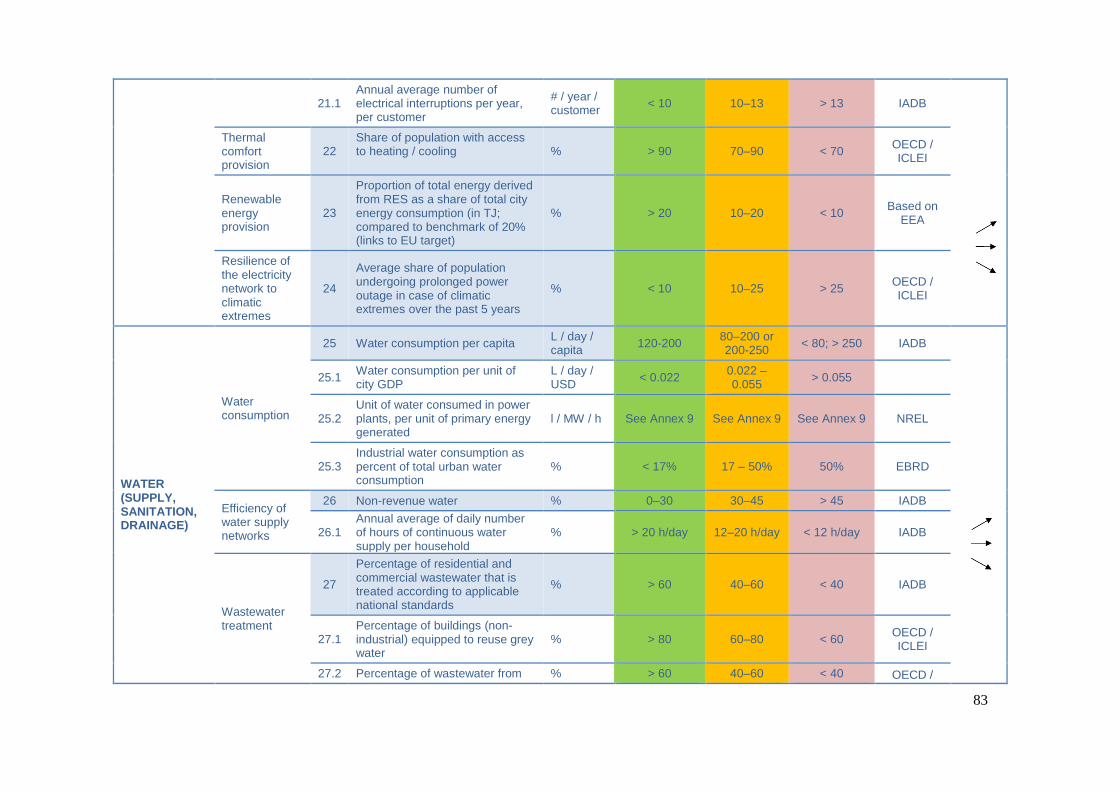
83
21.1 Annual average number of electrical interruptions per year, per customer
# / year / customer
< 10 10–13 > 13 IADB
Thermal comfort provision
22 Share of population with access to heating / cooling % > 90 70–90 < 70
OECD / ICLEI
Renewable energy provision
23
Proportion of total energy derived from RES as a share of total city energy consumption (in TJ; compared to benchmark of 20% (links to EU target)
% > 20 10–20 < 10 Based on
EEA
Resilience of the electricity network to climatic extremes
24
Average share of population undergoing prolonged power outage in case of climatic extremes over the past 5 years
% < 10 10–25 > 25 OECD / ICLEI
WATER (SUPPLY, SANITATION, DRAINAGE)
Water consumption
25 Water consumption per capita L / day / capita
120-200 80–200 or 200-250
< 80; > 250 IADB
25.1 Water consumption per unit of city GDP
L / day / USD
< 0.022 0.022 – 0.055
> 0.055
25.2 Unit of water consumed in power plants, per unit of primary energy generated
l / MW / h See Annex 9 See Annex 9 See Annex 9 NREL
25.3 Industrial water consumption as percent of total urban water consumption
% < 17% 17 – 50% 50% EBRD
Efficiency of water supply networks
26 Non-revenue water % 0–30 30–45 > 45 IADB
26.1 Annual average of daily number of hours of continuous water supply per household
% > 20 h/day 12–20 h/day < 12 h/day IADB
Wastewater treatment
27
Percentage of residential and commercial wastewater that is treated according to applicable national standards
% > 60 40–60 < 40 IADB
27.1 Percentage of buildings (non-industrial) equipped to reuse grey water
% > 80 60–80 < 60 OECD / ICLEI
27.2 Percentage of wastewater from % > 60 40–60 < 40 OECD /

84
energy generation activities that is treated according to applicable national standards
ICLEI
Resilience to floods
28 Percentage of dwellings damaged by the most intense flooding in the last 10 years
% < 0.5 0.5–3 > 3 IADB
28.1 Annual number of storm water/sewerage overflows per 100km of network length
Number of events per year
< 20 20–50 > 50 OECD / ICLEI
28.2 Awareness and preparedness to natural disasters
n.a.
Citizens are well aware of
natural disaster risk
and know how to react
Citizens are aware of natural
disaster risk but do not
have resilient attitudes
Citizens are not aware of
natural disaster risks
and do not have resilient
attitudes
OECD / ICLEI
SOLID WASTE
Solid waste generation
29 Total solid waste generation per capita
Kg / year / capita
< 300 300–500 > 500 OECD/ ICLEI
29.1 GDP per domestic material consumption
USD / kg < 1 1-2.5 > 2.5 Based on
OECD (2014)
Collection of solid waste
30 Share of the population with weekly municipal solid waste (MSW) collection
% 90–100 80–90 < 80 IADB
Treatment of solid waste
31
Proportion of MSW that is sorted and recycled (total and by type of waste e.g. paper, glass, batteries, PVC, bottles, metals)
% > 25 15–25 < 15 IADB
31.1
Percentage of MSW which is disposed of in open dumps, controlled dumps, or bodies of water or is burnt
% < 10 10–20 > 20 IADB
31.2 Percentage of MSW landfilled disposed of in EU-compliant sanitary landfills
% 90–100 80–90 < 80 IADB
31.3 Percentage of collected MSW composted
% > 20 5–20 < 5 IADB

85
Landfill efficiency / capacity
32 Remaining life of current landfill(s)
Years > 8 5–8 < 5 IADB
LAND-USE
Density / Integrated land-use
33 Population density on urban land Residents / km
2
7000–20000 4000-7000;
20000-25000
<4000; >25000
IADB
33.1 Average commuting distance km > 5 5–10 <10 OECD / ICLEI
33.2 Average commuting time min < 30 30–60 > 60 OECD / ICLEI
33.3
Proportion of the population living within 20 minutes to everyday services (grocery stores, clinics, etc.)
% > 75 50–75 < 50 OECD / ICLEI
Urban sprawl
34 Average annual growth rate of built-up areas
% < 3 3–5 > 5 IADB
34.1 Percentage of urban development that occurs on existing urban land rather than on greenfield land
% > 40 20-40 < 20 OECD / ICLEI
Use of existing built-up areas
35 Vacancy rates of offices % < 6% 6 – 10% > 10% OECD / ICLEI
35.1 Share of multi-family houses in total housing units
% NA NA NA OECD / ICLEI

86
Response Indicators
Sector Item # Indicator Benchmarks
TRANSPORT
Energy efficiency and type of energy used in transport
36 High-polluting vehicles are regulated / Energy-efficient vehicles are incentivised through fiscal instruments
Existing and well
implemented, and there is no significant need
to further expand this
type of response
Existing, but implementation challenges have been observed, and/or existing policies are not
sufficient to solve the issue at stake
Not existing
Choice of transport mode
37 Extension and improvement of public and non-motorised transport is planned and supported through investment in place
38 Public and non-motorised transport is promoted through Information and awareness campaigns
Congestion 39 Traffic demand is managed (congestion charges, smart technologies)
Resilience of transport systems
40 Public transport emergency management (in publicly and/or privately run networks) is planned and tested
BUILDINGS Electricity and heat consumption
41 Green building is promoted through standards and fiscal incentives
Existing and well
implemented, and there is no significant need
to further expand this
type of response
Existing, but implementation challenges have been observed, and/or existing policies are not
sufficient to solve the issue at stake
Not existing 42 Public and private investment in energy efficiency in buildings
43 Metering and billing for personal energy use is regulated
INDUSTRIES
Electricity and heat consumption / energy efficient industrial processes
44 Energy efficient industrial machinery is regulated and incentivised through fiscal instruments (electricity, heat, industrial processes) Existing and
well implemented,
and there is no significant need
to further expand this
type of response
Existing, but implementation challenges have been observed, and/or existing policies are not
sufficient to solve the issue at stake
Not existing
45 Energy efficient industrial technologies (electricity, heat, industrial processes) is supported through private investment
Industrial waste / material consumption
46 Material efficiency of new built industrial facilities and waste recycling is regulated and incentivised through fiscal instruments
Industrial wastewater
47 Industrial wastewater treatment / reuse / recycle is promoted through regulations and fiscal incentives
ENERGY
Electricity and heat provision
48 Coverage and quality of electricity and heat supply is improved through investment
Existing and well
implemented,
Existing, but implementation challenges have
Not existing
Renewable 49 Renewable energy facilities in private buildings are incentivised

87
energy development
through fiscal instruments and there is no significant need
to further expand this
type of response
been observed, and/or existing policies are not
sufficient to solve the issue at stake
50 Renewable energy technologies are developed and supported through public and private investment
51 Renewable energy facilities are incentivised through awareness campaigns
Resilience of the electricity network
52 The resilience of electricity networks in case of disaster is tested and enhanced through investment
WATER (SUPPLY, SANITATION, DRAINAGE)
Water consumption
53 Metering and billing for water use is regulated
Existing and well
implemented, and there is no significant need
to further expand this
type of response
Existing, but implementation challenges have been observed, and/or existing policies are not
sufficient to solve the issue at stake
Not existing
54 Water saving / reuse is encouraged through awareness campaigns
Efficiency of water supply networks
55 Coverage and efficiency of water supply networks is improved through plans and investment
Wastewater treatment
56 Buildings’ access to wastewater collection and treatment systems is improved through plans and investment
57 Wastewater treatment is promoted through regulations and fiscal incentives
58 Wastewater billing is regulated
Drinking water pre-treatment
59 Drinking water pre-treatment is enhanced through plans and investment
Resilience to floods
60 Drainage facilities are developed through plans and investment
61 Business and community resilience is encouraged through awareness campaigns
SOLID WASTE
Solid waste generation
62 Reduction of material consumption / solid waste generation is promoted through awareness campaigns
Existing and well
implemented, and there is no significant need
to further expand this
type of response
Existing, but implementation challenges have been observed, and/or existing policies are not
sufficient to solve the issue at stake
Not existing
Collection of solid waste
63 Coverage of solid waste collection system is improved through plans and investment
64 Littering and non-compliance to sorting systems is dis-incentivised through fines and penalties
Treatment of solid waste
65 Composting, recycling and waste-to-energy facilities are developed through plans and investment
66 Solid waste reuse, sorting and recycling is promoted through information and awareness campaigns
Landfill efficiency and overcapacity
67 Overcapacity issues in landfills are tackled through plans and investment

88
LAND-USE
Density / Integrated land-use / urban sprawl
68 Density is regulated Existing and well
implemented, and there is no significant need
to further expand this
type of response
Existing, but implementation challenges have been observed, and/or existing policies are not
sufficient to solve the issue at stake
Not existing
69 Transit-Oriented Development is promoted
Use of existing built-up areas
70 Mixed-use development is promoted through zoning regulations / incentives

89
ANNEX 6. DEFINITION OF GREEN CITY INDICATORS
Topic Indicator Unit Definition / Description Source
AIR
1 Average annual concentration of PM2.5
µg/m3
Particulate matter in suspension, with a diameter lower than 2.5µm, annual average. The data should be collected twice a month through sensors in multiple locations of the city, and averaged. The locations should reflect the diversity of urban areas (residential, roadside, industrial zones, parks etc.)
http://www.who.int/mediacentre/factsheets/fs313/en/
1.1 Average annual concentration of PM10
µg/m3
Particulate matter in suspension, with a diameter lower than 10µm, annual average. The data should be collected twice a month through sensors in multiple locations of the city, and averaged. The locations should reflect the diversity of urban areas (residential, roadside, industrial zones, parks etc.)
1.2 Average daily concentration of SO2
µg/m3
Sulphur dioxide in suspension 24-hour average. The data should be collected twice a month through sensors in multiple locations of the city, and averaged. The locations should reflect the diversity of urban areas (residential, roadside, industrial zones, parks etc.)
1.3 Average annual concentration of NO2
µg/m3
Nitrogen dioxide in suspension, annual average. The data should be collected twice a month through sensors in multiple locations of the city, and averaged. The locations should reflect the diversity of urban areas (residential, roadside, industrial zones, parks etc.)
WATER BODIES
2 Biochemical Oxygen Demand (BOD) in rivers and lakes
mg/L
BOD shows how much dissolved oxygen is needed for the decomposition of organic matter present in water. The data should be collected in several locations of each river / lake, twice a month
http://www.eea.europa.eu/data-and-maps/indicators/freshwater-quality/freshwater-quality-assessment-published-may-2 2.1
Ammonium (NH4) concentration in rivers and lakes
µg/L
Ammonium concentrations are normally raised as a result of organic pollution, caused by discharges from waste water treatment plants, industrial effluents and agricultural runoff. The data should be collected in several locations of each river / lake, twice a month.

90
DRINKING WATER
3
Percentage of water samples in a year that comply with national potable water quality standards
% The data should be collected in several locations the water supply network. Ideally the quality of water should be frequently measured to avoid health hazards (once a week)
IADB’s ESCI
SOIL
4 Number of contaminated sites
CSs / 1000 inh.
The term 'contaminated site' (CS) refers to a well-defined
area where the presence of soil contamination has been confirmed and this presents a potential risk to humans, water, ecosystems or other receptors. Risk management measures, e.g. remediation, may be needed depending on the severity of the risk of adverse impacts to receptors under the current or planned use of the site. Sensitive areas, such as industrial zones and solid waste disposal sites, should be covered.
http://www.eea.europa.eu/data-and-maps/indicators/progress-in-management-of-contaminated-sites-3/assessment
4.1a – 4.1c
Concentration of heavy metals (Pb) in soil
mg/kg
Concentration of (a) mercury, (b) cadmium and (c) zinc in soil. Other heavy metals that could be measured include chromium, arsenic, lead, copper and nickel. The data should be collected in multiple locations of the city, twice a month. Sensitive areas, such as industrial zones and solid waste disposal sites, should be covered. Benchmarks follow standards set by the Dutch Ministry of Housing, Spatial Planning and the Environment.
4.2 Concentration of mineral oil in soil
mg/kg
The data should be collected in multiple locations of the city, twice a month. Sensitive areas, such as industrial zones should be covered. Benchmarks follow standards set by the Dutch Ministry of Housing, Spatial Planning and the Environment.
WATER 5 Water Exploitation Index
% The Water Exploitation Index Plus (WEI+) is the total water use as a percentage of the renewable freshwater resources in a given territory and time scale.
http://www.eea.europa.eu/data-and-maps/indicators/use-of-freshwater-resources-2/assessment-1
GREEN SPACES
6 Open green space area ratio per 100 000 inhabitant
Hectares Hectares of permanent green space per 100,000 city residents. The data should be compiled bi-annually.
IADB’s ESCI
6.1 Share of non-built-up areas within urban limits
% This indicator measures the amount of green, blue and vacant land within urban limits. The data should be compiled bi-annually.
OECD / ICLEI
BIODIVERSITY AND
7 Abundance of bird species
Annual % of change
This indicator measures the percentage of change in bird population in one year. The data for the whole city can be estimated from a sample of an inventory of bird population in a
http://www.eea.europa.eu/data-and-maps/indicators/abundance

91
ECOSYSTEMS given area. The data should be compiled once a year -and-distribution-of-selected-species/abundance-and-distribution-of-selected-2
7.1 Abundance of other species
Annual % of change
This indicator measures the percentage of change in a given species population in one year. The data for the whole city can be estimated from a sample of an inventory of bird population in a given area. The data should be compiled once a year
MITIGATION (GHG EMISSIONS)
8 Annual CO2 emissions per capita
Tonne / year / capita
CO2 emissions of the city, divided by city population. This indicator controls for the size of city population. Estimates of CO2 emissions must first be made within each sector (transport, electricity etc.) and averaged. The data should be compiled once a month.
IADB’s ESCI
8.1 Annual CO2 emissions per unit of GDP
Tonne / USD of GDP
CO2 emissions, divided by the GDP of the city. The data should be compiled once a month.
IADB’s ESCI
ADAPTATION (RESILIENCE TO NATURAL DISASTER RISKS)
9
Estimated economic damage from natural disasters (floods, droughts, earthquakes etc.) as a share of GDP
%
This indicator should measure overall losses (not only uninsured losses). Usually a city already has such data. Otherwise, the information may be found in the EM-DAT database or the NatCatService database. If such data is not available, data on past damages can be used (as an average of damages over the past 10 years).
http://www.eea.europa.eu/data-and-maps/indicators/direct-losses-from-weather-disasters-1/assessment
9.1 Percentage of public infrastructure at risk of natural disaster
%
Percentage of public infrastructure vulnerable to natural disasters due to inadequate construction or placement in areas of non-mitigable risk. This requires an identification of urban areas exposed to a disaster (e.g. located in a low-lying area, exposed to a landslide…) together with information about the quality of housing in such areas. The data should be collected based on a selected climatic / geological event (e.g. 10-year flood, if flood is the most common type of disaster that usually hit the city). The data should be collected bi-annually.
IADB’s ESCI
9.2 Percentage of households at risk of natural disaster
%
Percentage of households vulnerable to natural disasters due to inadequate construction or placement in areas of non-mitigable risk. This requires an identification of urban areas exposed to a disaster (e.g. located in a low-lying area, exposed to a landslide…) together with information about the quality of housing in such areas. The data should be collected based on a selected climatic / geological event (e.g. 10-year flood, if flood is the most common type of disaster that usually hit the city). The data should be collected bi-annually. The data should be collected bi-annually.
IADB’s ESCI

92
Pressure Indicators
Sector Indicator Unit Definition / Description URL
TRANSPORT
10 Average age of car fleet (total and by type)
Years The data can be compiled from the vehicle registration database of the municipality, once a year.
IADB’s ESCI
10.1 Percentage of diesel cars in total vehicle fleet
% The data can be compiled from the vehicle registration database of the municipality, once a year.
http://www.eea.europa.eu/data-and-maps/indicators/size-of-the-vehicle-fleet/size-of-the-vehicle-fleet-2
10.2 Fuel standards for light passenger and commercial vehicles
n.a. Adoption of latest EURO standards or equivalent for light passenger and commercial vehicles.
http://ec.europa.eu/environment/air/transport/road.htm
10.3 Share of total passenger car fleet run by alternative energy (total and by type)
%
Alternative energy here refers to LPG, natural gas and electric. The data can be compiled from the vehicle registration database of the municipality, once a year.
http://www.eea.europa.eu/data-and-maps/indicators/proportion-of-vehicle-fleet-meeting-4/assessment
11 Transport modal share in commuting
%
The number of commuters working in the subject city who use each mode of transport (cars, motorcycles, taxi, bus, metro, tram, bicycle, pedestrian) divided by the number of commuting trips to work. Surveys are a common data collection method. The data can be collected bi-annually.
IADB’s ESCI
11.1 Transport modal share in total trips
%
The number of commuters working in the subject city who use each mode of transport (cars, motorcycles, taxi, bus, metro, tram, bicycle, pedestrian) divided by the number of all trips in the city. Surveys are a common data collection method. The data can be collected bi-annually.
OECD / ICLEI
11.2 Motorisation rate Number of vehicles per capita
Number of private vehicles (cars, motorcycles) per capita. This can be calculated by dividing the total number of vehicles (obtained from the vehicle registration database) by the population. The data can be collected bi-annually.
http://www.eea.europa.eu/data-and-maps/indicators/size-of-the-vehicle-fleet/size-of-the-vehicle-fleet-2
11.3 Average number of vehicles (cars and motorbikes) per household
Number of vehicles per
Number of private vehicles (cars, motorcycles) per household. This can be calculated by dividing the total number of
OECD / ICLEI

93
household vehicles (obtained from the vehicle registration database) by the number of households. The data should be collected bi-annually.
11.4
Kilometers of road dedicated exclusively to public transit per 100 000 population
km
The total centreline kilometres dedicated exclusively to bus way and rail way, divided by 100,000 of city population. The data should be collected once a year.
IADB’s ESCI
11.5 Kilometers of bicycle path per 100 000 population
km
The total centreline kilometres dedicated to bicycle path, divided by 100,000 of city population. The data should be collected once a year.
IADB’s ESCI
11.6 Share of population having access to public transport within 15 min by foot
%
Share of population that can reach a public transport station within 15 min by foot. The data can be collected through surveys, once a year.
OECD / ICLEI
11.7 Frequency of bus service
Average number of service at station per hour in total bus network
The data can be calculated from the timetable of each bus line, once a year.
OECD / ICLEI
12 Average travel speed on primary thoroughfares during peak hour
Km/h
The average travel speed for all private motorised vehicles and public transit vehicles, across all locally defined thoroughfares during the peak commuting hours (typically, morning and evening)
IADB’s ESCI
12.1 Travel speed of bus service on major thoroughfares (daily average)
Km/h The data should be collected continuously. OECD / ICLEI
13 Interruption of public transport systems in case of disaster
n.a.
A qualitative assessment of the ability of public transport systems to run efficiently during a natural disaster (flood, earthquake, storm…)
OECD / ICLEI
13.1 Efficiency of transport emergency systems in case of disaster
n.a.
A qualitative assessment of the ability of emergency transport systems (firefighters, police, ambulance…) to run efficiently during a natural disaster (flood, earthquake, storm…)
OECD / ICLEI

94
BUILDINGS
14 Electricity consumption in buildings
kWh / m2 Electricity consumption in urban built environment per square meter
IEA Energy Efficiency Market Report 2015, Odyssee-Mure database, CISBE Guides 19, 72, 286
14.1 Electricity consumption in residential building
kWh / m2
Electricity consumption in urban residential buildings per square meter
14.2 Electricity consumption in non-residential buildings
kWh / m2
Electricity consumption in urban non-residential buildings per square meter
15 Heating / cooling consumption in buildings, fossil fuels
kWh / m2 Heat (fossil fuel) consumption in urban built
environment per square meter
IEA Energy Efficiency Market Report 2015, Odyssee-Mure database, CISBE Guides 19, 72, 286
15.1 Heating / cooling consumption in residential buildings, fossil fuels
kWh / m2
Heat (fossil fuel) consumption in urban residential buildings per square meter
15.2
Heating / cooling consumption in non-residential buildings, fossil fuels
kWh / m2
Heat (fossil fuel) consumption in urban non-residential buildings per square meter
15.3 Share of city enterprises with ISO14001/EMAS certification or similar
%
EMAS and ISO 14001 are the two most recognised and widely applied certification systems for environmental management applicable to both private companies and public institutions. EMAS is completely compatible with ISO 14001, but goes further in its requirements for performance improvement, employee involvement, legal compliance and communication with stakeholders.
http://www.eea.europa.eu/data-and-maps/indicators/number-of-organisations-with-registered/assessment
15.4
Total value of projects with green building certification as a share of the total value of projects granted a building permit per year
% - OECD (2013) Green growth in cities
INDUSTRIES
16 Electricity consumption in industries, per unit of industrial GDP
kWh / 2010 USD
This indicator measures the electricity productivity of industries.
OECD / ICLEI
17 Heat consumption in industries, per unit of industrial GDP
kJ / 2010 USD
This indicator measures the heat productivity of industries.
OECD / ICLEI

95
18 Heavy metals (e.g. Pb) emission intensity of manufacturing industries
kg of heavy metals equivalent released per million USD GVA
This indicator is used to illustrate the emission intensity of manufacturing industries expressed as the amount of pollutant discharged in water per unit of production of the manufacturing industries (one million USD gross value added). The indicator shows a decoupling of economic growth (GVA) from environmental impact (emission of pollutants).
http://www.eea.europa.eu/data-and-maps/indicators/emission-intensity-of-manufacturing-industries-1/assessment
18.1 Fossil fuel combustion in industrial processes, per unit of industrial GDP
MJ / 2010 USD
This indicator measures the fossil fuel use productivity of industries
OECD / ICLEI
18.2 Share of industrial energy consumption from renewable energy
% - OECD / ICLEI
19 Share of industrial waste recycled as a share of total industrial waste produced
% Green benchmark to be set as 90% or 95% with GCAP iterations
OECD / ICLEI
20
Percentage of industrial wastewater that is treated according to applicable national standards
% The data should be collected every month. OECD / ICLEI
ENERGY
21 Share of population with an authorised connection to electricity
% Percentage of the city’s households with a legal connection to sources of electrical energy
IADB’s ESCI
21.1 Annual average number of electrical interruptions per year, per customer
# / year / customer
Average number of electrical interruptions per year, per customer
IADB’s ESCI
22 Share of population with access to district heating / cooling
% Percentage of the city’s households with a legal connection to sources of district centralised heating
OECD / ICLEI
23
Proportion of total energy derived from RES as a share of total city energy consumption (in TJ; compared to benchmark of 20% (links to EU target)
%
The amount of renewable energy consumed for electricity, heating and cooling, and transport, and expressed as a share against gross final energy consumption
http://www.eea.europa.eu/data-and-maps/indicators/renewable-gross-final-energy-consumption-4/assessment
24 Average share of population undergoing
% - OECD / ICLEI

96
power outage in case of climatic extremes over the past 5 years
WATER (SUPPLY, SANITATION, DRAINAGE)
25 Water consumption per capita
L / day / capita
Annual consumption of water per capita of people whose homes have a water connection to the city’s network. The data can be obtained from the utility agency supplying the water. The data should be collected several times per year, as climate differences across seasons is likely to result in different water consumption levels.
IADB’s ESCI
25.1 Water consumption per unit of city GDP
L / day / USD
This indicator measures water resource productivity. See remarks above on the sampling method.
OECD (2014), Green Growth Indicators 2014
25.2 Unit of water consumed in power plants, per unit of primary energy generated
l / MW / h
This indicator measures the productivity of water use in energy generation. The data should be obtained from the water supply utility of the municipality. Best practice benchmarks are based on IPCC and NREL standards.
OECD / ICLEI, NREL
25.3
Industrial water consumption as percent of total urban water consumption
%
Used to flag if industrial water consumption represents a larger portion of total urban water consumption than international norms. Industrial water consumption marked as ‘green’ may still have water efficiency challenges, but total water consumption does not represent a burden on municipal water resources beyond international norms. The data should be obtained from municipal water supply utility.
EBRD
26 Non-revenue water %
Percentage of water that is lost from treated water entering the distribution system and that is accounted for and billed by the water provider. This includes actual water losses (e.g., leaking pipes) and billing losses (e.g., broken water meters, absence of water meters, and illegal connections). It should be calculated as the ratio of water production out of actual water consumption.
IADB’s ESCI
26.1 Annual average of daily number of hours of
% The data should be collected through surveys, twice a year.
IADB’s ESCI

97
continuous water supply per household
27
Percentage of residential and commercial wastewater that is treated according to applicable national standards
% The data should be collected by analysing the quality of treatment in wastewater treatment facilities.
OECD / ICLEI
27.1 Percentage of buildings (non-industrial) equipped to reuse grey water
%
Percentage of buildings connected to facilities that treat wastewater from sinks, showers, tubes, and washing machines. The data should be collected through surveys, once a year.
OECD (2013) Green Growth in Cities
27.2
Percentage of wastewater from energy generation activities that is treated according to applicable national standards
% - OECD / ICLEI
28
Percentage of dwellings damaged by the most intense flooding in the last 10 years
%
Percentage of dwellings that were affected in terms of assets and health. The data can be collected through surveys. An estimate can be calculated from a sample population but it should be representative of different types of urban areas in the city (high / low elevation, close to / far from water bodies etc.)
OECD / ICLEI
28.1
Annual number of storm water/sewerage overflows per 100km of network length
Number of events per year
The data should be collected by monitoring the number of overflow in some areas of the city, and by deriving an estimate for the entire city. The data should be calculated as an average of several measurements over the year.
OECD (2013) Green Growth in Cities
28.2 Awareness and preparedness to natural disasters
n.a.
This is a qualitative assessment of citizens’ awareness about the threats of natural disasters and means to minimise damages (e.g. insurance, knowledge of shelters, measures to take at the building level etc.)
OECD / ICLEI
SOLID WASTE
29 Total solid waste generation per capita
Kg / year / capita
The data can be collected once a year. http://www.eea.europa.eu/soer-2015/countries-comparison/waste
29.1 GDP per domestic material consumption
USD / kg This indicator measures material resource productivity.
OECD (2014), Green Growth Indicators 2014

98
30 Share of the population with weekly municipal solid waste (MSW) collection
%
Percentage of the population whose solid waste is collected at least once a week. The data can be collected through surveys, once a year.
IADB’s ESCI
31
Proportion of MSW that is sorted and recycled (total and by type of waste e.g. paper, glass, batteries, PVC, bottles, metals)
%
Formally and informally recycled materials are those diverted from the waste stream, recovered, and sent for processing into new products, following local government permits and regulations.
IADB’s ESCI
31.1
Percentage of MSW which is disposed of in open dumps, controlled dumps, or bodies of water or is burnt
% - OECD / ICLEI
31.2
Percentage of MSW landfilled disposed of in EU-compliant sanitary landfills
%
Percentage of the city’s municipal solid waste disposed of in sanitary landfills. Waste sent for recovery (composting, recycling, etc.) is excluded. To be considered sanitary, the landfill should have leachate and landfill gas collection and treatment systems. The data can be collected from estimates produced at each landfill. Several measurements over the year and an averaged mean may be necessary to obtain data representative of long-term patterns.
IADB’s ESCI
31.3 Percentage of collected MSW composted
%
Percentage of the city’s solid waste that is treated by composting (in terms of weight). The data on weight of solid waste composted can be produced at composting stations. Several measurements over the year and an averaged mean may be necessary to obtain data representative of long-term patterns.
IADB’s ESCI
32 Remaining life of current landfill(s)
Years
Remaining useful life of the site of the sanitary or controlled landfill, based on the city’s municipal solid waste generation projections (in years). The data can be collected twice a year.
IADB’s ESCI
LAND-USE 33 Population density on urban land
Residents / km
2
People who live in the urbanised area of the municipality, per km
2 of urbanised area
IADB’s ESCI
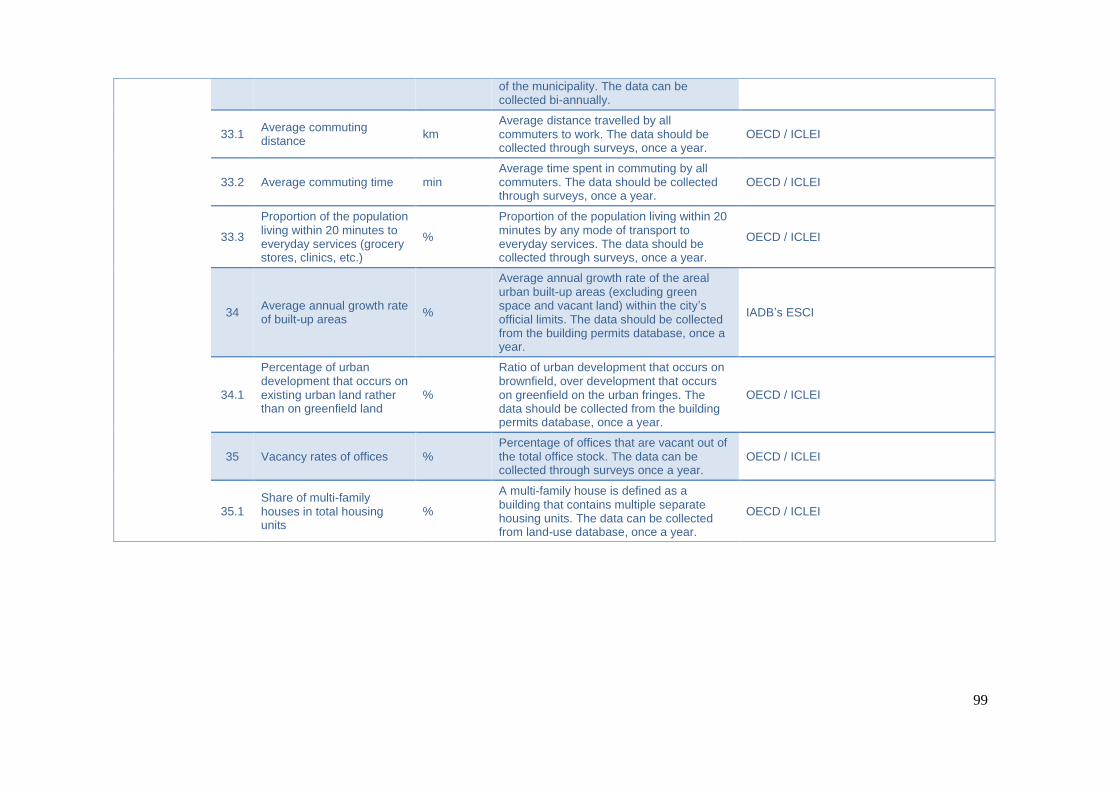
99
of the municipality. The data can be collected bi-annually.
33.1 Average commuting distance
km Average distance travelled by all commuters to work. The data should be collected through surveys, once a year.
OECD / ICLEI
33.2 Average commuting time min Average time spent in commuting by all commuters. The data should be collected through surveys, once a year.
OECD / ICLEI
33.3
Proportion of the population living within 20 minutes to everyday services (grocery stores, clinics, etc.)
%
Proportion of the population living within 20 minutes by any mode of transport to everyday services. The data should be collected through surveys, once a year.
OECD / ICLEI
34 Average annual growth rate of built-up areas
%
Average annual growth rate of the areal urban built-up areas (excluding green space and vacant land) within the city’s official limits. The data should be collected from the building permits database, once a year.
IADB’s ESCI
34.1
Percentage of urban development that occurs on existing urban land rather than on greenfield land
%
Ratio of urban development that occurs on brownfield, over development that occurs on greenfield on the urban fringes. The data should be collected from the building permits database, once a year.
OECD / ICLEI
35 Vacancy rates of offices % Percentage of offices that are vacant out of the total office stock. The data can be collected through surveys once a year.
OECD / ICLEI
35.1 Share of multi-family houses in total housing units
%
A multi-family house is defined as a building that contains multiple separate housing units. The data can be collected from land-use database, once a year.
OECD / ICLEI

100
Response Indicators
Sector Indicator Examples of response
TRANSPORT
36 High-polluting vehicles are regulated / Energy-efficient vehicles are incentivised through fiscal instruments
- Interdiction of circulation and fines for high-emitting vehicles
- Subsidies to replace vehicles older than 2000 or diesel-powered vehicles
- Fuel standards (EURO 6, EURO 5…)
37 Extension and improvement of public and non-motorised transport is planned and supported through investment in place
- Sustainable Transport Development Plan
38 Public and non-motorised transport is promoted through Information and awareness campaigns
- Car-free days
39 Traffic demand is managed (congestion charges, smart technologies)
- Congestion charges
- Smart automated traffic regulation
- Parking management
40 Public transport emergency management (in publicly and/or privately run networks) is planned and tested
- Transport resilience action plan
- Tests for road transport evacuation
- Tests on efficiency of emergency transport systems
BUILDINGS
41 Green building is promoted through standards and fiscal incentives
- Green buildings standards
- Subsidies for installation of energy efficient building infrastructure
42 Public and private investment in energy efficiency in buildings
- Public and private investment in retrofitting
43 Metering and billing for personal energy use is regulated
- Billing based on actual consumption
- Smart metering technologies in households
INDUSTRIES
44 Energy efficient industrial machinery is regulated and incentivised through fiscal instruments (electricity, heat, industrial processes)
- Penalties for high-emitting industrial technologies
- Subsidies for the purchase of energy efficient industrial technologies
45 Energy efficient industrial technologies (electricity, heat, industrial processes) is supported through private investment
46 Material efficiency of new built industrial facilities and waste recycling is regulated and incentivised through fiscal instruments
- Penalties for low recycling rate of industrial waste
- Subsidies for material efficient technologies and recycling facilities
- Mandatory recycling rates
ENERGY 47 Industrial wastewater treatment / reuse / recycle is promoted through regulations and fiscal incentives
- Energy (Electricity / Heating) Master Plan

101
48 Coverage and quality of electricity and heat supply is improved through investment
- Subsidies for the development of solar panels on rooftops
- Subsidies for the development of solar water heaters
49 Renewable energy facilities in private buildings are incentivised through fiscal instruments
50 Renewable energy technologies are developed and supported through public and private investment
- Renewable energy education programmes in schools
51 Renewable energy facilities are incentivised through awareness campaigns
- Energy resilience action plan
- Tests on the resilience of the energy supply network
- Smart technologies to detect power breakdown
WATER (SUPPLY, SANITATION, DRAINAGE)
52 The resilience of electricity networks in case of disaster is tested and enhanced through investment
53 Metering and billing for water use is regulated - Billing based on actual consumption
- Smart metering technologies in households
54 Water saving / reuse is encouraged through awareness campaigns
- Water saving education programmes schools
55 Coverage and efficiency of water supply networks is improved through plans and investment
- Water Master Plan
- Investment to reduce leakage in water pipes
- Investment to provide more continuous water supply in households
56 Buildings’ access to wastewater collection and treatment systems is improved through plans and investment
- Investment to equip buildings with individual or communal grey and black water treatment facilities
- Investment to connect buildings to wastewater treatment plants
- Construction of new wastewater treatment facilities
57 Wastewater treatment is promoted through regulations and fiscal incentives
- Mandatory wastewater collection facilities for new buildings
58 Wastewater billing is regulated - Wastewater collected is charged to households
59 Drinking water pre-treatment is enhanced through plans and investment
- Construction / upgrading of drinking water treatment facilities
60 Drainage facilities are developed through plans and investment
- Resilience Master Plan
- Construction of drainage tunnels
- Construction of dykes
- Construction of retention ponds
61 Business and community resilience is encouraged through awareness campaigns
- Information on business continuity plans on the City Hall’s website
- Education programmes on resilience to natural disasters (floods, earthquakes etc.) in schools

102
SOLID WASTE
62 Reduction of material consumption / solid waste generation is promoted through awareness campaigns
- Education programmes on solid waste reuse / recycling in schools and in companies
63 Coverage of solid waste collection system is improved through plans and investment
- Action plan to reduce amounts of solid waste dumped in the streets
64 Littering and non-compliance to sorting systems is dis-incentivised through fines and penalties
65 Composting, recycling and waste-to-energy facilities are developed through plans and investment
- Construction of recycling facilities
- Construction of waste-to-energy facilities
- Construction of composting facilities
66 Solid waste reuse, sorting and recycling is promoted through information and awareness campaigns
- Education programmes on solid waste reuse / recycling in schools and in companies
67 Overcapacity issues in landfills are tackled through plans and investment
- Construction of new landfills
LAND-USE
68 Density is regulated - Density targets
- Incentives for higher densities (e.g. Floor-Area-Ratio bonus)
69 Transit-Oriented Development is promoted - TOD is promoted in Transport and Land-Use Master Plans
- Higher density regulations near public transport lines
70 Mixed-use development is promoted through zoning regulations / incentives
- Zoning regulations promote mixed-use development
- Fiscal incentives for mixed-use development for developers

103
ANNEX 7. GREEN CITY ACTION PLAN METHODOLOGY
Step Sub-step Description
Step 1 Green City Baseline Key question of step 1:
- What is the current state of the environment?
Aim:
- The “Green City Baseline” aims to inform policy and strategic decision-making at the start of the process (or the review phase for advanced local governments) and provide the reference scenario for the business-as-usual against the Green City approach and action.
Primary outcomes:
- Commitment to Green City development for the local community.
- Process initiated within local government and community. - Overview of status quo (understanding situation, constraints and capabilities). - Priorities identified to address environmental challenges most effectively and in an integrated manner.
Indicative timeline:
- 1st (introductory) period: 6 months - Following (regular) period: 1-3 months
1.1 Prepare & organise 1.1.1 Secure initial commitment - agreement with the Council
By committing to Green City Action Plan in the community, a local government sets a priority for high environmental performance. It is vital to ensure senior political buy-in to kick-start the process and provide clear leadership. The mayor and/or Council should give the official go-ahead to legitimise action by municipal staff. Municipal staff needs to be informed and engaged early on in the process, as they will institutionalise and implement the process and monitor developments. If the local government has already kicked off a Green City Action Plan, it is necessary to re-commit to a new phase of action.
1.1.2 Set up team & institutional structures
The formation of governance arrangements are needed to ensure buy-in, effective decision-making, planning and implementation throughout the whole process. Ideally, the structure established (steering committee or task force), is an internal coordination body working with a wide number of municipal departments (including Finance, Sectoral departments and Communications) to provide input into and steer the process. It should also include external participation of essential actors representing the various environmental and socio-economic dimensions to address in the Green City Action Plan (e.g. organisations responsible for municipal services such as infrastructures, energy, water, waste and transport utilities).
The committee’s coordination tasks and mandates, communication mechanisms and relations to other groups within the local government should all be clearly defined and give the body appropriate strength and ability to

104
drive forward the development of the Green City Action Plan.
1.1.3 Identify & engage stakeholder group(s)
An integrated and effective Green City Action Plan requires the involvement of essential partners and stakeholders. Good involvement doesn’t mean involving all the stakeholders in every development step, though.
A stakeholder mapping (or analysis) should be conducted to identify key individuals / representatives and stakeholder groups (including private sector representatives, such as utility firms, local academia, community groups, other NGO’s), also gaining a better understanding of their interests and sphere of influence. Such mapping should be conducted using the PSR framework, in particular the “pressure” indicators. Furthermore, the involvement of all relevant stakeholders, including the community, can facilitate the implementation of the Green City Action Plan, removing oppositions to the implementation of the action (e.g. NIMBY) and exploring innovative financing mechanisms.
This step includes mapping out the local Green City champions and involving them in the process – responsible political leaders, key persons in the political parties, specialised committees. There are basically three settings, which in reality will be a certain, very locally determined, mixture that can influence the political agenda: Political champions: The best conditions are in local governments where the Mayor or key Councillors are
already the drivers and champions of the Green City agenda. More difficult settings are hardly accepted from the majority of the Council as the driver.
Administrative champions: Key persons in the administration could adopt the Green City issue or respond to a legal requirement. Being close to the politicians, they may have the influence needed to drive Green City issues into political discussions.
Community champions: Key persons and organisations in the community sphere could act as Green City champions and challenge the elected politicians by requesting a response to their concerns.
Focus is to develop ‘ownership’ of the Green City Action Plan with all identified Green City Champions in Council and elsewhere. Actions may include: Inform and involve the local Green City champions and the key decision-makers in all steps. Get advice from champions on how to best carry on the upcoming liaison and information efforts and
make them contribute to these with their own contacts and influence. Experience shows that an invitation signed by the Mayor gives much more relevance to official papers.
1.2 Map local situation (preparation phase in the prioritisation process elaborated in Section 3)
1.2.1 Map external framework conditions – including financial status , governance and management inventory and analysis
It is valuable for a local government to understand external issues impacting its Green City Action Plan. This requires exploring the international / regional / national and sub-national contexts, including policy / legal, economic, social and environmental relevant contexts, emerging issues, trends and forthcoming policies.
1.2.2 Map environmental and infrastructure challenges (Collection and assessment of state and pressure indicators)
This is the part of the Green City Baseline where environmental pressure and state indicators are collected, compiled and assessed through the benchmarking methodology (traffic light screening), the trend analysis and legal compliance check. Indicators targeted include the three environmental dimensions (quality of environmental assets, use of resources, and climate change risks) developed in 3.2, and economic activities and services that can be identified as environmental pressure levers – thus target sectors, which include transport, energy, water supply and wastewater (WSS), solid waste, and land-use.

105
1.2.3 Map local policy framework (Collection and assessment of response indicators)
This is the part of the Green City Baseline where indicators of response to environmental challenges, including policy instruments (such as plans, programmes), investment, behaviour and organisational set-up (incl. roles and responsibilities, procedures, reporting routines), are collected and assessed using a traffic light screening. Also, a consideration of stakeholder groups specific for the identified environmental challenges based on 1.1.3 will be conducted. At this stage it is also important to take a first look into financial status and available resources.
1.3 Assess & prioritize (green city challenges prioritisation process elaborated in Section 3)
1.3.1 Technical analysis of green city challenges
The city identifies priority green city challenges by using the PSR indicators and their traffic light assessment carried out in the previous step. The result should be a green city problem tree linking red-flagged state, pressure and response indicators. See Section 3.3 for details.
1.3.2 Stakeholder-based prioritisation
The green city challenges identified as a result of the technical analysis within the city administration will be checked and complemented through a stakeholder consultation. External experts and citizens representatives will confirm or reject the relevance of identified green city challenges. See 3.3. for more details.
1.3.3 Political assessment & Green City Baseline
The step concluding the Green City Baseline includes a formal assessment of the results of all previous steps in order to politically determine priorities to address in the Green City Action Plan. This step will also provide the mandate for elaborating the Plan itself.
Step 2 Green City Action Plan Key question of step 2:
- Where do we want to go and how do we get there?
Aim:
- The “Green City Action Plan” compiles and presents the agreed development vision and objectives for a period of 10-15 years, the priorities to work upon in a period of 3-5 years, and the scope of actions and targets for priority programmes and actions proposed.
Primary outcomes:
- Strategic objectives outlined according to environmental and socio-economic dimensions
- Policy options assessed for addressing environmental challenges - Priority programmes and key actions defined
- Medium-term targets for Green City Actions determined - Draft Green City Action Plan compiled
Indicative timeline:
- 1st (introductory) period: 6 months - Following (regular periods): 3 months
2.1 Develop a vision (10-15 years)
2.1.1 Develop strategic objectives for priority areas
Where do we go from here? This is the question that follows, when the Green City Baseline has given clarification to the question ‘Where do we stand?’ To orientate the city’s development and provide a framework for the Green City Action Plan, a Green City strategy statement outlines the vision and key objectives for a period of 10-15 years, both, for the Green City in general and each priority area. These strategic objectives will address the priority areas identified in 1.3.2 and 1.3.3. This statement presents a qualitative vision of the desired development and achievements considering environmental and socio-economic dimensions. It will be an advantage to develop a positive connotation to the long-term ambition: a vision) – an image of the city and general principle that leads development of a strategy and its implementation. This will help to create ownership and backing for the Council’s Green City Action Plan. To achieve this, the Green City Baseline is used as a starting point for a ‘visioning workshop’ to define or

106
modify the city’s strategic development, with clear links to its socio-economic development and clear indication of co-benefits (green growth).
2.1.2 Determine key programmes based on priority areas
Given limited resources, not all environmental challenges can be addressed at a time. Agreement is needed on the key programmes to address within the remit of the 3 – 5 year operational period covered by the Green City Action Plan. These key programmes will form the scope of the Council’s more immediate work for implementing the Green City Action Plan. The key programmes should be selected from the priority areas identified in the technical assessment. ‘Scope’ may refer to different (environmental) dimensions and aspects and include a thorough consideration of territory and stakeholders (see step 2.1.3) as well as urban activities and services (e.g. solid waste management, water and wastewater treatment, etc.) , but also resources and budgets available to act with.
2.1.3 Consider scope incl. territory and stakeholders
For appropriate and effective action, it is important to clearly consider their scope in terms of territory and stakeholders. The territorial scope depends very much on priority issues. Often, environmental challenges and issues cannot be just treated as local issue. The territorial scope should therefore represent the local responsibility of each environmental dimension, not at least to identify and consider the stakeholders (or partners) involved and relevant for implementing the action.
2.2 Select and prioritise green city policy measures (green city action prioritisation process elaborated in Section 3)
2.2.1 Technical analysis – Select and prioritise policy actions
The technical analysis is composed of four sub-steps: 1. Review existing green city response. Strategic objectives will be transformed in operations and actions. The first step in this process is a consideration of the existing responses to green city challenges (resulting from step 1.2.3). In result, applied instruments and procedures will be confirmed or adapted to more efficiently and effectively perform to achieve the objectives of the Green City Action Plan. Details are provided in Section 3.3. 2. Select new green city policy options. Following on from the identification of policy gaps to address the strategic objectives, new policy options and measures will be reviewed, considered and adopted by relevant bodies including stakeholders. Details are provided in Section 3.3. 3. Prioritisation of selected green city policy options. Once the policy options are selected, the city should apply prioritisation filters in order to identify those with potentially highest impact in terms of environment (in particular with regard to the state indicators) but also with regard to economic and social objectives described in Table X in 3.2 and Table X in 3.3. The method is detailed in Section 3.3. 4. Derive budget implications. Impacts on the City’s annual expenditure and capital expenditure (capex)
budgets should be estimated and presented in the Green City Action Plan for each selected measure separately. This will help to further prioritise selected green city measures according to their cost. In addition, benefits and savings should be estimated to provide a comprehensive picture and allow for a thorough political consideration of the plan’s actions.
2.2.2. Stakeholder-based assessment of green city actions
The green city actions identified as a result of the technical analysis within the city administration should be checked and complemented through additional stakeholder consultation. External experts and citizens representatives will confirm or dispute the relevance of identified green city policies
2.2.3. Final prioritisation of green city actions
This is a formal assessment of the policies selected for the Green City Action Plan Political. Political

107
assessment could help to select some policy options which meet the political agenda of the city, the national government or the international community (climate change). This step would help to ensure final leadership from the Mayor and Council
2.3 Draft Green City Action Plan (3-5 years)
2.3.1 Determine medium-term targets
Targets are needed to move towards a specific outcome and allow for proper evaluation of the achievements. For each key programme, medium-term targets will be determined will be determined to operationalise the strategic objectives and allow comparison of progress made in implementing the Green City Action Plan and setting the basis for a distance to target comparison and setting the basis for a distance to target comparison at the end of the operational period. Targets can relate to “avoidance”, “reduction” or “improvements”, but also to socio-economic aspects based on indicators as provided in task 3.3. Indicators in the pressure-state-response categories will be used to assess cities’ green performance. However, only the state and pressure indicators should be used to benchmark cities. Response indicators are difficult to benchmark because they are entirely qualitative and “respond” to existing problems. A city does not need to respond to a problem that does not exist (for instance, a city does not need a disaster risk master plan if it scientifically proven that it is safe from all type of natural disasters). Instead, response indicators should be used in a second screening step to identify policy options that should be considered in order to tackle the state and pressure issues initially identified (cf. prioritisation methodology).
2.3.2 Draft Green City Action Plan
The Green City Action Plan presents the findings of all above-mentioned activities and defines the long-term Green City vision and strategic objectives for each priority area. It is structured according to affected environmental dimensions and significant aspects, using indicators and time-related targets and measures for the Council’s operations related to the environmental dimensions. The Green City Action Plan also outlines the scope of actions, the targets set and the major actions developed, and the initial steps of implementing the Plan for a period of 1-3 years. It is an overarching strategic document which contains the guiding principles offering orientation for the Council’s decision-making and the administration’s implementation work in the mid-long term. The Green City Action plan triggers or links to sectoral-focus action plans for different sectors (for example Sustainable Energy Action Plans (SEAPs), which define short-term operational targets and suitable measures that serve as stepping stones to reach the medium targets and long-term objectives. This is to allow an estimation of what is realistically possible in light of available resources and efforts needed. Fine-tuning of the Green City Action Plan is to follow after Council approval at the start of the step Implementation & Monitoring.
2.3.3 Present Green City Action Plan
It is to be emphasised that communication and involvement are crucial parts for ensuring partnership agreements to implement actions that lead to the fulfilment of targets. Equally important is to inform the wide public about the Green City Action Plan, its objectives, targets and priority actions in an easy and attractive to receive format. This may include written information as well as more interactive methods.
Step 3 Green City Implementation
Key question of step 3:
- How do we operationalise the plan, and what are resources available to assist?
Aim:
- The “Green City Implementation” will operationalise the Green City Action Plan, break it down into concrete tasks, allocate budget, time and staff, and monitor the contribution of each measure to the objectives and targets established in the Plan. This will include building political support for the Plan’s targets and actions by linking to municipal budget resources and reaching out to key government members.

108
Primary outcomes:
- Initiating and running projects as part of a comprehensive Green City Action Plan.
- Monitoring of implementation of actions and progress towards objectives and targets.
- Political Commitment to Green City Action Plan.
- Mitigation of environmental challenges and risks / environmental improvements started.
- Consideration of financial resources in municipal budget.
- Established implementation partnerships.
Indicative timeline:
- 12 - 36 months
3.1 Engage politicians and their bodies
3.1.1 Prepare political framework
Developing and maintaining political Green City commitment will remain a long-term activity involving major political groups, including the Mayor, other high-level politicians, different stakeholders and the general public at all steps of the Green City planning and management cycle. However, before the actual Council debate, it will be important to inform major political groups inside and outside the City Council about process, results and draft Green Action Plan. This will allow collecting views, frequently asked questions and (counter) arguments to take on board prior to the actual council decision, but also to provide supplementary information. This follows two purposes: Firstly, it prepares the political groups and councillors to have a meaningful debate on the contents of
the Green City Action Plan. Secondly, it prepares the ground for the approval of the Green City Action Plan in the council. It also
helps to create political support later on, during the implementation of the Green City Action Plan. The results of step 1.2.1 will thoroughly be reviewed in light of priority areas strategic objectives of the draft Green City Action Plan. From this, activities will be scheduled and sequenced to inform the political debate.
3.1.2 Inform political debate
Debate is required and it leads, finally, to the formal political approval of the Green City Action Plan by the city council gaining legitimacy. This step will implement the information of political groups and champions in preparation of the Council’s decision. Actions may include: Inform the major political groups and specialised committees. Organise informal briefings and discussions with the responsible political leaders, mayors or deputy
mayors, key persons in the political parties and involve, if appropriate, presentations from external experts and politicians.
Organise informal visits from politicians, key decision makers or specialised committees to front-runner cities that have implemented lighthouse projects and Green City Action Plans. Concluding from the implementation of these activities, questions, views and (counter) arguments will be considered to prepare for the draft Council resolution and presentation of the draft Green City Action Plan.
3.2 Prepare council resolution
3.2.1 Consider formal requirements
In preparation of the Council resolution, the formal requirements and corner-stones in terms of timing, due-dates, and format need to thoroughly be considered and respected. At best, agreement with the Mayor and council of elders (usually responsible for the political calendar!) will be sought on the appropriate time to present the draft Council resolution to the political bodies.
3.2.2 Draft council resolution
The Green City Action Plan establishes the Council’s commitment by quantitative strategic mid-term and operational short-term targets related to environmental dimensions, serving to guide the implementation of related measures. Thus, a formal political approval is requested to officially launch the Green City Action

109
Plan and mandate related measures and management activities. With its approval the Council will establish the Green City Action Plan as the city’s development vision, and legitimisation, mandate and resource the plan’s implementation. Further to this, it is deemed essential to also make the organisational setup – roles, responsibilities and procedures – part of a formal council resolution. Finally, budgetary considerations must not be ignored when formulating the draft council resolution. The draft Council resolution should: make clear references to the original decision to implement the Green City Action Plan and the related
management procedures; give reference to general background (laws, programmes, strategies and charters related to
sustainable development and Green City dimensions); refer to the main decisions taken and commitments signed up to by the city council related to the
environmental dimensions addressed in the Green City Plan; include the draft Green City Action Plan proposal and the Green City Baseline as annexes.
3.2.3 Prepare presentation and council meeting
The Council meeting will be a peculiar and decisive moment. Most of the Councillors may not have been involved in the process. Complex information needs to be understood and digested and far reaching commitments made in a relatively short period within one meeting. This needs thorough preparation and a presentation that will allow catering for the above mentioned requirements. At best, potential counter-arguments and frequently asked questions could be collected in advance and responses included in the presentation. In support of this, in the run-up to the council meeting, the draft Council resolution could be presented at both specialised committees and political party meetings to prepare grounds for the decisive meeting of the Council.
3.3 Establish implementation partnerships
3.3.1 Publish Green City Action Plan
Publication of the Green City Action plan is not only a formal requirement following the Council resolution, but should be implemented as a particular activity of stakeholder engagement to develop ownership of the plan beyond the Council. This may include proactive presentation at meetings of the stakeholder groups or – even better – a public Green City launch event to motivate engagement of stakeholders in and launch implementation partners for the implementation of the plan.
3.3.2 Engage stakeholders and form alliances
Due to the many environmental dimensions included in the Green City Action Plan, a number of different actors are being involved and responsible for carrying out particular actions. The latter is of particular importance as budgetary limitations as well as limits to competence and power will require contributions of all parts of society to implementing appropriate and high-level performance Green City Action. Thus, partnerships are key to the successful preparation and delivery of specific projects and solutions. While engagement with various possible partners is an on-going activity, it is especially important to find and set-up arrangements with partners that can help to deliver on identified priorities and projects. This also helps to spread the responsibilities and risks. Indeed, cooperation across the administration as well as with various stakeholders that take responsibility for implementing projects assures buy-in to the implementation process.
3.3.3 Formalise action and implementation partnerships
Joint activities and implementation partnerships should be formalised for the sake of trust and reliability and provide a secure platform for implementing key measures of the Green City Action Plan and deliver on identified priorities.
3.4 Implementation Plan for key measures
3.4.1 Refine generic Green City Action Plan and mobilise investment
Refinement of the action plan is a two-tier exercise: the 1st tier involves the overall coordination of the
generic action plan, the 2nd
tier the implementation of individual projects, thus, the step from an action number in the generic action plan to a particular project.

110
Measures earmarked in the generic Green City Action Plan will turn into fine-tuned project plans that include proper assignment of roles and responsibilities incl. lead actors, planning of work-flow and time for delivery, technical and spatial planning, project impact assessment, financing and resourcing options as well as stakeholder involvement.
This detailed planning could relate equally to large infrastructural projects, for example in the transport sector, but also to smaller, lower-cost but equally valuable measures such as internal municipal energy reduction initiatives or engagement campaigns.
The 1st tier remains in the immediate responsibility of the Green City Plan coordinator or task force. The
scope of activities will include the entire municipal territory and all areas of urban development addressed. Activities involve the following steps:
1. Assignment of roles & responsibilities 2. Communication and involvement strategy and staff training programme 3. Refined implementation plan including:
work- / time-plan for the implementation of the generic action plan Allocation of resources / Planning overall finances Programme impact assessment: estimating possible effects/side effects (environment, economy, society, institution)
4. Action Plan implementation 5. Monitoring of Action Plan implementation
An integrated element of good management and planning is the assessment of potential impacts, side-effects, and rebound effects of planned programmes or projects. To this end, Strategic Environmental Appraisal (SEA) at tier 1 – level, i.e. programmes and plans, and Environmental Impact Assessment (EIA) at tier 2 – level are required by EU legislation and could be used as reference to proactively facilitate the assessment of potential impacts of any measure in all respects.
3.4.2 Plan implementation of selected key measures
The existing overall action plan is further developed, including timelines for delivery, lead actor, and financing options for a range of short, medium and long-term measures, across and beyond sectors.
Priority measures are subject of detailed implementation planning, including the assignment of and roles and responsibilities, preparation and implementation of tendering processes, development of financial model options that would ascertain the actual outflow of funds, payback periods, etc. This is conducted with experts, making a clear business case per project.
The 2nd
tier responsibility will be assigned to a project coordinator or team. It involves similar steps as previously described above in the 1
st tier. However, the scope of activities is limited to one particular
project and often even to one particular site. Tasks will therefore be more specifically connected to a certain thematic area (e.g. transport, energy, or green infrastructure). Individual steps of project implementation employed will include:
1. Assignment of roles & responsibilities for project implementation; 2. Project communication and involvement process; 3. Project planning including work- / time-plan, allocation of project resources and planning
project finances and assessing risks, technical planning, project impact assessment: estimating possible effects/side effects (environment, economy, society, institution);
4. Project implementation; 5. Project monitoring: Measuring project impact;

111
6. Project documentation and reporting. To generate full support by decision makers and investors, it is important to present a comprehensive business plan that both in short and long-term perspective and over the full life-cycle of a project.
3.4.3 Execute measures Measures will be executed and monitored according to the established implementation plan and monitoring scheme.
3.5 Monitor implementation and progress
3.5.1 Set up monitoring scheme
All measures and projects of the Green City Action Plan ultimately contribute to the Council’s agreed objectives and targets. Thus, continuous monitoring of progress is integral to the implementation phase oriented at preparing the ground for appropriate evaluation of process and performance as well as targeted reporting in the final stage of the management cycle.
Each individual project also needs to be monitored, which requires monitoring of implementation of actions (defining what data needs to be captured, who will capture, what stages need to be reviewed and also to set milestones), and related environmental improvements.
3.5.2 Implementation monitoring
Monitoring is not an “event” that occurs at the end of a project, but rather is an ongoing process that helps decision-makers better understand the effectiveness of actions. An effective monitoring programme requires collecting and assessing important data on a continuous or periodic basis throughout the management period and also when implementing a project. The monitoring programme employs a mechanism to track the status of implementing projects (started/not started, done/not done). However, ‘action tracking’ would need to be accompanied as far as possible by monitoring impacts of projects according to the Green City Indicators and in regard of progress made towards the agreed targets. Various impacts – of course, can only be detected long-term (e.g. improved air quality, GHG emissions). Others, however, can be monitored immediately and continuously (e.g. energy consumption).
3.5.3 Control progress Good management practices include regular monitoring on both a short- and long-term basis. The monitoring programme provides ongoing, systematic information that strengthens project implementation and prepares for appropriate reporting and evaluation. It also provides an opportunity for assessing the implementation process continuously and periodically by:
1. Comparing implementation efforts with original goals and targets (“Are actions being implemented?”),
2. Determining whether sufficient progress is being made towards achieving expected results and (“Will targets be achieved?”),
3. Determining whether the time schedule is respected.
3.6 Implement corrective measures
3.6.1 Consider monitoring results
For the purpose of targeted evaluation, it is therefore suggested to follow the “pressure – state – response” model (PSR) as analytical and systematic framework to monitoring. Applying PSR, it becomes obvious that all of the three areas need to be considered. To take a concrete example, if you want to consider the effectiveness of an action included in the Green City Action Plan, say extending the local bus system in order to reduce GHG emissions from the transport sector, you would measure and consider: How many buses and new connections have been introduced (response); whether number of passengers in public transport has increased as a result of the extension of
public transport (state); or if individual transport has decreased (independently of this action, maybe due to related
measures in the action plan, like e.g. higher parking fees in the inner city) (pressure).

112
Duly and accurately documented monitoring also involves reporting on progress concerning your local capability and capacity to respond to environmental improvements at agreed intermediate stages (e.g. after six months). This provides interim information for senior management and political committees. Monitoring reports, therefore, also serve to keep senior managers and Council informed with regard to state of implementing the Green City Action Plan on a regular basis.
3.6.2 Plan and implement corrective measures
It might be the case that the monitoring detects deviations from the set targets, deficiencies with regard to the implementation of the Green City Action Plan and needs to correct, strengthen and improve activities. Also, unexpected events might change framework conditions for implementing the plan: a new investor is interested in developing an area, an extreme weather event puts emergency on upgrading an infrastructure. In this case, corrective measures can be taken as soon as possible, and damages or losses minimised.
3.6.3 Monitor impact of corrective measures
All corrective measures will need to be closely monitored and impacts duly and accurately documented.
Step 4 Green City Reporting Key question of step 4:
- What have we been able to achieve – and how?
Aim:
- The “Green City Report” will analyse successes and failures during the implementation period, provide the basis for taking further political decisions and inform Council, stakeholders & the public on what the city has done and achieved
Primary outcomes:
- Institutionalised evaluation, audit and reporting system in use.
- Green City Report reflecting achievements based on objectives and targets established in the Green City Action Plan.
- On-going and increasing environmental improvements. - New policy options identified to accelerate Green City development.
Indicative timeline:
- Suggested to implement as annual report, i.e. 12 months from Council decision - Duration of phase ca. 3 months
4.1 Evaluate process and achievements
4.1.1 Evaluate effectiveness of process
Evaluation commences the last step of the cycle, but also provides the basis for starting a new year with a new cycle. It analyses what has happened during the year in order to understand why things happened or failed to succeed. Whilst monitoring provides response to the question ‘what is happening?’, evaluation rather looks at ‘why is it happening’, ‘are the changes significant’ and ‘are the changes in line with commitments and requirements’. The first step would be an evaluation of the GCAP process, its applied procedures, capacities, roles & responsibilities, partners and actions, will be implemented. It will also help to identify successes, challenges, gaps and barriers in meeting the overall objectives set out in the Green City Action Plan, especially analysing the degree to which the process has been institutionalised and integrated into city planning. In this regard, a multitude of international organisations can provide support for specific parts of the evaluation process (4.1), or the entire process. The OECD, for instance, has several initiatives for reviews and evaluations (cf. Annex 1).
4.1.2 Green City This second step is an evaluation of the implementation of the Green City Action Plan and specific

113
Benchmarking projects / actions, using results from the monitoring process. Effectively, a benchmarking will be conducted. Benchmarking is the process of comparing one's organisational processes and performance to bests and/or best practices from others. Benchmarking has become a major element of cities’ evaluation. Green City Benchmarking is supported by particular benchmarking instruments developed in accordance with this methodology. A traffic light screening is applied to each indicator to simplify the
assessment (green light = high performance; amber light = medium performance; red light = low performance) and compare cities’ performance against established benchmarks or proposed indicative benchmarks. The boundaries between each of the three “lights” will be determined on a case-by-case basis, following existing standards or by default data ranges extracted from the literature for quantitative indicators, and subjective boundaries for qualitative indicators. Cities can identify the most urgent area of action thanks to indicators classified as “red”.
4.1.3 Evaluate effectiveness of measures/investments to address environmental challenges and risks
The third evaluation step of the Green City Action Plan will pitch the evaluation results by considering modifications of the framework conditions compared to their outline in the Green City Baseline. This consideration is relevant to avoid misleading conclusions and recommendations. To do so, modifications in framework conditions and socio-economic impacts will be reviewed and potential impacts considered on conclusions drawn from the first two evaluation steps. A number of tools are available to support carrying out the evaluation exercise. These tools usually follow different commitments and / or requirements and serve different purposes, incl. surveys, written feed-back by stakeholders (e.g. based on guiding questions or a feed-back grid, a questionnaire or alike), and evaluation workshops.
4.2 Implement audit 4.2.1 Implement internal audit The internal audit is an important means of verification of both process and results. Whereas an evaluation usually is coordinated and facilitated by persons involved with the implementation of the Green City Action Plan, the ‘internal auditor’ is not. The auditor is usually a person from within the administration, but not directly implied in the implementation process. An efficient way of performing the internal audit is by connecting it to the governments’ controlling system. Particularly advanced local governments tend to integrate their management systems. Green City targets, for instance, are being made part of internal performance agreements with departments and staff and integrated in the annual controlling of municipal spending and accomplishment of municipal budgeting and performance target. These, however, have to be approved as key performance target by the Council. Another possibility to conduct an internal audit is a peer review: a colleague or team from another city realises the audit in your city and vice versa. Either way, the auditor follows a given scheme and evaluates all elements of the Green City Action Plan at a given point in the cycle.
4.2.2 Implement external audit An external audit is usually an assessment by an independent, certified environmental verifier - often referred to as third-party’s audit. An external audit is for example required to obtain an EMAS registration or an ISO 14001 certification. In future, ISO 37101 might provide a basis for audits of management systems for sustainable development of communities, as well. It is only after the auditor has "validated" the management system that it may be termed an approved standard management system according to the resp. standard’s criteria. But also, audit requirements may arise from voluntary engagements and need to be respected in order to comply with the commitment. Non-compliance might lead to exclusion from the commitment. The auditor carries out the validation in two steps: a review of the documents and an on-site visit. In light of the results of the audit as well as necessary corrections the evaluation results will be updated as a basis to draft the Green City Report.

114
4.2.3 Audit response action The audit may lead to further demand and requests regarding both process and performance. For instance, the auditor might detect deficiencies in the organisational set-up or deviations from the agreed key actions and implementation plans that need explanation. Findings of the audit report may be due to immediate response to the audit report or to further considerations for the subsequently following Green City Action Plan period. Both, audit results and response options should be documented and included in the Green City Report.
4.3 Report results 4.3.1 Draft Green City report The Green City Report has essentially two key goals: to inform the decision makers about the consequences - successes and failures - of their actions and to inform the public about the progress of the city towards environmental performance. Concluding the management period, the administration will prepare a report presenting the City Council’s achievements compared to the targets established and approved in the Green City Action Plan, and analyse both procedures and measures in regard of their contributions to the results. This report serves as a balance of the Council’s Green City commitments and targets, as foundation for reconsidering political strategies and priorities, and as guidance for decisions regarding the forthcoming management period. Content-wise, the public report should do an effort to reward and recognise those activities that involved implementation partnerships between the Council and local stakeholders. It should be understood that the report not only is to present achievements but also to increase ownership of the community of the Council’s Green City Action Plan and, most importantly, community’s own contribution to their implementation. As an example, the report could include effective private initiatives, e.g. energy efficiency measures, solar panels or green roofs on private buildings, citizens’ transport and mobility efforts. A specific reporting purpose might be connected to investments into infrastructure projects following environmental criteria, e.g. financing programmes from the European Regional Development Bank usually depend on requirements in regard of targeted action following long-term strategy and well established monitoring and documentation of project impacts. These, however, may be most important to implement measures and projects from the Green City Action Plan. The reporting, once established, can serve as the main mechanism to comply with such requirements, as well.
4.3.2 Present Green City report
The Green City Evaluation Report must be presented differently to different target audiences. It implies a different format, different language and various modes of distribution. An important consideration is who is actually to present the report. As the report ultimately is presenting achievements according to a Council commitment on targets in the Green City Action Plan, it should be presented as a ‘Report of the Lord Mayor’, being him or her the highest representative of Council and administration. This perspective impacts ‘tone’ and form of the report. But more importantly, political ownership and commitment is both strengthened and presented to the public. The language and style of reports may change depending on the audience; however, the information conveyed needs to be consistent and accurate. It is important to keep the public informed of the progress toward achieving the targets set in the Green City Action Plan. This will require an effective communication programme to provide regular information, but also to report citizens’ reactions to implementing institutions (collect feedback!).
4.3.3 Draw conclusions and prepare for subsequent cycle
Based on the evaluation, the Council is now in a position to identify new sector areas, as well as revised priorities and actions (based on an assessment of needs, challenges and opportunities). These should reflect enhanced ambitions for scaling-up action towards Green City development and optimise the institutionalisation process. This will also take into account any changes in the national and international

115
contexts. Essentially this step prepares for starting off the subsequent management cycle and to update the Green City Baseline.

116
ANNEX 8. REFERENCES USED FOR THE GREEN CITY ACTION PLAN METHODOLOGY
Name of reference URL
ISO 37101: Sustainable Development, Smartness and Resilience of communities — General principles and requirements — Management system standard
-
IDB, Methodological Guide, Emerging and Sustainable Cities Initiative, 2014 https://drive.google.com/a/iclei.org/file/d/0B93Bl6qR3zQ_OXgyN3lwMURqNE0/view, last download 18.04.2016
ICLEI (Cristina Garzillo, Holger Robrecht et.al.): Managing environment and poverty in Asian cities: An ecoBudget Guidance, 2013
http://dreams.ecobudget.org/fileadmin/dreams/files/dreams_pdms_publications/LF_ecoBudget_webversion.pdf, last download 18.04.2016
Holger Robrecht, Pamela Mühlmann, Claudia Kiso et.al., Integrated Management for Local Climate Change Response. Online Capacity Development Package, Developed in the Framework of the Project CHAMP-Local Response to Climate Change, 2012
www.localmanagement.eu
UNEP et. al.: TEEB – The Economics of Ecosystem Services and biodiversity for Local and Regional Policy Makers (2010)
http://www.teebweb.org/media/2010/09/TEEB_D2_Local_Policy-Makers_Report-Eng.pdf, last download 18.04.2016
Union of Baltic Cities, ICLEI – Local Governments for Sustainability, Bodensee-Stiftung, UNEP/GRID Arendal (editors): Integrated Management for Cities and Regions, Turku 2008,
(http://ec.europa.eu/environment/life/project/Projects/index.cfm?fuseaction=home.showFile&rep=file&fil=CHAMP_intro.pdf, last download 18.04.2016; ; http://ec.europa.eu/environment/life/project/Projects/index.cfm?fuseaction=home.showFile&rep=file&fil=CHAMP_guide_1.pdf, last download 18.04.2016
Bedroshruti Sadhukan, Emani Kumar, Andrea Burzacchini, Holger Robrecht et.al: ecoBudget Guide for Asian Local Authorities, 2008
European Commission: Integrated Environmental Management. Guidance in relation to the Thematic Strategy on the Urban Environment, Technical Report 2007-013,
http://www.ccre.org/docs/guide_environment_mangement.pdf, last download 18.04.2016
UN HABITAT, UNEP, ICLEI, ecoBUDGET . Introduction for Mayors and Municipal Councillors,
http://www.unep.org/Urban_Environment/PDFs/ICLEI_Ecobudget.pdf, last download 18.04.2016
ICLEI et.al: The Aalborg Commitment Implementation Guide. A 5-step http://www.sustainablecities.eu/fileadmin/content/JOIN/The_Aalborg_Commitme
117
approach, Aalborg 2007 nts_Implementation_website.pdf, last download 18.04.2016
Holger Robrecht, Henrik Frijs, Andrea Burzacchini: The ecoBudget Guide, Växjö 2004
http://ec.europa.eu/environment/life/project/Projects/index.cfm?fuseaction=home.showFile&rep=file&fil=ecoBUDGET_Manual.pdf, last download 18.04.2016
UNEP, ICLEI, FIDIC (editors): Urban Environmental Management Training Resource Kit, Osaka 2001
-
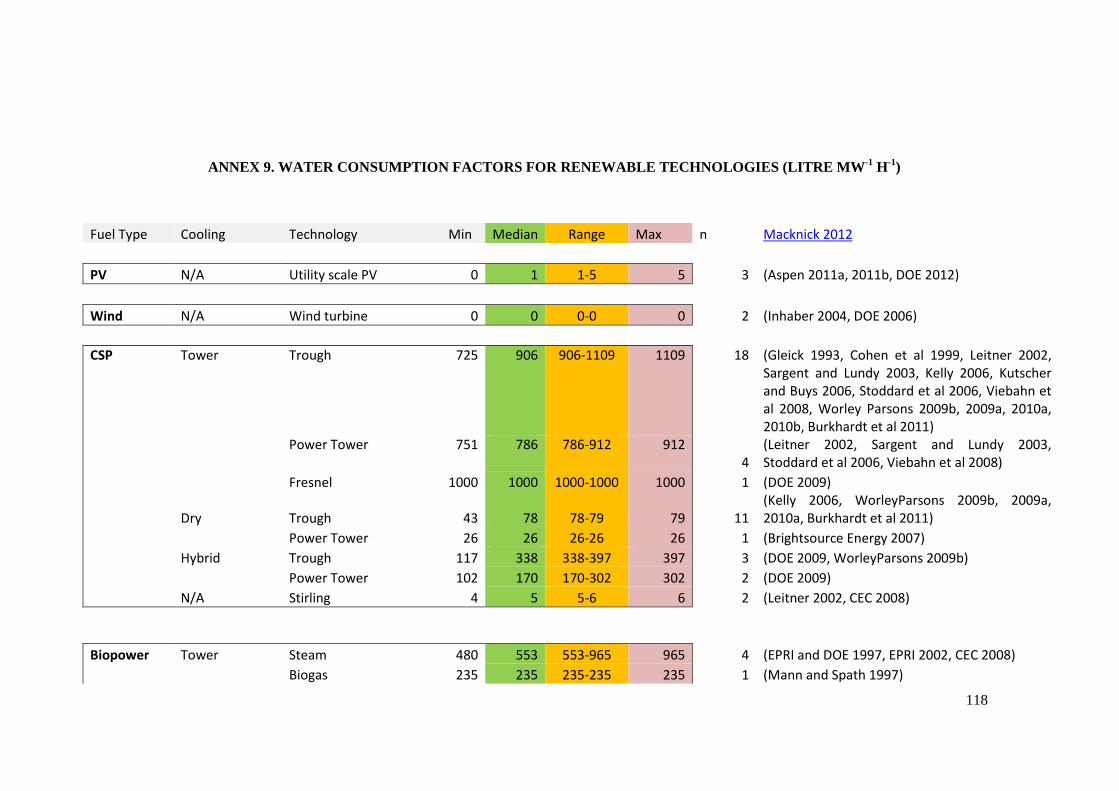
118
ANNEX 9. WATER CONSUMPTION FACTORS FOR RENEWABLE TECHNOLOGIES (LITRE MW-1
H-1
)
Fuel Type Cooling Technology Min Median Range Max n Macknick 2012
PV N/A Utility scale PV 0 1 1-5 5 3 (Aspen 2011a, 2011b, DOE 2012)
Wind N/A Wind turbine 0 0 0-0 0 2 (Inhaber 2004, DOE 2006)
CSP Tower Trough 725 906 906-1109 1109 18 (Gleick 1993, Cohen et al 1999, Leitner 2002, Sargent and Lundy 2003, Kelly 2006, Kutscher and Buys 2006, Stoddard et al 2006, Viebahn et al 2008, Worley Parsons 2009b, 2009a, 2010a, 2010b, Burkhardt et al 2011)
Power Tower 751 786 786-912 912
4 (Leitner 2002, Sargent and Lundy 2003, Stoddard et al 2006, Viebahn et al 2008)
Fresnel 1000 1000 1000-1000 1000 1 (DOE 2009)
Dry Trough 43 78 78-79 79 11 (Kelly 2006, WorleyParsons 2009b, 2009a, 2010a, Burkhardt et al 2011)
Power Tower 26 26 26-26 26 1 (Brightsource Energy 2007)
Hybrid Trough 117 338 338-397 397 3 (DOE 2009, WorleyParsons 2009b)
Power Tower 102 170 170-302 302 2 (DOE 2009)
N/A Stirling 4 5 5-6 6 2 (Leitner 2002, CEC 2008)
Biopower Tower Steam 480 553 553-965 965 4 (EPRI and DOE 1997, EPRI 2002, CEC 2008)
Biogas 235 235 235-235 235 1 (Mann and Spath 1997)

119
Once-through Steam 300 300 300-300 300 1 (EPRI 2002)
Pond Steam 300 390 390-480 480 1 (EPRI 2002)
Dry Biogas 35 35 35-35 35 1 (EPRI and DOE 1997)
Geothermal Tower Flash 5 15 15-361 361 4 (Kagel et al 2007, CEC 2008, Adee and Moore 2010, Clark et al 2011)
Dry Flash 5 5 5-5 5 1 (Clark et al 2011)
Binary 270 270 270-270 270 1 (Clark et al 2011)
EGS 290 505 505-720 720 1 (Clark et al 2011)
Hybrid Binary 221 461 461-700 700 2 (Kutscher and Costenaro 2002, Kozubal and
Kutscher 2003)
Hydropower N/A In-stream and reservoir 1425 4491 4491-18000
18000 3 (Gleick 1992, Torcellini et al 2003)
Nuclear Tower Generic 581 672 672-845 845 6 (Gleick 1993, EPRI 2002, Dziegielewski and Bik 2006, WRA 2008, NETL 2009a)
Once-through Generic 100 269 269-400 400 4 (EPRI 2002, Hoffmann et al 2004, Dziegielewski and Bik 2006, NETL 2009a)
Pond Generic 560 610 610-720 720 2 (EPRI 2002, Dziegielewski and Bik 2006)
Natural Gas Tower Combined Cycle 130 205 205-300 300 6 (EPRI 2002, Leitner 2002, NETL 2007c, 2009a, 2010a, 2010c)
Steam 662 826 826-1170 1170 4 (Gleick 1993, Feeley et al 2005, CEC 2008, WRA 2008)
Combined Cycle w/ CCS 378 393 393-407 407 2 (NETL 2010a, 2010c)
Once-through Combined Cycle 20 100 100-100 100 3 (EPRI 2002, Feeley et al 2005, NETL 2009a)
Steam 95 240 240-291 291 2 (Gleick 1993, CEC 2008)
Pond Combined Cycle 240 240 240-240 240 1 (NETL 2009a)
Dry Combined Cycle 0 2 2-4 4 2 (EPRI 2002, NETL 2009a)

120
Coal Tower Generic 480 687 687-1100 1100 5 (Gleick 1993, EPRI 2002, Hoffmann et al 2004, Dziegielewski and Bik 2006, WRA 2008)
Subcritical 394 479 479-664 664 7 (NETL 2007c, 2009a, 2009b, 2010a, 2010b)
Supercritical 445 493 493-594 594 8 (NETL 2007c, 2009a, 2009b, 2010a, 2010c, Zhai et al 2011)
IGCC 318 380 380-439 439 8 (NETL 2007c, 2010a, 2010c)
Subcritical with CCS 394 479 479-664 664 7 (NETL 2010a, 2010c)
Supercritical with CCS 445 493 493-594 594 8 (NETL 2010a, 2010c, Zhai et al 2011)
IGCC with CCS 318 380 380-439 439 8 (NETL 2010a, 2010c)
Once-through Generic 100 250 250-317 317 4 (Gleick 1993, EPRI 2002, Hoffmann et al 2004, Dziegielewski and Bik 2006)
Subcritical 71 113 113-138 138 3 (NETL 2009a)
Supercritical 64 103 103-124 124 3 (NETL 2009a)
Pond Generic 300 545 545-700 700 2 (EPRI 2002, Dziegielewski and Bik 2006)
Subcritical 737 779 779-804 804 3 (NETL 2009a)
Supercritical 4 42 42-64 64 3 (NETL 2009a)


![ESP Price List 1 - 4 - B.S.ELECTRICALSbselectricals.net/resources/08-07-2017 ESP Price List 01JUL2017.pdf · *Subject to change as per Govt. notification [Green colour : 18%* GST]](https://img.pdfslide.net/doc/110x75/5ab2da737f8b9ac66c8daed3/esp-price-list-1-4-bselec-esp-price-list-01jul2017pdfsubject-to-change-as.jpg)