Embed Size (px)
Citation preview

Green Construction Board Low Carbon Routemap for the Built Environment
2015 Routemap Progress | Technical Report
15 December 2015

Green Construction Board Low Carbon Routemap for the Built Environment2015 Routemap Progress | Technical Report
REP/01 | Final issue | 15 December 2016
Contents
Page
Executive Summary
1 Introduction 2
2 Built environment outturn carbon emissions 3
2.1 Outturn against the 1990 carbon emissions baseline 3
2.2 Outturn against the built environment routemap 80% reduction trajectory 4
2.3 Outturn against the Construction Strategy 2025 ambition 5
3 Outturn carbon emission breakdowns 6
3.1 Operational carbon 6
3.2 Capital carbon 8
3.3 Sector perspectives 11
3.4 A perspective on use carbon 13
3.5 Grid decarbonisation 14
4 Emerging Themes 16
Appendices
Appendix A
The Built Environment
Appendix B
Data Updates
Green Construction Board Low Carbon Routemap for the Built Environment2015 Routemap Progress | Technical Report
REP/01 | Final issue | 15 December 2016
Page 1
Executive Summary
This report provides an update on the carbon emissions of the UK’s built
environment as defined in the Green Construction Board Low Carbon Routemap
for the Built Environment. The study is based on more recently available data and
uses the original routemap carbon calculation model.
Results provide an insight to emissions outturn against the original routemap
projections, and also to progress to future ambitions as set out in Construction
2025 (50% reduction on 1990 levels) and the statutory targets for the UK (80%
reduction on 1990 levels).
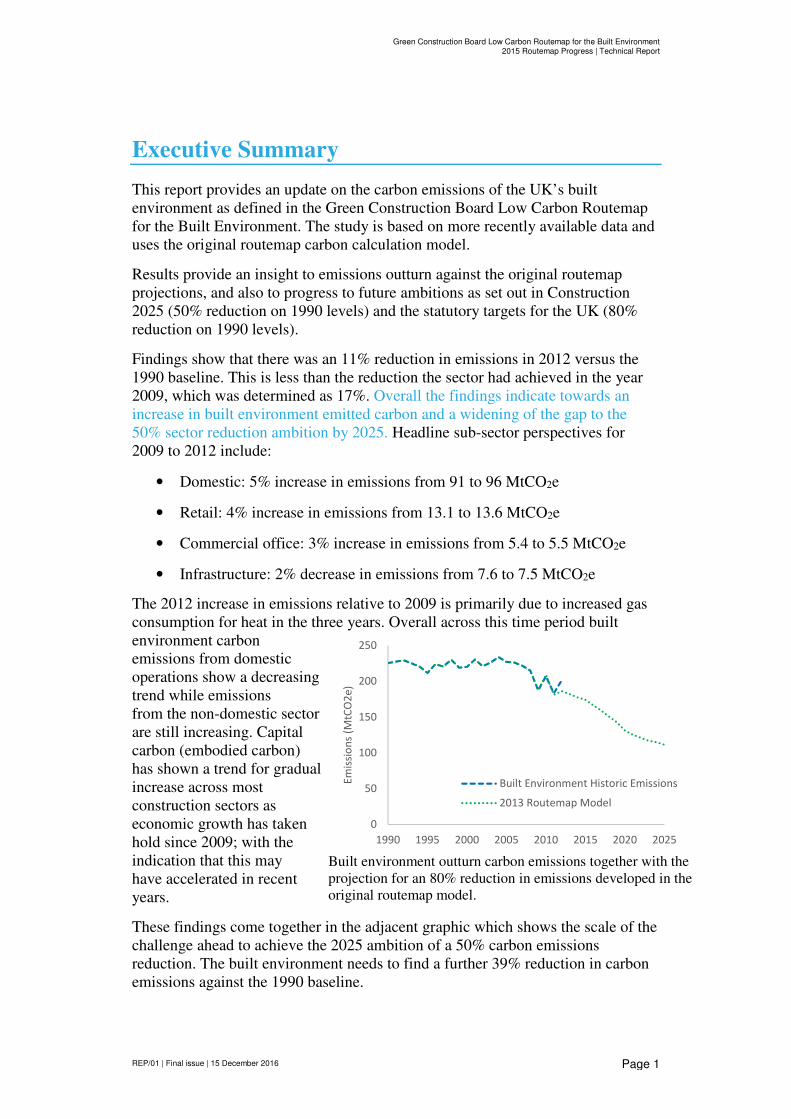
Findings show that there was an 11% reduction in emissions in 2012 versus the
1990 baseline. This is less than the reduction the sector had achieved in the year
2009, which was determined as 17%. Overall the findings indicate towards an
increase in built environment emitted carbon and a widening of the gap to the
50% sector reduction ambition by 2025. Headline sub-sector perspectives for
2009 to 2012 include:
• Domestic: 5% increase in emissions from 91 to 96 MtCO2e
• Retail: 4% increase in emissions from 13.1 to 13.6 MtCO2e
• Commercial office: 3% increase in emissions from 5.4 to 5.5 MtCO2e
• Infrastructure: 2% decrease in emissions from 7.6 to 7.5 MtCO2e
The 2012 increase in emissions relative to 2009 is primarily due to increased gas
consumption for heat in the three years. Overall across this time period built
environment carbon
emissions from domestic
operations show a decreasing
trend while emissions
from the non-domestic sector
are still increasing. Capital
carbon (embodied carbon)
has shown a trend for gradual
increase across most
construction sectors as
economic growth has taken
hold since 2009; with the
indication that this may
have accelerated in recent
years.
These findings come together in the adjacent graphic which shows the scale of the
challenge ahead to achieve the 2025 ambition of a 50% carbon emissions
reduction. The built environment needs to find a further 39% reduction in carbon
emissions against the 1990 baseline.
Built environment outturn carbon emissions together with the
projection for an 80% reduction in emissions developed in the
original routemap model.
0
50
100
150
200
250
1990 1995 2000 2005 2010 2015 2020 2025
Em
issi
on
s (M
tCO
2e
)
Built Environment Historic Emissions
2013 Routemap Model
Green Construction Board Low Carbon Routemap for the Built Environment2015 Routemap Progress | Technical Report
REP/01 | Final issue | 15 December 2016
Page 2
1 Introduction
This report provides an update on the carbon emissions of the UK’s built
environment as defined in the Green Construction Board (GCB) Low Carbon
Routemap for the Built Environment (2013)1. This work was carried out by Arup
and the Centre for Industrial Energy, Materials and Products (CIEMAP) based at
the University of Leeds.
The report provides a summary of the built environment outturn carbon emissions
presented against the ambition for emissions reduction in 2025 (down 50% on
1990 levels) and 2050 (down 80% on 1990 levels). Findings are also shown
against the original modelled trajectories in the 2013 routemap and chapters
provide information on sectoral emissions breakdowns and discuss emerging
themes.
Appendices are included which explain the scope of the study and which provide
a summary of the modelling and calculations applied in the update.
1http://www.greenconstructionboard.org/otherdocs/Routemap%20final%20report%2005032013.pdf
Green Construction Board Low Carbon Routemap for the Built Environment2015 Routemap Progress | Technical Report
REP/01 | Final issue | 15 December 2016
Page 3
2 Built environment outturn carbon emissions
This section provides a summary of performance of built environment carbon
emissions against the 1990 baseline and the GCB’s ambitions for 2025 and 2050.
Comparison is also made against the 2013 modelled trajectories.
While the original routemap included accurate historic data across all modelled
sectors to 2009; this report covers findings up to 2012, as well as later years in
some sectors where data was available to inform the model and report.
2.1 Outturn against the 1990 carbon emissions
baseline
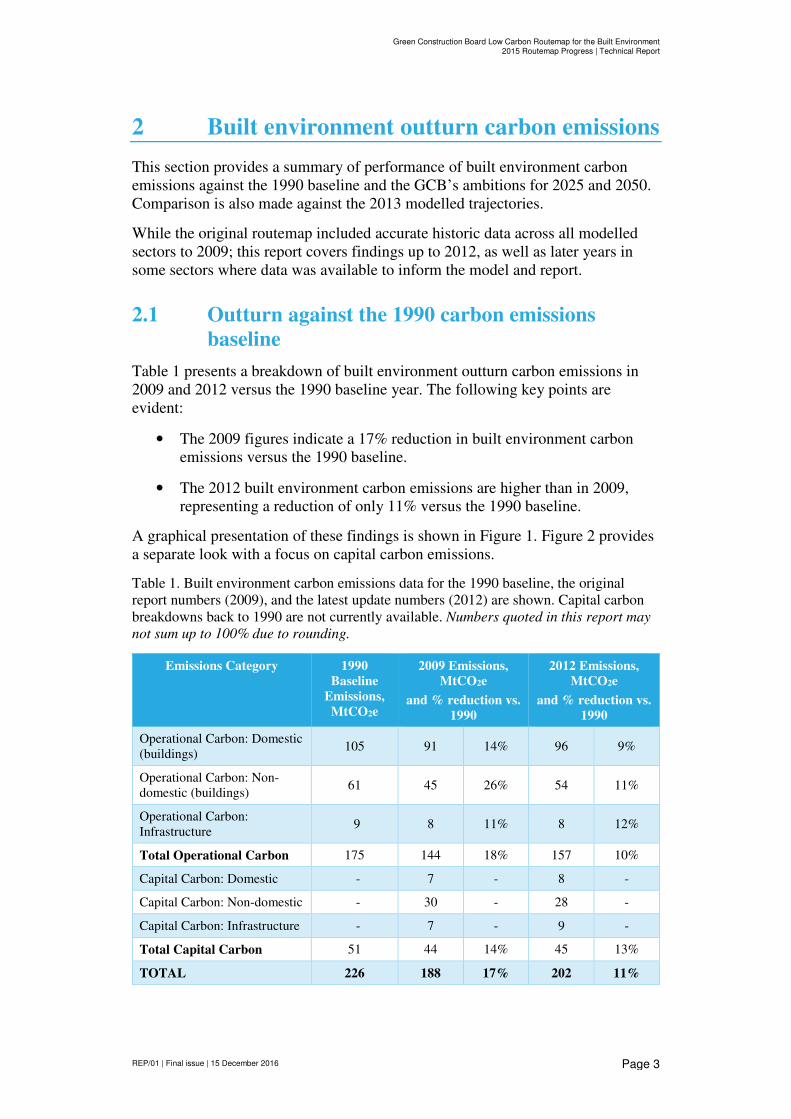
Table 1 presents a breakdown of built environment outturn carbon emissions in
2009 and 2012 versus the 1990 baseline year. The following key points are
evident:
• The 2009 figures indicate a 17% reduction in built environment carbon
emissions versus the 1990 baseline.
• The 2012 built environment carbon emissions are higher than in 2009,
representing a reduction of only 11% versus the 1990 baseline.
A graphical presentation of these findings is shown in Figure 1. Figure 2 provides
a separate look with a focus on capital carbon emissions.
Table 1. Built environment carbon emissions data for the 1990 baseline, the original
report numbers (2009), and the latest update numbers (2012) are shown. Capital carbon
breakdowns back to 1990 are not currently available. Numbers quoted in this report may
not sum up to 100% due to rounding.
Emissions Category 1990
Baseline
Emissions,
MtCO2e
2009 Emissions,
MtCO2e
and % reduction vs.
1990
2012 Emissions,
MtCO2e
and % reduction vs.
1990
Operational Carbon: Domestic
(buildings) 105 91 14% 96 9%
Operational Carbon: Non-
domestic (buildings) 61 45 26% 54 11%
Operational Carbon:
Infrastructure 9 8 11% 8 12%
Total Operational Carbon 175 144 18% 157 10%
Capital Carbon: Domestic - 7 - 8 -
Capital Carbon: Non-domestic - 30 - 28 -
Capital Carbon: Infrastructure - 7 - 9 -
Total Capital Carbon 51 44 14% 45 13%
TOTAL 226 188 17% 202 11%

Green Construction Board Low Carbon Routemap for the Built Environment2015 Routemap Progress | Technical Report
REP/01 | Final issue | 15 December 2016
Page 4
Figure 1. Built environment carbon emissions by source: outturn from 1990 to 2012.
Figure 2. Capital carbon emissions: outturn performance from 1990 to 2012; note the
upwards trend into 2012 as the economy picks up and demand for construction materials
grows.
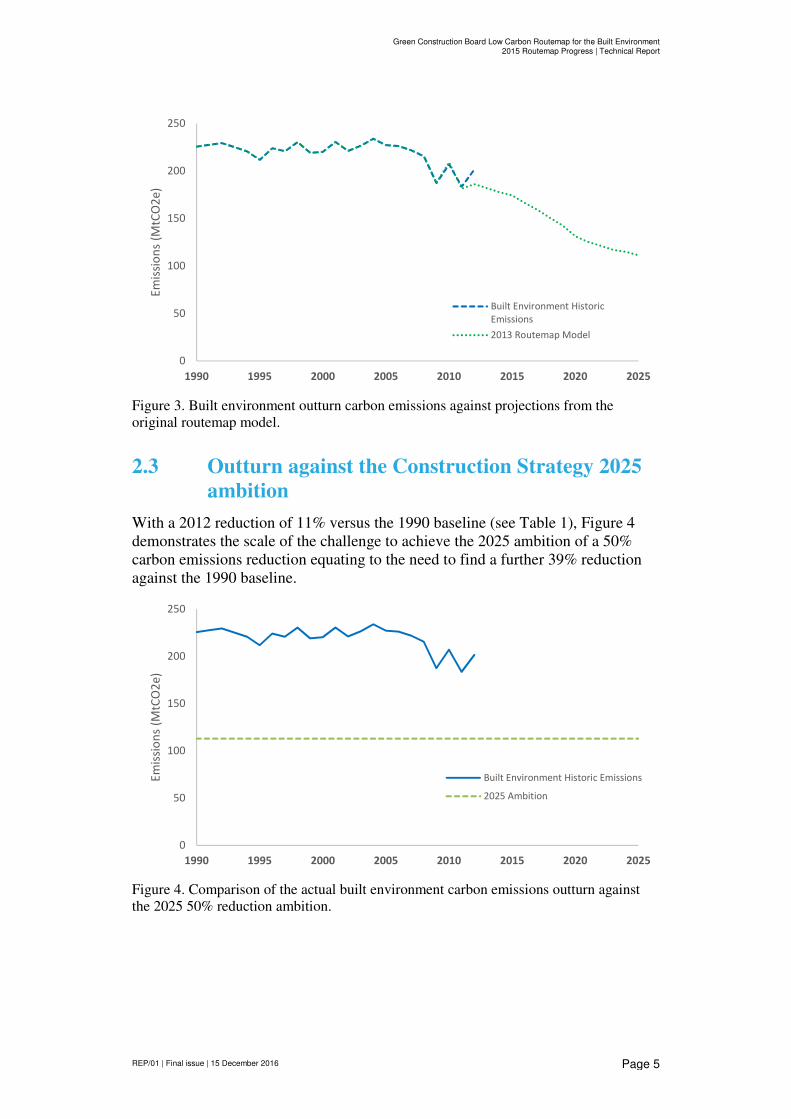
2.2 Outturn against the built environment routemap
80% reduction trajectory
Further context in relation to outturn against the ambitions of the 2013 built
environment routemap is provided in Figure 3. This shows that the main
divergence from the planned 80% reduction scenario occurs in 2011 and 2012,
and points toward the shortfall that needs to be made up to return to the desired
trajectory.
Unfortunately, as discussed in Section 3.1, it would appear that this gap is set to
further widen in 2013 at least, based on available operational carbon data and
indicative reference information on capital carbon.
0
50
100
150
200
250
1990 1992 1994 1996 1998 2000 2002 2004 2006 2008 2010 2012
Em
issi
on
s (M
tCO
2e
)
CapCarb
OpCarb: Infrastructure
OpCarb: Non-domestic
OpCarb: Domestic
0
25
50
75
1990 1992 1994 1996 1998 2000 2002 2004 2006 2008 2010 2012
Em
issi
on
s (M
tCO
2e
)
Green Construction Board Low Carbon Routemap for the Built Environment2015 Routemap Progress | Technical Report
REP/01 | Final issue | 15 December 2016
Page 5
Figure 3. Built environment outturn carbon emissions against projections from the
original routemap model.
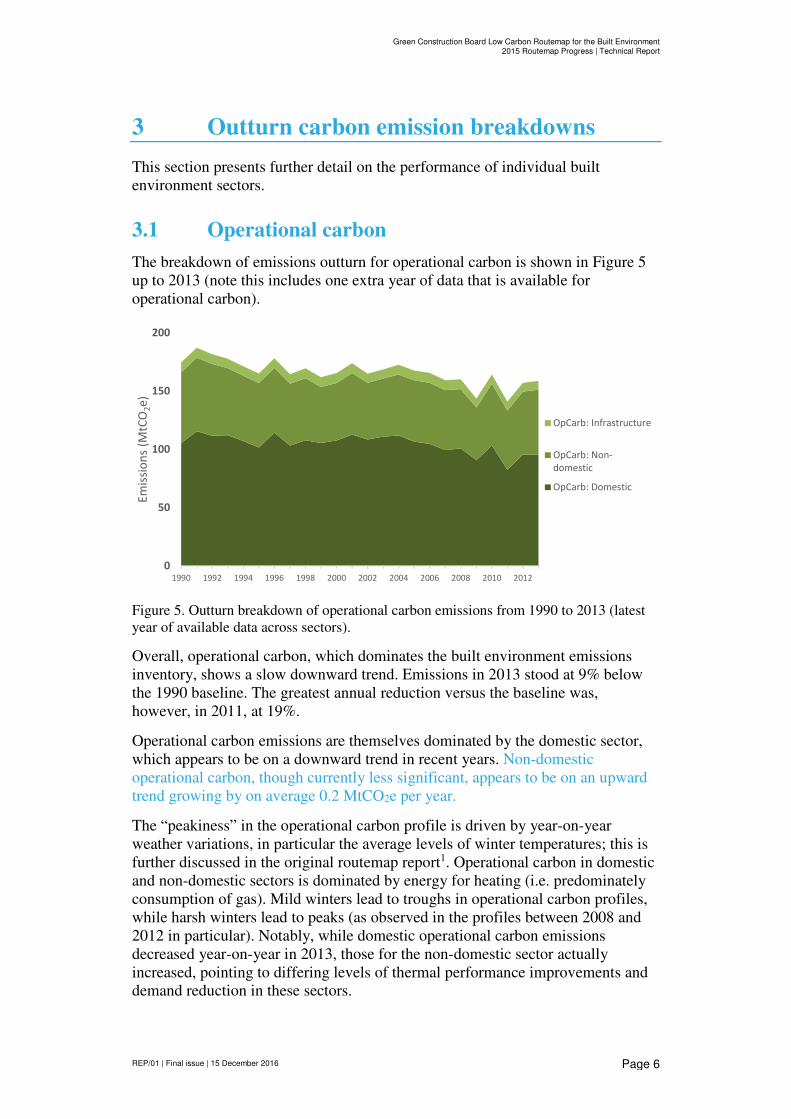
2.3 Outturn against the Construction Strategy 2025
ambition
With a 2012 reduction of 11% versus the 1990 baseline (see Table 1), Figure 4
demonstrates the scale of the challenge to achieve the 2025 ambition of a 50%
carbon emissions reduction equating to the need to find a further 39% reduction
against the 1990 baseline.
Figure 4. Comparison of the actual built environment carbon emissions outturn against
the 2025 50% reduction ambition.
0
50
100
150
200
250
1990 1995 2000 2005 2010 2015 2020 2025
Em
issi
on
s (M
tCO
2e
)
Built Environment Historic
Emissions
2013 Routemap Model
0
50
100
150
200
250
1990 1995 2000 2005 2010 2015 2020 2025
Em
issi
on
s (M
tCO
2e
)
Built Environment Historic Emissions
2025 Ambition
Green Construction Board Low Carbon Routemap for the Built Environment2015 Routemap Progress | Technical Report
REP/01 | Final issue | 15 December 2016
Page 6
3 Outturn carbon emission breakdowns
This section presents further detail on the performance of individual built
environment sectors.
3.1 Operational carbon
The breakdown of emissions outturn for operational carbon is shown in Figure 5
up to 2013 (note this includes one extra year of data that is available for
operational carbon).
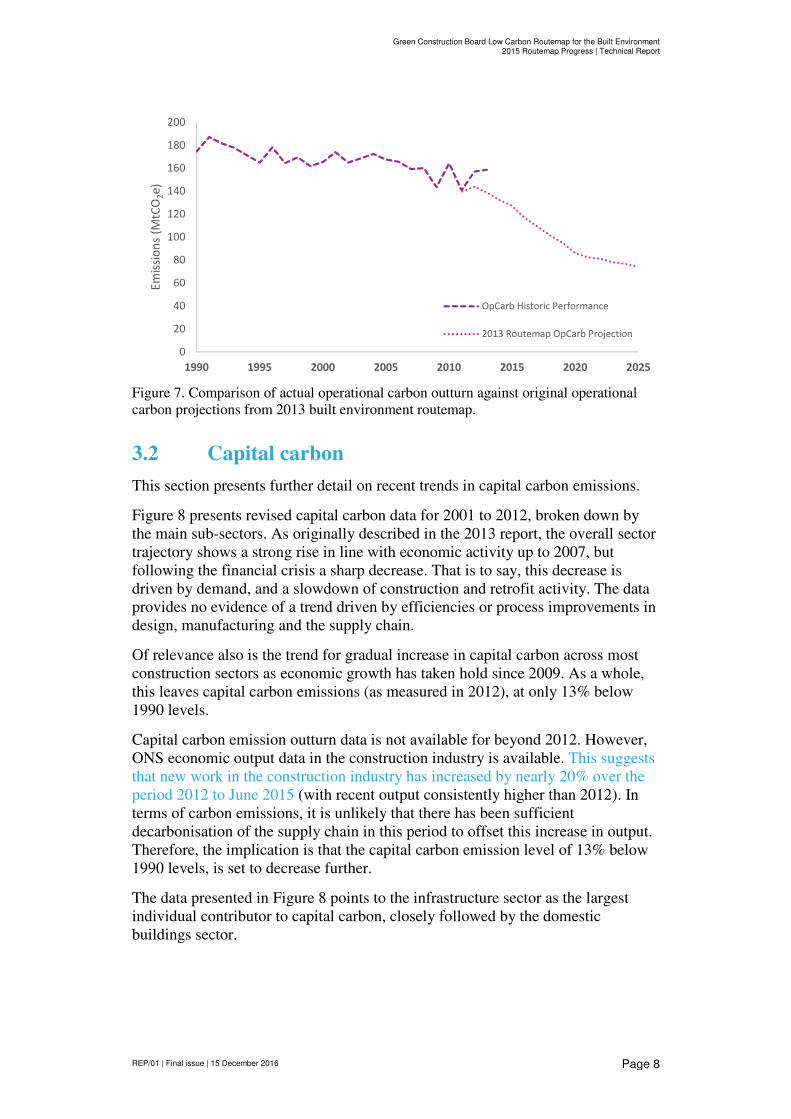
Figure 5. Outturn breakdown of operational carbon emissions from 1990 to 2013 (latest
year of available data across sectors).
Overall, operational carbon, which dominates the built environment emissions
inventory, shows a slow downward trend. Emissions in 2013 stood at 9% below
the 1990 baseline. The greatest annual reduction versus the baseline was,
however, in 2011, at 19%.
Operational carbon emissions are themselves dominated by the domestic sector,
which appears to be on a downward trend in recent years. Non-domestic
operational carbon, though currently less significant, appears to be on an upward
trend growing by on average 0.2 MtCO2e per year.
The “peakiness” in the operational carbon profile is driven by year-on-year
weather variations, in particular the average levels of winter temperatures; this is
further discussed in the original routemap report1. Operational carbon in domestic
and non-domestic sectors is dominated by energy for heating (i.e. predominately
consumption of gas). Mild winters lead to troughs in operational carbon profiles,
while harsh winters lead to peaks (as observed in the profiles between 2008 and
2012 in particular). Notably, while domestic operational carbon emissions
decreased year-on-year in 2013, those for the non-domestic sector actually
increased, pointing to differing levels of thermal performance improvements and
demand reduction in these sectors.
0
50
100
150
200
1990 1992 1994 1996 1998 2000 2002 2004 2006 2008 2010 2012
Em
issi
on
s (M
tCO
2e
)
OpCarb: Infrastructure
OpCarb: Non-
domestic
OpCarb: Domestic

Green Construction Board Low Carbon Routemap for the Built Environment2015 Routemap Progress | Technical Report
REP/01 | Final issue | 15 December 2016
Page 7
The above observations are consistent with the findings in the most recent
Committee on Climate Change reports2 for the UK (noting the different system
boundaries).
Figure 6. Breakdown of 2012 operational carbon emissions by sector (left bar) and source
(right bar).
Figure 6 provides greater insight into the primary emissions sources of operational
carbon, using 2012 data. Heating across domestic and non-domestic sectors is
responsible for 99 MtCO2e of emissions, almost two thirds of the operational
total. If hot water and cooling and ventilation are included as well, emissions
associated with the provision of thermal comfort total 124 MtCO2e, nearly four
fifths of the 2012 total.
Comparing operational carbon emissions outturn against those originally
projected in 2013 (see Figure 7), shows a divergence from ‘plan’; and operational
carbon emission in 2013 are 14% above where they would ideally have been for
that year. Had the 2013 winter been harsher, it is likely that this divergence would
have been greater still.
2 https://d2kjx2p8nxa8ft.cloudfront.net/wp-
content/uploads/2015/06/6.738_CCC_ExecSummary_2015_FINAL_WEB_250615.pdf
Infrastructure
Lighting
Cooling & Ventilation
Hot Water
Heating
Lighting
Hot Water
Heating
Domestic
Buildings
Non-domestic
buildings
Infrastructure
0
20
40
60
80
100
120
140
160
180
MtC
O2e
Green Construction Board Low Carbon Routemap for the Built Environment2015 Routemap Progress | Technical Report
REP/01 | Final issue | 15 December 2016
Page 8
Figure 7. Comparison of actual operational carbon outturn against original operational
carbon projections from 2013 built environment routemap.
3.2 Capital carbon
This section presents further detail on recent trends in capital carbon emissions.
Figure 8 presents revised capital carbon data for 2001 to 2012, broken down by
the main sub-sectors. As originally described in the 2013 report, the overall sector
trajectory shows a strong rise in line with economic activity up to 2007, but
following the financial crisis a sharp decrease. That is to say, this decrease is
driven by demand, and a slowdown of construction and retrofit activity. The data
provides no evidence of a trend driven by efficiencies or process improvements in
design, manufacturing and the supply chain.
Of relevance also is the trend for gradual increase in capital carbon across most
construction sectors as economic growth has taken hold since 2009. As a whole,
this leaves capital carbon emissions (as measured in 2012), at only 13% below
1990 levels.
Capital carbon emission outturn data is not available for beyond 2012. However,
ONS economic output data in the construction industry is available. This suggests
that new work in the construction industry has increased by nearly 20% over the
period 2012 to June 2015 (with recent output consistently higher than 2012). In
terms of carbon emissions, it is unlikely that there has been sufficient
decarbonisation of the supply chain in this period to offset this increase in output.
Therefore, the implication is that the capital carbon emission level of 13% below
1990 levels, is set to decrease further.
The data presented in Figure 8 points to the infrastructure sector as the largest
individual contributor to capital carbon, closely followed by the domestic
buildings sector.
0
20
40
60
80
100
120
140
160
180
200
1990 1995 2000 2005 2010 2015 2020 2025
Em
issi
on
s (M
tCO
2e
)
OpCarb Historic Performance
2013 Routemap OpCarb Projection

Green Construction Board Low Carbon Routemap for the Built Environment2015 Routemap Progress | Technical Report
REP/01 | Final issue | 15 December 2016
Page 9
Figure 8. Capital carbon actual breakdown, with detailed split for 2012 (the latest year of
data available). The ‘other non-domestic’ sector includes communication, government,
hotel and catering, sports and leisure, warehouses and other.
The capital carbon breakdown can also be compared with that for operational
carbon, as shown in Figure 9. It can be seen in this figure that the profile of
operational versus capital is considerably different, with domestic buildings
contributing a far greater proportion of operational emissions than capital
emissions. Conversely, infrastructure operational emissions are far less significant
than the sector’s capital carbon emissions.
Figure 9. Detailed sector splits for operational carbon (pie chart on the left) and capital
carbon (pie chart on the right) for 2012.
0
10
20
30
40
50
60
70
2001 2003 2005 2007 2009 2011
Em
issi
on
s (M
tCO
2e
)
Infrastructure
Other non-domestic
Retail
Offices
Health
Education
Domestic
17%
6%
3%
9%
6%38%
21%
Domestic
Education
Health
Offices
Retail
Other non-domestic
Infrastructure
2012
CapCarb
45 MtCO2e
61%
4%
2%
4%
9%
15%
5%
2012
OpCarb
157 MtCO2e

Green Construction Board Low Carbon Routemap for the Built Environment2015 Routemap Progress | Technical Report
REP/01 | Final issue | 15 December 2016
Page 10
3.2.1 Geographical origin of capital carbon emissions
University of Leeds CIEMAP modelling allows for a perspective on the emissions
contributions of materials production in different regions. Trends in the regional
carbon emissions breakdown for capital carbon in the built environment are
shown in Figure 10. While emissions arising from China and the EU have
remained relatively constant (and equal) since 2003, there is notable growth in
emissions arising from within the UK, mainly at the expense of emissions
imported from the rest of the world (RoW) region.
It is important to recognise that these trends are attributable to both the amount of
materials sourced from each region (relevant for the UK component in particular),
and the carbon intensity of manufacture and materials extraction in those regions.
Early indications3 point to increases in the proportion of carbon emissions from
China by 2014/15 due to increased imports from (relatively carbon-intensive)
Chinese manufacturers.
Figure 10. CIEMAP modelling of capital carbon contribution from the four main regions,
by year. RoW = Rest of the World.
3 Based on CIEMAP analysis.
0%
10%
20%
30%
40%
50%
60%
70%
19
97
19
98
19
99
20
00
20
01
20
02
20
03
20
04
20
05
20
06
20
07
20
08
20
09
20
10
20
11
UK
EU
RoW
China
Green Construction Board Low Carbon Routemap for the Built Environment2015 Routemap Progress | Technical Report
REP/01 | Final issue | 15 December 2016
Page 11
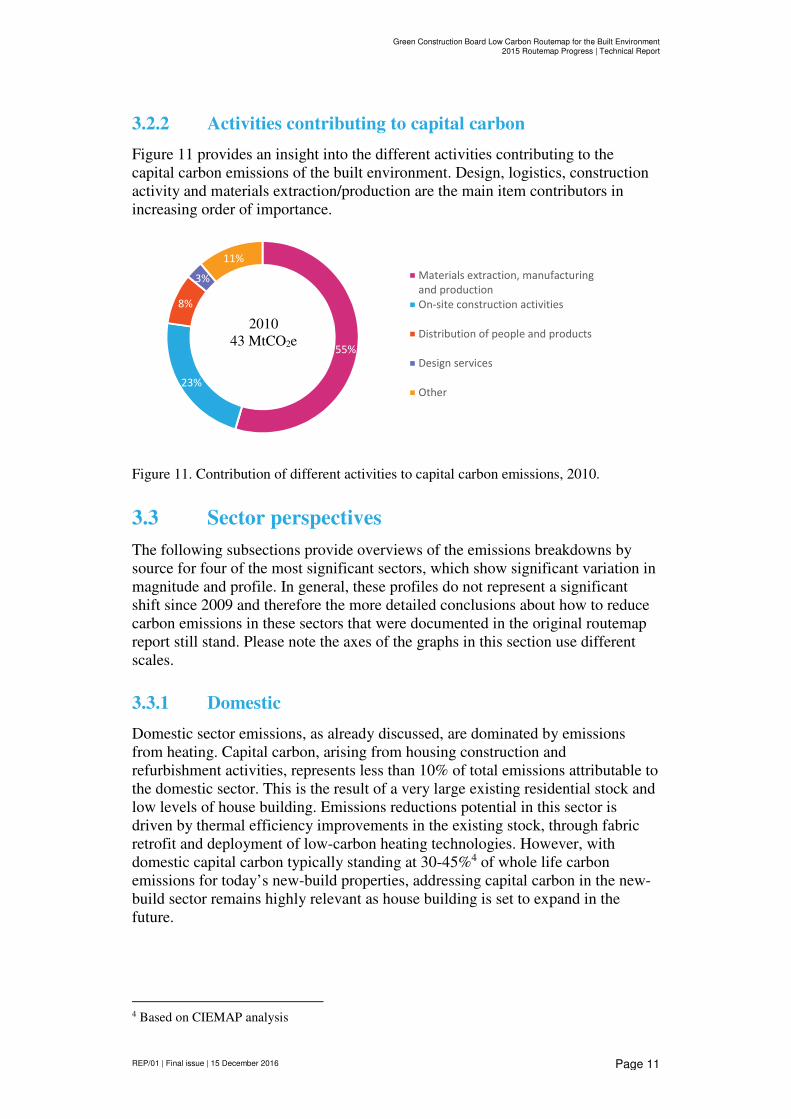
3.2.2 Activities contributing to capital carbon
Figure 11 provides an insight into the different activities contributing to the
capital carbon emissions of the built environment. Design, logistics, construction
activity and materials extraction/production are the main item contributors in
increasing order of importance.
Figure 11. Contribution of different activities to capital carbon emissions, 2010.
3.3 Sector perspectives
The following subsections provide overviews of the emissions breakdowns by
source for four of the most significant sectors, which show significant variation in
magnitude and profile. In general, these profiles do not represent a significant
shift since 2009 and therefore the more detailed conclusions about how to reduce
carbon emissions in these sectors that were documented in the original routemap
report still stand. Please note the axes of the graphs in this section use different
scales.
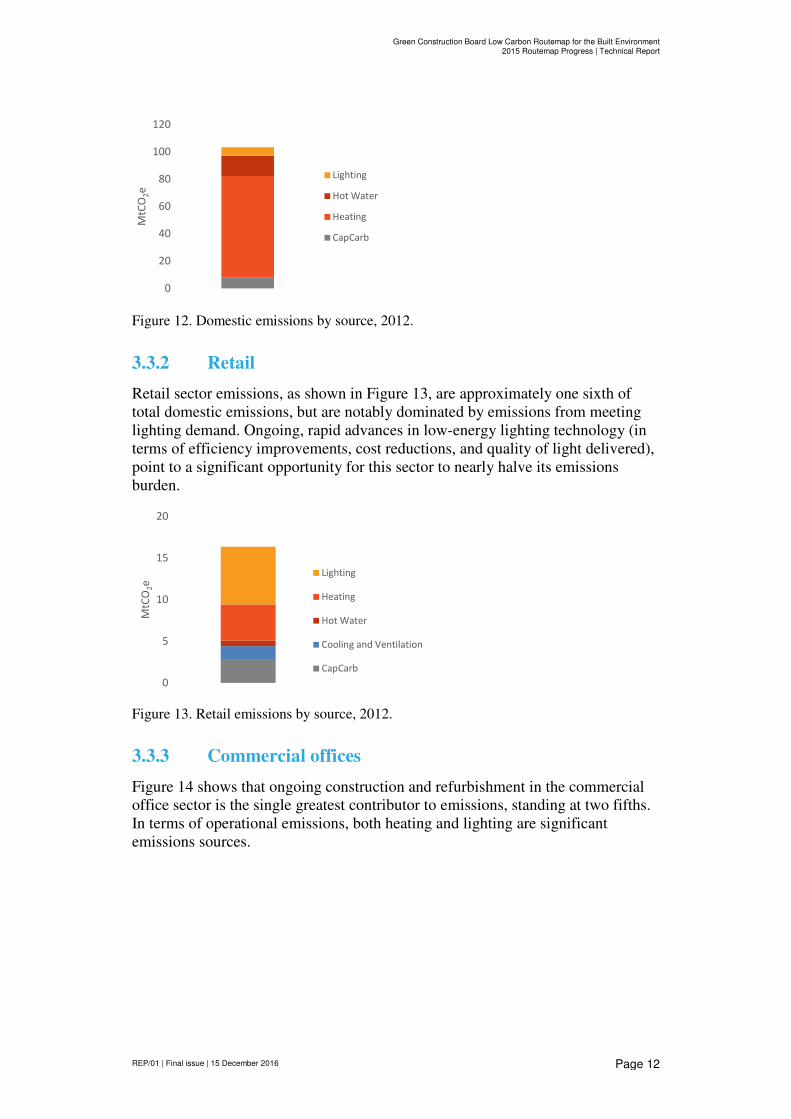
3.3.1 Domestic
Domestic sector emissions, as already discussed, are dominated by emissions
from heating. Capital carbon, arising from housing construction and
refurbishment activities, represents less than 10% of total emissions attributable to
the domestic sector. This is the result of a very large existing residential stock and
low levels of house building. Emissions reductions potential in this sector is
driven by thermal efficiency improvements in the existing stock, through fabric
retrofit and deployment of low-carbon heating technologies. However, with
domestic capital carbon typically standing at 30-45%4 of whole life carbon
emissions for today’s new-build properties, addressing capital carbon in the new-
build sector remains highly relevant as house building is set to expand in the
future.
4 Based on CIEMAP analysis
55%
23%
8%
3%
11%
Materials extraction, manufacturing
and production
On-site construction activities
Distribution of people and products
Design services
Other
2010
43 MtCO2e
Green Construction Board Low Carbon Routemap for the Built Environment2015 Routemap Progress | Technical Report
REP/01 | Final issue | 15 December 2016
Page 12
Figure 12. Domestic emissions by source, 2012.
3.3.2 Retail
Retail sector emissions, as shown in Figure 13, are approximately one sixth of
total domestic emissions, but are notably dominated by emissions from meeting
lighting demand. Ongoing, rapid advances in low-energy lighting technology (in
terms of efficiency improvements, cost reductions, and quality of light delivered),
point to a significant opportunity for this sector to nearly halve its emissions
burden.
Figure 13. Retail emissions by source, 2012.
3.3.3 Commercial offices
Figure 14 shows that ongoing construction and refurbishment in the commercial
office sector is the single greatest contributor to emissions, standing at two fifths.
In terms of operational emissions, both heating and lighting are significant
emissions sources.
0
20
40
60
80
100
120
MtC
O2e
Lighting
Hot Water
Heating
CapCarb
0
5
10
15
20
MtC
O2e
Lighting
Heating
Hot Water
Cooling and Ventilation
CapCarb

Green Construction Board Low Carbon Routemap for the Built Environment2015 Routemap Progress | Technical Report
REP/01 | Final issue | 15 December 2016
Page 13
Figure 14. Commercial offices emissions by source, 2012.
3.3.4 Infrastructure
Emissions from the infrastructure sector, as shown in Figure 15, arise from capital
carbon, outdoor lighting, C&D waste treatment and disposal, and water and
wastewater services (i.e. electricity demand and process emissions). Figure 18
provides further clarity of the sector accounting boundaries. Annual construction
and maintenance activity and the capital carbon emissions they drive account for
over half of total infrastructure emissions, while water and wastewater services
are the greatest operational sources of emissions.
Figure 15. Infrastructure emissions by source, 2012.
3.4 A perspective on use carbon
This section presents a perspective on “use carbon”, the carbon emissions
associated with the use of the UK built environment (see Figure 20). This
emissions class is notionally outside the scope of the Green Construction Board
built environment low carbon routemap, but is something the industry should be
aware of and indeed is being addressed in part by PAS 2080 Carbon management
in infrastructure.
Figure 16 shows a comparison of operational carbon, capital carbon, and use
carbon emissions for the UK built environment in 2012, based on the emissions
associated with the following categories:5
5 Derived from high-level analysis of DECC’s Energy Consumption in the UK 2015 statistics
0
2
4
6
8
10
12
MtC
O2e
Lighting
Heating
Hot Water
Cooling and Ventilation
CapCarb
0
5
10
15
20
MtC
O2e Outdoor Lighting
Construction Waste
Water
CapCarb

Green Construction Board Low Carbon Routemap for the Built Environment2015 Routemap Progress | Technical Report
REP/01 | Final issue | 15 December 2016
Page 14
• Domestic: cooking, small appliances and plug loads
• Non-domestic: cooking, small appliances and plug loads
• Transport: road and rail travel (passenger and freight)
Figure 16. Breakdown of built environment emissions according to operational carbon,
capital carbon and use carbon in 2012. The pie chart on the left presents infrastructure,
domestic buildings and non-domestic buildings separately whilst the pie chart on the right
combines data across all into the three emission classes.
By including use carbon emissions in the built environment emissions inventory it
expands from 202 MtCO2e to 374 MtCO2e; a near-doubling (based on 2012 data).
While not insignificant in domestic and non-domestic buildings sectors, it is clear
that use carbon has the greatest impact in the infrastructure sector, where
vehicular emissions from road and rail alone are larger than the entire operational
carbon contribution of infrastructure, and are equal to nearly three times its total
capital carbon.
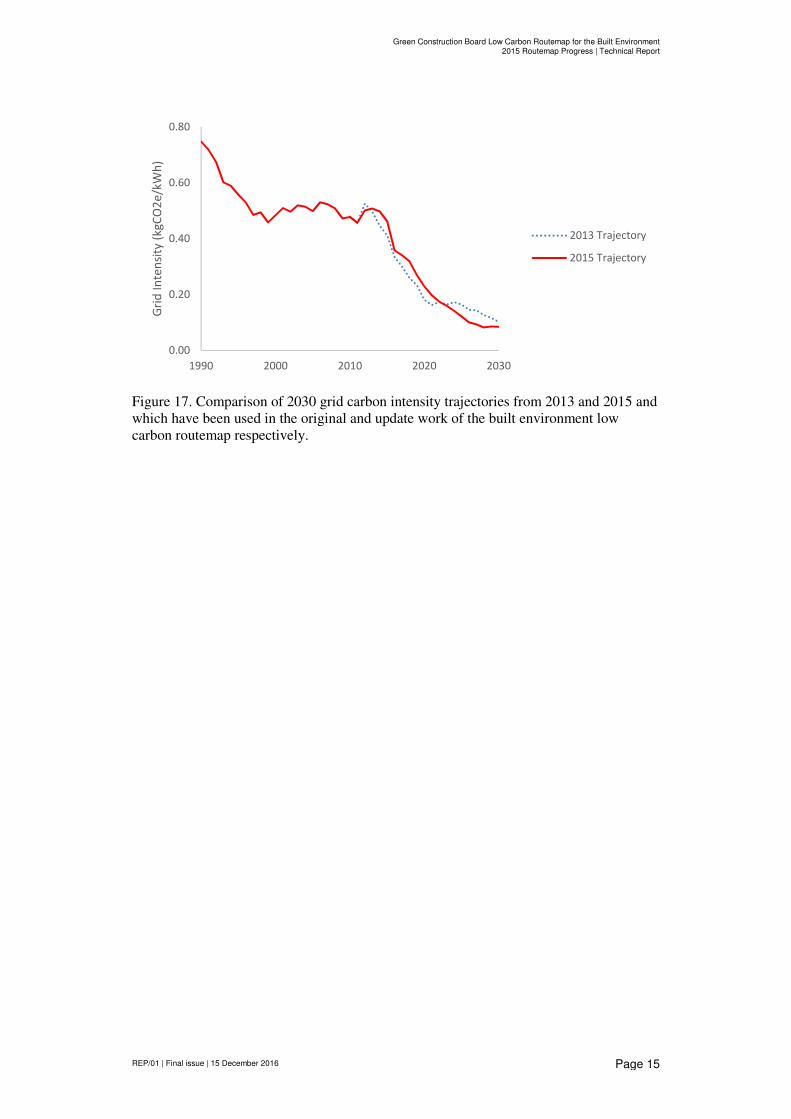
3.5 Grid decarbonisation
In conjunction with building-level energy efficiency improvements, the
decarbonisation of the electrical grid is a key factor in enabling the low carbon
futures foreseen in the 2013 built environment routemap. This is because it is
particularly important to the delivery of low carbon heat.
Figure 17 presents a comparison of the modelled UK electrical grid carbon
intensity in 2013 (as per DECC’s then central scenarios) and the updated analysis
for 2015. Whereas the 2013 trajectory foresaw a steep reduction in intensity
beginning in 2013, this had still not been achieved by 2015, resulting in higher
outturn emissions from electrical demands. Despite annual differences, the
trajectories are nevertheless still broadly similar, with 2015 estimates projecting
steep intensity declines over the next decade. The delivery of these reductions
continues to be key in the decarbonisation of the overall built environment.
Domestic OpCarb
25%
Domestic
UseCarb
10%
Non-domestic
OpCarb
14%
Non-domestic
UseCarb
5%
Inrastructure
OpCarb
2%
Infrastructure
UseCarb
32%
CapCarb
12%CapCarb
12%
OpCarb
42%
UseCarb
46%
2012
374 MtCO2e
2012
374 MtCO2e
Green Construction Board Low Carbon Routemap for the Built Environment2015 Routemap Progress | Technical Report
REP/01 | Final issue | 15 December 2016
Page 15
Figure 17. Comparison of 2030 grid carbon intensity trajectories from 2013 and 2015 and
which have been used in the original and update work of the built environment low
carbon routemap respectively.
0.00
0.20
0.40
0.60
0.80
1990 2000 2010 2020 2030
Gri
d I
nte
nsi
ty (
kg
CO
2e
/kW
h)
2013 Trajectory
2015 Trajectory
Green Construction Board Low Carbon Routemap for the Built Environment2015 Routemap Progress | Technical Report
REP/01 | Final issue | 15 December 2016
Page 16
4 Emerging Themes
Overall, it appears that the UK built environment is moving away from the
preferred trajectory for carbon emissions reduction. There has been a growing
divergence occurring over just a few years (2009 through 2013). Given the
steepness of the trajectory required to meet the ambition for built environment
carbon reductions (and statutory targets for the UK as a whole), a significant
transformation from the ongoing ‘status quo’ trajectory is needed.
Infrastructure continues to be an important sector, particularly from the capital
carbon perspective. Capital carbon emissions are projected to increase (as
concluded in the 2013 routemap report) to deliver essential services and also to
enable operational carbon savings to be delivered in the next 35 years. This trade-
off will be necessary, and points towards the need for carbon intensity targets (e.g.
tCO2/£, or tCO2/delivered unit of service) for capital carbon versus absolute
emissions targets, and to recognise the role of the supply chain. But this activity
must be directed to the delivery of low carbon infrastructure and buildings and not
merely growth in the built environment. There remains a need to decouple capital
carbon emissions from construction activity and this means addressing the
challenge of capital carbon (embodied carbon).
While historical evaluation of emissions (as is presented in this report) is valuable
for performance tracking (and will remain so); an increasing focus should be
placed on using regular forward emission estimates for driving future carbon
reductions. In a constantly changing world an ex-ante approach to assessment like
this would provide the GCB the ability to track and monitor progress on a regular
basis (perhaps annually) and therefore be more effective at informing policy,
industry strategy, and in taking action for emissions reduction in the built
environment.
A further theme to identify but which as yet has not been addressed by the built
environment routemap is carbon budget. This represents a challenge for the sector
and is the issue directly linked to warming scenarios. It is widely understood that
we need to stabilise carbon dioxide concentrations in the atmosphere to hold the
increase in global temperature to below 2 degrees Celsius in order to avoid
dangerous warming. This means emission budgets will have to be established and
delivered. The Committee on Climate Change has set out four carbon budgets for
the UK, but an important bit of work remains to map these more precisely to the
built environment (and the routemap trajectory), and therefore ensure it delivers
on these national budgetary objectives.
Delivery of low-carbon heat remains crucial in overall emissions reductions from
the built environment, assisted and enabled by continued decarbonisation of the
electricity grid. As per the Committee on Climate Change study2 this is the
primary driver of temperature-adjusted emissions reductions in the UK.

Appendix A
The Built Environment
Green Construction Board Low Carbon Routemap for the Built Environment2015 Routemap Progress | Technical Report
REP/01 | Final issue | 15 December 2016
Page A1
A1 Scope of the Built Environment Routemap
Understanding the results discussed in this report requires an understanding of the
scope and definition of the “Built Environment” as originally presented in 20131.
presents the detailed scope of GHG emissions sources covered by Arup’s model.
In summary, the built environment GHG emissions scope can be structured into
two categories:
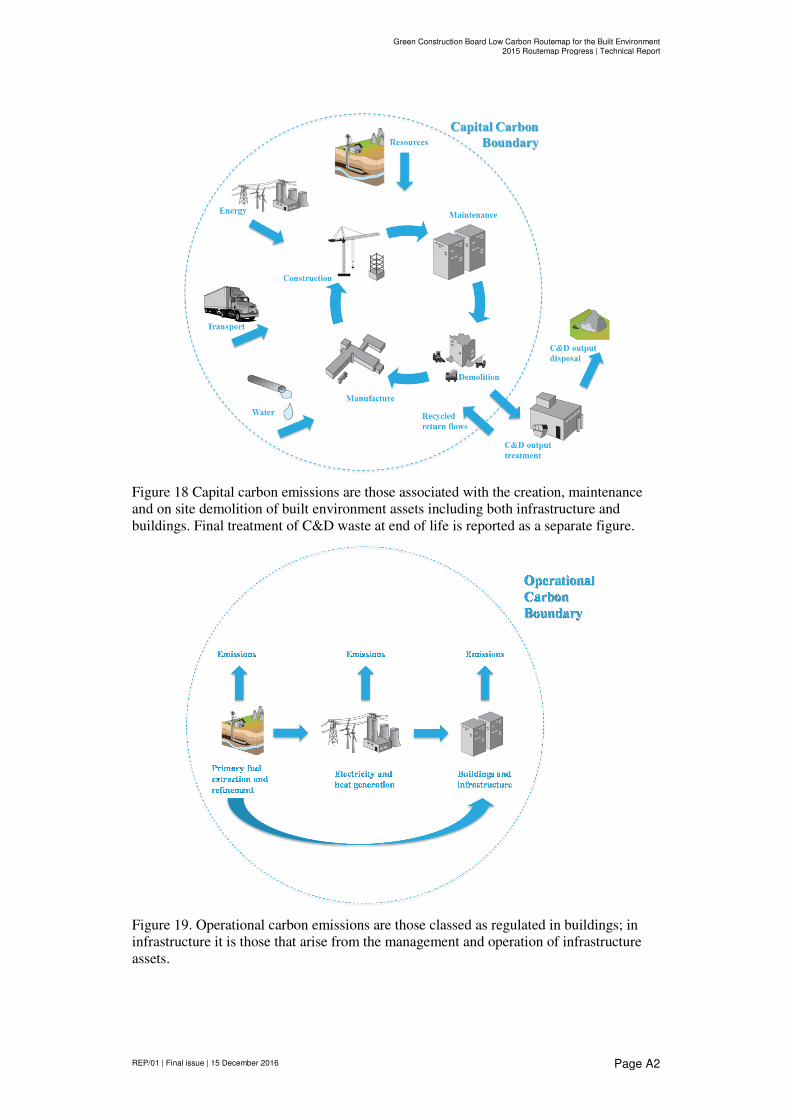
• Capital Carbon | All emissions arising from the extraction of materials,
manufacture of construction products, and construction activities
associated with the construction of UK buildings and infrastructure (see
Figure 18).
• Operational Carbon | All emissions associated with the operation of
domestic and non-domestic buildings, and infrastructure (see Figure 19)6.
o Buildings | On-site consumption of fuels (e.g. gas, oil) and
electricity to deliver “regulated” energy demands7, including
heating, cooling, and lighting.
o Infrastructure | Consumption of fuels and electricity to provide
primary infrastructure services, such as lighting on highways,
treatment and distribution of water and wastewater, etc.
Both Capital and Operational Carbon emissions are given on a consumption basis
as opposed to a by source basis, as is usually the case for national reporting; and
emissions are assigned to the end user of the energy or products being supplied,
instead of the sectors or industries originally emitting them. This means, for
example, that the emissions from generation of electricity for residential lighting
are assigned to the domestic sector instead of the power generation sector.
6 This definition does not include carbon emissions associated with the use of infrastructure. For
completeness Figure 20 provides an illustration of use carbon emissions. 7 Regulated energy is that from demands covered by Buildings Regulations, and in the UK
includes Lighting, Heating, Cooling, and Ventilation. Unregulated energy includes energy for
appliances, plug loads (e.g. phone chargers) and catering.
Green Construction Board Low Carbon Routemap for the Built Environment2015 Routemap Progress | Technical Report
REP/01 | Final issue | 15 December 2016
Page A2
Figure 18 Capital carbon emissions are those associated with the creation, maintenance
and on site demolition of built environment assets including both infrastructure and
buildings. Final treatment of C&D waste at end of life is reported as a separate figure.
Figure 19. Operational carbon emissions are those classed as regulated in buildings; in
infrastructure it is those that arise from the management and operation of infrastructure
assets.

Green Construction Board Low Carbon Routemap for the Built Environment2015 Routemap Progress | Technical Report
REP/01 | Final issue | 15 December 2016
Page A3
Figure 20. Use carbon emissions are those which occur from plug loads and cooking in
buildings together with vehicles in the transport sector and emissions from waste disposal
infrastructure etc.
Green Construction Board Low Carbon Routemap for the Built Environment2015 Routemap Progress | Technical Report
REP/01 | Final issue | 15 December 2016
Page A4
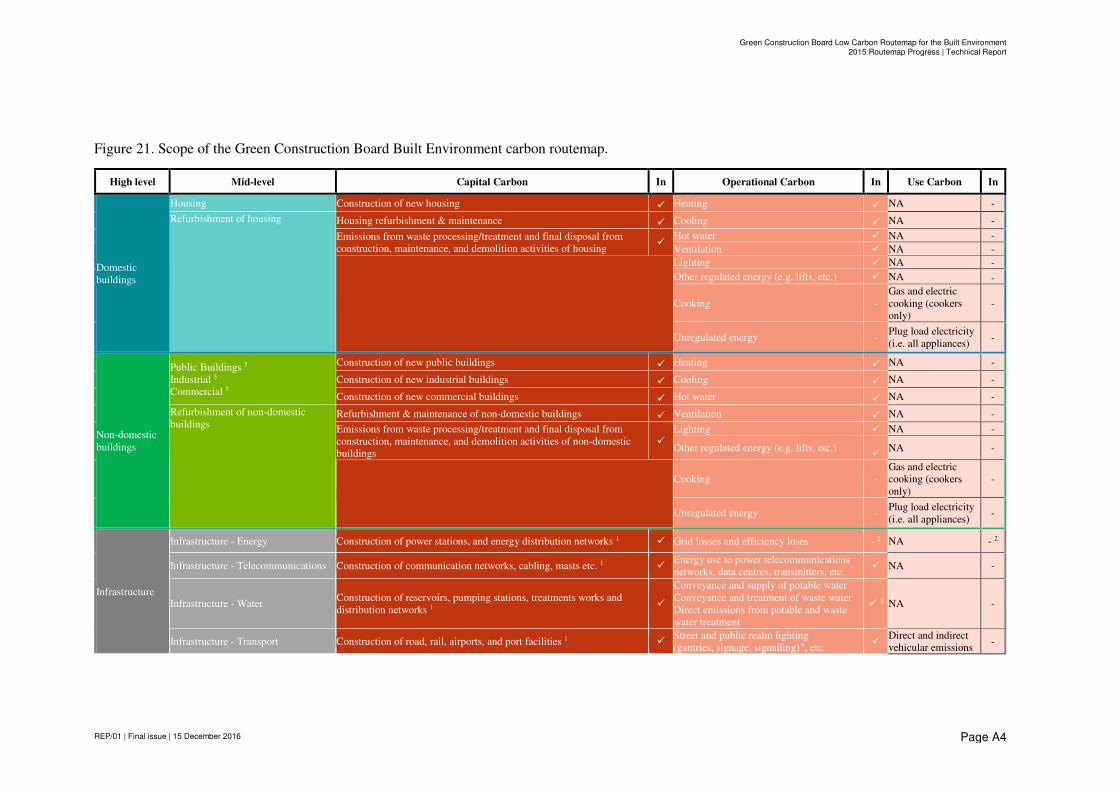
Figure 21. Scope of the Green Construction Board Built Environment carbon routemap.
High level Mid-level Capital Carbon In Operational Carbon In Use Carbon In
Domestic
buildings
Housing Construction of new housing � Heating � NA -
Refurbishment of housing Housing refurbishment & maintenance � Cooling � NA -
Emissions from waste processing/treatment and final disposal from
construction, maintenance, and demolition activities of housing �
Hot water � NA -
Ventilation � NA -
Lighting � NA -
Other regulated energy (e.g. lifts, etc.) � NA -
Cooking -
Gas and electric
cooking (cookers
only)
-
Unregulated energy - Plug load electricity
(i.e. all appliances) -
Non-domestic
buildings
Public Buildings 5
Industrial 5
Commercial 5
Construction of new public buildings � Heating � NA -
Construction of new industrial buildings � Cooling � NA -
Construction of new commercial buildings � Hot water � NA -
Refurbishment of non-domestic
buildings
Refurbishment & maintenance of non-domestic buildings � Ventilation � NA -
Emissions from waste processing/treatment and final disposal from
construction, maintenance, and demolition activities of non-domestic
buildings
�
Lighting � NA -
Other regulated energy (e.g. lifts, etc.) �
NA -
Cooking -
Gas and electric
cooking (cookers
only)
-
Unregulated energy - Plug load electricity
(i.e. all appliances) -
Infrastructure
Infrastructure - Energy Construction of power stations, and energy distribution networks 1 � Grid losses and efficiency loses - 2 NA - 2
Infrastructure - Telecommunications Construction of communication networks, cabling, masts etc. 1 � Energy use to power telecommunications
networks, data centres, transmitters, etc. � NA -
Infrastructure - Water Construction of reservoirs, pumping stations, treatments works and
distribution networks 1 �
Conveyance and supply of potable water
Conveyance and treatment of waste water
Direct emissions from potable and waste
water treatment
� 3 NA -
Infrastructure - Transport Construction of road, rail, airports, and port facilities 1 � Street and public realm lighting
(gantries, signage, signalling) 6, etc. �
Direct and indirect
vehicular emissions -

Green Construction Board Low Carbon Routemap for the Built Environment2015 Routemap Progress | Technical Report
REP/01 | Final issue | 15 December 2016
Page A5
High level Mid-level Capital Carbon In Operational Carbon In Use Carbon In
Infrastructure - Waste Construction of waste processing, treatment, recycling and final disposal
facilities 1 �
Energy used to power waste handling,
processing and treatment equipment.
Transport of waste from point arising to
point of final disposal.
� 4
Direct emissions of
final disposal
technologies
-
Refurbishment Infrastructure
Infrastructure refurbishment & maintenance � NA - NA -
Waste from any construction, maintenance or demolition activities of
infrastructure assets � NA - NA -
Clarifying statements 1
The construction and operation of buildings required to operate infrastructure, including offices and stations, for example, are included in the non-domestic buildings sector.
2
‘Operational' and 'use' emissions from energy supply (including any losses) are assigned to the activities using the electricity such as lighting, plug loads or cooling, for example, in
buildings; or highway lighting in infrastructure.
3
Data is not available to disaggregate water and wastewater into built environment and non-built environment uses. Therefore all emissions from water and waste water use (including water
supply and treatment of industrial and process water) are covered in the ‘Infrastructure water - operational carbon’ category. 4
Data was not available that enabled disaggregation of operational carbon arising from waste infrastructure assets. 5
For presentation purposes in this table public, industrial, and commercial categories are used as summary headings to represent the wider building stock. More specific non-domestic
building category descriptions are used throughout the report. 6 Data was unavailable on energy consumption from traffic signalling and signage. Instead, this is likely to be captured within the non-domestic buildings energy consumption figures,
although it should be noted it is estimated to be a very small component.
Green Construction Board Low Carbon Routemap for the Built Environment2015 Routemap Progress | Technical Report
REP/01 | Final issue | 15 December 2016
Page A6
Operational Carbon versus Use Carbon
The distinction between Operational and Use Carbon can often be misunderstood.
A simple example is the case of highways infrastructure, where the energy
required to light roads, highlight signage, and provide traffic officer services is
regarded as Operational Carbon; this is different, and also much smaller in scale,
than the carbon emissions from the vehicles that use the road network (considered
Use Carbon).8
The other key differentiator between the definitions applied in the built
environment routemap and the boundaries used in other emissions inventories is
the GCB’s focus on the emissions sources over which stakeholders in the
construction industry have control and influence. This leads to the following
notable differences:
• A portion of capital carbon emissions arise outside of the UK in the
production and transportation of construction materials; these non-
territorial carbon emissions are not a standard component of the UK
Greenhouse Gas Emissions Inventory (GHGI), and are therefore not part
of the UK’s statutory target for 2050.
• Operational carbon energy emissions from buildings only include those
energy demands that are “locked in” through the choice of design and
construction standards, and do not cover the (not insignificant) energy
demands associated with occupants’ behavioural characteristics, such as
the use of computing equipment, small power, appliances and catering.
• As for buildings, operational carbon emissions in the infrastructure sector
may appear smaller than they would normally be considered in the GHGI,
as per the highway example above.
8 As emphasised in the Highways England Carbon Routemap
http://www.highways.gov.uk/knowledge/publications/highways-agency-carbon-routemap-opportunities-for-
a-national-low-carbon-transportation-system/

Appendix B
Data Updates

Green Construction Board Low Carbon Routemap for the Built Environment2015 Routemap Progress | Technical Report
REP/01 | Final issue | 15 December 2016
Page B1
B1 Methodology, data sources and references
The original 2013 routemap carbon model and supporting calculation
methodology was used in this study and new statistical data covering the years
2009 to 2013, where available, was incorporated. The same classifications and
breakdowns were used, with previously modelled figures replaced by the actual
data. The following datasets were used:
• DECC Energy Consumption in the UK:
https://www.gov.uk/government/collections/energy-consumption-in-the-
uk
• Digest of UK Energy Statistics:
https://www.gov.uk/government/collections/digest-of-uk-energy-statistics-
dukes
• UK Environmental Accounts:
http://www.ons.gov.uk/ons/rel/environmental/uk-environmental-
accounts/index.html
• University of Leeds CIEMAP9 Carbon Data, based on:
o ONS supply and use tables
o ONS analytical tables
o Trade data from Eora
o ONS GHG emissions data
9 http://ciemap.leeds.ac.uk/

Dr Kristian Steele
t +44 20 7755 6549
Thomas Hurst
t +44 20 7755 4161
Arup
13 Fitzroy Street
London, W1T 4BQ
United Kingdom
Jannik Giesekam
t +44 113 34 35576
University of Leeds
School of Earth and Environment
Leeds, LS2 9JT
United Kingdom