Embed Size (px)
Citation preview
Green Energy Summit2012
Green to Gold
WEDC’s Strategic Investments
In
Wisconsin Sustainability
Sustainability Investments Portfolio
WEDC Investments
WI Sustainability in Manufacturing
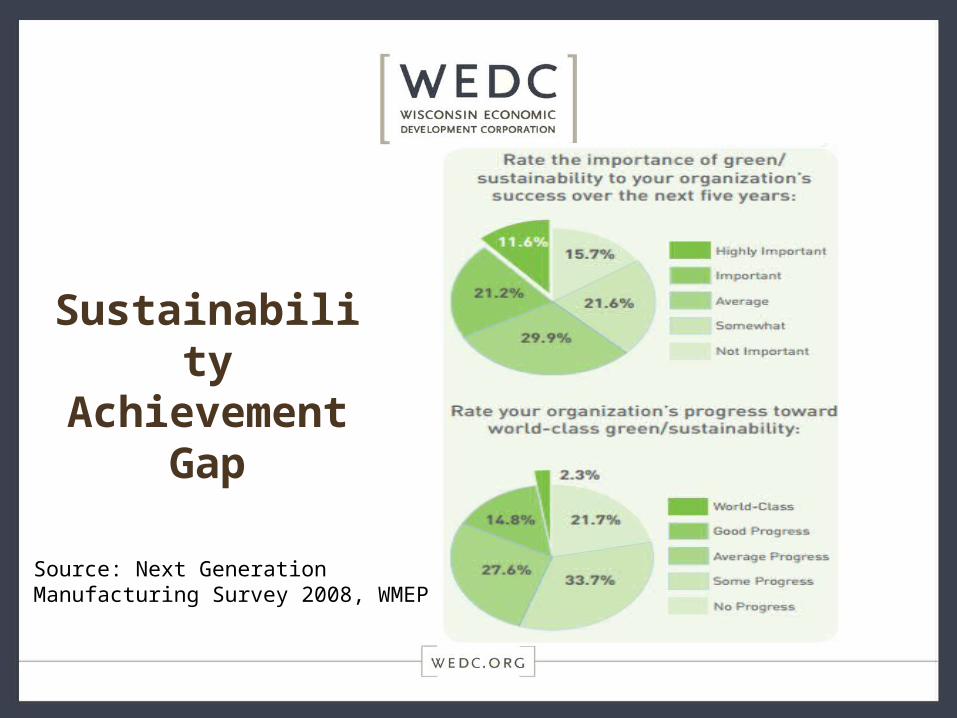
Sustainability Achievement
Gap
Source: Next Generation Manufacturing Survey 2008, WMEP
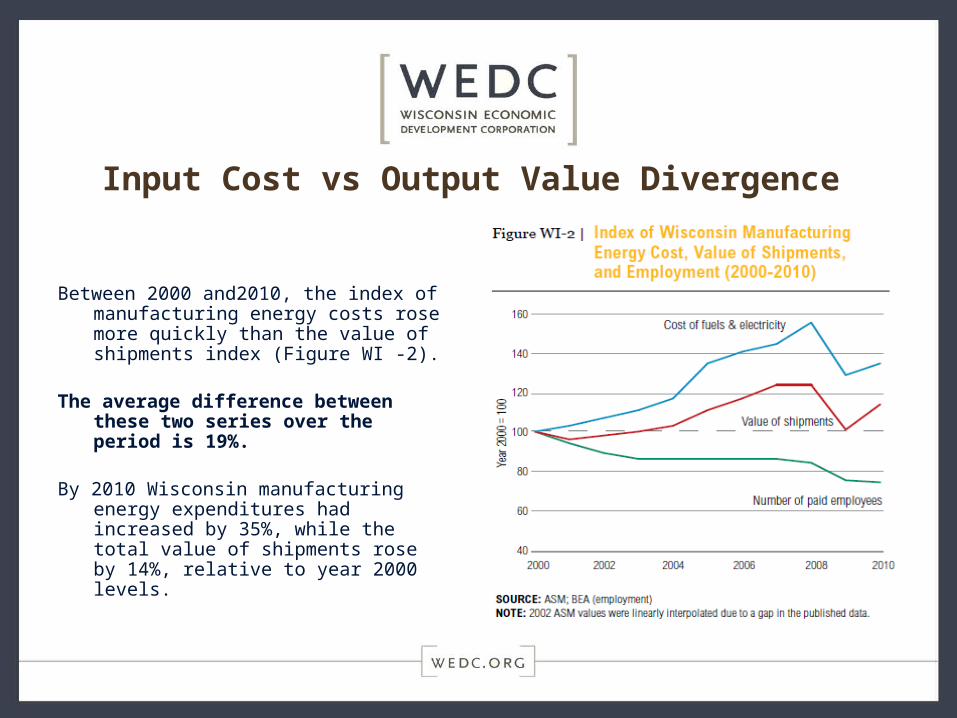
Input Cost vs Output Value Divergence
Between 2000 and2010, the index of manufacturing energy costs rose more quickly than the value of shipments index (Figure WI -2).
The average difference between these two series over the period is 19%.
By 2010 Wisconsin manufacturing energy expenditures had increased by 35%, while the total value of shipments rose by 14%, relative to year 2000 levels.
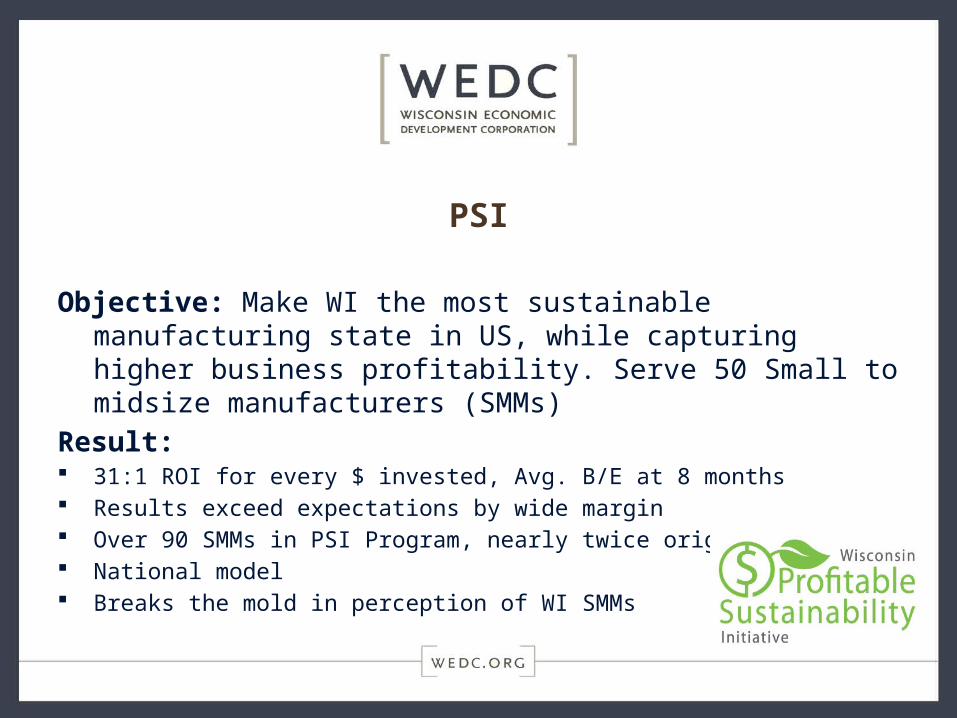
PSI
Objective: Make WI the most sustainable manufacturing state in US, while capturing higher business profitability. Serve 50 Small to midsize manufacturers (SMMs)
Result: 31:1 ROI for every $ invested, Avg. B/E at 8 months Results exceed expectations by wide margin Over 90 SMMs in PSI Program, nearly twice original target National model Breaks the mold in perception of WI SMMs
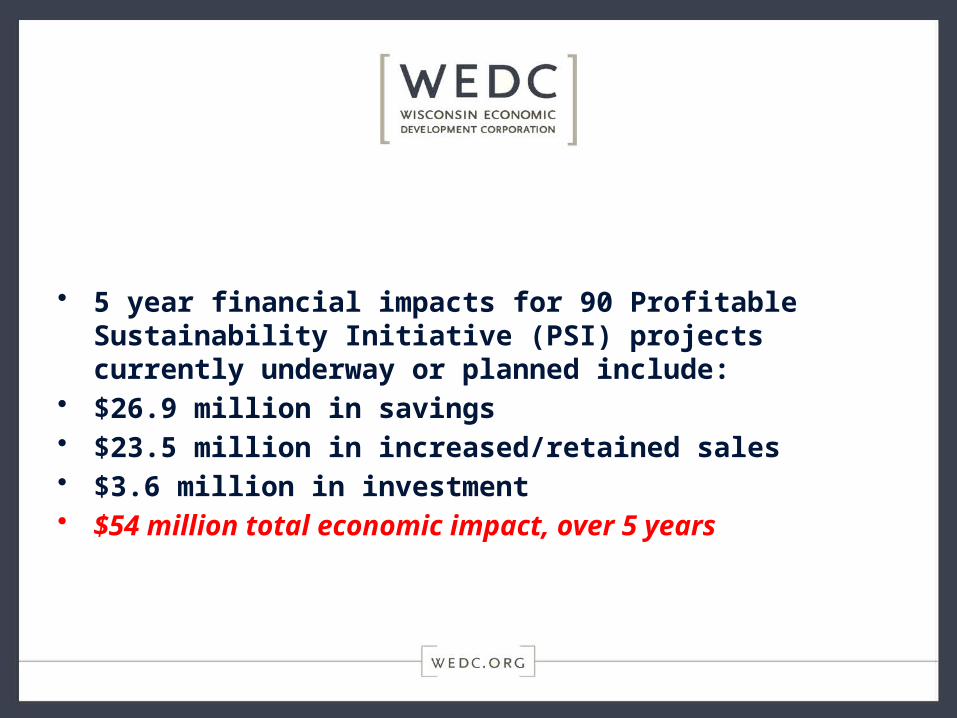
• 5 year financial impacts for 90 Profitable Sustainability Initiative (PSI) projects currently underway or planned include:
• $26.9 million in savings • $23.5 million in increased/retained sales• $3.6 million in investment• $54 million total economic impact, over 5 years
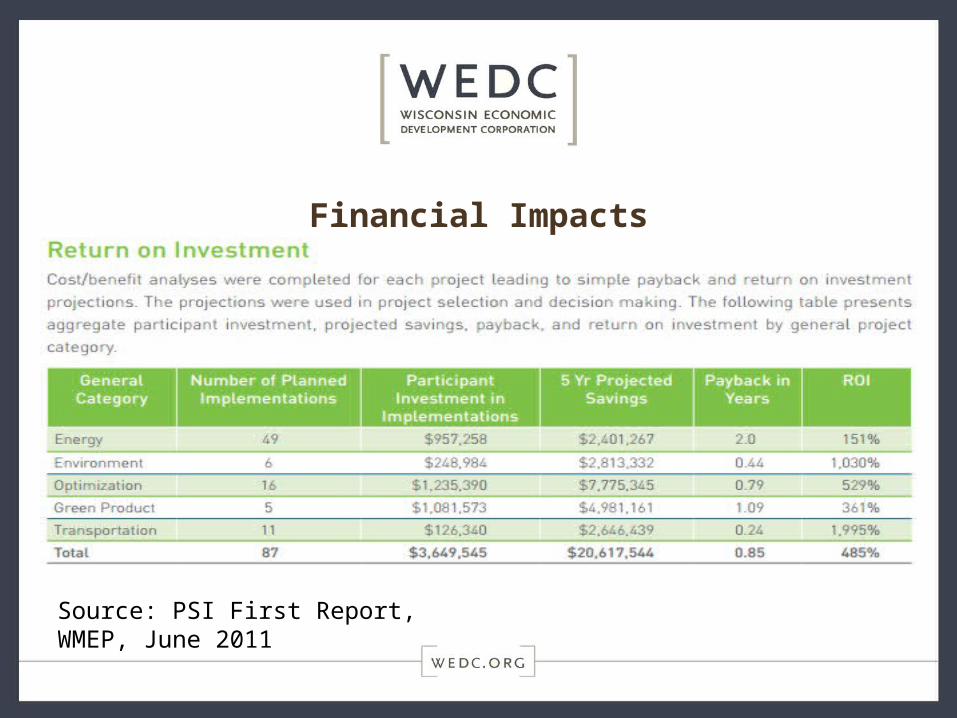
Financial Impacts
Source: PSI First Report, WMEP, June 2011
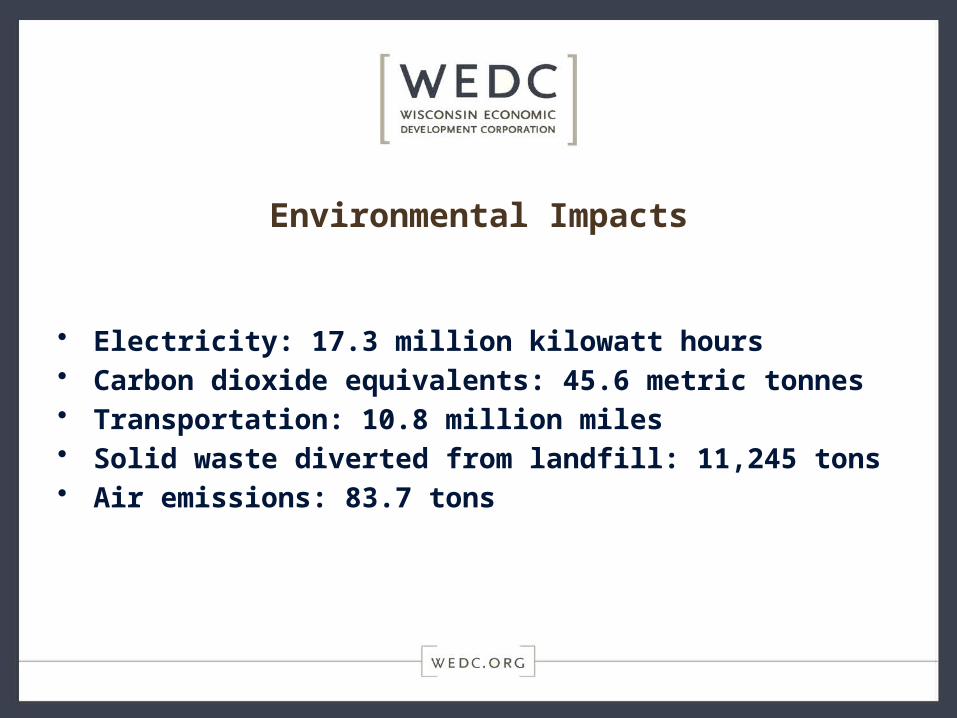
Environmental Impacts
• Electricity: 17.3 million kilowatt hours• Carbon dioxide equivalents: 45.6 metric tonnes• Transportation: 10.8 million miles• Solid waste diverted from landfill: 11,245 tons• Air emissions: 83.7 tons
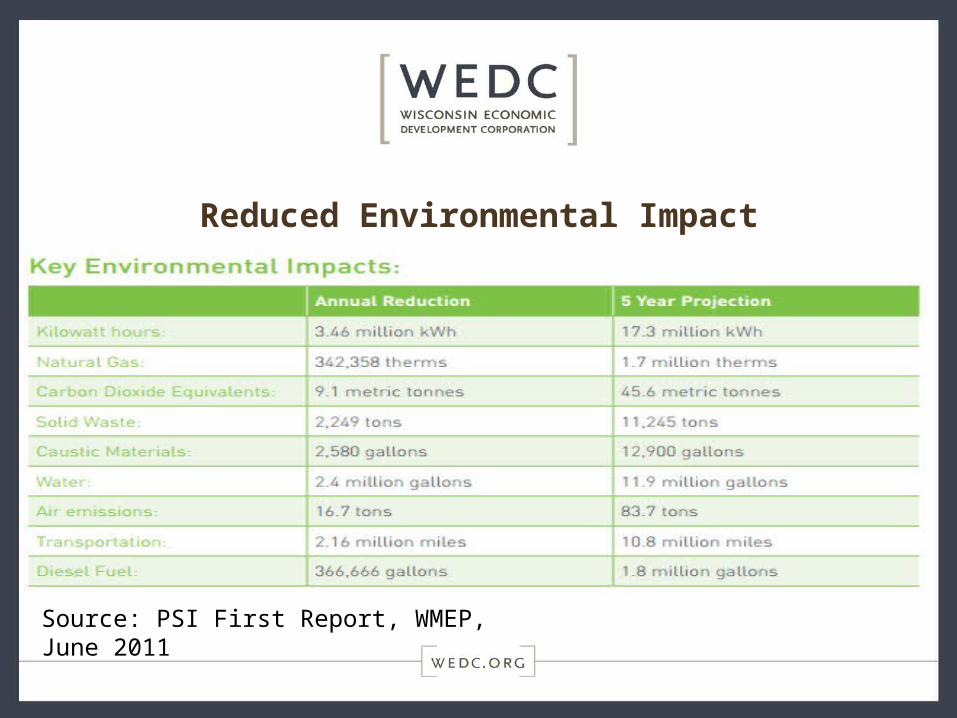
Reduced Environmental Impact
Source: PSI First Report, WMEP, June 2011
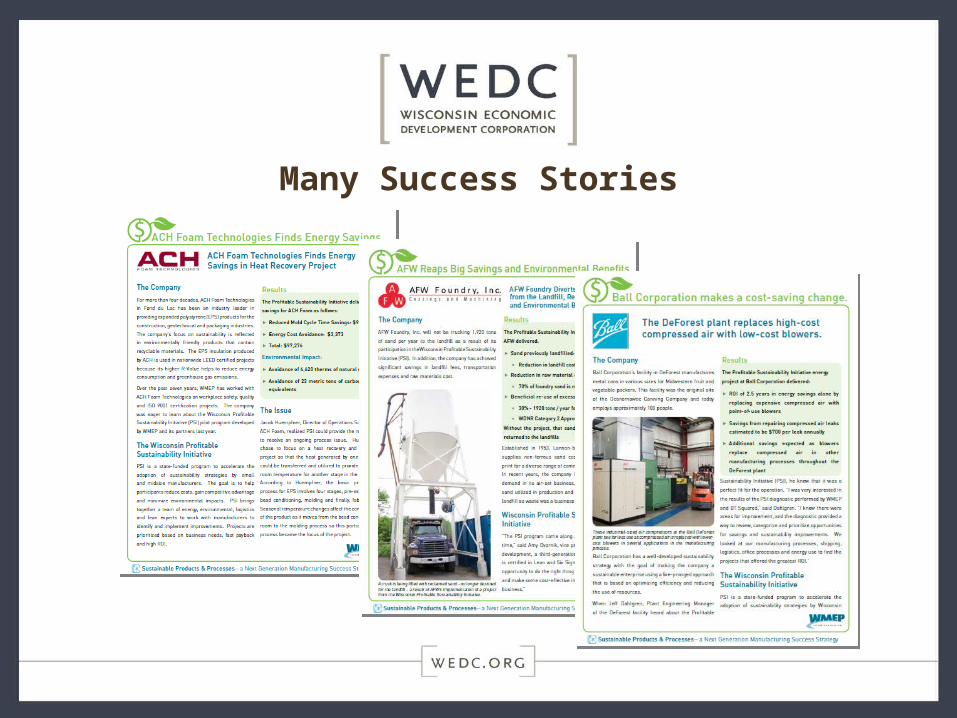
Many Success Stories
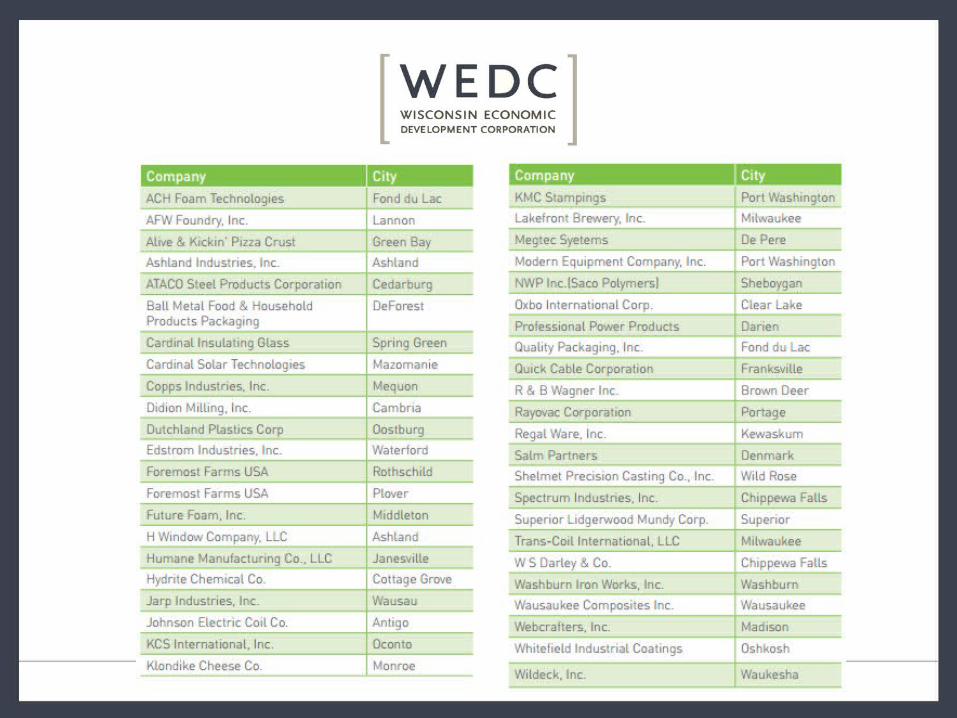
Participating Companies
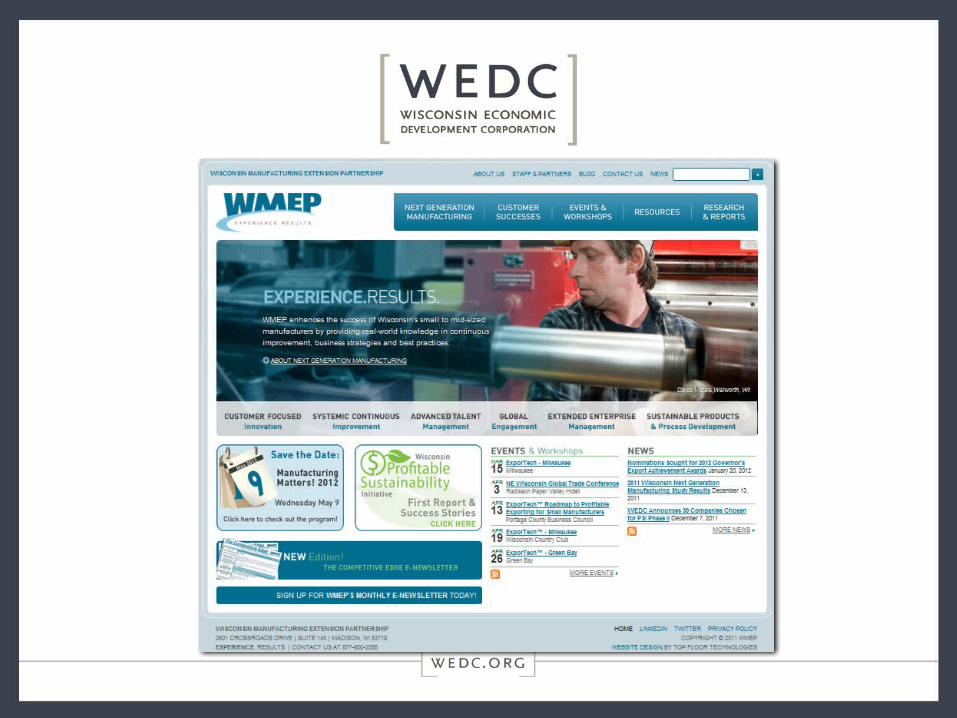
PSI Portal
WEDC Investments
Shrinking Availability
For the first time in history, the global demand for freshwater is overtaking its supply in many parts of the world. The U.N. predicts that by 2025, more than half of
the countries in the world will be experiencing water stress or outright shortages.
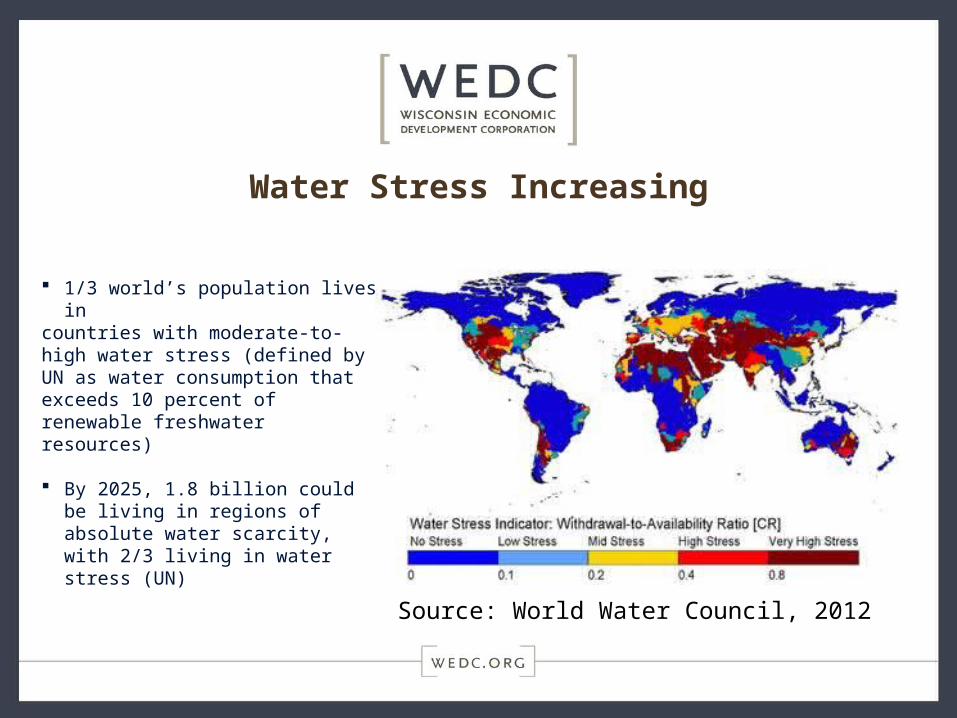
Water Stress Increasing
Source: World Water Council, 2012
1/3 world’s population lives incountries with moderate-to-high water stress (defined by UN as water consumption that exceeds 10 percent of renewable freshwater resources)
By 2025, 1.8 billion could be living in regions of absolute water scarcity, with 2/3 living in water stress (UN)
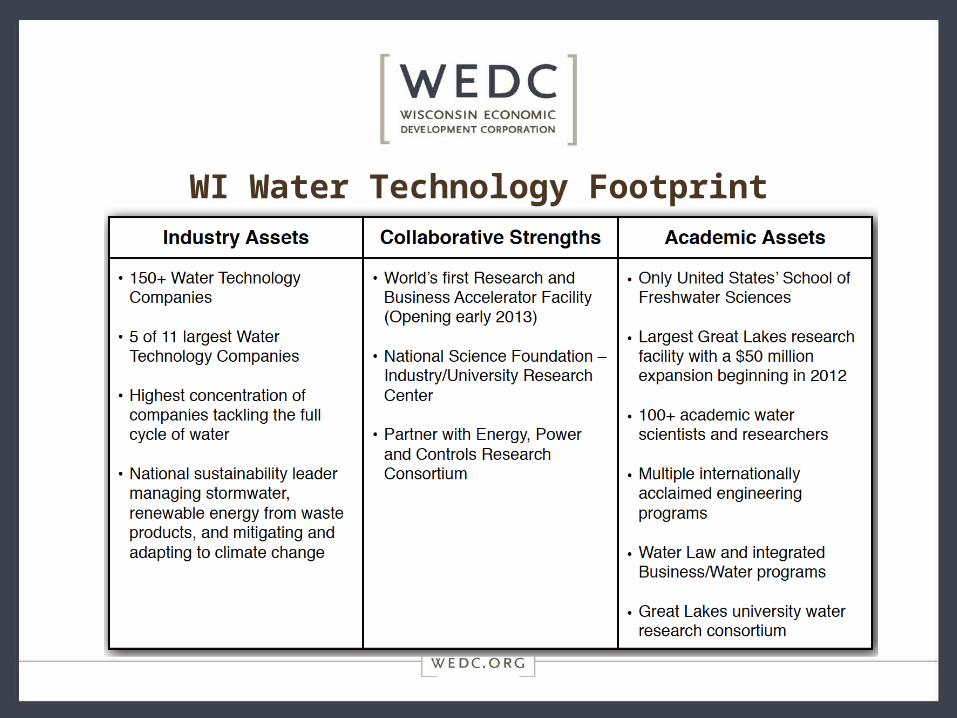
WI Water Technology Footprint
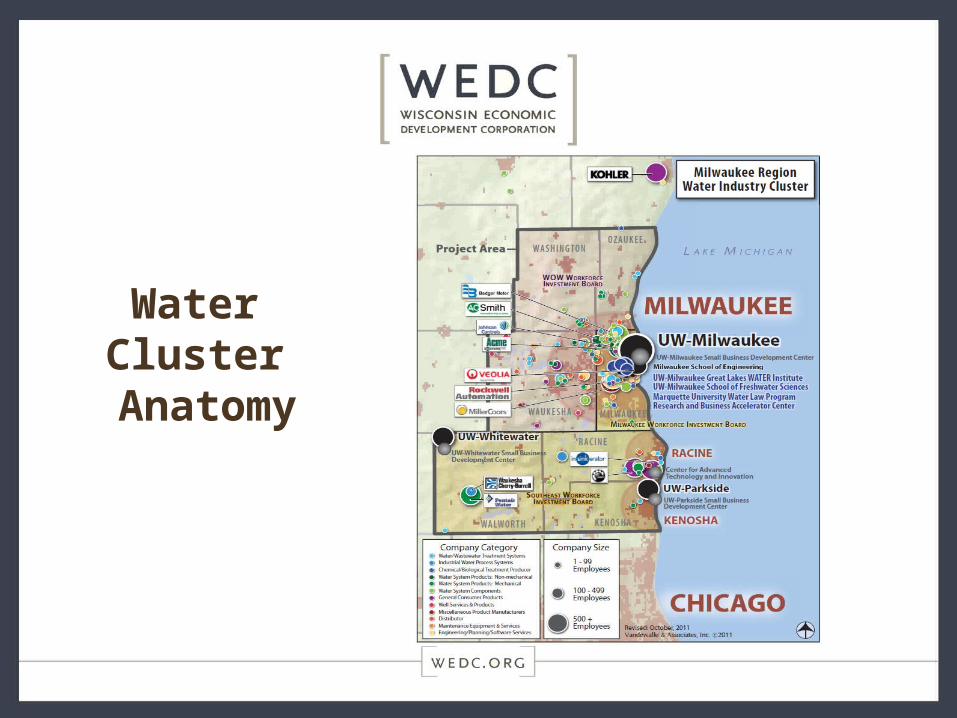
Water Cluster
Anatomy
MWC Accelerator Building
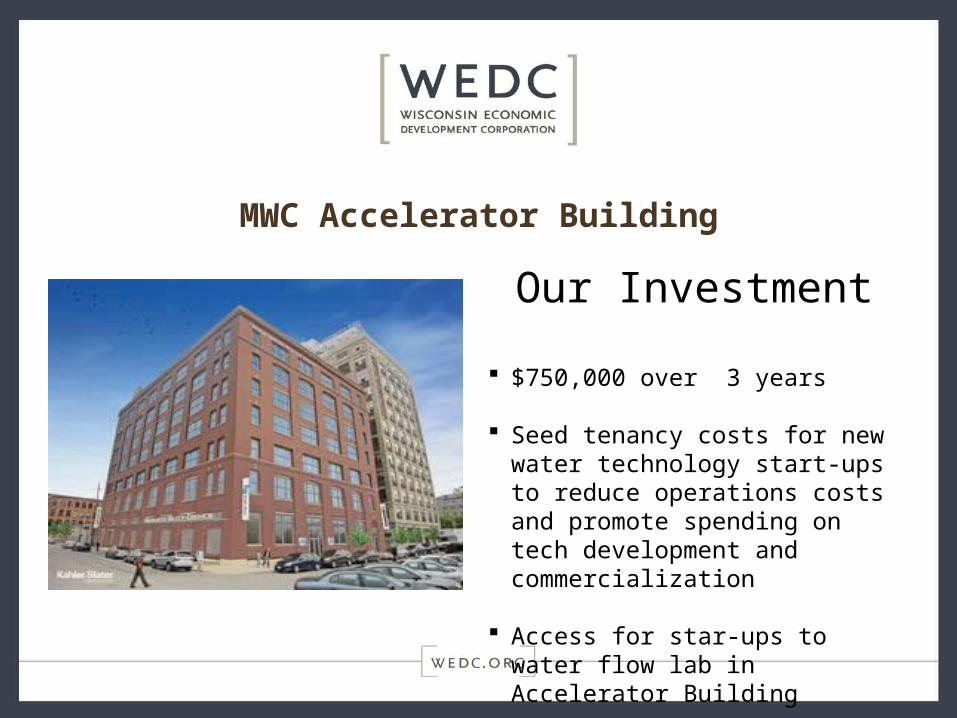
MWC Accelerator Building
Our Investment
$750,000 over 3 years
Seed tenancy costs for new water technology start-ups to reduce operations costs and promote spending on tech development and commercialization
Access for star-ups to water flow lab in Accelerator Building
Thank You
Q&A