Embed Size (px)
Citation preview
code: 2010-11
GREEN GROWTHIN THE CZECH REPUBLICSELECTED INDICATORS
Czech Statistical Offi ce Na padesátém 81 100 82 Praha 10Czech Republic
Orders contact: e-mail: [email protected] phone: +420 274 052 400
ISBN 978-80-250-2141-5
© Czech Statistical Offi ce, 2011www.czso.cz
Published in collaboration with
GREEN GROW TH IN THE CZECH REPUBL IC
3
GREEN GROWTH IN THE CZECH REPUBLIC
SELECTED INDICATORS
Authors Veronika Doležalová
Tomáš Hák Miroslav Havránek Soňa Horáčková
Svatava Janoušková Tereza Košáková
Jan Kovanda Eva Kožoušková Eliška Lorencová Lucie Šimonová David Vačkář
Miloslava Veselá
EditorsMiroslav Havránek
Egor Sidorov
2011Czech Statistical Office
CZECH STAT IST ICAL OFFICE
4
Cover designJiří TomanTomáš KubaštaMichal Novotný
Layout and typesettingTom Vild
Published byCzech Statistical OfficeNa padesátém 81100 82 Prague 10Czech Republic
Contactsphone: (+420) 274 052 400e-mail: [email protected]: www.czso.cz
Printed byTiskárna Brouček
ISBN 978-80-250-2141-5
All views expressed in the publication are those of the authors only and do not necessarily represent the views of the Czech Statistical Office, the staff, or any associates.
© 2011 by the Czech Statistical Office. All rights reserved.
GREEN GROW TH IN THE CZECH REPUBL IC
5
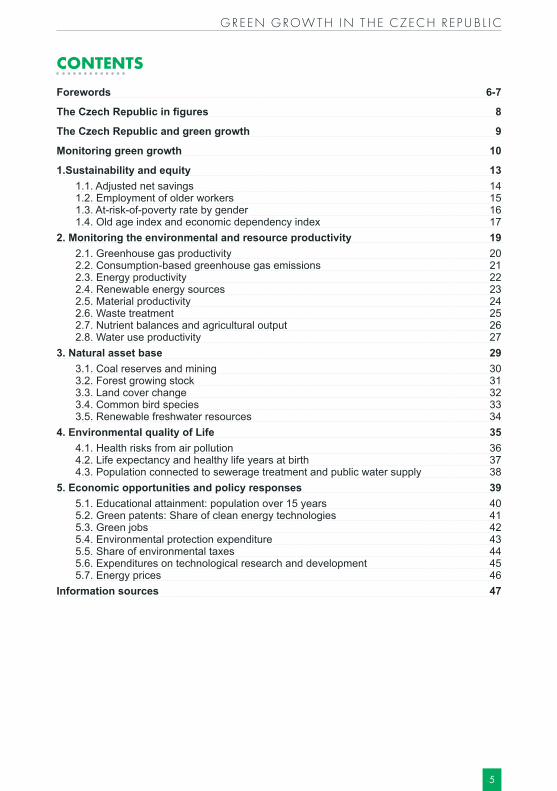
CONTENTS
Forewords 6-7
The Czech Republic in figures 8
The Czech Republic and green growth 9
Monitoring green growth 10
1.Sustainability and equity 131.1. Adjusted net savings 141.2. Employment of older workers 151.3. At-risk-of-poverty rate by gender 161.4. Old age index and economic dependency index 17
2. Monitoring the environmental and resource productivity 192.1. Greenhouse gas productivity 202.2. Consumption-based greenhouse gas emissions 212.3. Energy productivity 222.4. Renewable energy sources 232.5. Material productivity 242.6. Waste treatment 252.7. Nutrient balances and agricultural output 262.8. Water use productivity 27
3. Natural asset base 293.1. Coal reserves and mining 303.2. Forest growing stock 313.3. Land cover change 323.4. Common bird species 333.5. Renewable freshwater resources 34
4. Environmental quality of Life 354.1. Health risks from air pollution 364.2. Life expectancy and healthy life years at birth 374.3. Population connected to sewerage treatment and public water supply 38
5. Economic opportunities and policy responses 395.1. Educational attainment: population over 15 years 405.2. Green patents: Share of clean energy technologies 415.3. Green jobs 425.4. Environmental protection expenditure 435.5. Share of environmental taxes 445.6. Expenditures on technological research and development 455.7. Energy prices 46
Information sources 47
CZECH STAT IST ICAL OFFICE
6
FOREWORDThe main goal of the Czech Statistical Office consists in acquisi-tion of data and consequent production of statistical information on social, economic, demographic, and environmental develop-ment of the state. Based on acquired data the Czech Statistical Office yields a reliable and consistent image about the state and development of the society according to various user needs.
The stress laid during the last two decades on the environ-mental protection as part of the so-called green growth strategy was primarily stimulated by discussions and policies both at in-ternational and national levels. These activities lead to an inten-sive demand for high quality sustainability-related statistics from the variety of stakeholders. The interest is primarily motivated by the need to assess the environmental state as well as to define and describe multiple social-demographic-environmental-eco-
nomic interrelations that are highly influencing economic activity, employment, foreign trade, price level, etc.
The Czech Statistical Office has been making active steps to meet these rapidly changing institutional requirements. The publication “Green Growth in the Czech Republic” aims at de-scribing this complex problem area from number of perspectives.
The primary target audience of the book comprises of non-professionals interested in sus-tainability issues. In this respect one can find short definitions and green growth relevance explanations in the text. The whole publication is broken down into five interrelated sections each presenting one complex dimension of an issue. These include sustainability and equity, environmental and resource productivity, natural asset base, environmental quality of life, and policy responses and economic opportunities. Each chapter of the book introduces the relevant indicator time series accompanied with the description of the Czech peculiarities and interna-tional comparisons. We also believe that due to its user friendliness the book would be of inte-rest to professional public as well.
The publication provides a bird’s-eye view of the issue of green growth in the Czech Re-public based on the total of 27 indicators. Indicators were picked with regards both to national conditions and data availability. The majority of data referenced in the text is either directly pro-duced by the Czech Statistical Office, or provided as an input for a more aggregated statistics to Eurostat. It is clear that not all domains of this complex problem field are covered by statistical surveys. However one should also mention that a significant part of data could be mined from other administrative sources. In this respect we would also like to express acknowledgements to all the other partner workplaces that kindly provided the additional data. We would also like to thank experts from the Charles University Environment Center that greatly contributed to preparation of this publication.
Iva Ritschelová, President, Czech Statistical Office

GREEN GROW TH IN THE CZECH REPUBL IC
7
FOREWORDThe multiple economic and social crises in the contemporary world are already clearly visible and pose an urgent and press-ing challenge. However, the current environmental crisis, though outwardly less visible and seemingly less urgent, is in the long term equally serious. In a recent report from the UNEP (Keep-ing Track of our Changing Environment: From Rio to Rio+20) it is stated that “the indicator report gets us all back to basics, underlining the rapid buildup of greenhouse gases to the ero-sion of biodiversity and the 40% increase in the use of natural resources – faster than the global population growth”. On the whole, there is a clear need for a new paradigm for a sustainable socio-economic development.
Resolution 64/236 of the United Nations General Assembly (December 24, 2009) represents a strong response to this chal-lenge, calling for a UN Conference on Sustainable Development (Rio+20) and determining that one of the two themes of the Conference should be The Green Economy in the Context of Sustainable Development and Poverty Eradication. In the same vein, the May 2011 Ministe-rial Council Meeting of the OECD adopted the landmark strategic document “Towards Green Growth”.The desired model for economic development must ensure economic growth that will not undermine the natural resource base and the ecosystem services upon which the human economy and their well-being rest.
In its submission to the Rio+20 Summit, the European Union strongly supports the prepa-ration of this developmental model, and of the Conference itself, and hopes for outstanding results. The European Union fully commits itself to the idea of a green economy and suggests some basic elements of the Roadmap that, if adopted by the Summit, may lead the way towards a transition to green growth. It is not by chance that the very first point of the proposed Roadmap reads: “To further develop and strengthen indicators complementing a gross domestic product that integrates economic, social and environmental dimensions in a balanced manner. Such an approach should include the selection of headline indicators reflecting several aspects of sustainable development”.
The Charles University Environment Centre has been contributing to the development of indicators through many projects since its very first initiative began in 1994, resulting in the book “Sustainability Indicators” (SCOPE 58, B. Moldan and S. Billharz, Eds., 1997). We believe that reliable and quantifiable information is indeed an essential prerequisite for any progress towards a green economy. This is the idea behind this modest publication.
Bedřich Moldan, Director, Charles University Environment Centre
CZECH STAT IST ICAL OFFICE
8
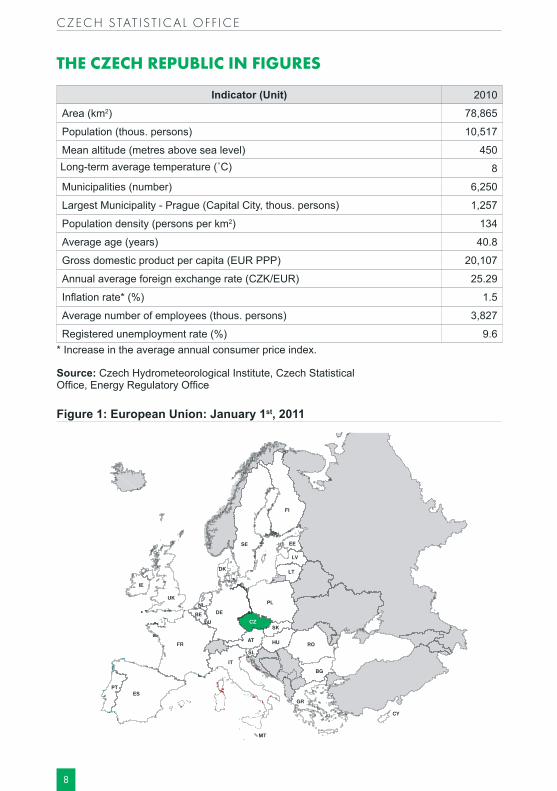
THE CZECH REPUBLIC IN FIGURES
Indicator (Unit) 2010
Area (km2) 78,865
Population (thous. persons) 10,517
Mean altitude (metres above sea level) 450Long-term average temperature (˚C) 8
Municipalities (number) 6,250
Largest Municipality - Prague (Capital City, thous. persons) 1,257
Population density (persons per km2) 134
Average age (years) 40.8
Gross domestic product per capita (EUR PPP) 20,107
Annual average foreign exchange rate (CZK/EUR) 25.29
Inflation rate* (%) 1.5
Average number of employees (thous. persons) 3,827
Registered unemployment rate (%) 9.6* Increase in the average annual consumer price index.
Source: Czech Hydrometeorological Institute, Czech Statistical Office, Energy Regulatory Office
Figure 1: European Union: January 1st, 2011
GREEN GROW TH IN THE CZECH REPUBL IC
9
THE CZECH REPUBLIC AND GREEN GROWTHAccording to the OECD, green growth means fostering economic growth and development, while ensuring that natural assets continue to provide their sources and environmental services on which our well-being relies. Thus green growth has the potential to address economic and environmental challenges while simultaneously paying specific attention to many of the social issues and equity concerns that can arise as a direct result of greening the economy. The ne-cessity to consider economic, environmental, and social aspects leads directly to sustainable development that provides an important context for green growth.
The OECD Green Growth Strategy leverages off a substantial body of analysis and policy effort that flowed from the 1992 Rio Earth Summit. Green growth has not been conceived as a replacement for sustainable development, but rather should be considered as a subset of it. In practical terms, green growth is an engine for the green economy (more commonly called sustainable economy in the Czech Republic).
The Czech economy has been developing and growing over the past two decades. Na-tional policies recognize however that economic growth has also had harmful side effects. The impacts of a fossil fuel-based economy and the subsequent exploitation of natural resources, which enable economic growth, may be critical limits to the growth in future.
Recognizing these new challenges, the Czech Republic adopted the Strategy for Sustain-able Development in 2004. The Strategy defines the principal (strategic) goals, as well as partial goals and instruments, formulated so as to eliminate imbalances in relations between the eco-nomic, environmental and social pillars of sustainability. They are designed to achieve the best attainable quality of life for the present generation and create conditions for a high quality of life for future generations.
The recently updated Strategy (called Strategic Framework for Sustainable Development in the Czech Republic) defines five priorities:
• Society, people and health;• The economy and innovation;• Regional development;• Landscape, ecosystems and biodiversity;• A stable and secure society.
The Strategy does not explicitly contain the green growth concept although that and sustain-able development interrelate. A sustainable economy is based on an increase in income, em-ployment, public health and a secure society, which is driven by investments and innovations reducing carbon emissions and pollution, whereby enhancing resource efficiency, and preserv-ing biodiversity and ecosystem services. Thus, this conception is fully in compliance with the conclusions of the Ministerial Council Meeting of the OECD which committed itself to a green growth strategy in 2009, as well as to other concepts (e.g. UNEP’s Green Economy).
CZECH STAT IST ICAL OFFICE
10
MONITORING GREEN GROWTHThere is neither one common prescription for implementing strategies for green growth, nor for its monitoring. To trace the development of the Czech economy towards green growth, we have adopted the OECD indicator framework. In order to capture not only the economic and environ-mental link, but also the social dimension, this report structures the selected indicators into five interrelated groups of indicators:
• Sustainability and equity;• Environmental and resource productivity;• Natural asset base;• Environmental quality of life;• Policy responses and economic opportunities.
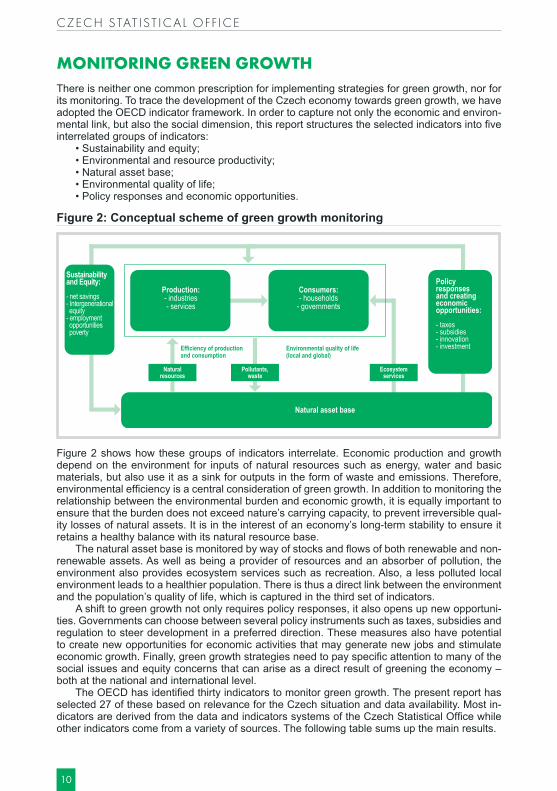
Figure 2: Conceptual scheme of green growth monitoring
Figure 2 shows how these groups of indicators interrelate. Economic production and growth depend on the environment for inputs of natural resources such as energy, water and basic materials, but also use it as a sink for outputs in the form of waste and emissions. Therefore, environmental efficiency is a central consideration of green growth. In addition to monitoring the relationship between the environmental burden and economic growth, it is equally important to ensure that the burden does not exceed nature’s carrying capacity, to prevent irreversible qual-ity losses of natural assets. It is in the interest of an economy’s long-term stability to ensure it retains a healthy balance with its natural resource base.
The natural asset base is monitored by way of stocks and flows of both renewable and non-renewable assets. As well as being a provider of resources and an absorber of pollution, the environment also provides ecosystem services such as recreation. Also, a less polluted local environment leads to a healthier population. There is thus a direct link between the environment and the population’s quality of life, which is captured in the third set of indicators.
A shift to green growth not only requires policy responses, it also opens up new opportuni-ties. Governments can choose between several policy instruments such as taxes, subsidies and regulation to steer development in a preferred direction. These measures also have potential to create new opportunities for economic activities that may generate new jobs and stimulate economic growth. Finally, green growth strategies need to pay specific attention to many of the social issues and equity concerns that can arise as a direct result of greening the economy – both at the national and international level.
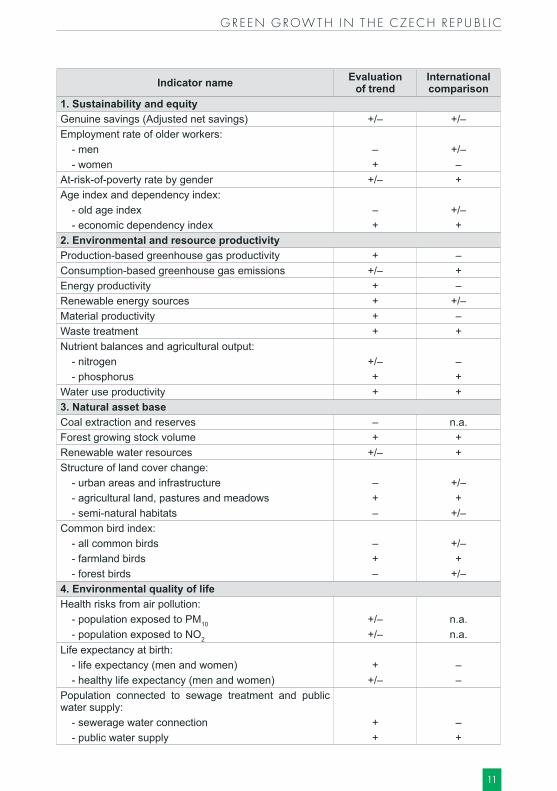
The OECD has identified thirty indicators to monitor green growth. The present report has selected 27 of these based on relevance for the Czech situation and data availability. Most in-dicators are derived from the data and indicators systems of the Czech Statistical Office while other indicators come from a variety of sources. The following table sums up the main results.
Sustainability and Equity:- net savings- Intergenerational equity- employment opportunities poverty
Production:- industries- services
Consumers:- households
- governments
Naturalresources
Pollutants,waste
Natural asset base
Policy responses and creating economic opportunities:- taxes- subsidies- innovation- investment
Ecosystemservices
Efficiency of production and consumption
Environmental quality of life(local and global)
GREEN GROW TH IN THE CZECH REPUBL IC
11
Indicator name Evaluation of trend
International comparison
1. Sustainability and equityGenuine savings (Adjusted net savings) +/– +/–Employment rate of older workers:
- men – +/– - women + –
At-risk-of-poverty rate by gender +/– +Age index and dependency index:
- old age index – +/– - economic dependency index + +
2. Environmental and resource productivityProduction-based greenhouse gas productivity + –Consumption-based greenhouse gas emissions +/– +Energy productivity + –Renewable energy sources + +/–Material productivity + –Waste treatment + +Nutrient balances and agricultural output:
- nitrogen +/– – - phosphorus + +
Water use productivity + +3. Natural asset baseCoal extraction and reserves – n.a.Forest growing stock volume + +Renewable water resources +/– +Structure of land cover change:
- urban areas and infrastructure – +/– - agricultural land, pastures and meadows + + - semi-natural habitats – +/–
Common bird index: - all common birds – +/– - farmland birds + + - forest birds – +/–
4. Environmental quality of lifeHealth risks from air pollution:
- population exposed to PM10 +/– n.a. - population exposed to NO2 +/– n.a.
Life expectancy at birth: - life expectancy (men and women) + – - healthy life expectancy (men and women) +/– –
Population connected to sewage treatment and public water supply:
- sewerage water connection + – - public water supply + +
CZECH STAT IST ICAL OFFICE
12
Indicator name Evaluation of trend
International comparison
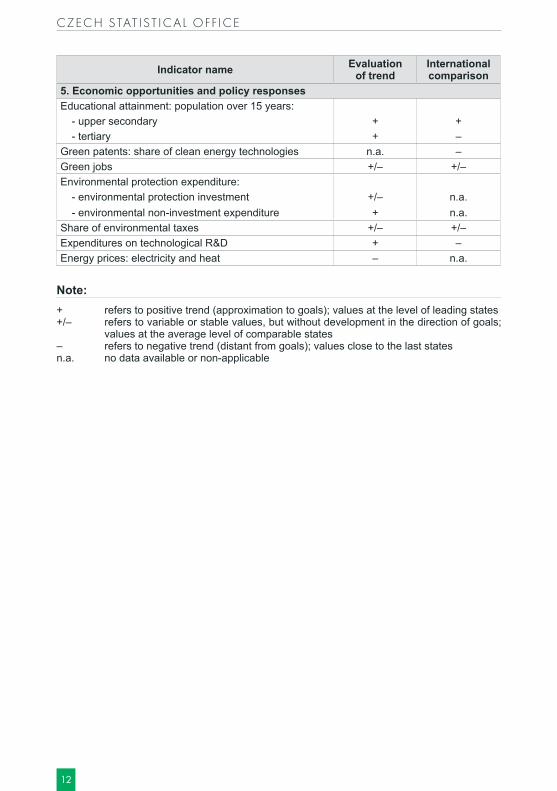
5. Economic opportunities and policy responsesEducational attainment: population over 15 years:
- upper secondary + + - tertiary + –
Green patents: share of clean energy technologies n.a. –Green jobs +/– +/–Environmental protection expenditure:
- environmental protection investment +/– n.a. - environmental non-investment expenditure + n.a.
Share of environmental taxes +/– +/–Expenditures on technological R&D + –Energy prices: electricity and heat – n.a.
Note:+ refers to positive trend (approximation to goals); values at the level of leading states+/– refers to variable or stable values, but without development in the direction of goals; values at the average level of comparable states– refers to negative trend (distant from goals); values close to the last statesn.a. no data available or non-applicable
GREEN GROW TH IN THE CZECH REPUBL IC
13
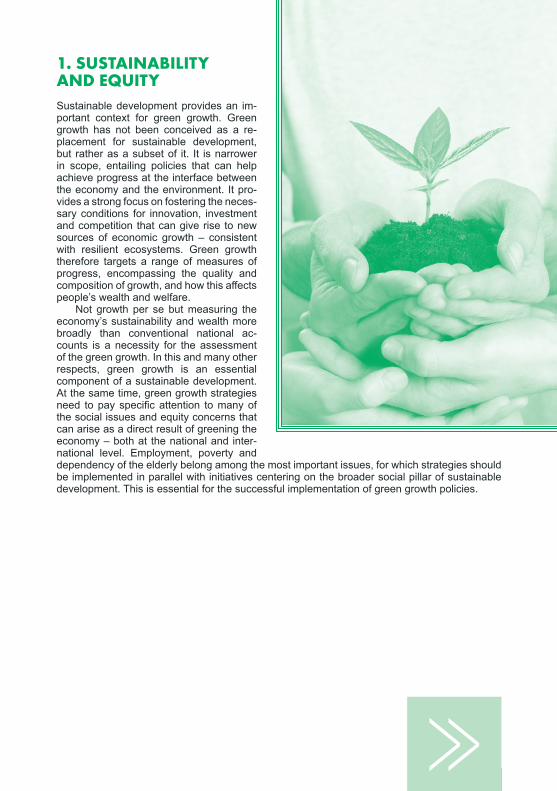
1. SUSTAINABILITY AND EQUITYSustainable development provides an im-portant context for green growth. Green growth has not been conceived as a re-placement for sustainable development, but rather as a subset of it. It is narrower in scope, entailing policies that can help achieve progress at the interface between the economy and the environment. It pro-vides a strong focus on fostering the neces-sary conditions for innovation, investment and competition that can give rise to new sources of economic growth – consistent with resilient ecosystems. Green growth therefore targets a range of measures of progress, encompassing the quality and composition of growth, and how this affects people’s wealth and welfare.
Not growth per se but measuring the economy’s sustainability and wealth more broadly than conventional national ac-counts is a necessity for the assessment of the green growth. In this and many other respects, green growth is an essential component of a sustainable development. At the same time, green growth strategies need to pay specific attention to many of the social issues and equity concerns that can arise as a direct result of greening the economy – both at the national and inter-national level. Employment, poverty and dependency of the elderly belong among the most important issues, for which strategies should be implemented in parallel with initiatives centering on the broader social pillar of sustainable development. This is essential for the successful implementation of green growth policies.
>>
CZECH STAT IST ICAL OFFICE
14
1.1. ADJUSTED NET SAVINGSThis indicator is calculated as a share of the adjusted national savings in the gross national income. Adjusted net savings are based on the adjustment of gross national savings for de-preciation of the produced capital (-), the current expenditure on education (+), rent from the depletion of natural capital (-) and damages from the environmental burden including carbon dioxide emissions (-).
The adjusted net savings seeks to provide a message to the decision makers and policy-makers as to how sustainable their investment activities are. While the standard measurement of “savings” and “investment” reflect a relative change in the value of certain limited set of as-sets, the adjusted net savings broadens the picture by adding environmental damage and by adding the creation of human capital. This indicator is based on a “weak sustainability principle”, which assumes that natural capital can be perfectly substituted by any type of capital as an input to production.
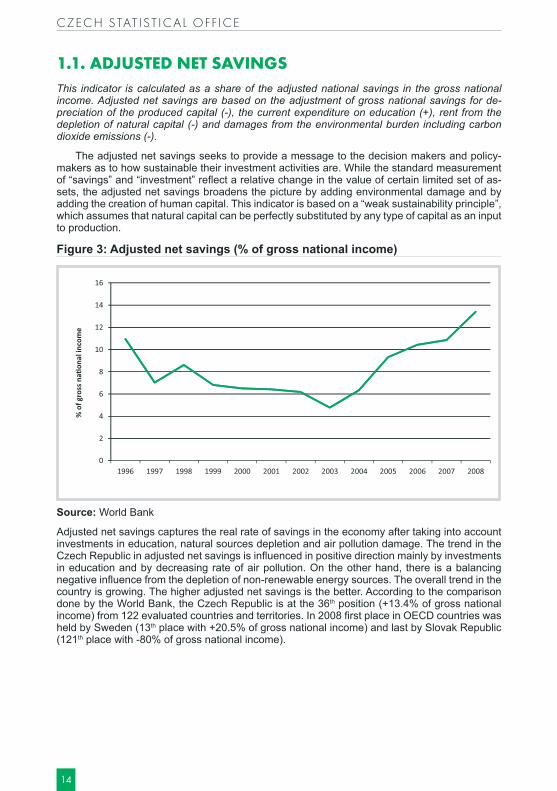
Figure 3: Adjusted net savings (% of gross national income)
Source: World Bank
Adjusted net savings captures the real rate of savings in the economy after taking into account investments in education, natural sources depletion and air pollution damage. The trend in the Czech Republic in adjusted net savings is influenced in positive direction mainly by investments in education and by decreasing rate of air pollution. On the other hand, there is a balancing negative influence from the depletion of non-renewable energy sources. The overall trend in the country is growing. The higher adjusted net savings is the better. According to the comparison done by the World Bank, the Czech Republic is at the 36th position (+13.4% of gross national income) from 122 evaluated countries and territories. In 2008 first place in OECD countries was held by Sweden (13th place with +20.5% of gross national income) and last by Slovak Republic (121th place with -80% of gross national income).
GREEN GROW TH IN THE CZECH REPUBL IC
15
1.2. EMPLOYMENT OF OLDER WORKERSThe employment rate of older workers is calculated by dividing the number of persons aged 55 to 64 employed by the total population of the same age group. An indicator is presented for men and women separately.
The employment rate of older workers monitors generational justice and equity in the so-ciety of a particular country. Older workers are often less flexible but they have more expe-rience in the given field and provide steady work output. The green growth concept should be implemented in a way that does not disrupt the social, religious and generational principles of sustainable development.
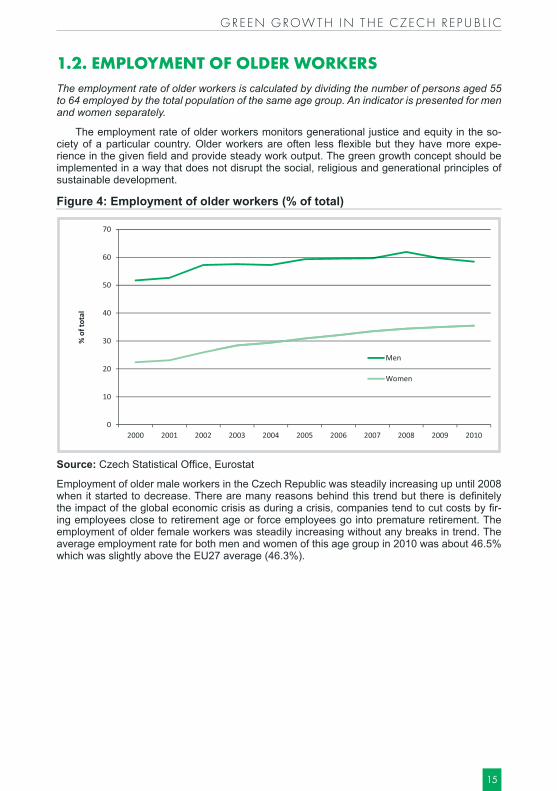
Figure 4: Employment of older workers (% of total)
Source: Czech Statistical Office, Eurostat
Employment of older male workers in the Czech Republic was steadily increasing up until 2008 when it started to decrease. There are many reasons behind this trend but there is definitely the impact of the global economic crisis as during a crisis, companies tend to cut costs by fir-ing employees close to retirement age or force employees go into premature retirement. The employment of older female workers was steadily increasing without any breaks in trend. The average employment rate for both men and women of this age group in 2010 was about 46.5% which was slightly above the EU27 average (46.3%).
CZECH STAT IST ICAL OFFICE
16
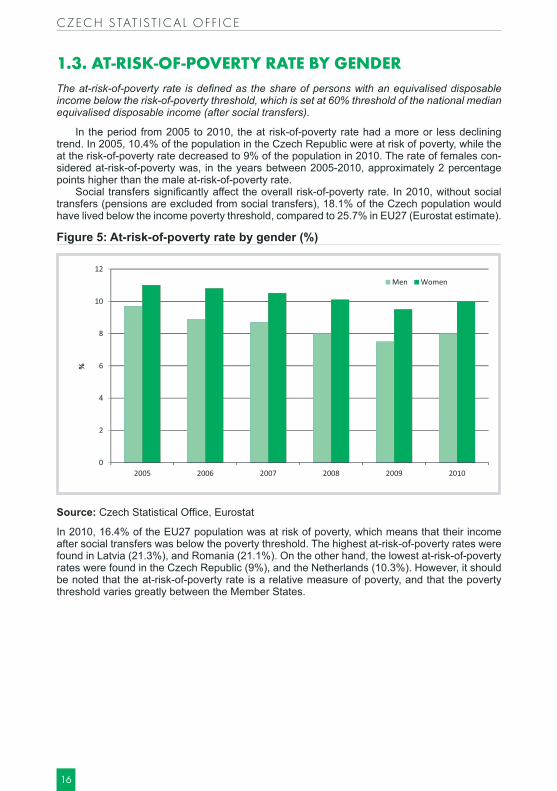
1.3. AT-RISK-OF-POVERTY RATE BY GENDERThe at-risk-of-poverty rate is defined as the share of persons with an equivalised disposable income below the risk-of-poverty threshold, which is set at 60% threshold of the national median equivalised disposable income (after social transfers).
In the period from 2005 to 2010, the at risk-of-poverty rate had a more or less declining trend. In 2005, 10.4% of the population in the Czech Republic were at risk of poverty, while the at the risk-of-poverty rate decreased to 9% of the population in 2010. The rate of females con-sidered at-risk-of-poverty was, in the years between 2005-2010, approximately 2 percentage points higher than the male at-risk-of-poverty rate.
Social transfers significantly affect the overall risk-of-poverty rate. In 2010, without social transfers (pensions are excluded from social transfers), 18.1% of the Czech population would have lived below the income poverty threshold, compared to 25.7% in EU27 (Eurostat estimate).
Figure 5: At-risk-of-poverty rate by gender (%)
Source: Czech Statistical Office, Eurostat
In 2010, 16.4% of the EU27 population was at risk of poverty, which means that their income after social transfers was below the poverty threshold. The highest at-risk-of-poverty rates were found in Latvia (21.3%), and Romania (21.1%). On the other hand, the lowest at-risk-of-poverty rates were found in the Czech Republic (9%), and the Netherlands (10.3%). However, it should be noted that the at-risk-of-poverty rate is a relative measure of poverty, and that the poverty threshold varies greatly between the Member States.
GREEN GROW TH IN THE CZECH REPUBL IC
17
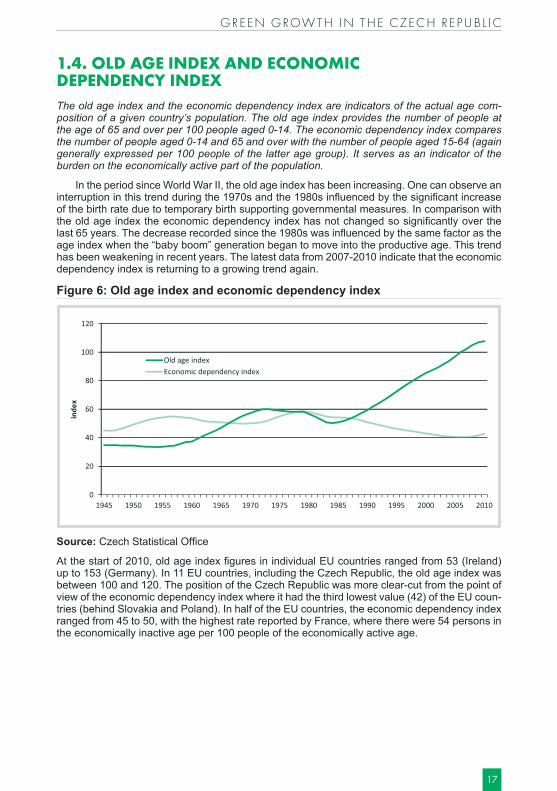
1.4. OLD AGE INDEX AND ECONOMIC DEPENDENCY INDEXThe old age index and the economic dependency index are indicators of the actual age com-position of a given country’s population. The old age index provides the number of people at the age of 65 and over per 100 people aged 0-14. The economic dependency index compares the number of people aged 0-14 and 65 and over with the number of people aged 15-64 (again generally expressed per 100 people of the latter age group). It serves as an indicator of the burden on the economically active part of the population.
In the period since World War II, the old age index has been increasing. One can observe an interruption in this trend during the 1970s and the 1980s influenced by the significant increase of the birth rate due to temporary birth supporting governmental measures. In comparison with the old age index the economic dependency index has not changed so significantly over the last 65 years. The decrease recorded since the 1980s was influenced by the same factor as the age index when the “baby boom” generation began to move into the productive age. This trend has been weakening in recent years. The latest data from 2007-2010 indicate that the economic dependency index is returning to a growing trend again.
Figure 6: Old age index and economic dependency index
Source: Czech Statistical Office
At the start of 2010, old age index figures in individual EU countries ranged from 53 (Ireland) up to 153 (Germany). In 11 EU countries, including the Czech Republic, the old age index was between 100 and 120. The position of the Czech Republic was more clear-cut from the point of view of the economic dependency index where it had the third lowest value (42) of the EU coun-tries (behind Slovakia and Poland). In half of the EU countries, the economic dependency index ranged from 45 to 50, with the highest rate reported by France, where there were 54 persons in the economically inactive age per 100 people of the economically active age.

CZECH STAT IST ICAL OFFICE
18
GREEN GROW TH IN THE CZECH REPUBL IC
19
2. MONITORING THE ENVIRONMENTAL AND RESOURCE PRODUCTIVITYA central element of green growth is the environmental and resource efficiency of production and consumption improving over time and space, and across sectors. Understanding this evolution and the factors driving these changes is an essential ingre-dient in developing green growth policies.
Progress can be monitored by relat-ing the use of environmental services in production to the output generated and by tracking the decoupling of trends in the production and environmental services. The ultimate goal here is to achieve an absolute decoupling, i.e. the state when the economic output is growing, but the pressures and impacts from the use of environmental services show an absolute decrease.
Decoupling at the national level can be partly explained by displacement ef-fects – such as the substitution of goods or services produced domestically, and requiring high levels of environmental ser-vices, with imports – that do not neces-sarily imply decoupling at the global level. Such shortcomings in production-based measures can be addressed by focusing on consumption-based measures, such as consumption-based greenhouse gas emissions.
The main issues of importance to green growth include carbon, energy and resource pro-ductivity, which further comprises material, water and nutrient resources.
>>
CZECH STAT IST ICAL OFFICE
20
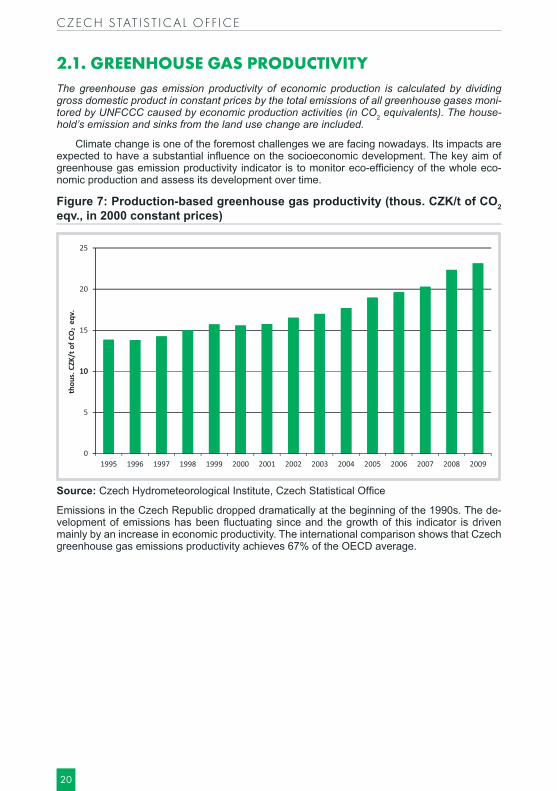
2.1. GREENHOUSE GAS PRODUCTIVITYThe greenhouse gas emission productivity of economic production is calculated by dividing gross domestic product in constant prices by the total emissions of all greenhouse gases moni-tored by UNFCCC caused by economic production activities (in CO2 equivalents). The house-hold’s emission and sinks from the land use change are included.
Climate change is one of the foremost challenges we are facing nowadays. Its impacts are expected to have a substantial influence on the socioeconomic development. The key aim of greenhouse gas emission productivity indicator is to monitor eco-efficiency of the whole eco-nomic production and assess its development over time.
Figure 7: Production-based greenhouse gas productivity (thous. CZK/t of CO2 eqv., in 2000 constant prices)
Source: Czech Hydrometeorological Institute, Czech Statistical Office
Emissions in the Czech Republic dropped dramatically at the beginning of the 1990s. The de-velopment of emissions has been fluctuating since and the growth of this indicator is driven mainly by an increase in economic productivity. The international comparison shows that Czech greenhouse gas emissions productivity achieves 67% of the OECD average.
GREEN GROW TH IN THE CZECH REPUBL IC
21
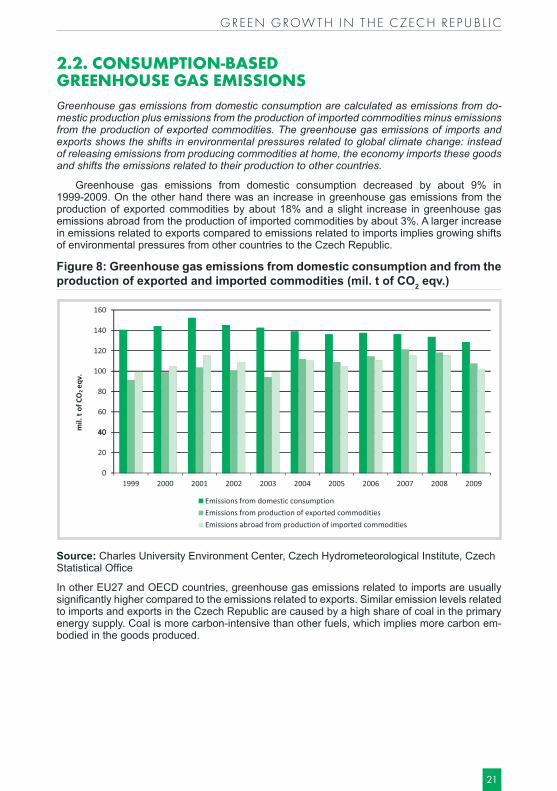
2.2. CONSUMPTION-BASED GREENHOUSE GAS EMISSIONSGreenhouse gas emissions from domestic consumption are calculated as emissions from do-mestic production plus emissions from the production of imported commodities minus emissions from the production of exported commodities. The greenhouse gas emissions of imports and exports shows the shifts in environmental pressures related to global climate change: instead of releasing emissions from producing commodities at home, the economy imports these goods and shifts the emissions related to their production to other countries.
Greenhouse gas emissions from domestic consumption decreased by about 9% in 1999-2009. On the other hand there was an increase in greenhouse gas emissions from the production of exported commodities by about 18% and a slight increase in greenhouse gas emissions abroad from the production of imported commodities by about 3%. A larger increase in emissions related to exports compared to emissions related to imports implies growing shifts of environmental pressures from other countries to the Czech Republic.
Figure 8: Greenhouse gas emissions from domestic consumption and from the production of exported and imported commodities (mil. t of CO2 eqv.)
Source: Charles University Environment Center, Czech Hydrometeorological Institute, Czech Statistical Office
In other EU27 and OECD countries, greenhouse gas emissions related to imports are usually significantly higher compared to the emissions related to exports. Similar emission levels related to imports and exports in the Czech Republic are caused by a high share of coal in the primary energy supply. Coal is more carbon-intensive than other fuels, which implies more carbon em-bodied in the goods produced.
CZECH STAT IST ICAL OFFICE
22
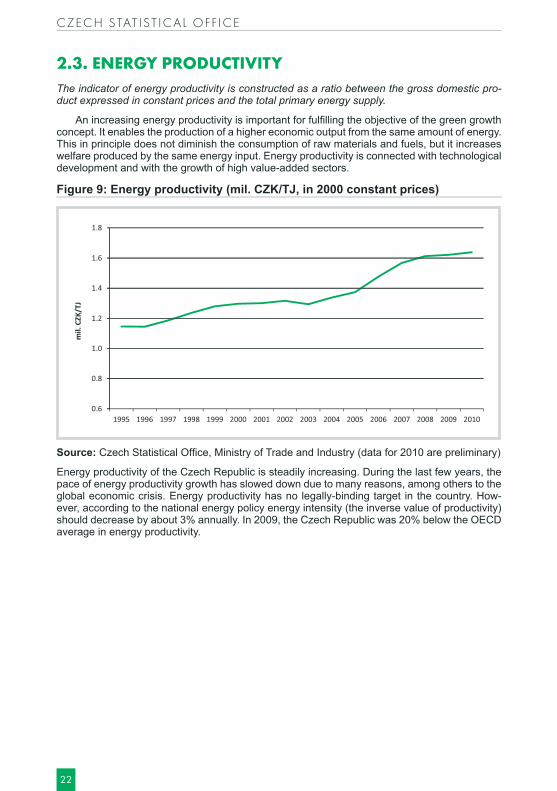
2.3. ENERGY PRODUCTIVITYThe indicator of energy productivity is constructed as a ratio between the gross domestic pro-duct expressed in constant prices and the total primary energy supply.
An increasing energy productivity is important for fulfilling the objective of the green growth concept. It enables the production of a higher economic output from the same amount of energy. This in principle does not diminish the consumption of raw materials and fuels, but it increases welfare produced by the same energy input. Energy productivity is connected with technological development and with the growth of high value-added sectors.
Figure 9: Energy productivity (mil. CZK/TJ, in 2000 constant prices)
Source: Czech Statistical Office, Ministry of Trade and Industry (data for 2010 are preliminary)
Energy productivity of the Czech Republic is steadily increasing. During the last few years, the pace of energy productivity growth has slowed down due to many reasons, among others to the global economic crisis. Energy productivity has no legally-binding target in the country. How-ever, according to the national energy policy energy intensity (the inverse value of productivity) should decrease by about 3% annually. In 2009, the Czech Republic was 20% below the OECD average in energy productivity.
GREEN GROW TH IN THE CZECH REPUBL IC
23
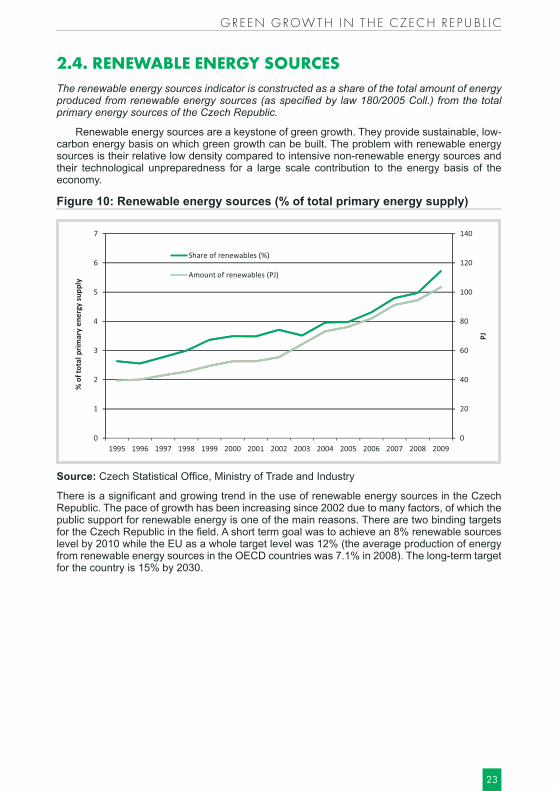
2.4. RENEWABLE ENERGY SOURCESThe renewable energy sources indicator is constructed as a share of the total amount of energy produced from renewable energy sources (as specified by law 180/2005 Coll.) from the total primary energy sources of the Czech Republic.
Renewable energy sources are a keystone of green growth. They provide sustainable, low-carbon energy basis on which green growth can be built. The problem with renewable energy sources is their relative low density compared to intensive non-renewable energy sources and their technological unpreparedness for a large scale contribution to the energy basis of the economy.
Figure 10: Renewable energy sources (% of total primary energy supply)
Source: Czech Statistical Office, Ministry of Trade and Industry
There is a significant and growing trend in the use of renewable energy sources in the Czech Republic. The pace of growth has been increasing since 2002 due to many factors, of which the public support for renewable energy is one of the main reasons. There are two binding targets for the Czech Republic in the field. A short term goal was to achieve an 8% renewable sources level by 2010 while the EU as a whole target level was 12% (the average production of energy from renewable energy sources in the OECD countries was 7.1% in 2008). The long-term target for the country is 15% by 2030.

CZECH STAT IST ICAL OFFICE
24
2.5. MATERIAL PRODUCTIVITYDomestic material consumption is the sum of the physical amount of extracted materials (ener-gy carriers, ores and non-metallic minerals) and produced biomass (agricultural crops, timber logging, etc.), which were obtained on the territory of a given country including, all imports and excluding all exports. Material productivity itself is calculated as gross domestic product (in constant prices) divided by domestic material consumption.
The material productivity of the Czech economy increased by about 70% in 1995-2010. This increase was mostly driven by an increase in the gross domestic product (by 53%) while domestic material consumption remained fairly stable. This development may reflect the more efficient use of materials by the Czech economy. In spite of the increase in material productivity, the Czech economy did not experience any more profound absolute decoupling between material use and economic performance – the domestic material consumption ended at only moderately lower levels in 2010 compared to 1995.
Figure 11: Material productivity, domestic material consumption and gross do-mestic product (index, 1995=100)
Source: Czech Statistical Office
The material productivity of the Czech economy is more than 30% lower as compared with the EU27 and OECD averages. This is given by the fact that the domestic material consumption per capita is close to the EU27 and OECD averages, while the gross domestic product per capita is about 30% lower. This disproportion between material use and economic performance can be attributed to a relatively high share of industry, as industries are more material-intensive than services, as well as the high share of solid fuels in the primary energy supply, as one can get less energy per weight unit of solid fuels compared to liquid and gas fuels.
Gross domestic product
GREEN GROW TH IN THE CZECH REPUBL IC
25
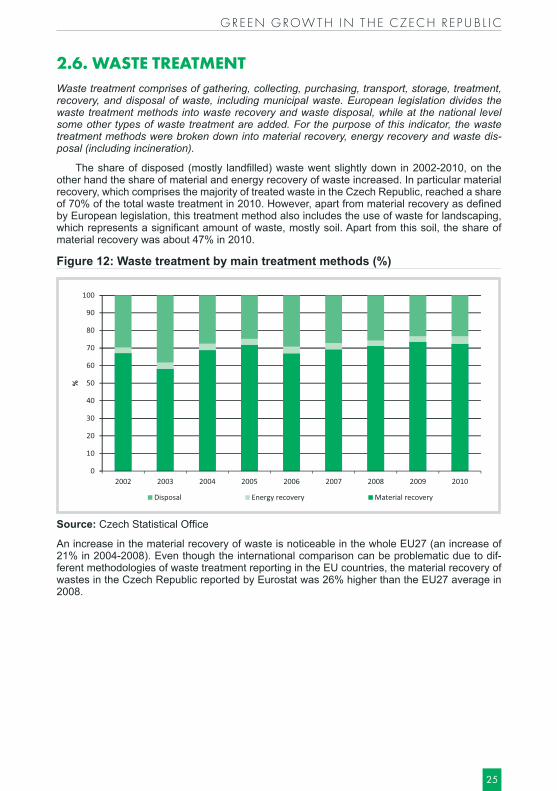
2.6. WASTE TREATMENTWaste treatment comprises of gathering, collecting, purchasing, transport, storage, treatment, recovery, and disposal of waste, including municipal waste. European legislation divides the waste treatment methods into waste recovery and waste disposal, while at the national level some other types of waste treatment are added. For the purpose of this indicator, the waste treatment methods were broken down into material recovery, energy recovery and waste dis-posal (including incineration).
The share of disposed (mostly landfilled) waste went slightly down in 2002-2010, on the other hand the share of material and energy recovery of waste increased. In particular material recovery, which comprises the majority of treated waste in the Czech Republic, reached a share of 70% of the total waste treatment in 2010. However, apart from material recovery as defined by European legislation, this treatment method also includes the use of waste for landscaping, which represents a significant amount of waste, mostly soil. Apart from this soil, the share of material recovery was about 47% in 2010.
Figure 12: Waste treatment by main treatment methods (%)
Source: Czech Statistical Office
An increase in the material recovery of waste is noticeable in the whole EU27 (an increase of 21% in 2004-2008). Even though the international comparison can be problematic due to dif-ferent methodologies of waste treatment reporting in the EU countries, the material recovery of wastes in the Czech Republic reported by Eurostat was 26% higher than the EU27 average in 2008.
CZECH STAT IST ICAL OFFICE
26
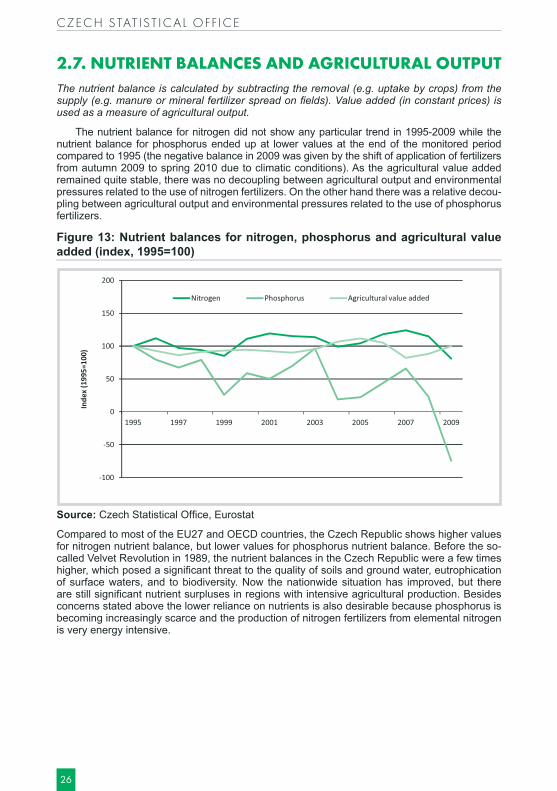
2.7. NUTRIENT BALANCES AND AGRICULTURAL OUTPUTThe nutrient balance is calculated by subtracting the removal (e.g. uptake by crops) from the supply (e.g. manure or mineral fertilizer spread on fields). Value added (in constant prices) is used as a measure of agricultural output.
The nutrient balance for nitrogen did not show any particular trend in 1995-2009 while the nutrient balance for phosphorus ended up at lower values at the end of the monitored period compared to 1995 (the negative balance in 2009 was given by the shift of application of fertilizers from autumn 2009 to spring 2010 due to climatic conditions). As the agricultural value added remained quite stable, there was no decoupling between agricultural output and environmental pressures related to the use of nitrogen fertilizers. On the other hand there was a relative decou-pling between agricultural output and environmental pressures related to the use of phosphorus fertilizers.
Figure 13: Nutrient balances for nitrogen, phosphorus and agricultural value added (index, 1995=100)
Source: Czech Statistical Office, Eurostat
Compared to most of the EU27 and OECD countries, the Czech Republic shows higher values for nitrogen nutrient balance, but lower values for phosphorus nutrient balance. Before the so-called Velvet Revolution in 1989, the nutrient balances in the Czech Republic were a few times higher, which posed a significant threat to the quality of soils and ground water, eutrophication of surface waters, and to biodiversity. Now the nationwide situation has improved, but there are still significant nutrient surpluses in regions with intensive agricultural production. Besides concerns stated above the lower reliance on nutrients is also desirable because phosphorus is becoming increasingly scarce and the production of nitrogen fertilizers from elemental nitrogen is very energy intensive.

GREEN GROW TH IN THE CZECH REPUBL IC
27
2.8. WATER USE PRODUCTIVITYTotal water abstraction includes the abstraction of both surface and underground water. Only abstractions higher than 6,000m3 per year or 500m3 per month are recorded. Water use produc-tivity is calculated as the gross domestic product (in constant prices) divided by the total water abstraction.
Water use productivity of the Czech economy increased by about 97% in 1995-2010. This increase was caused by both an increase in the gross domestic product and decrease in the total water abstraction. This reflects the more efficient use of water by the Czech economy and also an absolute decoupling: the growth in economic performance and an absolute decrease in environmental pressures related to water abstraction.
Figure 14: Water use productivity, total water abstraction and gross domestic product (index, 1995=100)
Source: Czech Statistical Office, Ministry of Agriculture, T. G. Masaryk Water Research Insti-tute
Water abstraction in the Czech Republic is dominated by surface water, which composes about 80% of total water abstraction. In 2010, the power industry had the largest share in total abstrac-tion (48.3%), followed by the water supply for public use (34%) and industry (14.5%). These three sectors also stood behind the decrease in water abstraction in 1995-2001, while the in-crease in 2001-2003 was only caused by the power industry. Very low abstractions, on the other hand, were attributed to agriculture in 2010 (about 2%). Compared to other EU27 and OECD countries, the Czech Republic shows below-average per capita water abstraction. Higher water abstraction is characteristic for countries, which extensively abstract water for agricultural pur-poses such as Greece, Spain or Bulgaria.
Gross domestic product

CZECH STAT IST ICAL OFFICE
28
GREEN GROW TH IN THE CZECH REPUBL IC
29
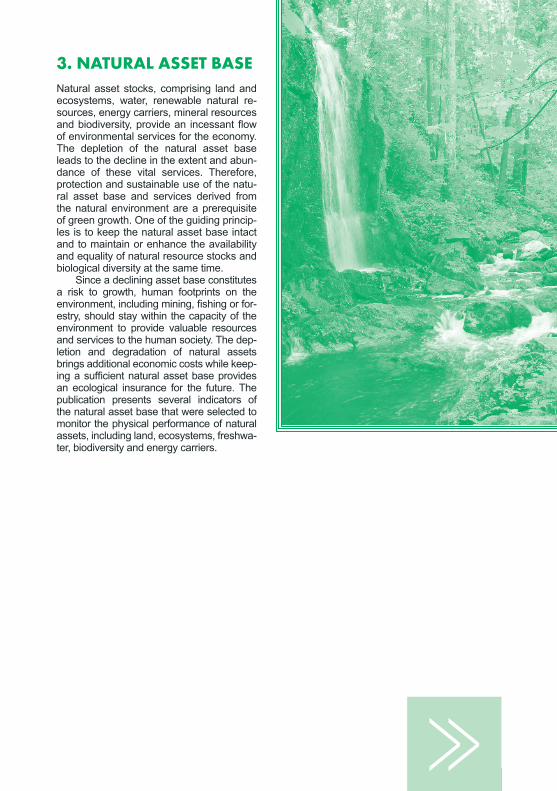
3. NATURAL ASSET BASENatural asset stocks, comprising land and ecosystems, water, renewable natural re-sources, energy carriers, mineral resources and biodiversity, provide an incessant flow of environmental services for the economy. The depletion of the natural asset base leads to the decline in the extent and abun-dance of these vital services. Therefore, protection and sustainable use of the natu-ral asset base and services derived from the natural environment are a prerequisite of green growth. One of the guiding princip-les is to keep the natural asset base intact and to maintain or enhance the availability and equality of natural resource stocks and biological diversity at the same time.
Since a declining asset base constitutes a risk to growth, human footprints on the environment, including mining, fishing or for-estry, should stay within the capacity of the environment to provide valuable resources and services to the human society. The dep- letion and degradation of natural assets brings additional economic costs while keep-ing a sufficient natural asset base provides an ecological insurance for the future. The publication presents several indicators of the natural asset base that were selected to monitor the physical performance of natural assets, including land, ecosystems, freshwa-ter, biodiversity and energy carriers.
>>
CZECH STAT IST ICAL OFFICE
30
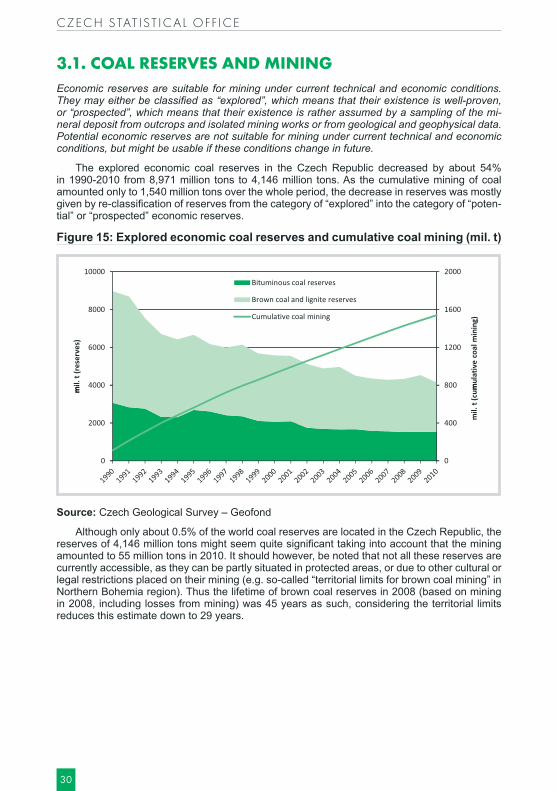
3.1. COAL RESERVES AND MININGEconomic reserves are suitable for mining under current technical and economic conditions. They may either be classified as “explored”, which means that their existence is well-proven, or “prospected”, which means that their existence is rather assumed by a sampling of the mi-neral deposit from outcrops and isolated mining works or from geological and geophysical data. Potential economic reserves are not suitable for mining under current technical and economic conditions, but might be usable if these conditions change in future.
The explored economic coal reserves in the Czech Republic decreased by about 54% in 1990-2010 from 8,971 million tons to 4,146 million tons. As the cumulative mining of coal amounted only to 1,540 million tons over the whole period, the decrease in reserves was mostly given by re-classification of reserves from the category of “explored” into the category of “poten-tial” or “prospected” economic reserves.
Figure 15: Explored economic coal reserves and cumulative coal mining (mil. t)
Source: Czech Geological Survey – Geofond
Although only about 0.5% of the world coal reserves are located in the Czech Republic, the reserves of 4,146 million tons might seem quite significant taking into account that the mining amounted to 55 million tons in 2010. It should however, be noted that not all these reserves are currently accessible, as they can be partly situated in protected areas, or due to other cultural or legal restrictions placed on their mining (e.g. so-called “territorial limits for brown coal mining” in Northern Bohemia region). Thus the lifetime of brown coal reserves in 2008 (based on mining in 2008, including losses from mining) was 45 years as such, considering the territorial limits reduces this estimate down to 29 years.
GREEN GROW TH IN THE CZECH REPUBL IC
31
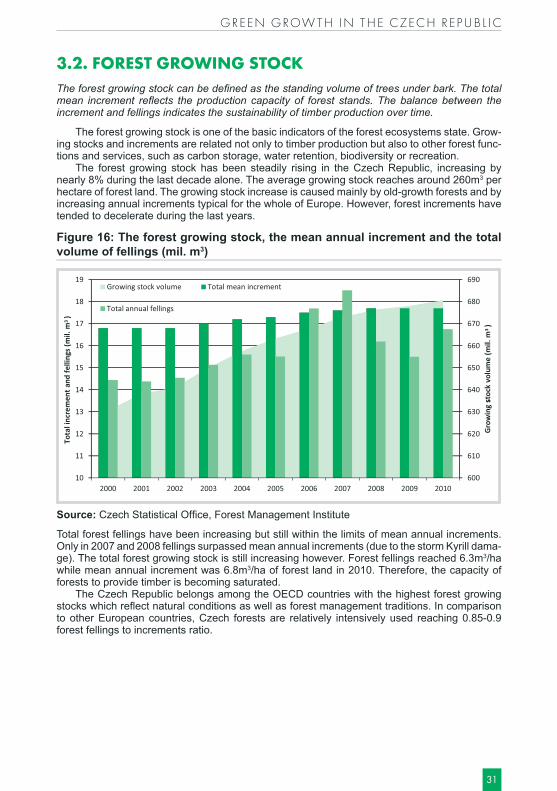
3.2. FOREST GROWING STOCKThe forest growing stock can be defined as the standing volume of trees under bark. The total mean increment reflects the production capacity of forest stands. The balance between the increment and fellings indicates the sustainability of timber production over time.
The forest growing stock is one of the basic indicators of the forest ecosystems state. Grow-ing stocks and increments are related not only to timber production but also to other forest func-tions and services, such as carbon storage, water retention, biodiversity or recreation.
The forest growing stock has been steadily rising in the Czech Republic, increasing by nearly 8% during the last decade alone. The average growing stock reaches around 260m3 per hectare of forest land. The growing stock increase is caused mainly by old-growth forests and by increasing annual increments typical for the whole of Europe. However, forest increments have tended to decelerate during the last years.
Figure 16: The forest growing stock, the mean annual increment and the total volume of fellings (mil. m3)
Source: Czech Statistical Office, Forest Management Institute
Total forest fellings have been increasing but still within the limits of mean annual increments. Only in 2007 and 2008 fellings surpassed mean annual increments (due to the storm Kyrill dama-ge). The total forest growing stock is still increasing however. Forest fellings reached 6.3m3/ha while mean annual increment was 6.8m3/ha of forest land in 2010. Therefore, the capacity of forests to provide timber is becoming saturated.
The Czech Republic belongs among the OECD countries with the highest forest growing stocks which reflect natural conditions as well as forest management traditions. In comparison to other European countries, Czech forests are relatively intensively used reaching 0.85-0.9 forest fellings to increments ratio.
CZECH STAT IST ICAL OFFICE
32
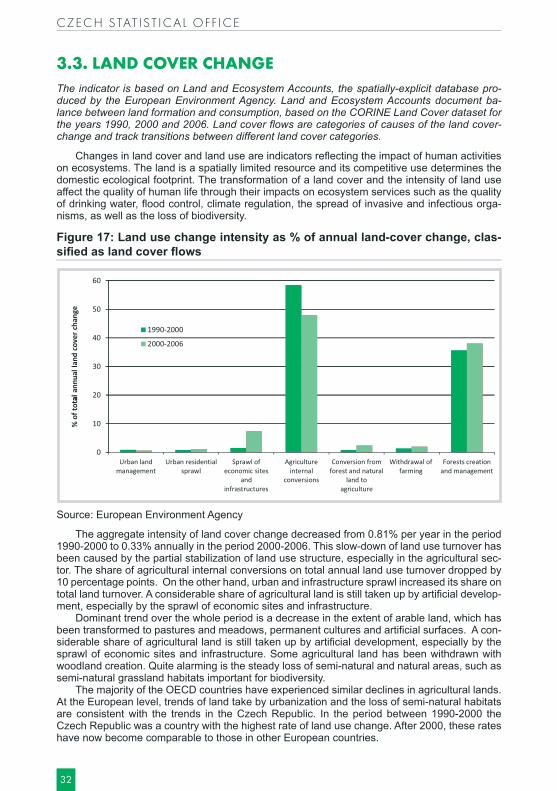
3.3. LAND COVER CHANGEThe indicator is based on Land and Ecosystem Accounts, the spatially-explicit database pro-duced by the European Environment Agency. Land and Ecosystem Accounts document ba-lance between land formation and consumption, based on the CORINE Land Cover dataset for the years 1990, 2000 and 2006. Land cover flows are categories of causes of the land cover- change and track transitions between different land cover categories.
Changes in land cover and land use are indicators reflecting the impact of human activities on ecosystems. The land is a spatially limited resource and its competitive use determines the domestic ecological footprint. The transformation of a land cover and the intensity of land use affect the quality of human life through their impacts on ecosystem services such as the quality of drinking water, flood control, climate regulation, the spread of invasive and infectious orga-nisms, as well as the loss of biodiversity.
Figure 17: Land use change intensity as % of annual land-cover change, clas-sified as land cover flows
Source: European Environment Agency
The aggregate intensity of land cover change decreased from 0.81% per year in the period 1990-2000 to 0.33% annually in the period 2000-2006. This slow-down of land use turnover has been caused by the partial stabilization of land use structure, especially in the agricultural sec-tor. The share of agricultural internal conversions on total annual land use turnover dropped by 10 percentage points. On the other hand, urban and infrastructure sprawl increased its share on total land turnover. A considerable share of agricultural land is still taken up by artificial develop-ment, especially by the sprawl of economic sites and infrastructure.
Dominant trend over the whole period is a decrease in the extent of arable land, which has been transformed to pastures and meadows, permanent cultures and artificial surfaces. A con-siderable share of agricultural land is still taken up by artificial development, especially by the sprawl of economic sites and infrastructure. Some agricultural land has been withdrawn with woodland creation. Quite alarming is the steady loss of semi-natural and natural areas, such as semi-natural grassland habitats important for biodiversity.
The majority of the OECD countries have experienced similar declines in agricultural lands. At the European level, trends of land take by urbanization and the loss of semi-natural habitats are consistent with the trends in the Czech Republic. In the period between 1990-2000 the Czech Republic was a country with the highest rate of land use change. After 2000, these rates have now become comparable to those in other European countries.
GREEN GROW TH IN THE CZECH REPUBL IC
33
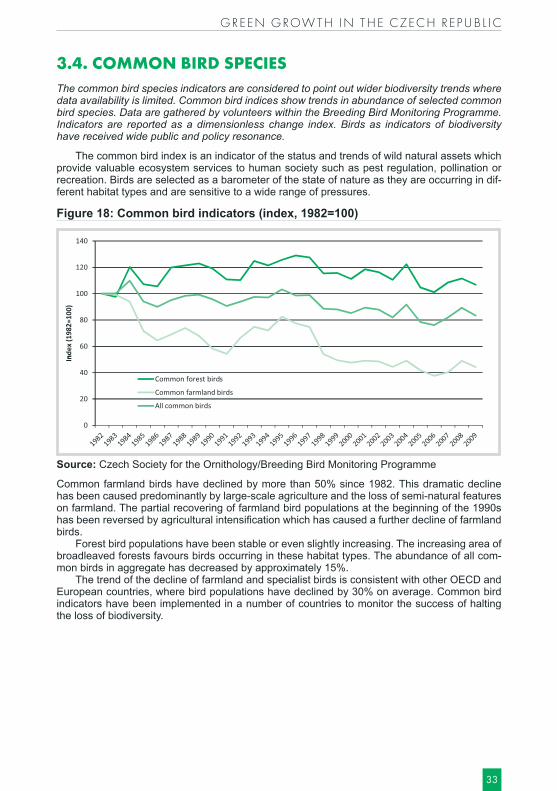
3.4. COMMON BIRD SPECIESThe common bird species indicators are considered to point out wider biodiversity trends where data availability is limited. Common bird indices show trends in abundance of selected common bird species. Data are gathered by volunteers within the Breeding Bird Monitoring Programme. Indicators are reported as a dimensionless change index. Birds as indicators of biodiversity have received wide public and policy resonance.
The common bird index is an indicator of the status and trends of wild natural assets which provide valuable ecosystem services to human society such as pest regulation, pollination or recreation. Birds are selected as a barometer of the state of nature as they are occurring in dif-ferent habitat types and are sensitive to a wide range of pressures.
Figure 18: Common bird indicators (index, 1982=100)
Source: Czech Society for the Ornithology/Breeding Bird Monitoring Programme
Common farmland birds have declined by more than 50% since 1982. This dramatic decline has been caused predominantly by large-scale agriculture and the loss of semi-natural features on farmland. The partial recovering of farmland bird populations at the beginning of the 1990s has been reversed by agricultural intensification which has caused a further decline of farmland birds.
Forest bird populations have been stable or even slightly increasing. The increasing area of broadleaved forests favours birds occurring in these habitat types. The abundance of all com-mon birds in aggregate has decreased by approximately 15%.
The trend of the decline of farmland and specialist birds is consistent with other OECD and European countries, where bird populations have declined by 30% on average. Common bird indicators have been implemented in a number of countries to monitor the success of halting the loss of biodiversity.
CZECH STAT IST ICAL OFFICE
34
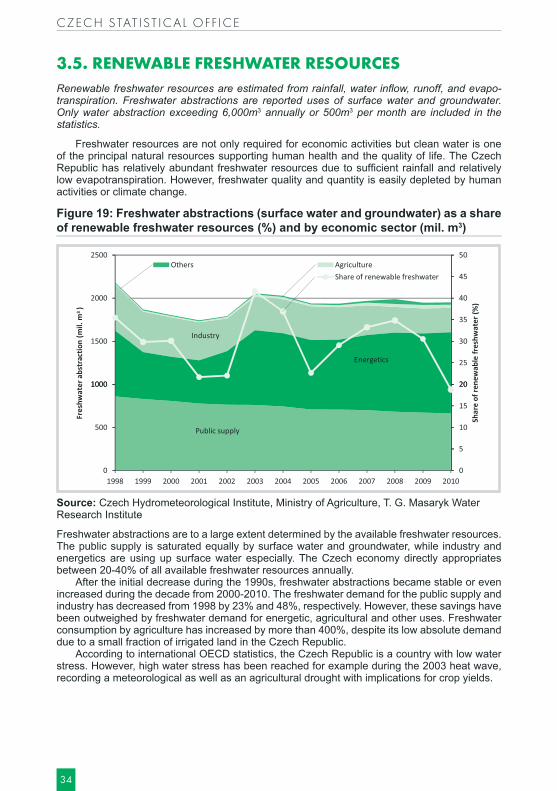
3.5. RENEWABLE FRESHWATER RESOURCESRenewable freshwater resources are estimated from rainfall, water inflow, runoff, and evapo-transpiration. Freshwater abstractions are reported uses of surface water and groundwater. Only water abstraction exceeding 6,000m3 annually or 500m3 per month are included in the statistics.
Freshwater resources are not only required for economic activities but clean water is one of the principal natural resources supporting human health and the quality of life. The Czech Republic has relatively abundant freshwater resources due to sufficient rainfall and relatively low evapotranspiration. However, freshwater quality and quantity is easily depleted by human activities or climate change.
Figure 19: Freshwater abstractions (surface water and groundwater) as a share of renewable freshwater resources (%) and by economic sector (mil. m3)
Source: Czech Hydrometeorological Institute, Ministry of Agriculture, T. G. Masaryk Water Research Institute
Freshwater abstractions are to a large extent determined by the available freshwater resources. The public supply is saturated equally by surface water and groundwater, while industry and energetics are using up surface water especially. The Czech economy directly appropriates between 20-40% of all available freshwater resources annually.
After the initial decrease during the 1990s, freshwater abstractions became stable or even increased during the decade from 2000-2010. The freshwater demand for the public supply and industry has decreased from 1998 by 23% and 48%, respectively. However, these savings have been outweighed by freshwater demand for energetic, agricultural and other uses. Freshwater consumption by agriculture has increased by more than 400%, despite its low absolute demand due to a small fraction of irrigated land in the Czech Republic.
According to international OECD statistics, the Czech Republic is a country with low water stress. However, high water stress has been reached for example during the 2003 heat wave, recording a meteorological as well as an agricultural drought with implications for crop yields.
GREEN GROW TH IN THE CZECH REPUBL IC
35
4. ENVIRONMENTAL QUALITY OF LIFEThe quality of the environment is a key factor that influences the overall well- being and the quality of life of people and other living beings. The quality of life is a multidimensional concept that deserves a multidimensional measure; clean air and clean water are, inter alia, two important prerequisites for human wellbeing in the Czech Republic. Air pollution is regarded to be a major environmental health risk: by reducing air pollution levels, countries may expect reduction of the burden from respiratory infections, heart diseases, and lung cancer.
The most significant relationships bet-ween water and the quality of life appear not to stem from water quantity per se, but rather from variables related to water infrastructure – the wells, pumping sta-tions, pipes, and sewers that deliver water to residents on the one hand and remove wastewater on the other. Good health level may be related to many benefits, includ-ing enhanced access to education and the job market, an increase in productivity and wealth, reduced health care costs, good social climate, and of course, a longer life expectancy.
>>
CZECH STAT IST ICAL OFFICE
36
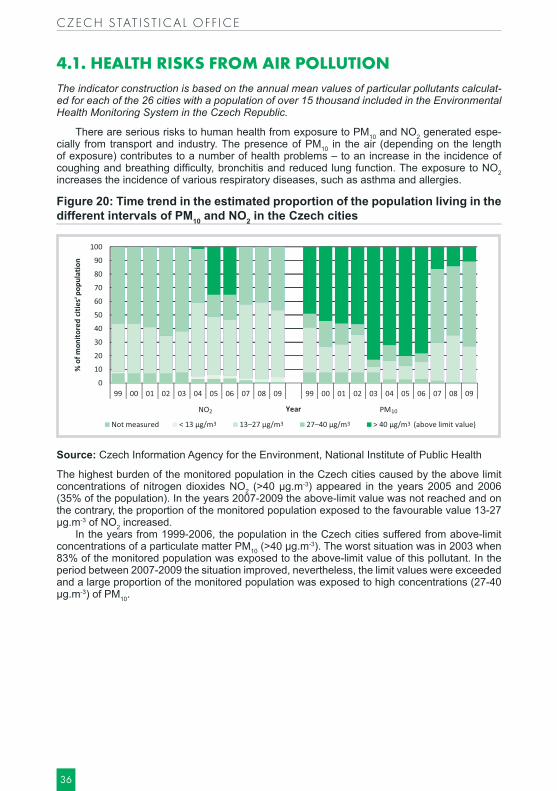
4.1. HEALTH RISKS FROM AIR POLLUTIONThe indicator construction is based on the annual mean values of particular pollutants calculat-ed for each of the 26 cities with a population of over 15 thousand included in the Environmental Health Monitoring System in the Czech Republic.
There are serious risks to human health from exposure to PM10 and NO2 generated espe-cially from transport and industry. The presence of PM10 in the air (depending on the length of exposure) contributes to a number of health problems – to an increase in the incidence of coughing and breathing difficulty, bronchitis and reduced lung function. The exposure to NO2 increases the incidence of various respiratory diseases, such as asthma and allergies.
Figure 20: Time trend in the estimated proportion of the population living in the different intervals of PM10 and NO2 in the Czech cities
Source: Czech Information Agency for the Environment, National Institute of Public Health
The highest burden of the monitored population in the Czech cities caused by the above limit concentrations of nitrogen dioxides NO2 (>40 µg.m-3) appeared in the years 2005 and 2006 (35% of the population). In the years 2007-2009 the above-limit value was not reached and on the contrary, the proportion of the monitored population exposed to the favourable value 13-27 µg.m-3 of NO2 increased.
In the years from 1999-2006, the population in the Czech cities suffered from above-limit concentrations of a particulate matter PM10 (>40 µg.m-3). The worst situation was in 2003 when 83% of the monitored population was exposed to the above-limit value of this pollutant. In the period between 2007-2009 the situation improved, nevertheless, the limit values were exceeded and a large proportion of the monitored population was exposed to high concentrations (27-40 µg.m-3) of PM10.
GREEN GROW TH IN THE CZECH REPUBL IC
37
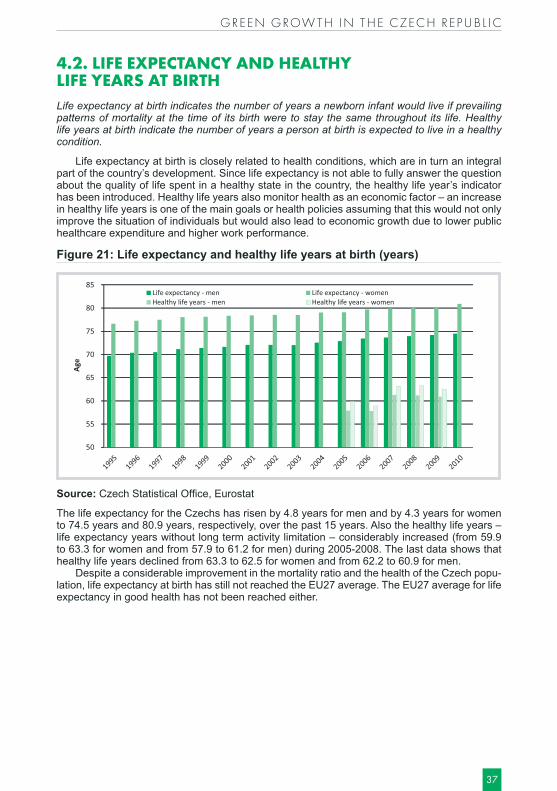
4.2. LIFE EXPECTANCY AND HEALTHY LIFE YEARS AT BIRTHLife expectancy at birth indicates the number of years a newborn infant would live if prevailing patterns of mortality at the time of its birth were to stay the same throughout its life. Healthy life years at birth indicate the number of years a person at birth is expected to live in a healthy condition.
Life expectancy at birth is closely related to health conditions, which are in turn an integral part of the country’s development. Since life expectancy is not able to fully answer the question about the quality of life spent in a healthy state in the country, the healthy life year’s indicator has been introduced. Healthy life years also monitor health as an economic factor – an increase in healthy life years is one of the main goals or health policies assuming that this would not only improve the situation of individuals but would also lead to economic growth due to lower public healthcare expenditure and higher work performance.
Figure 21: Life expectancy and healthy life years at birth (years)
Source: Czech Statistical Office, Eurostat
The life expectancy for the Czechs has risen by 4.8 years for men and by 4.3 years for women to 74.5 years and 80.9 years, respectively, over the past 15 years. Also the healthy life years – life expectancy years without long term activity limitation – considerably increased (from 59.9 to 63.3 for women and from 57.9 to 61.2 for men) during 2005-2008. The last data shows that healthy life years declined from 63.3 to 62.5 for women and from 62.2 to 60.9 for men.
Despite a considerable improvement in the mortality ratio and the health of the Czech popu-lation, life expectancy at birth has still not reached the EU27 average. The EU27 average for life expectancy in good health has not been reached either.

CZECH STAT IST ICAL OFFICE
38
4.3. POPULATION CONNECTED TO SEWERAGE TREATMENT AND PUBLIC WATER SUPPLYThe population connected to sewerage treatment and public water supply indicators are cons-tructed as proportions of the total population connected to sewerage systems and to the public water supply network, respectively.
Waste water treatment reduces the amount of discharged pollution and is therefore an essential tool for improving the surface and ground water quality. According to the State Envi-ronmental Policy of the Czech Republic, a desirable trend includes increasing the proportion of the population connected to public sewerage systems and to sewerage systems ending in waste water treatment plants. The quality of the water supply – leakages in the distribution net-work, pipe breaks, and the quality of water at the tap – is still the main concern in many OECD countries (the OECD is working with the UN’s Joint Monitoring Programme to identify and test such indicators).
Figure 22: Population connected to sewage treatment and public water supply (%)
Source: Czech Statistical Office
The proportion of the population connected to the waste water sewerage system increased from 73 to 82% which has been well documented by the development in the waste water manage-ment area in the Czech Republic during the last 15 years. The sewerage water treatment was more extensive in larger municipalities; recently, attention has focused on the development of waste water treatment plants in municipalities with a 2.000 to 10.000 population equivalent.
International comparison shows that the Czech Republic lags behind the best EU states which treat waste water discharged by 90-100% of the population. On the other hand, the share of treated water is above the OECD average that has risen from nearly 50% in the early 1980s to about 70% nowadays. Since 1995, the Czech Republic has also increased access to the public water supply from 86 to 93%.

GREEN GROW TH IN THE CZECH REPUBL IC
39
5. ECONOMIC OPPORTUNITIES AND POLICY RESPONSESThe principal role of governments is to fos-ter green growth by setting policy and the legal framework that allows individuals and companies to develop greener consump-tion and production patterns. The crucial issue is to use environmental protection as a stimulant of growth, employment and trade, as well as a source of international competitiveness.
Technological research, development and innovations are important for any eco-nomic growth and this applies to green growth as well. Technological progress is useful for developing greener production and consumption and for creating new jobs. Publicly funded research in particu-lar is important here as it can focus on the mid- and long-term research horizons. Complementary to the technological deve-lopment is the attainment of an appropriate education. Green growth requires well-educated workers able to meet the higher requirements for skilled jobs.
Investments in green technologies and environmental protection in general are a key element in reshaping the current growth paradigm for green growth. Envi-ronmental taxation with energy pricing is a direct tool for governments to stimulate growth in a particular way. In the case of the Czech Republic it is particularly true since environ-mental levies are part of the environmental fund used for green innovations, green job promo-tions and investment in the protection of the environment in general.
>>
CZECH STAT IST ICAL OFFICE
40
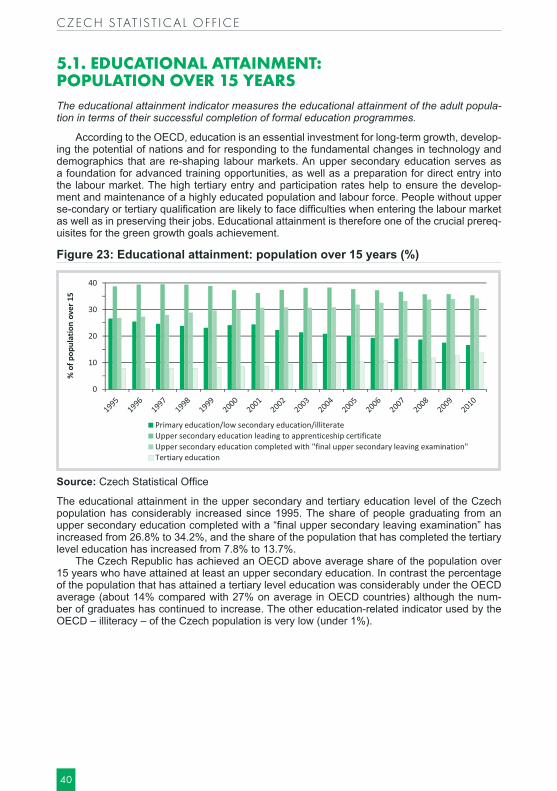
5.1. EDUCATIONAL ATTAINMENT: POPULATION OVER 15 YEARSThe educational attainment indicator measures the educational attainment of the adult popula-tion in terms of their successful completion of formal education programmes.
According to the OECD, education is an essential investment for long-term growth, develop-ing the potential of nations and for responding to the fundamental changes in technology and demographics that are re-shaping labour markets. An upper secondary education serves as a foundation for advanced training opportunities, as well as a preparation for direct entry into the labour market. The high tertiary entry and participation rates help to ensure the develop-ment and maintenance of a highly educated population and labour force. People without upper se-condary or tertiary qualification are likely to face difficulties when entering the labour market as well as in preserving their jobs. Educational attainment is therefore one of the crucial prereq-uisites for the green growth goals achievement.
Figure 23: Educational attainment: population over 15 years (%)
Source: Czech Statistical Office
The educational attainment in the upper secondary and tertiary education level of the Czech population has considerably increased since 1995. The share of people graduating from an upper secondary education completed with a “final upper secondary leaving examination” has increased from 26.8% to 34.2%, and the share of the population that has completed the tertiary level education has increased from 7.8% to 13.7%.
The Czech Republic has achieved an OECD above average share of the population over 15 years who have attained at least an upper secondary education. In contrast the percentage of the population that has attained a tertiary level education was considerably under the OECD average (about 14% compared with 27% on average in OECD countries) although the num-ber of graduates has continued to increase. The other education-related indicator used by the OECD – illiteracy – of the Czech population is very low (under 1%).
GREEN GROW TH IN THE CZECH REPUBL IC
41
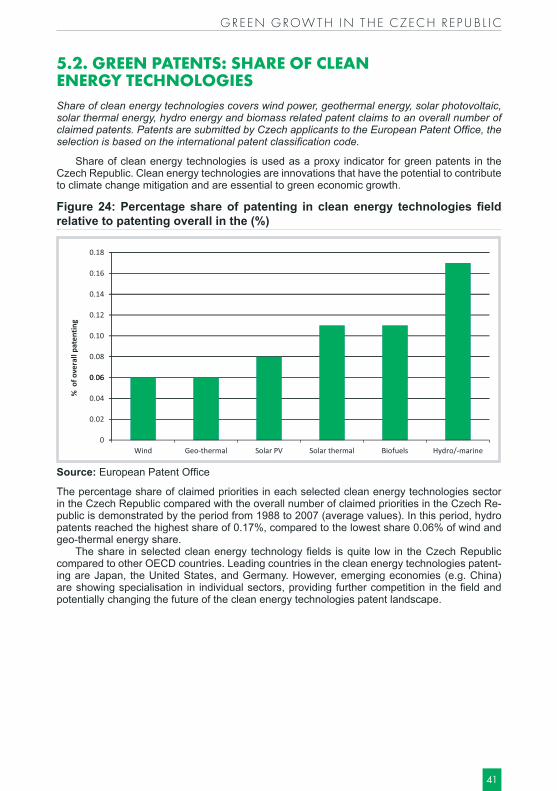
5.2. GREEN PATENTS: SHARE OF CLEAN ENERGY TECHNOLOGIESShare of clean energy technologies covers wind power, geothermal energy, solar photovoltaic, solar thermal energy, hydro energy and biomass related patent claims to an overall number of claimed patents. Patents are submitted by Czech applicants to the European Patent Office, the selection is based on the international patent classification code.
Share of clean energy technologies is used as a proxy indicator for green patents in the Czech Republic. Clean energy technologies are innovations that have the potential to contribute to climate change mitigation and are essential to green economic growth.
Figure 24: Percentage share of patenting in clean energy technologies field relative to patenting overall in the (%)
Source: European Patent Office
The percentage share of claimed priorities in each selected clean energy technologies sector in the Czech Republic compared with the overall number of claimed priorities in the Czech Re-public is demonstrated by the period from 1988 to 2007 (average values). In this period, hydro patents reached the highest share of 0.17%, compared to the lowest share 0.06% of wind and geo-thermal energy share.
The share in selected clean energy technology fields is quite low in the Czech Republic compared to other OECD countries. Leading countries in the clean energy technologies patent-ing are Japan, the United States, and Germany. However, emerging economies (e.g. China) are showing specialisation in individual sectors, providing further competition in the field and potentially changing the future of the clean energy technologies patent landscape.
CZECH STAT IST ICAL OFFICE
42
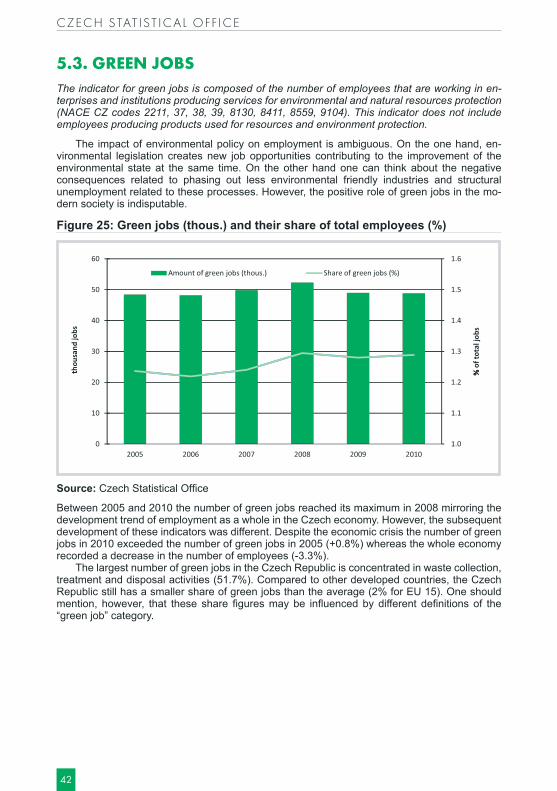
5.3. GREEN JOBSThe indicator for green jobs is composed of the number of employees that are working in en-terprises and institutions producing services for environmental and natural resources protection (NACE CZ codes 2211, 37, 38, 39, 8130, 8411, 8559, 9104). This indicator does not include employees producing products used for resources and environment protection.
The impact of environmental policy on employment is ambiguous. On the one hand, en-vironmental legislation creates new job opportunities contributing to the improvement of the environmental state at the same time. On the other hand one can think about the negative consequences related to phasing out less environmental friendly industries and structural unemployment related to these processes. However, the positive role of green jobs in the mo-dern society is indisputable.
Figure 25: Green jobs (thous.) and their share of total employees (%)
Source: Czech Statistical Office
Between 2005 and 2010 the number of green jobs reached its maximum in 2008 mirroring the development trend of employment as a whole in the Czech economy. However, the subsequent development of these indicators was different. Despite the economic crisis the number of green jobs in 2010 exceeded the number of green jobs in 2005 (+0.8%) whereas the whole economy recorded a decrease in the number of employees (-3.3%).
The largest number of green jobs in the Czech Republic is concentrated in waste collection, treatment and disposal activities (51.7%). Compared to other developed countries, the Czech Republic still has a smaller share of green jobs than the average (2% for EU 15). One should mention, however, that these share figures may be influenced by different definitions of the “green job” category.
GREEN GROW TH IN THE CZECH REPUBL IC
43
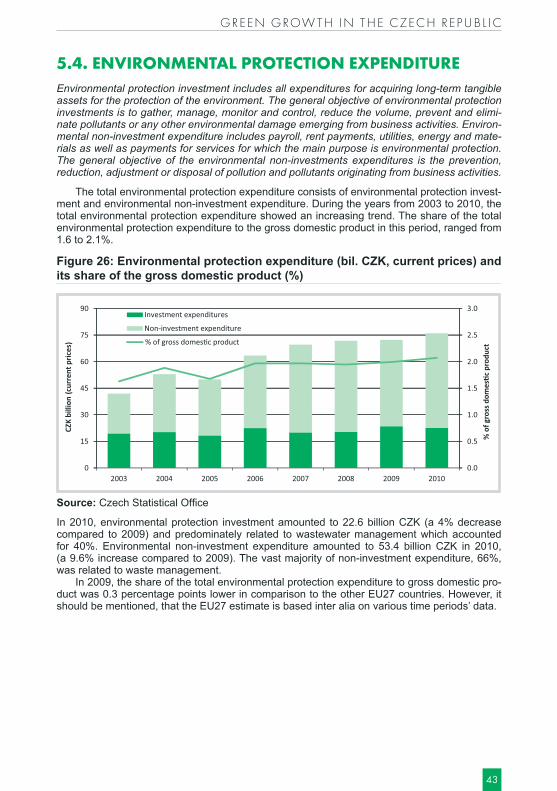
5.4. ENVIRONMENTAL PROTECTION EXPENDITUREEnvironmental protection investment includes all expenditures for acquiring long-term tangible assets for the protection of the environment. The general objective of environmental protection investments is to gather, manage, monitor and control, reduce the volume, prevent and elimi-nate pollutants or any other environmental damage emerging from business activities. Environ-mental non-investment expenditure includes payroll, rent payments, utilities, energy and mate-rials as well as payments for services for which the main purpose is environmental protection. The general objective of the environmental non-investments expenditures is the prevention, reduction, adjustment or disposal of pollution and pollutants originating from business activities.
The total environmental protection expenditure consists of environmental protection invest-ment and environmental non-investment expenditure. During the years from 2003 to 2010, the total environmental protection expenditure showed an increasing trend. The share of the total environmental protection expenditure to the gross domestic product in this period, ranged from 1.6 to 2.1%.
Figure 26: Environmental protection expenditure (bil. CZK, current prices) and its share of the gross domestic product (%)
Source: Czech Statistical Office
In 2010, environmental protection investment amounted to 22.6 billion CZK (a 4% decrease compared to 2009) and predominately related to wastewater management which accounted for 40%. Environmental non-investment expenditure amounted to 53.4 billion CZK in 2010, (a 9.6% increase compared to 2009). The vast majority of non-investment expenditure, 66%, was related to waste management.
In 2009, the share of the total environmental protection expenditure to gross domestic pro-duct was 0.3 percentage points lower in comparison to the other EU27 countries. However, it should be mentioned, that the EU27 estimate is based inter alia on various time periods’ data.
% of gross domestic product
% o
f gro
ss d
omes
tic p
rodu
ct
CZECH STAT IST ICAL OFFICE
44
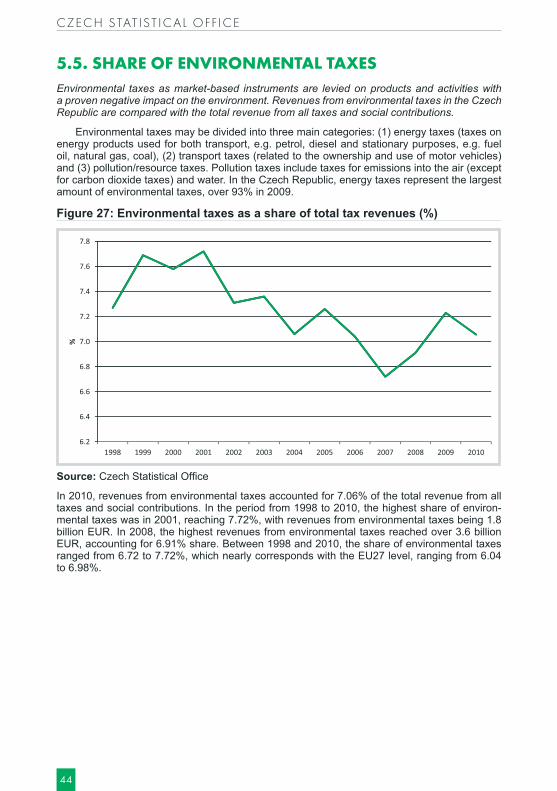
5.5. SHARE OF ENVIRONMENTAL TAXESEnvironmental taxes as market-based instruments are levied on products and activities with a proven negative impact on the environment. Revenues from environmental taxes in the Czech Republic are compared with the total revenue from all taxes and social contributions.
Environmental taxes may be divided into three main categories: (1) energy taxes (taxes on energy products used for both transport, e.g. petrol, diesel and stationary purposes, e.g. fuel oil, natural gas, coal), (2) transport taxes (related to the ownership and use of motor vehicles) and (3) pollution/resource taxes. Pollution taxes include taxes for emissions into the air (except for carbon dioxide taxes) and water. In the Czech Republic, energy taxes represent the largest amount of environmental taxes, over 93% in 2009.
Figure 27: Environmental taxes as a share of total tax revenues (%)
Source: Czech Statistical Office
In 2010, revenues from environmental taxes accounted for 7.06% of the total revenue from all taxes and social contributions. In the period from 1998 to 2010, the highest share of environ-mental taxes was in 2001, reaching 7.72%, with revenues from environmental taxes being 1.8 billion EUR. In 2008, the highest revenues from environmental taxes reached over 3.6 billion EUR, accounting for 6.91% share. Between 1998 and 2010, the share of environmental taxes ranged from 6.72 to 7.72%, which nearly corresponds with the EU27 level, ranging from 6.04 to 6.98%.
GREEN GROW TH IN THE CZECH REPUBL IC
45
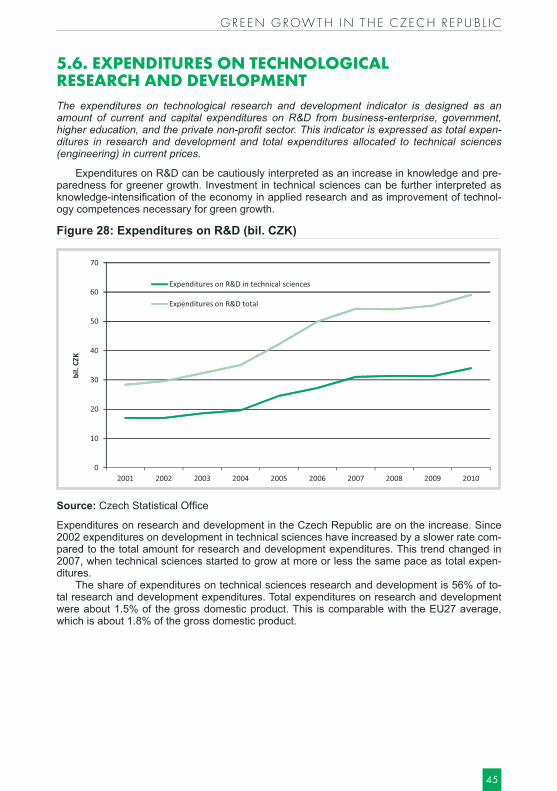
5.6. EXPENDITURES ON TECHNOLOGICAL RESEARCH AND DEVELOPMENTThe expenditures on technological research and development indicator is designed as an amount of current and capital expenditures on R&D from business-enterprise, government, higher education, and the private non-profit sector. This indicator is expressed as total expen-ditures in research and development and total expenditures allocated to technical sciences (engineering) in current prices.
Expenditures on R&D can be cautiously interpreted as an increase in knowledge and pre-paredness for greener growth. Investment in technical sciences can be further interpreted as knowledge-intensification of the economy in applied research and as improvement of technol-ogy competences necessary for green growth.
Figure 28: Expenditures on R&D (bil. CZK)
Source: Czech Statistical Office
Expenditures on research and development in the Czech Republic are on the increase. Since 2002 expenditures on development in technical sciences have increased by a slower rate com-pared to the total amount for research and development expenditures. This trend changed in 2007, when technical sciences started to grow at more or less the same pace as total expen-ditures.
The share of expenditures on technical sciences research and development is 56% of to-tal research and development expenditures. Total expenditures on research and development were about 1.5% of the gross domestic product. This is comparable with the EU27 average, which is about 1.8% of the gross domestic product.
CZECH STAT IST ICAL OFFICE
46
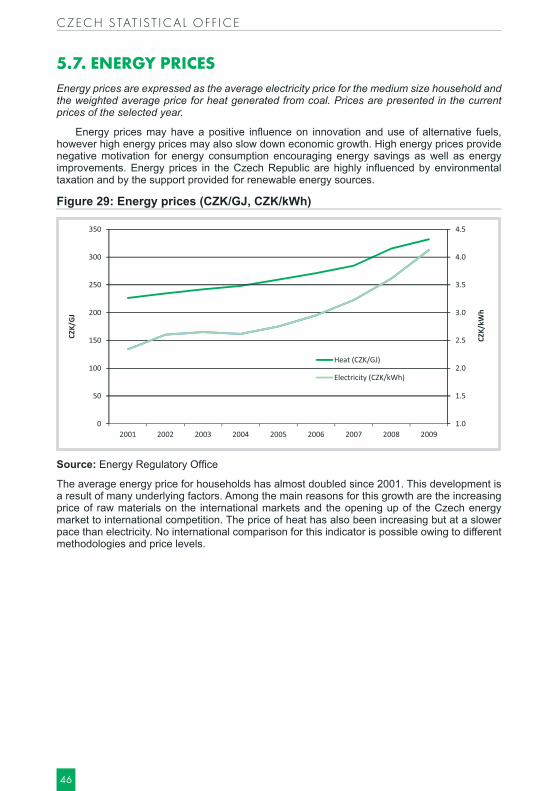
5.7. ENERGY PRICESEnergy prices are expressed as the average electricity price for the medium size household and the weighted average price for heat generated from coal. Prices are presented in the current prices of the selected year.
Energy prices may have a positive influence on innovation and use of alternative fuels, however high energy prices may also slow down economic growth. High energy prices provide negative motivation for energy consumption encouraging energy savings as well as energy improvements. Energy prices in the Czech Republic are highly influenced by environmental taxation and by the support provided for renewable energy sources.
Figure 29: Energy prices (CZK/GJ, CZK/kWh)
Source: Energy Regulatory Office
The average energy price for households has almost doubled since 2001. This development is a result of many underlying factors. Among the main reasons for this growth are the increasing price of raw materials on the international markets and the opening up of the Czech energy market to international competition. The price of heat has also been increasing but at a slower pace than electricity. No international comparison for this indicator is possible owing to different methodologies and price levels.
GREEN GROW TH IN THE CZECH REPUBL IC
47
INFORMATION SOURCESCzech Environmental Information Agency (CENIA)
http://www.cenia.czCzech Geological Survey – Geofond
http://www.geofond.czCzech Hydrometeorological Institute
http://www.chmi.czCzech Society for Ornithology
http://www.birdlife.czCzech Statistical Office
http://www.czso.czEnergy Regulatory Office
http://www.eru.czEuropan Environmental Agency (EEA);
http://www.eea.europa.euEuropean Commision
http://ec.europa.euEuropean Patent Office (EPO)
http://www.epo.orgEurostat
http://epp.eurostat.ec.europa.euForest Management Institute
http://www.uhul.czCharles University Environment Center
http://www.czp.cuni.czInternational Centre for Trade and Sustainable Development
http://ictsd.orgMinistry of Agriculture of the Czech Republic
http://www.mze.czMinistry of Industry and Trade of the Czech Republic
http://www.mpo.czMinistry of the Environment of the Czech Republic
http://www.env.czNational Institute of Public Health
http://www.szu.czOrganisation for Economic Co-operation and Development (OECD)
http://www.oecd.orgScientific Committee on Problems of the Environment (SCOPE)
http://www.icsu-scope.orgT. G. Masaryk Water Research Institute
http://www.vuv.czUnited Nations Environment Programme (UNEP)
http://www.unep.orgWorld Bank
http://www.worldbank.org
code: 2010-11
GREEN GROWTHIN THE CZECH REPUBLICSELECTED INDICATORS
Czech Statistical Offi ce Na padesátém 81 100 82 Praha 10Czech Republic
Orders contact: e-mail: [email protected] phone: +420 274 052 400
ISBN 978-80-250-2141-5
© Czech Statistical Offi ce, 2011www.czso.cz
Published in collaboration with