Embed Size (px)
Citation preview
GREEN POWER:
Canadian Context and International Developments
SUMMERHILL GROUP
MELISSA FELDER
NOVEMBER 2002
OVERVIEW
Overview of Green Power
Canadian Context
International Developments
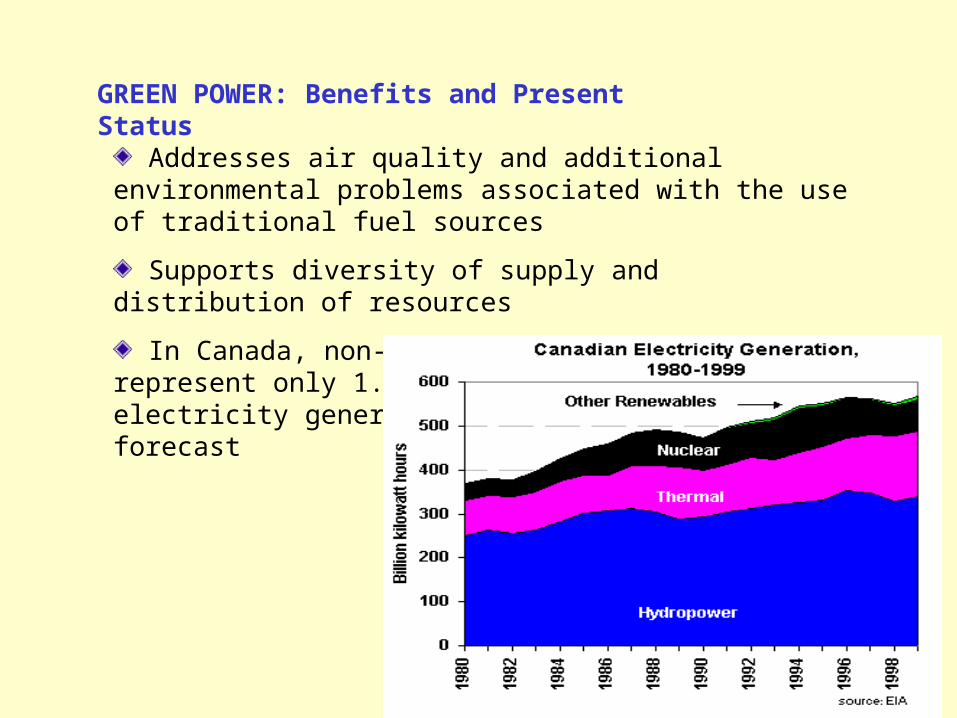
GREEN POWER: Benefits and Present Status
Addresses air quality and additional environmental problems associated with the use of traditional fuel sources
Supports diversity of supply and distribution of resources
In Canada, non-large hydro renewables represent only 1.2 - 3% of the nation’s electricity generation (Fig.), 3% growth forecast
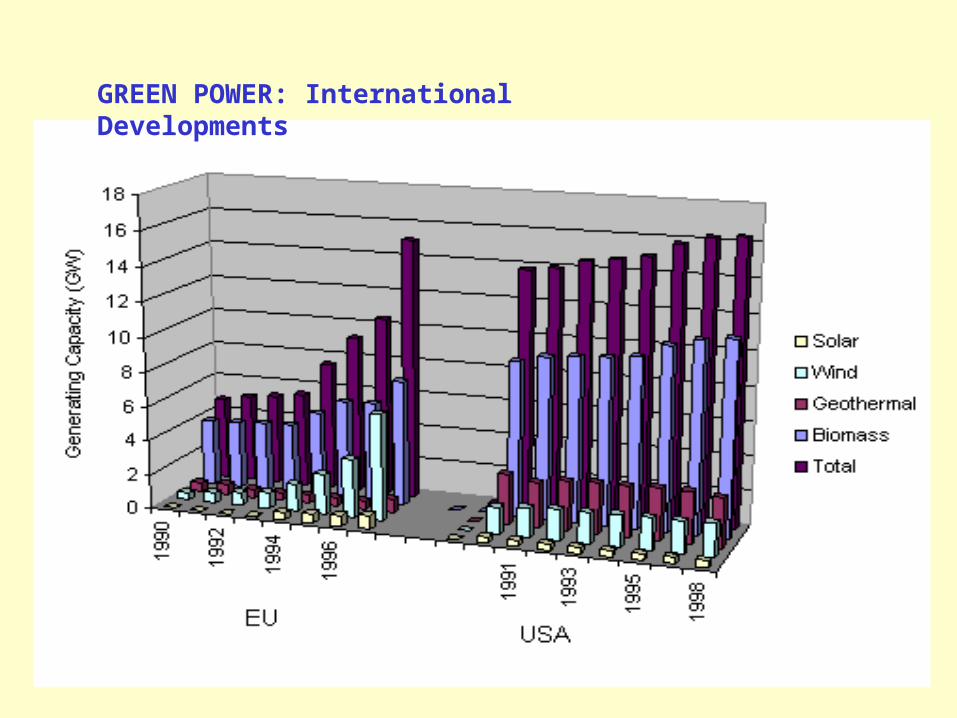
GREEN POWER: International Developments
Electricity Structure in Canada
0
20000
40000
60000
80000
100000
Geothermal
Wind
Small hydro
Biomass
Wave
Tidal
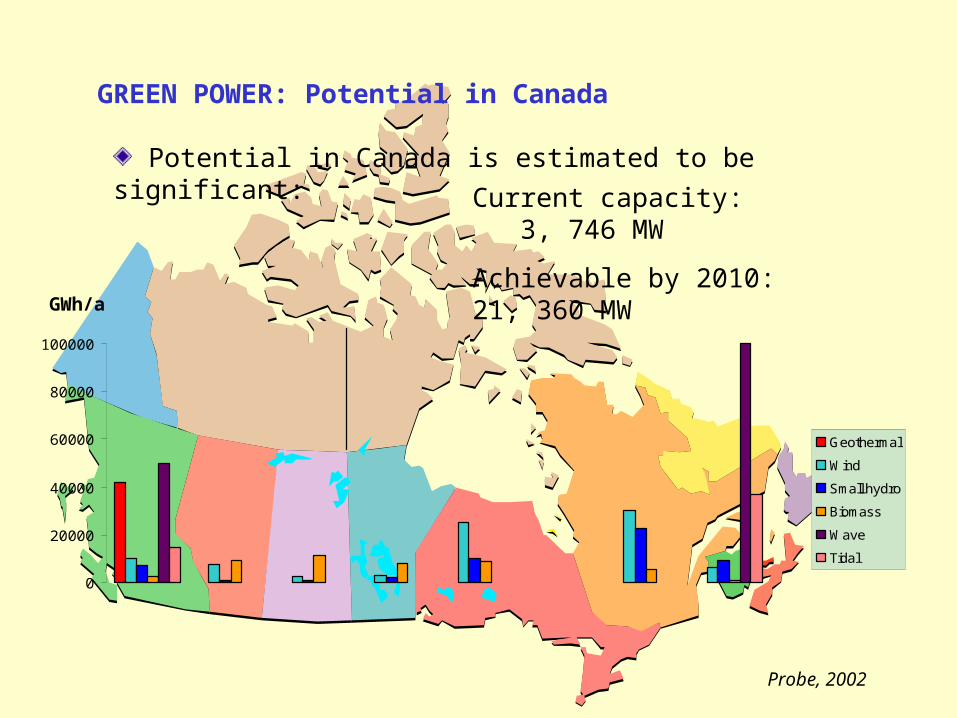
GREEN POWER: Potential in Canada
Potential in Canada is estimated to be significant:
Probe, 2002
Current capacity: 3, 746 MW
Achievable by 2010: 21, 360 MW
GWh/a
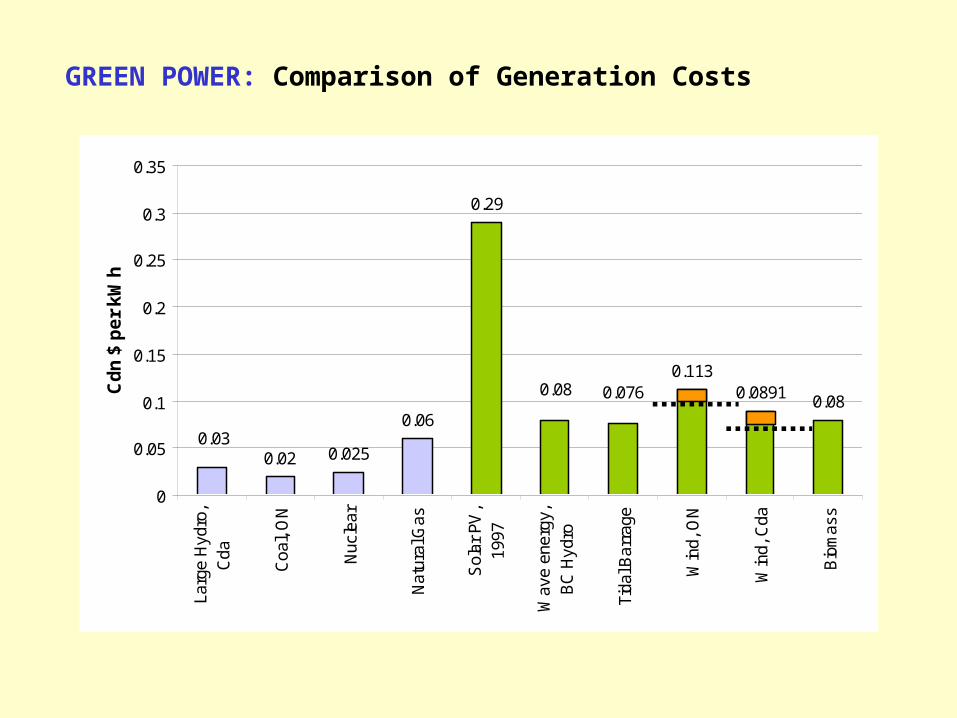
GREEN POWER: Comparison of Generation Costs
0.02 0.025
0.06
0.29
0.1130.0891 0.080.0760.08
0.03
0
0.05
0.1
0.15
0.2
0.25
0.3
0.35
Larg
e H
ydro
,C
da
Coa
l, O
N
Nuc
lear
Nat
ural
Gas
Sol
ar P
V,
1997
Wav
e en
ergy
,B
C H
ydro
Tida
l Bar
rage
Win
d, O
N
Win
d, C
da
Bio
mas
s
Cd
n $
pe
r k
Wh
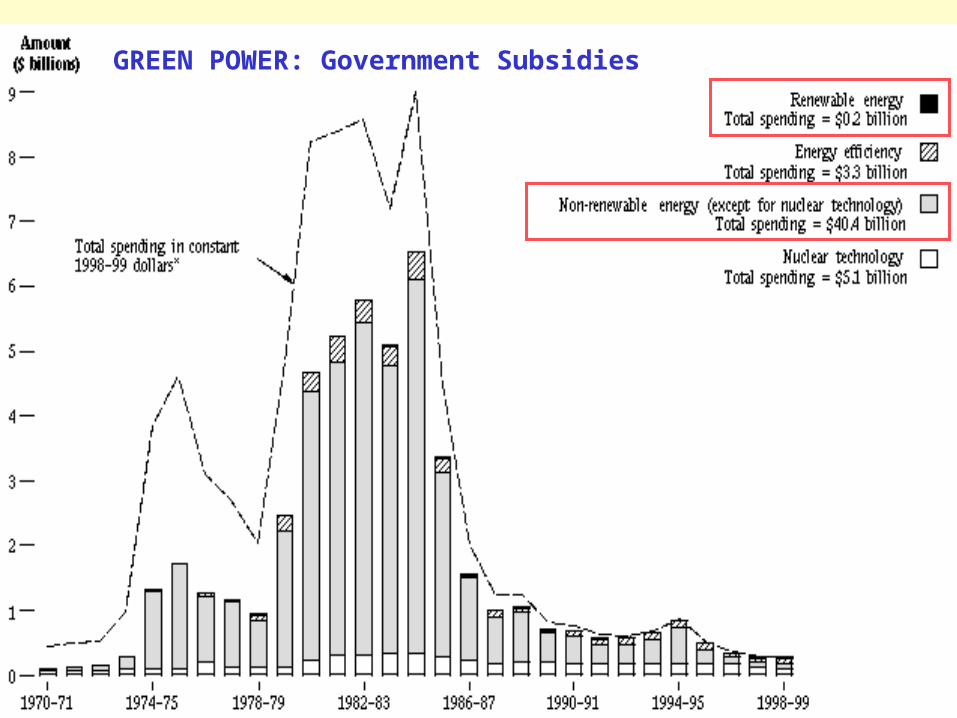
GREEN POWER: Government Subsidies
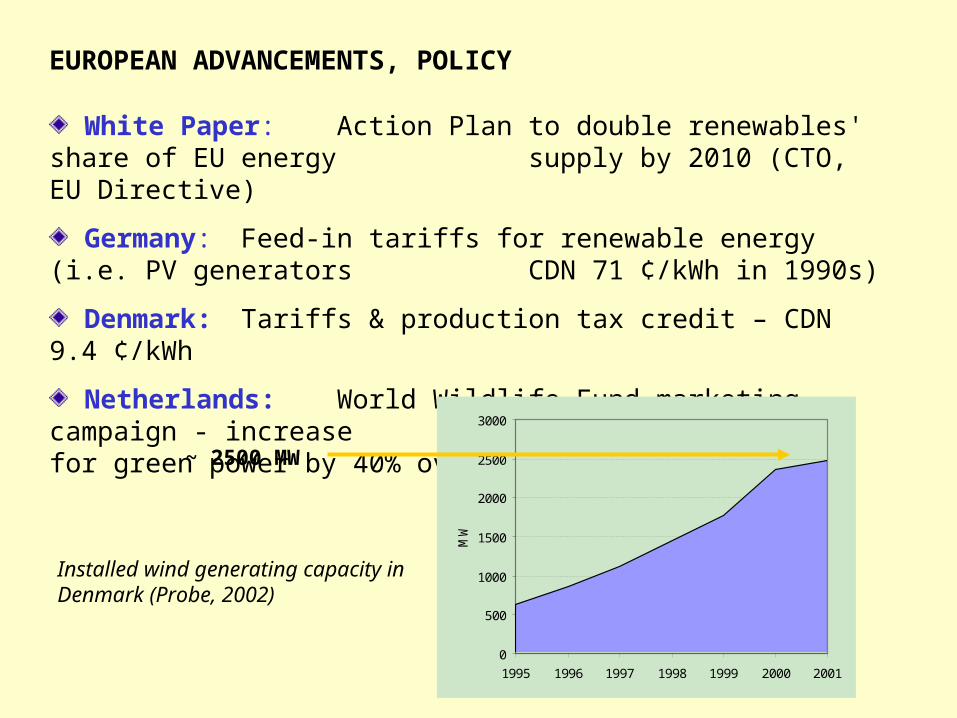
EUROPEAN ADVANCEMENTS, POLICY
White Paper: Action Plan to double renewables' share of EU energy supply by 2010 (CTO, EU Directive)
Germany: Feed-in tariffs for renewable energy (i.e. PV generators CDN 71 ¢/kWh in 1990s)
Denmark: Tariffs & production tax credit – CDN 9.4 ¢/kWh
Netherlands: World Wildlife Fund marketing campaign - increase customer base for green power by 40% over two years.
0
500
1000
1500
2000
2500
3000
1995 1996 1997 1998 1999 2000 2001
MW
Installed wind generating capacity in Denmark (Probe, 2002)
~ 2500 MW
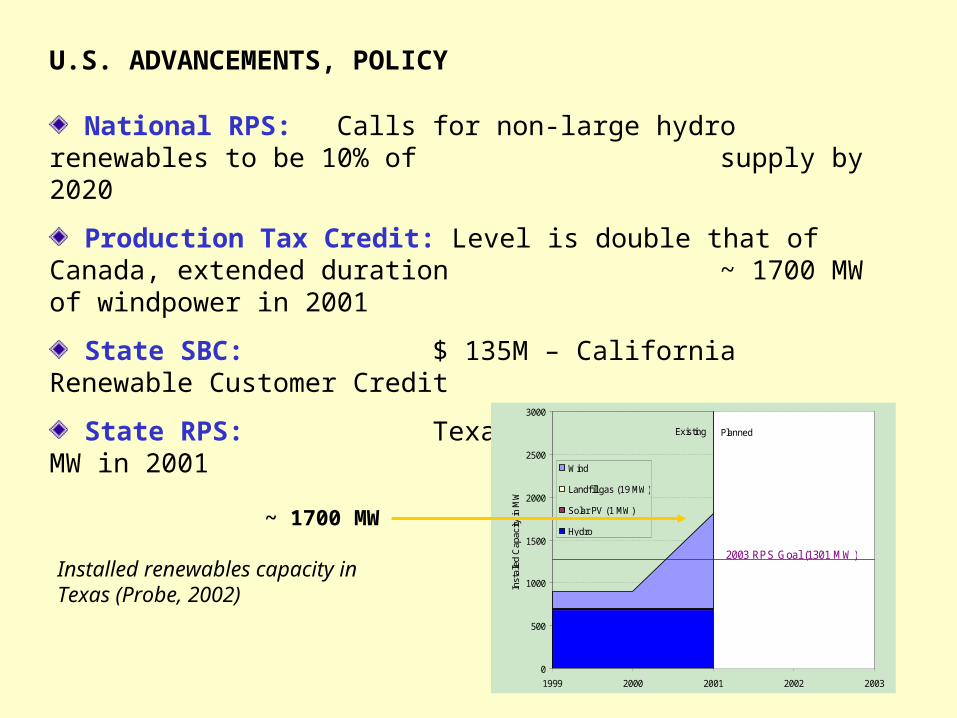
U.S. ADVANCEMENTS, POLICY
National RPS: Calls for non-large hydro renewables to be 10% of supply by 2020
Production Tax Credit: Level is double that of Canada, extended duration ~ 1700 MW of windpower in 2001
State SBC: $ 135M – California Renewable Customer Credit
State RPS: Texas – 400 MW by 2003; 951 MW in 2001
0
500
1000
1500
2000
2500
3000
1999 2000 2001 2002 2003
Inst
alle
d C
apac
ity in
MW
Wind
Landfill gas (19 MW)
Solar PV (1 MW)
Hydro
Planned
2003 RPS Goal (1301 MW)
Existing
Installed renewables capacity in Texas (Probe, 2002)
~ 1700 MW
CANADIAN ADVANCEMENTS, POLICY
Wind Power Production Tax Incentive:
$0.012 /kWh, declines per annum by $0.001, short time frame. Favours specific renewable technology.
Canadian Renewable and Conservation Expense (CRCE):
Influential; however designed to underwrite feasibility studies, resource audits for new projects.
Certification:
EcoLogo product label.
Federal Government Procurement:
20% of electricity from low and non-emitting sources; good example of demand-pull program however does not include other sectors
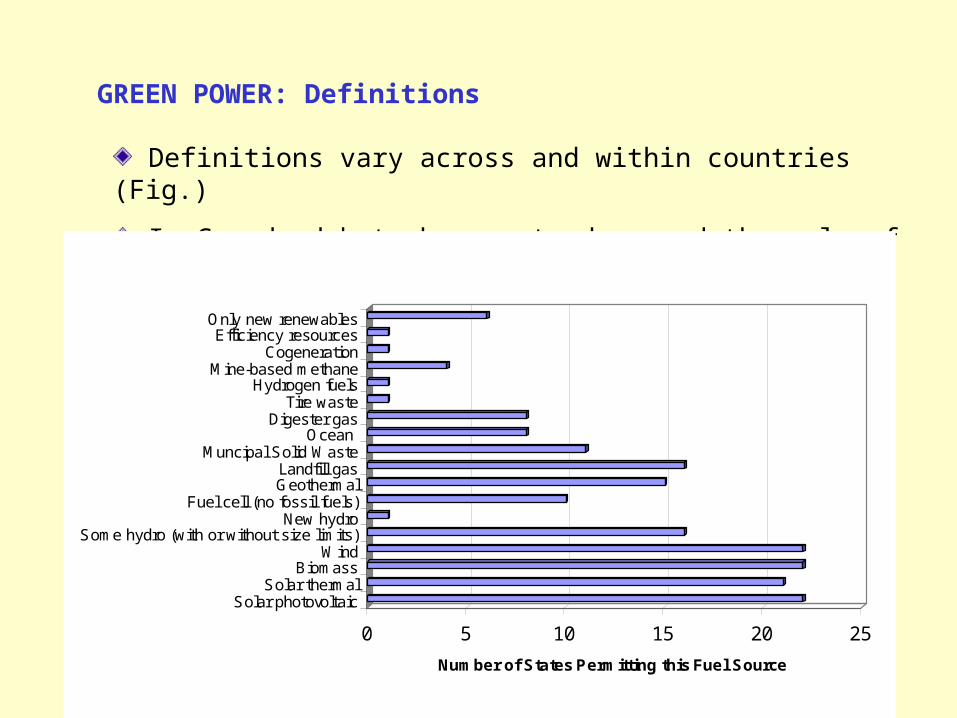
Definitions vary across and within countries (Fig.)
In Canada debate has centred around the role of hydro, biomass, biogas
0 5 10 15 20 25
Number of States Permitting this Fuel Source
Solar photovoltaicSolar thermal
BiomassWind
Some hydro (with or without size limits)New hydro
Fuel cell (no fossil fuels)GeothermalLandfill gas
Muncipal Solid WasteOcean
Digester gasTire waste
Hydrogen fuelsMine-based methane
CogenerationEfficiency resources
Only new renewables
GREEN POWER: Definitions