Embed Size (px)
Citation preview
GREEN SUPPLY CHAIN MANAGEMENT PRACTICES AND DETERMINANT FACTORS:
A QUANTITATIVE STUDY ON SMALL AND MEDIUM ENTERPRISES USING
STRUCTURAL EQUATION MODELING
A Dissertation
Submitted to the Graduate Faculty
of the
North Dakota State University
of Agricultural and Applied Science
By
Sardar Muhammad Zahid
In Partial Fulfillment of the Requirements
for the Degree of
DOCTOR OF PHILOSOPHY
Major Program:
Transportation and Logistics
August 2016
Fargo, North Dakota

North Dakota State University
Graduate School
Title
Green Supply Chain Management Practices and Determinant Factors: A
Quantitative Study on Small and Medium Enterprises Using Structural
Equation Modeling
By
Sardar Muhammad Zahid
The Supervisory Committee certifies that this disquisition complies with North Dakota State
University’s regulations and meets the accepted standards for the degree of
DOCTOR OF PHILOSOPHY
SUPERVISORY COMMITTEE:
Dr. Joseph Szmerekovsky
Chair
Dr. Chanchai Tangpong
Dr. Gina Aalgaard Kelly
Dr. Pan Lu
Approved:
Feb. 14, 2017 Denver Tolliver
Date Department Chair

iii
ABSTRACT
Considering the prominence of green supply chain management (GrSCM) research has
developed expressively in this field. However, there is a dearth of studies from emerging
economies comprised of modelling and empirical testing of hypotheses. Moreover, the literature
is lacking the empirical evidence on the determinants of GrSCM practices by small and medium
enterprises (SMEs) especially in the case of Pakistan. The literature has yet to determine what
green practices are being adopted by SMEs in Pakistan, an elucidation why GrSCM practices are
adhered, what construct is appropriate to evaluate adoption of GrSCM practices by SMEs in
Pakistan, and whether mediation of internal factors exits between the relationship of GrSCM
practices and external pressure.
This dissertation uses Structural Equation Modelling (SEM) to investigate GrSCM
practices adoption, the appropriate construct for evaluating green practices, and examining three
potentially important determinants in Pakistani SMEs. With the data collected in two stages from
the SMEs sector of Pakistan, exploratory factor analysis (EFA) revealed a three-dimension
structure for measuring the GrSCM practices. Subsequently, the confirmatory factor analysis
(CFA) was carried out on two measurement models (i.e. first and second order) of GrSCM
adoption based on EFA. The empirically outcomes advocates that both models for GrSCM
adoption are valid and reliable, however the second order model has better fit indices. The SEM
testing shows significant results for mediation of internal factors in the hypothesized relationship
among the GrSCM practices and external pressures. For academicians and supply chain mangers
these results yield several exciting theoretical and practical implications.
iv
ACKNOWLEDGMENTS
My deep sense of gratitude is owed to my advisor, Dr. Joseph Szmerekovsky for his
guidance, advice, and encouragement throughout the dissertation. Dr. Joseph is a thorough
professional and a gentleman who is always supportive, available for prompt feedback; In addition
to academic expertise, he brings high level of moral and ethical examples, which made me a better
and strong person. Indeed, without him this great academic journey would not have been possible.
Also, I would like to express my appreciation for the advice, time, and valuable input from
my committee members, Dr. Chanchai Tangpong, Dr. Gina Kelly, and Dr. Pan Lu. Additionally,
special thanks goes to Dr. Chanchai for his invaluable suggestion and guidance to improve the
quality of dissertation. I would like to thank Jody Bohn for her advice, tremendous
professionalism, and willingness to help during my stay at North Dakota State University.
Finally, the special thanks goes to my parents, relatives and my wife for their continuous
support, motivation, love, and patience. I especially like to pray and remember my great father
(late) who made it possible for me to pursue my dream. Lastly, I acknowledge COMSATS
Institute of Information Technology, Pakistan for granting me the scholarship.
v
TABLE OF CONTENTS
ABSTRACT ................................................................................................................................... iii
ACKNOWLEDGMENTS ............................................................................................................. iv
LIST OF TABLES ....................................................................................................................... viii
LIST OF FIGURES ....................................................................................................................... ix
CHAPTER 1. INTRODUCTION .................................................................................................. 1
1.1. Background ...................................................................................................................... 1
1.2. The Importance of GrSCM .............................................................................................. 4
1.3. The Importance of SMEs ................................................................................................. 7
1.4. SMEs and Pakistan ........................................................................................................... 9
1.5. Problem Discussion ........................................................................................................ 13
1.6. Purpose ........................................................................................................................... 16
1.7. Research Questions ........................................................................................................ 17
CHAPTER 2. LITERATURE REVIEW ..................................................................................... 18
2.1. Supply Chain Management ............................................................................................... 18
2.2. Green Supply Chain Management .................................................................................... 21
2.2.1. Motives for GrSCM .................................................................................................... 23
2.2.2. GrSCM during product life cycle ............................................................................... 25
2.3. Building a Green SC ......................................................................................................... 27
2.4. Summary ........................................................................................................................... 30
CHAPTER 3. ANALYRICAL FRAMEWORK AND DEVELOPMEMT OF RESEARCH
HYPOTHESIS .............................................................................................................................. 33
CHAPTER 4. RESEARCH METHODOLOGY ......................................................................... 39
4.1. Questionnaire Development and Data Collection .......................................................... 41
4.2. Factor Analysis and Displaying Data ............................................................................. 45
vi
4.3. Confirmatory Factor Analysis ........................................................................................ 46
4.4. Reliability Testing for Pretested Dimensions................................................................. 46
4.5. Structural Equation Modeling ........................................................................................ 46
CHAPTER 5. DATA ANALYSIS .............................................................................................. 48
5.1. Pilot Test ........................................................................................................................... 48
5.2. Exploratory Factor Analysis.............................................................................................. 50
5.3. Launching of Second Stage Data Collection..................................................................... 55
5.4. Operationalizing the Variables .......................................................................................... 58
5.5. Descriptive Statistics ......................................................................................................... 61
5.6. Confirmatory Factor Analysis ........................................................................................... 63
5.6.1. Testing first-order CFA model ................................................................................... 65
5.6.2. Testing second-order CFA model .............................................................................. 67
5.7. Factor Confirmation .......................................................................................................... 70
5.8. Multivariate Normality ...................................................................................................... 74
5.9. Multicollinearity ................................................................................................................ 74
5.10. Convergent Validity ........................................................................................................ 76
5.11. Discriminant Validity ...................................................................................................... 77
5.12. Modification Indices ....................................................................................................... 78
5.13. Hypothesis Testing .......................................................................................................... 78
5.13.1. Mediation .................................................................................................................. 80
5.14. Discussion of Results ...................................................................................................... 81
CHAPTER 6. CONCLUSIONS .................................................................................................. 86
6.1. Overview ........................................................................................................................... 86
6.2. Contributions ..................................................................................................................... 88
6.2.1. Theoretical Suggestions .............................................................................................. 89

vii
6.2.2. Measuring GrSCM as a Second Order Construct with Three First-Order
Dimensions ............................................................................................................................ 89
6.2.3. Managerial Suggestions .............................................................................................. 90
6.3. Limitations and Future Research Directions ..................................................................... 91
REFERENCES ............................................................................................................................. 94

viii
LIST OF TABLES
Table Page
1. SMEs clusters in Pakistan ......................................................................................................... 10
2. Critical green practices and determinant factors. ...................................................................... 44
3. Items of stage one survey .......................................................................................................... 49
4. Communalities .......................................................................................................................... 51
5. Rotated component matrix of factor analysis ............................................................................ 52
6. Factor loading, variance and Cronbach alpha for each factor .................................................. 54
7. Items included in second stage survey with pre-tested GrSCM dimensions ............................ 57
8. Reliability analysis .................................................................................................................... 60
9. Statistical summary of GrSCM practices .................................................................................. 62
10. Confirmatory factor analysis results ....................................................................................... 70
11. CFA results of determinate variables ...................................................................................... 72
12. Collinearity statistics ............................................................................................................... 75
13. Convergent validity ................................................................................................................. 76
14. Discriminant validity .............................................................................................................. 77
15. Results of direct paths in SEM................................................................................................ 83
16. Results of indirect paths in SEM ............................................................................................ 84

ix
LIST OF FIGURES
Figure Page
1. Provincial share in the SME sector ........................................................................................... 10
2. Extended supply chain ............................................................................................................. 20
3. Targets of SC environmental management………………………………………………….....22
4. Analytical framework ............................................................................................................... 34
5. Structural equation model of GrSCM and their determinant factors ........................................ 39
6. Summary of the methodology ................................................................................................... 40
7. Scree plot .................................................................................................................................. 53
8. Sample type ............................................................................................................................... 61
9. First Order factor measurement model of GrSCM practices .................................................... 65
10. Results of first order factor measurement model .................................................................... 66
11. Second order factor measurement model of GrSCM practices .............................................. 67
12. Results of second order factor measurement model ............................................................... 68
13. SEM model with reflective dimensions .................................................................................. 73
14. Revised theoretical model of GrSCM practices and their determinant factors ..................... 78
15. Result of the direct connection model ................................................................................... 79
16. Results of SEM (with reflective dimensions and indicators) ................................................. 81

1
CHAPTER 1. INTRODUCTION
This study focused on the issue of green supply chain management (GrSCM) practices
implementation and their determinant factors in Small and Medium Enterprises (SMEs) of
Pakistan. The overall purpose of this dissertation will be to explore the GrSCM practices adopted
by SMEs, and examine empirically the factors (internal and external) that drive the companies to
adopt the GrSCM practices. This chapter covers a brief introduction into the study. The growing
magnitude of the environmental apprehensions within the business world is presented in section
1.1. Then we will discuss the importance of SMEs and the role of SMEs in Pakistan economy in
section 1.4. In addition, we will also discuss the aim of the thesis, and why this thesis is needed in
section 1.5 followed by research questions in this chapter.
1.1. Background
Currently, the major global problem is environmental contamination. There are several
sources of environmental contamination and degradation, and a significant source is the release of
contaminated gases and hazardous operational activities from businesses. In order to reduce
environmental pollution, businesses need to integrate green concepts in their supply chains.
Moreover, the environmental trepidation has turned into a significant factor in manufacturing and
services industries around the globe. Consequently, the attention on GrSCM intensify significantly
between the companies around the world. As stated by Srivastava (2007), GrSCM is “integrating
environmental thinking into supply-chain management, including product design, material
sourcing and selection, manufacturing processes, delivery of the final product to the consumers
as well as end-of-life management of the product to its useful life”. Now days to be sustainable in
the global market, businesses are experiencing more pressure, to cut costs, to improve reputation
and to reduce supply time. By focusing on these goals, the factors influencing the environment
2
are ignored at many levels of the supply chain. Moreover, the irresponsibility and lack of
awareness contributes to the environmental degradation, so there is a need for responsiveness and
apprehension towards environmentally friendly manufacturing and services.
As stated by Rao (2002), the major chunk of manufacturing business of the world will be
shifted to Asia in near future, and there are many factors contributing to this shift. The current
situation is evident of the fact that most developed countries’ manufacturing companies shifted
their businesses to Asia to gain the advantages of cheap labor, energy costs, location benefits, and
to take advantage of fewer environmental regulations. Therefore, to compete globally the proactive
thinking and implementation of GrSCM practices is inevitable. With the increased level of
manufacturing activities, the GrSCM practices became more important than ever before.
Generally, in developing countries many environmental related actions are nonaggressive due to
economic insatiability and financial hurdles. Moreover, the financial and social gain realization
by companies from these practices are nonexistent in developing countries, that is why it is
inevitable to use commercial paybacks to achieve the proper implementation.
According to Bauman (2004) all industries regardless of sector are facing immense
pressure for innovation, efficiency, and integrated product development. The supply chain (SC)
optimization and development gained a lot of interest over time. Council of Supply Chain
Management Professionals, delineates SC management as: “Supply chain management
encompasses the planning and management of all activities involved in sourcing and procurement,
conversion, and all logistics management activities. Importantly, it also includes coordination and
collaboration with channel partners, which can be suppliers, intermediaries, third party service
providers, and customers. In essence, supply chain management integrates supply and demand
management within and across companies”. This has led to the transformation in companies from

3
the single-minded strategy of full scale growth to leveraging core competencies to look for reliable
suppliers to outsource as much as possible. Therefore, this shift of business operations increases
the significance of SC management, which is surrounded by an amplified amount of procurement
that is necessary for the process of product development, which results in new issues related to
environmental protection and degradation. All SC tiers need to move towards environmental
protection. The environmental demission has great capacity to influence organization performance
and market share. Therefore, the environmental dimension needs to be part of organization
strategy, together with performance related to cost reduction, quality, price and delivery-to-market.
In recent times, from the aspects of business management, and customers the inclusion of green
practices are growing with in companies globally.
Due to the global and domestic importance of the green concept, legislatures around the
world focused more on introducing regulations for businesses to protect the environment. The
regulations have been modified to fit the current needs of the environmental conservation and
remediation, exerting more pressure on enterprises to enhance environmental performance.
Different international rules and regulations, like ISO standards, also made companies
manufacturing processes and SC environmentally friendly. Though international laws and
regulations exist, the results are inconsistent among nations, especially between developed and
underdeveloped nations.
In recent times businesses are more conscious about the environment than ever before. As
mentioned by Sarkis (2003) and Shecterle and Senxian (2008), the environmental management
concept has already gained importance and acceptance by a majority of industries. Previously,
companies only tried to avoid operations that directly violated environmental regulations in order
to avoid bans and fines like meeting emission standards and waste management. However,
4
authorities have been continuously strengthening the rules over time, and the awareness of
different aspects of environmental protection and degradation have been key drivers pushing
everyone to focus on the environment. Walton, Handfield, & Melnyk (1998) argued that the
conceptual understanding and realized benefit of the environmental concept at the managerial
level has significantly changed the strategy of environmental performance and related actions for
many enterprises. The awareness drives a realization that every process within the supply chain
(external or internal) has the potential of breeding a negative impact on the environmental or social
spectrum, which requires true initiatives along the internal and external supply chain. Proactive
thinking leads to value creation by promising environmental engagements. As mentioned by Zhu,
Sarkis, & Lai (2007) there is an increasing requirement of GrSCM to take care of environmental
issues. Currently companies consider greening as a competitive edge rather than just for building
corporate image, that’s why applying the green concept with in any enterprise not only leads to
social but also financial gain. According to USEPA (2000) a significant amount of supply chain
managers still does not emphasize environmental concerns, despite knowing the many possible
monetary gains. The reason for not focusing on GrSCM is the invisibility of many advantages of
eco-friendly ingenuities. However, to start operations in environmentally friendly manners,
companies need some level of stability in terms of financial health.
1.2. The Importance of GrSCM
GrSCM is a concept that orbits around innovation in SC management to help in protecting,
and improving the environmental. A green SC is comprised of different activities to control
environmental distortion, these activities range from recycling and reuse to replacement of material
used in production of goods and services. SC management performance in the context of the
environment can be improved by a proper monitoring system. The process of GrSCM is all about

5
integrating eco-friendly thinking into traditional SC management and includes product and service
design, the process of manufacturing, material selection and resourcing, final product distribution
to its user and after the useful life the better management of the product. Hence there are many
practices considering the range of different purposes of GrSCM and its management were
practiced. The concept of GrSCM is a novel area of study, leading to a dearth of agreement in
practice about the green supply chain definition.
In the era of globalization when the end user has multiple options to pick products or
services, the behavior of the buyer is a critical factor for any organization to be successful
internationally. As buyers become more global they talk and think more about the environment,
how one can play a role in preserving nature. This puts pressure on companies to go green, leading
to performance improvements for suppliers in terms of the environment. It is now a more social
goal for companies rather than cost cutting, reducing risk and building public image. “Going
green” is the most commonly highlighted term used in business around the globe. In this era of
competition and globalization organizations around the world try to achieve greening in their
manufacturing and service operations. Until the early 1990s environmental deterioration was not
a concern for the manufacturing and service SC around the world .The greening of SC and the
adoption of GrSCM practices received focus by researchers as a result of oil catastrophes in the
early eighties with escalated air pollution threats to detrimental point (de Sousa Jabbour et al.,
2013; Q. H. Zhu, Tian, & Sarkis, 2012).
According to a study performed by Srivastava (2007), the revolution in SC in the early
1990s made businesses more environmentally conscious. GrSCM sustainability has materialized
as an imperative organizational philosophy to accomplish goals in terms of profits and market
share by decreasing environmental hazards, improving the ecological proficiency in the SC

6
partners of organizations (van Hoek, 2000). Multinational organizations have established
worldwide supply chains, in-order to take specific advantage of country related industries.
Therefore, this topic stands well-timed and indispensable to enhanced organizations understanding
of GrSCM practices, and for policy makers to take decision to exert more pressures.
With the increased level of integrated economies around the world, predominantly through
movement of capital, goods and services across the globe, and with significantly increased
environmental degradation awareness, protection and improvement, the concern for safeguarding
the earth’s ecological -resources and the trend to adopt greening in manufacturing and servicing
has remarkably increased over time, in result growing pressure on organizations in developing
countries to mend their processes in order to achieve environmental goals. As stated by Zhu and
Sarkis (2006), these pressures and globalization stimulate organizations to improve their
performance with respect to the environment. The concern for environmental protection by
organizations over the previous ten years is a trend (Sheu, Chou, & Hu, 2005). It is argued by
Sarkis and Tamarkin (2005) that globalization is a pressure excreting phenomena for organizations
to improve their environmental performances rather than localization. The reengineering of
corporations’ strategies is being derived from a gradual increase in environmental distress, which
become fragment of general corporate culture (Madu & Madu, 2002).
GrSCM has been termed differently at different times, according to Seuring (2004),
GrSCM is also known as environmental SC management (ESCM) and sustainable SC
management (SSCM). According to Sarkis & Tamarkin (2005), GrSCM pools different actions
from introducing green concept in materials management, purchasing, distribution,
manufacturing, reverse logistics and Marketing. Additionally, the goal of companies to adopt
GrSCM practices is to achieve environmental improvement and to also have financial benefits.
7
The scope of GrSCM practices is not limited, as argued by Zhu and Sarkis (2004), it comprehend
the management of both external and internal environment, design of product and services, and
investment recovery.
The aim of this study can be summarized as follows: 1. What are green practices adopted
by SMEs of Pakistan in response to green issue; 2. What are the major foreign, and domestic
pressures (external) affecting GrSCM practices adopted by the SMEs in Pakistan; 3. The major
internal factors affecting GrSCM practices adopted by the SMEs in Pakistan; 3. Is there any
mediating role of internal factors in relationship of external pressures and GrSCM practices
adoption. According to Rao (2002) GrSCM is starting to get a strong position in many world
leading companies but it has not fully spread to small and medium manufacturing and service
industries. GrSCM is receiving acceptance and admiration in the Asian region, but immense work
and improvement is still needed, as many practices are hindered for various reasons which need to
be explored to make environmentally friendly production and services. That is why the
inevitability of guidance, direction and most importantly proofs of economic and social benefits
are significant for adoption of the green concept.
1.3. The Importance of SMEs
As globalization is a major factor these days which has a direct impact on the economic
situation of every country with an increased level of acceptance of liberal ideologies driving global
economies to be integrated and inter-dependent, including trade liberalization and the World
Trade Organization (WTO) efforts to make free markets, and with progression in communication
technology, transportation and infrastructure, globalization has transformed the market
competition in a new way both in developed and underdeveloped countries. According to Piore
(1984) in the mid-1960s and 70s, SMEs startups had an immense effect on industrial clusters by
8
increasing the level of production and export capacity. In the late 80s large scale firms introduced
more sophisticated technologies to operationalize the concept of mass production and cut costs.
Therefore, SMEs at that time were under a lot of pressure to compete in the global market. Despite
this pressure a SMEs continued there substantial contribution to the economic development of
countries, in Latin America (Peres & Stumpo, 2000), Asia (CFR, 1998), and Europe (Lukács,
2005). According to Bianchi and Winch (2006) ; moreover they have a 90 percent share in the
total number of firms, 40 to 70 percent of employment and an almost 30 to 60 percent share in
gross domestic products (GDP).
According to Cowling and Sugden (1999) the foremost cause of countries having
aggressive SME participation is to stimulate domestic development by a collective network of actions
and most importantly SMEs bring together a greater number of individuals, who take up economic
responsibility and values more as core competencies and this type of planning is key for an effective
and efficient society (Cooke & Wills, 1999). It is largely believed that the flexibility of SMEs
compared to large scale manufacturing companies is superior due to the fact that they are less likely
to be effected by macroeconomic turmoil. According to Lages and Montgomery (2004) SMEs play
a vital role in supporting markets during recessions, when domestic growth shrinks at large.
Globally the definition of SMEs varies and there is no consensus on one definition as some
deliberate the classification on the number of employees (Lages & Montgomery, 2004), while some
take into account financial resources to classify the SMEs (Goldberg & Jonsson, 2009). SMEs are
independent companies and the number of employees and financial resources classification varies
across the globe. According to the European Union classification SMEs should have < 250
workforce, whereas the US cataloguing requires < 500 workforce, in short, the classification is a
domestic phenomenon that is being determined by many countries differently.
9
1.4. SMEs and Pakistan
Historically in Pakistan many different classifications have been used for firm size by
chambers of commerce and industry, banks, State Bank of Pakistan (SBP), and security and
exchange commission of Pakistan (SECP), etc. In recent times a widely accepted definition for
SMEs by the Small and Medium Enterprise Development Authority (SMEDA) was developed,
this definition is provided in National SME policy 2007, “The policy defines a manufacturing
concern with less than 50 full-time employees and productive assets of Rs30 million, a service
provider with less than 50 workers and productive assets of Rs20 million and a trader with less
than 20 employees and productive assets of Rs20 million as small enterprise” and “a
manufacturing unit with 51-250 employees and productive assets worth Rs30-100 million, a
service provider with 51-250 workers and productive assets of Rs20-50 million and a trader with
21-50 employees and productive assets of Rs20-50 million falls in the category of medium
enterprise”. SMEs in Pakistan comprises of different clusters as shown in table 1 below but not
limited.

10
Table 1
SMEs clusters in Pakistan
SMEs Sectors
Fisheries Sports goods
Livestock and Dairy Household
Gems and Jewelry Textile
Horticulture and Agriculture Handicrafts
Leatherwear Marble and Ceramics
According to SMEDA, the estimated number of SMEs in Pakistan is 3.2 million and they
have quite a large share in the export of the country estimated around 40 % of total exports from
Pakistan. SMEs have a very significant role in the Pakistan economy and are spread all over the
country.
(Tribune, 2014)
Figure 1. Provincial share in the SME sector
11
The share of SMEs in different regions of Pakistan is shown in Figure 1, the Punjab
province has the largest share with 65.4% and Baluchistan has the smallest share with 2.3% of the
total SMEs in Pakistan. The important observation regarding export percentage as compared to
neighboring countries such as Pakistan and Pakistan is very interesting, Pakistan’s SME sector is
contributing 30% to Pakistan’s total exports while Pakistan’s contributes 68 % and Pakistan’s
contributes more than 40 %. According to SMEDA many factors cause problems for SMEs these
include technology up-grades, finance, employee training, lack of market information and
regulatory hurdles. Many SMEs lost their exports, due to unawareness of international
environmental regulations for example international environmental standards ISO 14000
certificates, as a result many international companies suspended their dealings with many of
Pakistan’s SMEs. Moreover, other laws such as child labor also had a major impact on SMEs
business. Now SMEs have realized that without taking major environmental action in their
operations they cannot compete in the market.
In Asia, the importance of SMEs cannot be ignored as they are critical factor in
advancement of newly industrialized countries, they have been very helpful in generating
employment, equal distribution of economic resources to the lower end of society to reduce
poverty, contributing in export growth and most importantly contributing to development of
entrepreneurship not only in urban areas but also in rural areas. The importance of SMEs cannot
be ignored by any country as they are spread throughout rural and urban areas.
The SMEs in Pakistan are mostly engaged in production of consumer products; for
example, leatherwear, sports goods, household goods, clothing, handicrafts, furniture and goods
related to agriculture. The SMEs are considered as the back bone of the Pakistan economic
structure. Rural areas of Pakistan mostly have small and medium companies with a large amount
12
of land, the urban areas also follow the same pattern accept the amount of land occupied by these
companies is smaller. Overall the Pakistan industrial landscape consists of large, small, medium,
and cottage industries. Early in the 1990s it was apparent that SMEs plays important part in the
development of newly industrialized countries of Asia due to their flexibility. Meanwhile Pakistan
also realized the importance and recognized the international trend that economic stability and
development lies in strengthening a countries SME sector. In order to formalize, and centralize the
affairs related to SMEs, Pakistan established SMEDA in 1998. This authority has been assigned
broad and multi-pronged obligations. SMEDA is the apex body for SMEs in Pakistan and has
enough power and leverage to play its role for the development of both public and private sectors,
and to address diverse issues related to SMEs.
SMEDA continuously engages in examining worldwide developments, national rules and
policies, and other macro and micro factors effecting SMEs in Pakistan, so that appropriate steps
and guidance may be provided to create a conducive and favorable business environment. It has
very strong interactions with all most all industrial sectors including Surgical, Fisheries, Textiles,
Leather, Marble & Granite, Gems & Jewelry, Furniture, Light Engineering and others, in-order
to identify problems and help SMEs implementing different business strategies. One of the very
important roles played by SMEDA is to help in creating networks and match-making openings
between related stakeholders (SME development report, 2010-11).
For developing countries like Pakistan, there is a scarcity of multinational or big enterprises
to support the economy and industrial development, the SME sector plays a vital role in industrial
development. According to a report of SMEDA approximately 90 percent of the enterprises in
Pakistan fall under the category of SMEs, and have an employment share of almost 80 percent of
non-agricultural labor in the country. They also claim that in GDP the participation of SMEs is
13
approximately 40 percent. However, SMEs face a lot of problems due to inherent characteristics,
and the problems include technical upgrades, marketing, financing and human resource
development. SMEs are one of the burning topics in underdeveloped counties, and how the rapid
growth of SMEs effects the ecological landscape of the countries. It is true that in underdeveloped
countries laws related to the environment are weak and their implementation is almost non-
existent, which plays a significant role in environmental degradation. Therefore, many stake
holders such as importers, the community, and end users pressurize the companies significantly to
adhere to green regulations and feel responsible for the environment.
1.5. Problem Discussion
Currently to gain competitive advantage companies modifying their business strategies and
greening their operations. Moreover, focusing more on outsourcing and strengthening their supply
chains. With the inclusion of too many players and an increased level of activity companies must
be aware of external and internal aspects that have potential to affect their business and their
competitiveness.
Environmental problems, buying behavior, and social change processes bring new
challenges for established businesses (Hutchinson & Quintas, 2008). It is believed that the
environmental degradation is mostly a result of manufacturing and logistics activities such as
depleting natural resources, ecological disruption, and waste (Fiksel, 1996). Therefore, many green
practices are adopted by companies to protect the environment such as recycling, waste reduction,
reuse of materials, and green transportation. Moreover, companies are now also focusing on green
procurement. The highest pressure falls upon the green procurement, which has been the most
neglected green practice (Green, Morton, & New, 1998) . According to Rao (2004), the literature
predicts that the major chunk of manufacturing activities of the world will be shifted to Asia, the
14
SMEs will be major stakeholders of this manufacturing as sub-contractors of large companies. The
aim of this study is to explore the GrSCM practices and their determinants in the SMEs of Pakistan.
Since 2000 the literature on GrSCM has grown significantly, but there is a dearth of studies
explaining determinants of green practices, and the role of external pressures as foreign and
domestic, internal factors, and study the mediating role of internal in hypothesized relationship. .
The involvement of SMEs in green practices is usually carried out in the role of a business
partner, such as a supplier or distributor (R. Mohanty & A. Prakash, 2013). In previous literature
many researchers strived to explain and give a definition of GrSCM, famous among these are
Srivastava (2007) , Vachon (2007) and Kuei and Lu (2013). However, there are few studies in
developing countries especially in new emerging economies. The empirical confirmation is very
limited on the determinants of GrSCM, the evidence which is present in the literature mostly comes
from developed countries, in particular the United States of America and Australia (Wu, Dunn, &
Forman, 2012). Moreover the evidence from emerging economies is very limited ((Varma,
Wadhwa, & Deshmukh, 2006);(R. Mohanty & A. Prakash, 2013)), and almost non-existent in
Pakistan. Another trend that is very common in all literature of GrSCM is that most of the
researchers studied large companies, however there is little research carried out on small
companies (Sarkis,(1999); Rao (2007); Zhu, Geng, Fujita, & Hashimoto (2010); Mohanty and
Prakash (2013). The Majority of research concludes that GrSCM is an instrument for long-term
development of green supply chains. According to our knowledge few researchers found external
pressure to be a significant cause for adoption of GrSCM practices, those that did include Liu,
Yang et al. (2012) and Zhu, Sarkis, & Lai (2008). A study by Mohanty and Prakash (2013) on
micro, small and medium enterprises found external pressure as a significant driver for green
practices. Similarly, internal factors were found significant by Zhu, et al. (2008), Liu, et al.
15
(2012), and Mohanty and Prakash (2013). The demographic aspect has been under study by a lot
of researchers, however studies classifying companies based on nature of business and size of
assets have only been carried out by Rao (2007) and Mohanty and Prakash (2013).
There is a dearth of studies from emerging economies that are comprised of modelling and
empirical testing of hypotheses and there has been no such study on the SMEs sector of Pakistan
on determining forces to adopt green practices, therefore inorder to fill this gap and increase
literature related to developing countries, particularly related to small and medium enterprises of
Pakistan. This will be a very important contribution as many Pakistani companies are recognized
as world class and major exporters of agricultural, leather, sports, and textile products. The
suppliers of these large companies are usually fall under the category SMEs, when they initiate
greening processes they have direct impact on operations of SMEs (R. Mohanty & A. Prakash,
2013). The SMEs are playing pivotal part in Pakistan’s socio-economic development. According
to Shaikh, Shafiq, & Shah (2011), SMEs in the rural area of Sindh Pakistan contribute 45 % of
the total export of the province. However, they are also considered a major contributor of
environmental degradation, the compliance rate of SMEs to the rules and regulation are considered
very low as compared to large companies where command and control systems are organized and
monitoring is strict. Therefore, a proper check and balance system for SMEs related to
environmental protection is important. The negligence of environmental considerations by SMEs
may be a result of many factors such as absence of awareness, dearth of financial resources, and
absence of empirical evidence of the benefits related to the greening of activities. Mostly SMEs in
Pakistan are non-ISO certified but the trend of obtaining ISO certification is growing as SMEs
realize that when exporting, to enhance their image and to be a partner of large companies, they
need to take greening measures. The SMEs that exist as suppliers or suppliers of the suppliers need
16
to be green in-order to make the production process completely environmentally friendly. Pakistan
considers SMEs as a back bone of its economy but they are less inclined to greening their
operations. Consequently, the broad determination of this dissertation will be to probe the Pakistani
SMEs conforming to different green activities. It is also pertinent to judge the GrSCM practices
by their effectiveness in delivering ecological assurance and also meeting the expectation of
stakeholders.
1.6. Purpose
Considering the prominence of GrSCM practices and the drivers which are compelling
organizations to adopt green practices, specifically in developing countries like Pakistan, to our
knowledge there is lack of investigation on SMEs of Pakistan. This subject requires further
attention and investigation to help managers in the area to be able to make robust decisions based
on empirical evidence. In-order to encourage small and medium businesses in underdeveloped
countries, especially in Pakistan, it is significantly imperative to understand and comprehend the
driving forces for companies to adopt green initiatives. Moreover, empirical evidence will help
companies to recognize the prominence of green practices and how to develop a competitive
advantage to benefit their business by adopting green practices. As highlighted in the preceding
section the largely this dissertation will explore and gage the determinants of the GrSCM
implementation, and to determine the mediating effect of internal factors in a relationship of
external pressures with GrSCM practices, and to understand the managerial implications. More
specifically, we will explore the relationship between major international and domestic external
pressure on GrSCM practices in the SMEs sector of Pakistan, and will also explore and test the
relationship of internal factors to GrSCM practices. Moreover, we will also look for the mediating
effect of internal factors on GrSCM.
17
There is no specific study available on Pakistan. Thus, this dissertation will be a significant
contribution to the literature associated to GrSCM practices and the effect of external pressures
and internal factors in the SMEs sector of Pakistan. The dissertation will help SMEs with scarce
knowledge of GrSCM practices affected by external pressures and internal factors. Moreover, it
will play a useful role for government, regulatory establishments, and eco-consultants to build up
the advice, strategies, and progress towards ecologically sustainable industrial development in
Pakistan.
1.7. Research Questions
The objective of this dissertation is to probe the GrSCM practices and examine empirically
the external pressures and internal factors that motivate the adoption of these practices in the SMEs
sector of Pakistan. There are four main questions to be answered regarding GrSCM practices and
their determinants in the SMEs sector:
1. What are the GrSCM practices adopted by the SMEs in Pakistan in reaction to the greening
problem.
2. What are the most important external pressures affecting GrSCM practices in the SMEs sector
of Pakistan?
3. What are the major internal factors affecting GrSCM practices?
4. Is there any mediation by internal factors in a relationship of companies’ external
(Foreign and domestic) pressure and adoption of GrSCM practices.

18
CHAPTER 2. LITERATURE REVIEW
This section includes brief review of the past work done in the field GrSCM practices. We
will briefly discuss the SC management, motives for the GrSCM, GrSCM and product life cycle,
and building an environment friendly supply chain. This section concluded with present standing
of research and identifying research gaps some of which will be filled by this research.
2.1. Supply Chain Management
In the era of extreme competition, the integration among the suppliers and clients plays
vital part in the progress of companies. Often companies try to cut costs, increase efficiency and
transfer savings to customers. In-order to take full advantage of suppliers, companies need a
formalized process known as a SC. Initially the concept of SC appeared aimed at managing the
supply of raw materials, as the early focus was on management of inventories, specifically raw
materials but later on due to its competitive importance it started growing from supplier to end-
users and adding more diversity and complexity. Mentzer et al (2001), define SC as: "A set of three
or more entities (organizations or individuals) directly involved in the upstream and downstream
flows of products, services, finances, and/or information from a source to a customer". The SC is
present at all times in business, its management requires great determination due to its complexity
(Mentzer et al., 2001). SC management consists of many integrated and formalized activities, the
activities consist of procuring raw materials, manufacturing, assembling, inventory control, order
taking, distribution and logistics, and supply to the final customer (Markovits-Somogyi, Nagy, &
Török, 2009).
In the beginning the SC was introduced to bring together vital business processes aimed at
adding value for buyers. In modern days the supply chain has been modified significantly for
different strategies of manufacturing and distributions companies (Wallerius & Zakrisson, 2010).
19
Now a day’s companies are keeping their core competencies with in organizations and outsourcing
almost all other processes, which ultimately raises the demand for SC management in the
companies. The SC management is defined by council of supply chain management professionals
as "Supply chain management encompasses the planning and management of all activities involved
in sourcing and procurement, conversion, and all logistics management activities. Importantly, it
also includes coordination and collaboration with channel partners, which can be suppliers,
intermediaries, third party service providers, and customers. In essence, supply chain management
integrates supply and demand management within and across companies”.
The SC has been segregated into three distinct categories, a. Traditional SC, and b. The
extended SC, and c. The ultimate SC. The traditional SC explained by Mentzer, et al., (2001), the
two way movement between supplier, manufacturer and customer. Traditionally it is based on
operational cooperation between supplier and customer in-order to complete the required demand
for the product. The demand from the customer is communicated through the reverse supply chain
that leads to product manufacturing or order fulfillment from the warehouse to the desired
customer.
Beamon (1999) define the extended SC as one which considers green practices in its
processes from manufacturing to procuring of raw material; and disposal. However Mentzer, et
al.(2001) defines the extended SC as one in which there is two way (up/down) movement of
information, products and finances between instant supplier of supplier and instant customers of
customer (see. Fig 2).

20
Figure 2. Extended supply chain
Similarly, Mentzer et al, (2001) argued that the ultimate SC is one in which all
organizational processes from final supplier to final customer stream both directions (up/down).
The organizations that have adopted SC management have shown significant enhancements in
operational efficiency, resulting in huge cost savings (Stadtler, 2007). The concept of lean
manufacturing together with supply chain management helped in achieving the goal of waste
management which leads to environmental improvement. On the other side of the picture when
companies are calculating the benefits of a traditional accounting system it ignores the cost that
companies are generating in terms of environmental degradation. In-order to keep track of the
environment and reduce pollution there is a need for more extended supply chains known as green
supply chains to accomplish the goal of environmental protection.
Suppliers
Supplier
Supplier
Organization
Customer Customers
Customer
Extended Supply Chain (Mentzer et al, 2001)
21
2.2. Green Supply Chain Management
As stated by Srivastava (2007), environmental concerns are missing in the traditional SC
as companies were focusing on cost reduction techniques and methods and ignoring the issues
regarding the environment. To address the issue of the environment the old-fashioned SC was
remodeled by researches and companies to include the environmental dimension. With the
integration of markets and globalization the pressures on companies from the external and internal
environments significantly increased to follow green SC practices (Q. H. Zhu et al., 2008). As a
result of pressure exerted from different sources the curiosity to adopt and implement the needed
practices rose over time. GrSCM is described as “integrating environmental thinking into supply-
chain management, including product design, material sourcing and selection, manufacturing
processes, delivery of the final product to the consumers as well as end-of-life management of the
product its useful life” (Srivastava, 2007). GrSCM helps in reducing air, water and land
contamination by continuous improvement of manufacturing processes (Johansson & Winroth,
2009). Green production is a complex phenomenon, comprised of many challenges such as
satisfying customer demand for environmentally friendly products, considering environmental
factors while purchasing raw materials and increasing efficiency (Richards, 1994). According
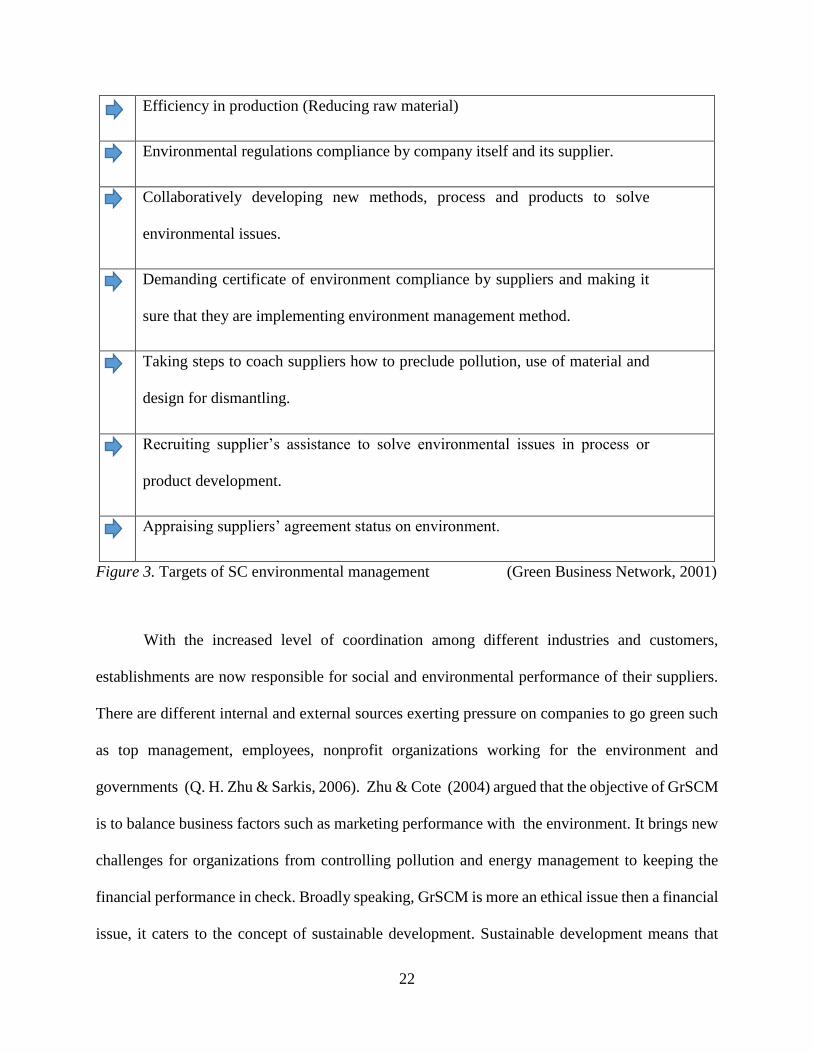
Network (2001), GrSCM includes multiple tactics to engage suppliers and customers to achieve
environmental performance see Figure 3.
22
Efficiency in production (Reducing raw material)
Environmental regulations compliance by company itself and its supplier.
Collaboratively developing new methods, process and products to solve
environmental issues.
Demanding certificate of environment compliance by suppliers and making it
sure that they are implementing environment management method.
Taking steps to coach suppliers how to preclude pollution, use of material and
design for dismantling.
Recruiting supplier’s assistance to solve environmental issues in process or
product development.
Appraising suppliers’ agreement status on environment.
Figure 3. Targets of SC environmental management (Green Business Network, 2001)
With the increased level of coordination among different industries and customers,
establishments are now responsible for social and environmental performance of their suppliers.
There are different internal and external sources exerting pressure on companies to go green such
as top management, employees, nonprofit organizations working for the environment and
governments (Q. H. Zhu & Sarkis, 2006). Zhu & Cote (2004) argued that the objective of GrSCM
is to balance business factors such as marketing performance with the environment. It brings new
challenges for organizations from controlling pollution and energy management to keeping the
financial performance in check. Broadly speaking, GrSCM is more an ethical issue then a financial
issue, it caters to the concept of sustainable development. Sustainable development means that

23
financial objectives are achieved along with social and environmental objectives. This concept
also branded as the triple bottom line and it is considered as an important feature of GrSCM.
The Triple bottom line framework includes ecological, social and financial dimensions for
sustainable development, these are also known as the three pillars of sustainable growth (see Fig
4). Traditionally the bottom line for companies is profit, whereas the environment and social
aspects were never under discussion. The triple bottom line brings two more bottom lines such as
environmental protection/improvement and social aspects of businesses (Elkington, 1999). Now
corporate performance not only means the benefits a company generates for shareholders but it
accounts for all stakeholders either direct or indirect. Broadly, sustainable development understood
as phenomena of growth that doesn’t compromise the future generations’ need in the process of
meeting today’s needs and considering the environment as a major aspect in economic and policy
development (Brundtland, 1987). Accordingly, research on sustainable development includes
biological sustainability, viable resource use which doesn’t harm the environment, proper waste
management and sustainable social development.
In developed regions of the world the environmental concerns derive from depletion of
natural resources and the hazardous emissions from large production activities, and their threats to
the global and domestic environments. Similarly, in developing economies, where population and
economic growth are expected to be very high in the future, there is a need to reevaluate
companies’ development approaches within the parameters of environmental regulations.
2.2.1. Motives for GrSCM
In the 21th century companies were more focused on vertical integration (forward and
backward), therefore manufacturers have motives to own suppliers and distributors in order to cut
the manufacture cost, distribution cost, and to achieve greater efficiency. But this trend can no
24
longer be considered as a sustainable strategy, so companies shifted to a new strategy of
outsourcing and they tend to depend more on the suppliers for enhancing quality, achieving
efficiency, competitive pricing and reducing product time to market. Therefore, the heavily
interdependent industries emerged globally, therefore the environment of suppliers can
significantly affect overall performance of company. According to USEPA (2000) few
organizations significantly increase their profit margins and build their environmental protection
profiles by working together with suppliers to reduce precarious material and to reduce
unnecessary packaging.
The driving forces which leads companies to go for greening of SC are heterogeneous for
example, building brand image, compliance management, reducing risk to the environment, and
government regulations. Some companies may adopt green practice in-order to build their image
as environmentally responsible corporations. Drumwright (1994), argues that in addition to some
organizations who practice the inbound greening in line with social responsibility, there are many
who do so to gain a competitive edge and increase their efficiency. In the literature the motives are
divided into internal and external, the major motives are customer pressure, boosting brand image,
regulatory stance, risk management, and international purchasing restrictions (Network, 2001).
According to Schecterle & Senxian (2008), the motives behind environmental initiatives in SC are
the rising cost of energy, desire to be a leader in green implementation, to gain competitive
advantage, government compliance, and cost related to transportation.
One of the key causes for businesses to green their SC is customer pressure. Min & Galle
(1997), argued that the consumer awareness about environmental problems significantly increased
due to rapid environmental degradation. Therefore, introduction of environmental friendly
products in developed countries increased significantly. Where as in South Asia the phenomena is
25
still not wide spread (Rao, 2007). Additionally, companies in South Asia do business with different
companies in Europe and the United States. The manufacturing process is carried out in the region
and exported and marketed to internal markets across Europe and United States (Rao, 2007).
Therefore, to avoid the potential export limitation they need to comply with environmental
regulations both domestic and international, hence entire SC needs to be green. Hence the
companies in the region not only adopt green practices to increase efficiency but to avoid any
potential export limitations. Therefore, supplier encouragement is necessary, in addition to
adoption of green practices by companies to green their operations.
2.2.2. GrSCM during product life cycle
For the manufacturers the green SC is an operative way of managing the environmental
plans (Yingluo, Nengmin, & Linyan, 2003). Product life cycle (PLC) is a fundamental method of
assessing the impact on environment. It comprised of all events over the time from an items
development through its end-of-life. The PLC valuation is a comprehensive method to trace out
the degradation in ecological system and resources needed to develop a product or procedure from
supplies to disposal of product. Basic principle of GrSCM is to integrate the green concept into
the PLC. The GrSCM can be classified into three groups, green design, green operations, and green
manufacturing (Srivastava, 2007).
The green design concept can conceptualize as an eco-friendly design process for total
PLC. According to Srivastava (2007), the major objective of green design is to reduce waste. Navtn
Chandra (1994), argued that the green design helps in understanding how decisions effect
production of environment-friendly products. Most of the time the environmental aspects in
designing product and processes are ignored. There is a negligence of the environmental aspect
in development of new products (Hendrickson, Conway-Schempf, Lave, & McMichael, 1997). At
26
present, most companies believe that green design helps in cost reduction of the whole production
process (Johansson & Winroth, 2009). The environmental burden can be condensed significantly
by implementation of green design. According to Hendrickson et al. (1997), the green design
objective is to ensure a sustainable society by using available resources. They also highlighted the
three major goals to achieve ultimate green design these goals are, shrinking the use of non-
renewable means, management of renewable resources for sustainability, and controlling toxic
emission that can affect the environment.
Green manufacturing can be defined as a manufacturing process, which generates very
little or no environmental pollution, by using environmentally friendly inputs, and is highly
efficient (Atlas & Florida, 1998). The aim of green manufacturing is continuous improvement of
product and manufacturing processes to reduce or eliminate land, water, and air pollution
(Johansson & Winroth, 2009). They also argued that the environmental risk to human and other
species can be reduced significantly by adopting green manufacturing. The production efficiency
and energy cost, the cost efficiency of raw material, and the occupational safety and environmental
cost efficiency can be achieved by adopting green manufacturing (Atlas & Florida, 1998).
Green procurement plays an important role in achieving overall environmental objectives.
It integrates environmental thinking into purchasing decisions. Green procurement includes
recycling, reduction, and reuse of material in the course of procuring (Salam, 2008). The
purchasing of material or services that protect the environment and put a lesser amount of
hazardous effect on the environment throughout the PLC is known as green procurement
(Lacroix, 2008). Lacroix (2008), also suggested some elements of green procurement such as
purchasing of non-ozone diminishing materials, using substitute energies, energy proficient
transportation, bio-based products, and recycled content products. Never the less, these elements

27
play a significant role in purchasing environmentally friendly products, but the major role in green
purchasing is played by the supplier selection process. The green manufacturing process actually
derived from green inputs and minor changes leading to substantial environmental improvement.
According to Srivastava (2007), the important part of green operations is green manufacturing and
remanufacturing. Hoshino, Yura, & Hitomi, (1995) defined a recycling-integrated manufacturing,
and it is commonly used by automobiles, tiers, and electronics industries. It is very important to
control pollution at the source rather than managing it later (Srivastava, 2007).
2.3. Building a Green SC
For creating green SC there is no utter rule, but there are numerous recommendations from
different authors to perform green actions that can best fit to prevailing practices. As mentioned
by Zhu, et al. (2007), prominence of different actions differs depending on companies’
characteristics and nature of the SC. Agreeing to Rao & Holt (2005), SC greening can be divided
into internal supply chain (manufacturing), outbound, inbound and reverse logistics. Thus,
contingent on the type and characteristics of companies SC management, different SC fragments
deliberate dissimilar actions. Likewise Zhu, et al. (2007), divided GrSCM into five practices:
green purchasing, managing internal environment, cooperation with customer, recover the
investment , and environment friendly design. These practices are hard to decompose, and they are
highly integrative, having strong cross functional connectivity, and some kind of overlapping.
According Zhu et al. (2007), export of products and cooperation with foreign customers brings
pressure to domestic industry , and increase the level of implementation.
The association with international supply chain enhanced knowledge, awareness and
understanding of GrSCM practices. Therefore, adoption of GrSCM in manufacturing companies
could improve and make their operations green along with cost reduction with this knowledge.
28
Brody & Ben-Hamida (2008), argued that inbound logistics incorporates the choosing of green
suppliers and collaborating with them. Inbound logistics includes activities such as, relationships
with suppliers and transportation of material to the process. According to Rao & Holt (2005) the
choosing of a supplier is a very significant factor, as it shows companies own total environmental
performance and overall impact. Transportation of material to the manufacturing facility can have
a significant effect on the environment, one of the most important strategies these days to eliminate
pollution and waste is to control it at the source.
The internal SC considered as vital area for ecological improvements. It is essential for
companies to gauge green performance in order to incorporate necessary modifications. The
internal supply chain can incorporate many initiatives for the environment such as improvement
of assembly, source reduction of waste, pollution and air emission, cleaner production, worker
involvement, and supplier integration (Rao, 2007).
Product design is considered a vital feature that can affects processes. Designing of product
plays a significant role in achieving environmental objectives (Network, 2001). According to Rao
& Holt (2005), production efficiency, and the environment objective can be achieved by lean
production, reducing all kinds of waste with production related operations. The managing of waste
considered as most significant aspect of green management (Beamon, 1999). Responsible
companies always try to manage and reduce the waste generated from their activities. Similarly,
Brody & Ben-Hamida (2008), argued that internal recycling and cleaner production is an import
source of addressing environmental concerns.
Outbound logistics consists of waste disposal management and other actions for
distributing the final goods or service to customers (Rao, 2007). Therefore, companies have to
consider provision of logistics, marketing, packaging, and waste removal potentials. Since
29
outbound logistics play an important role in environmental degradation. Rao & Holt (2005), argue
that transportation determine the major level of impact on the environment by outbound logistics
in the SC. The competitiveness, and the greening can be achieved by optimizing the distribution
network. As mentioned by Brody & Ben-Hamida (2008), the objectives of outbound logistics are
shorter routes and consolidated the shipments. Compared to inbound logistics where
environmental impacts are predictable, in this case it’s hard to gauge the environmental impact as
customers are from diverse locations. According to APO (2008), purchasing coordination, and
strategic communication is essential for customer and partner relationships. According to Rao &
Holt (2005), the connection among environmental innovation and competitive advantage is
enhanced by green marketing and eco-labelling, it also helps satisfy the customer. According to
Rao (2007), to make this segment of SC green the activities like green marketing, green packaging,
environmental friendly transportation, and waste management are crucial action which every
company should focus on.
According to Rao (2004), the least practiced green practice in South Asia is reverse
logistics. Though, with the passage of time some applications are now common in Asia. According
to Brody & Ben-Hamida (2008), the complete PLC need to be assessed by the product designers
in design phase, and have to look where the product will go at the end of the PLC. Therefore the
design phase has an important connection with reverse logistics, designing the product in way that
it become easier to recover for recycling or reuse, also recyclable packing can be developed to
achieve the green objective (Network, 2001). By reusing at the end of PLC, the production cost
can be lowered significantly (Beamon, 1999). To achieve these targets the customer
communication and collaboration plays an important role (Network, 2001). In addition to this a
certain level of customer awareness is also required to accomplish this objective.

30
2.4. Summary
According to Liu, et al. (X. B. Liu et al., 2012) GrSCM emphasizes the concern for
environment throughout the SC and necessitates a strategic collaboration among all members of
the SC. As mention by Mohanty & Prakash (2013) that the GrSCM is a developing concept from
amalgamation of productivity improvement and environmental protection. They also claimed that
GrSCM is a tool to improve productivity and enhance environmental performance. Nagel (2000)
argued that GrSCM involves all the activities and management of PLC, from manufacturing to the
disposal at the end. The theoretical aspect of green initiatives at different stages of the supply chain
have been probed in numerous studies. Greening of SC results in numerous gains to companies
such as cost reduction, competitive advantage, and brand image, all of which help in developing
novelty with respect to the environment and deliver several benefits to society(Bowen, Cousins,
Lamming, & Faruk, 2001; J. Hall & Clark, 2003). Bowen, et al.(2001) and Sarkis (1999) argued
that in-spite of all these benefits the greening of SC is not widely practiced in industry.
Additionally, green purchasing has great impact on companies’ environmental goals (Min & Galle,
1997). A framework has been developed by Sroufe (2006), which he claims to enable companies
to gain competitive advantage and reduce risk; in the framework he presented the indicators of
environmental performance, a metric for assessing suppliers, and different environmental
initiatives.
According to Rao (2007) the concept of inbound greening is not well known in South Asia,
but there are many firms in the area that already incorporated it into corporate strategy. The
incorporation of inbound greening is derived from different motivations, some companies see this
as a new opportunity to increase their performance and gain competitive advantage; in some
organizations, this practice is a result of corporate mission; while some adopt due to external
31
restrictions. Drumwright (1994), argued that the practicing of green inbound logistics by
companies is a result of many factors such as social obligation initiatives to improve
competitiveness and efficiency.
Many researches like Zhu, et al.(2005) and Linton, Klassen, & Jayaraman(2007) , argued
that research, and debate in the area of GrSCM is at a developmental stage. There has been
prescriptive research more than explanatory or predictive research in the area of GrSCM in the
past (Mohanty & Prakash, 2014). Over time different perspectives have been discussed by different
researchers such as, the reverse logistics discussed by Srivastava (2007) and the analysis of PLC
discussed by Birou, Fawcett, & Magnan, (1998).
Although there many researchers who had developed, and used their own instrument for
exploring the GrSCM factors such as Handfield, Sroufe, and Walton (2005), Q. H. Zhu et al. (2005)
Q. Zhu et al. (2007), Q. H. Zhu et al. (2008), Guiffrida, Datta, Kim, and Min (2011), R. P. Mohanty
and A. Prakash (2013), and de Sousa Jabbour et al. (2013). Howerver it is considered very limited
due to diverse business nature around the globe and heterogeneity in the definition of GrSCM.
The empirical evidence from developed economies on GrSCM mainly came from USA, Australia,
and Canada (Wu et al., 2012). However, from developing economies the empirical evidences are
very rare R. Mohanty & A. Prakash, (2013) and Liu, Wang, Dong, Yang, & Bao,(2012).
Additionally most of the research was carried out large companies, though few researchers focused
on small companies, among these are Sarkis (1999), Rao (2007), Zhu, et al. (2010), and R.
Mohanty and A. Prakash (2013) who have studied GrSCM practices for smaller firms.
From the literature, it is apparent that theoretical contributions are lacking. There are only
a few studies that incorporate the modeling and subsequently empirical testing of hypotheses (R.
Mohanty & A. Prakash, 2013). They also argued that famous studies only give subjective cases,

32
descriptive commentary, and case studies. Therefore, it is imperative to go for additional research
relating to greening of SC in SMEs sector of Pakistan. The estimated number of SMEs in Pakistan
is 3.2 million and they have quite a large share in the export of the country estimated around 40 %
of total exports from Pakistan. SMEs have a very significant role in the Pakistan economy and are
spread all over the country. SMEs are believed to be less likely to adhere to regulation pertinent to
the environment as compared to large companies that have strong control and command systems.
There are many factors which hinders the adoption of green practices by SME’s owners such as a
lack of awareness, lack of technical knowledge, availability of appropriate human resources, and
financial resources. SMEs are considered the critical part of economy and on the other side they
are accused of being a big contributor of pollution.

33
CHAPTER 3. ANALYRICAL FRAMEWORK AND DEVELOPMEMT OF
RESEARCH HYPOTHESIS
Over period of time multidimensional literature has been developed in the environment
management area around the globe, but there is lack of research on developing economies
especially in Pakistan on greening of SC. This study concentrates on exploring the current level of
green practices and their determinant factors in SME’s sector of Pakistan. Zhu & Sarkis (2004)
argued that these four areas signify company’s internal and external functions and actions related
to SC. Four phases of traditional supply chain were incorporated in the research study i.e. (1).
Inbound logistics (2). Production (3). Outbound logistics. (4). Reverse logistics with the
assimilation of ecological initiatives in each phase (Rao, 2007).
Since there are many management practices suggested by different authors such as Rao
(2007), Zhu, Sarkis, & Geng (2005), and Handfield, Sroufe, & Walton (2005), the role of
management to select the appropriate practices/actions in the process of making decision about
green management on different levels of the SC remains an intimidating challenge for managers
(R. P. Mohanty & A. Prakash, 2013). This research will explore the internal factors grouped as
organizational culture, cost pressure, and human resource in SMEs in Pakistan, which previously
have been empirically investigated differently by researchers such as Daily and Huang (2001),
Zhu et al. (2005), Zhu et al. (2012), Liu, et al. (2012), Mohanty & Prakash (2014). This study will
also explore the external foreign pressures and external domestic pressure (Q. H. Zhu, J. Sarkis, &
K. H. Lai, 2012). In addition to that, the mediation of internal factors in the association of foreign
and domestic pressures with GrSCM practices will also be investigated.
The GrSCM practices can be viewed from different theoretical perspectives i-e. (1)
Stakeholder theory (2) institutional theory. According to Liu, Wang, Dong, Yang, & Bao (2011),
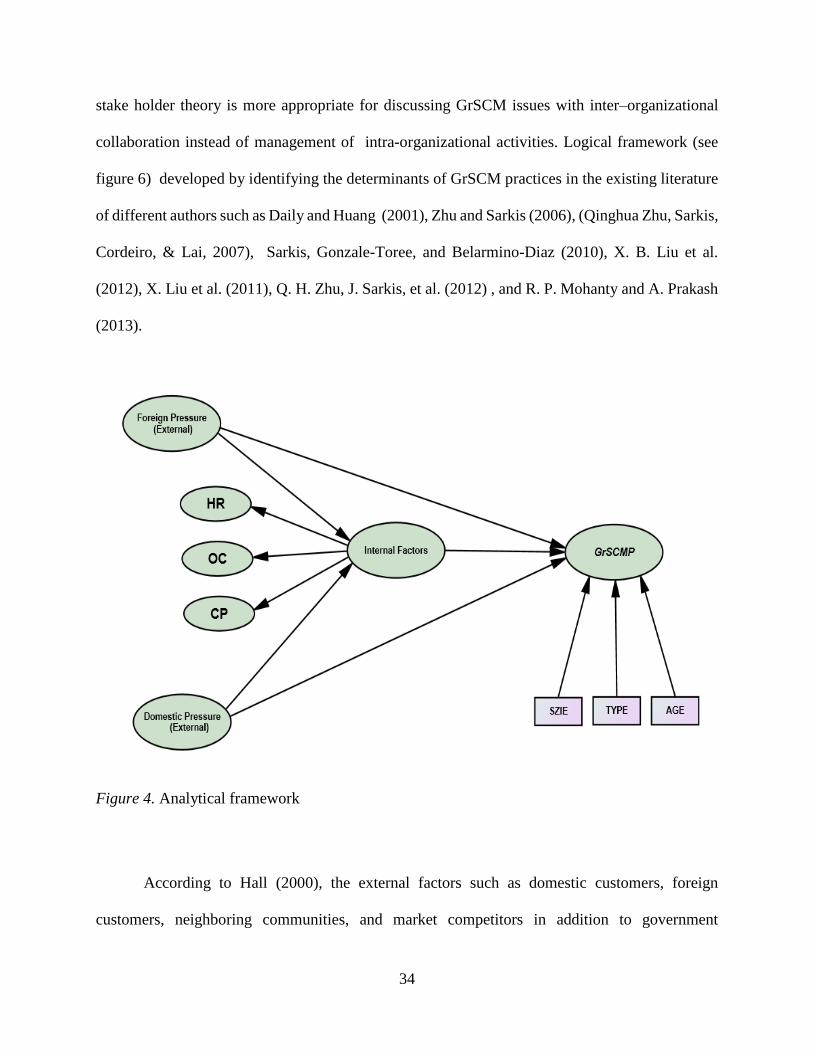
34
stake holder theory is more appropriate for discussing GrSCM issues with inter–organizational
collaboration instead of management of intra-organizational activities. Logical framework (see
figure 6) developed by identifying the determinants of GrSCM practices in the existing literature
of different authors such as Daily and Huang (2001), Zhu and Sarkis (2006), (Qinghua Zhu, Sarkis,
Cordeiro, & Lai, 2007), Sarkis, Gonzale-Toree, and Belarmino-Diaz (2010), X. B. Liu et al.
(2012), X. Liu et al. (2011), Q. H. Zhu, J. Sarkis, et al. (2012) , and R. P. Mohanty and A. Prakash
(2013).
Figure 4. Analytical framework
According to Hall (2000), the external factors such as domestic customers, foreign
customers, neighboring communities, and market competitors in addition to government

35
regulations are important sources of external pressures on companies to adopt GrSCM practices.
Since SMEs in Pakistan are at an early stage of adopting GrSCM practices due to environmental
policy transformation; the significance of outside pressures to adopt GrSCM practices in Pakistan
have become critical over time. Sarkis (1998) and Hervani, Helms, & Sarkis (2005), argued that
the external pressures jointly impelled the companies to adopt certain green practices and make
them more aware of the problems and consequences of not implementing those practices. It has
been empirically tested and justified by many researchers, that the external factors are an important
source of motivation/pressure on companies to adopt GrSCM practices ( (Mohanty & Prakash,
2014); Liu, et al. (2012); (Q. H. Zhu & Sarkis, 2006); (Jeremy Hall, 2000); (Sarkis, 1998) ).
Although all foreign and domestic pressures as whole important determinants for
implementation of GrSCM practices, expectations of customers’ deemed most vital pressure on
companies to implement green practices (Doonan, Lanoie, & Laplante, 2005). To gain competitive
advantage the products environmental side has satisfy customers while meeting their demands (Q.
H. Zhu & Sarkis, 2006). As defined by Nelson, Rashid, Galvin, Essien, & Levine (1999),
communities are entities that may not be involved in business directly but may be affected by and
have sound knowledge of local business. The community angle should be given adequate
importance and representation as it tends to influence the decision making process of any company
(Kearney, 2004). The general social reputation of a company is vulnerable because of the abilities
of the communities’ to influence their social reputation (Henriques & Sadorsky, 1996). Q. H. Zhu,
J. Sarkis, et al. (2012), argued that the international pressure positively relates domestic
environmentalisms and subsequently adoption of green practices. The above discussion leads to
the two hypothesis of this study about SMEs of Pakistan:
H1: SMEs are most likely to implement GrSCM practices with higher level of foreign pressures.

36
H2: SMEs are most likely to implement GrSCM practices with higher level of domestic pressures.
The external pressures are not considered as the only set of factors influencing the business
strategies (Aseem Prakash, 2000); (Gunningham, Kagan, & Thornton, 2003; Aseem Prakash,
2000). In addition to that operational strategies of the companies greatly depend on internal
capacity. The same level of external pressure generates different response from companies due to
their levels of understanding and capacity. X. Liu et al. (2011), argued that the different levels of
understanding and interpretations of outside pressures lead companies to adopt dissimilar
environmental practices. They also argued that the difference in response is directly linked to
perceived pressure, and different objectives of companies. Therefore, we have added three internal
organizational factors in our model the top management support, employees’ education level, and
recurrence of internal environmental training to adopt GrSCM practices. It has been argued by
Daily and Huang (2001) that the critical element for the introduction, and adoption of an
environment management system are the support from top management, team work, and
environmental training According to Carter and Ellram (1998), support from top management is
vital for integration and cross functional programs. Therefore, executive level backing is
imperative for green SC management action by affectively involving employees and bringing a
new culture to a company. According to Hart (1995), the improvement in the skill level of
employees, participation, expertise sharing , and team work greatly benefits an organization’s
motive to achieve sustainability. Employees’ specialized training, and self-learning improve the
capacity of an organization to implement advanced environmental methods. Moreover, Qinghua
Zhu et al. (2007) argued that management support includes ideas related to GrSCM practices at
executive level, collaboration among different function of company, and companies learning have
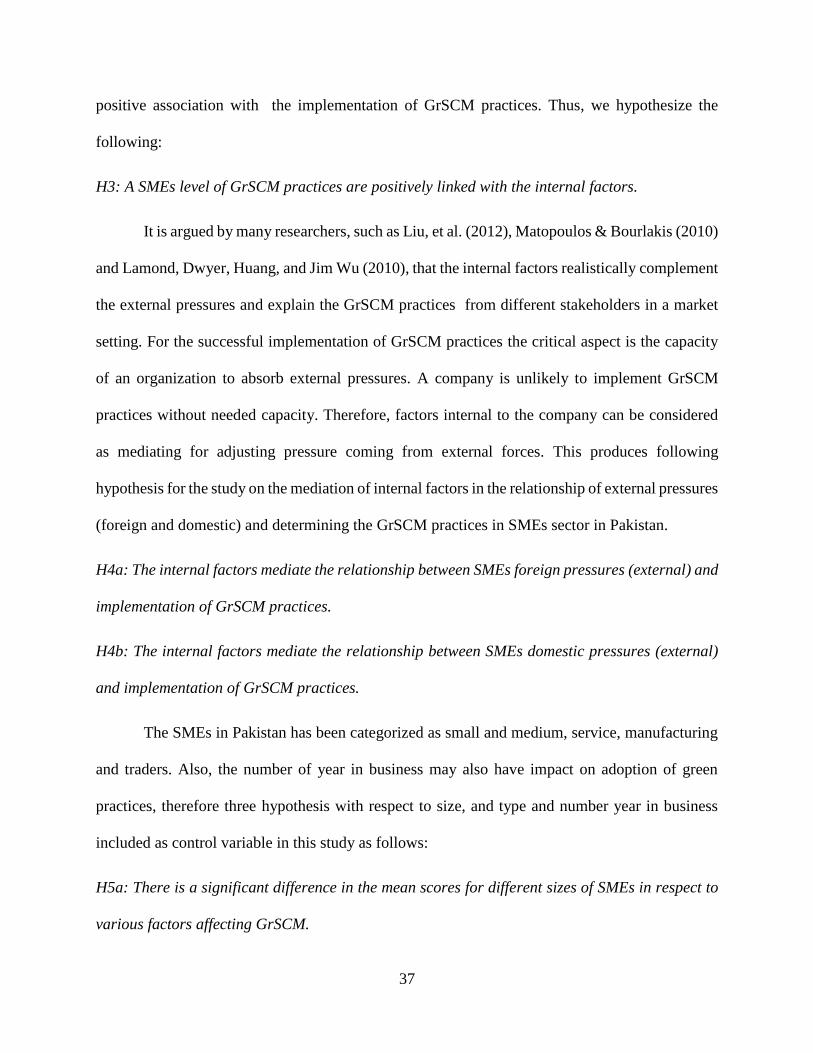
37
positive association with the implementation of GrSCM practices. Thus, we hypothesize the
following:
H3: A SMEs level of GrSCM practices are positively linked with the internal factors.
It is argued by many researchers, such as Liu, et al. (2012), Matopoulos & Bourlakis (2010)
and Lamond, Dwyer, Huang, and Jim Wu (2010), that the internal factors realistically complement
the external pressures and explain the GrSCM practices from different stakeholders in a market
setting. For the successful implementation of GrSCM practices the critical aspect is the capacity
of an organization to absorb external pressures. A company is unlikely to implement GrSCM
practices without needed capacity. Therefore, factors internal to the company can be considered
as mediating for adjusting pressure coming from external forces. This produces following
hypothesis for the study on the mediation of internal factors in the relationship of external pressures
(foreign and domestic) and determining the GrSCM practices in SMEs sector in Pakistan.
H4a: The internal factors mediate the relationship between SMEs foreign pressures (external) and
implementation of GrSCM practices.
H4b: The internal factors mediate the relationship between SMEs domestic pressures (external)
and implementation of GrSCM practices.
The SMEs in Pakistan has been categorized as small and medium, service, manufacturing
and traders. Also, the number of year in business may also have impact on adoption of green
practices, therefore three hypothesis with respect to size, and type and number year in business
included as control variable in this study as follows:
H5a: There is a significant difference in the mean scores for different sizes of SMEs in respect to
various factors affecting GrSCM.

38
H5b: There is a significant difference in the mean scores for different types of SMEs in respect to
various factors affecting GrSCM.
H5c: There is a significant difference in the mean scores for different ages of SMEs in respect to
various factors affecting GrSCM.
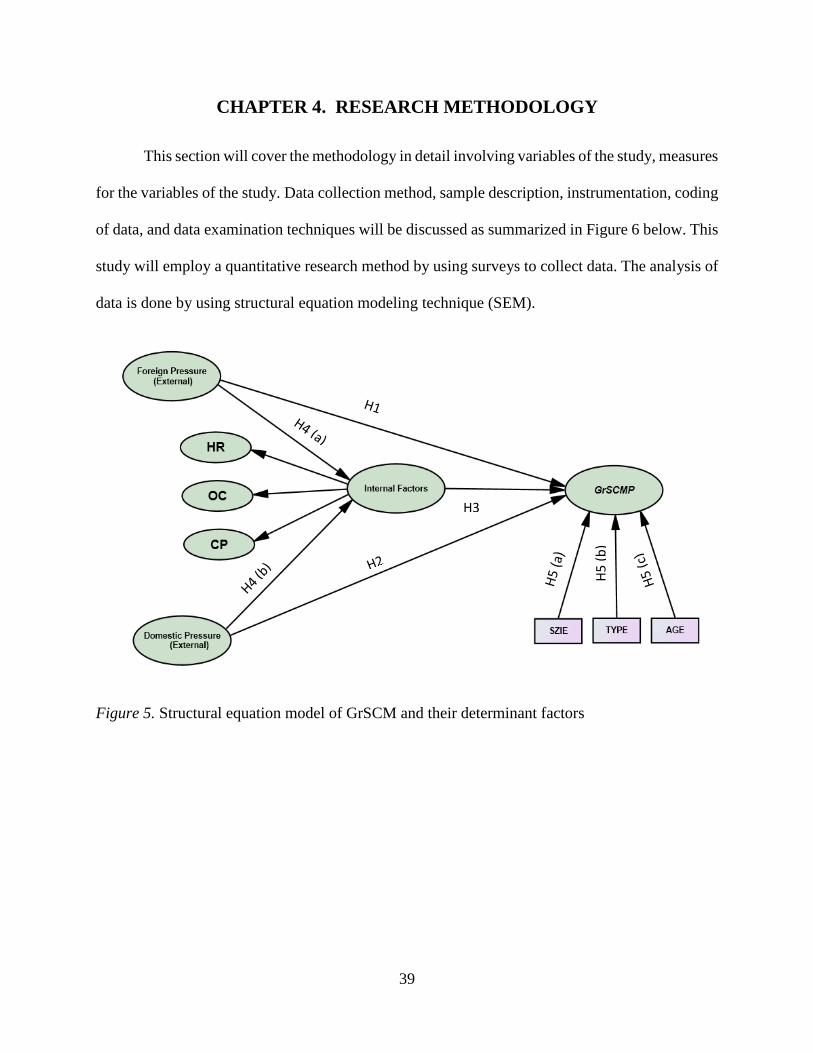
39
CHAPTER 4. RESEARCH METHODOLOGY
This section will cover the methodology in detail involving variables of the study, measures
for the variables of the study. Data collection method, sample description, instrumentation, coding
of data, and data examination techniques will be discussed as summarized in Figure 6 below. This
study will employ a quantitative research method by using surveys to collect data. The analysis of
data is done by using structural equation modeling technique (SEM).
Figure 5. Structural equation model of GrSCM and their determinant factors
H3
H5
(b
)
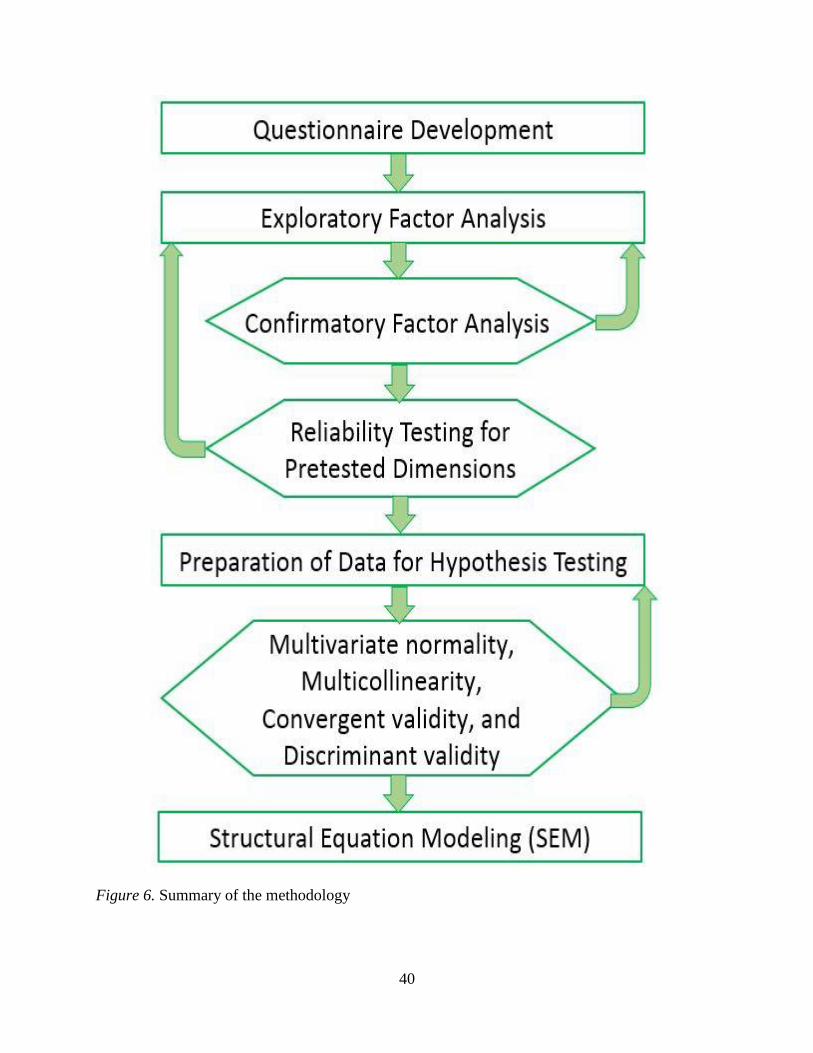
40
Figure 6. Summary of the methodology
41
4.1. Questionnaire Development and Data Collection
In order to collect data, the development of questionnaire to measure GrSCM practices
adopted by SMEs in Pakistan, and their determinant factors was the first step. The questionnaire
is comprised of four sections i.e., first section consists of company’s information such as name,
size, year in business, and type; the second section consists of questions related to GrSCM
practices adopted by SME’s or the environmental action taken by SME’s in the past two years
(current GrSCM practices); and the third section contains the questions related to the importance
of internal factors and external pressures (foreign and domestic) for adoption of GrSCM practices.
The dependent variable is GrSCM practices (SMEs overall GrSCM practices) in this study.
The degree of GrSCM involvement by any company is difficult to measure. Therefore, it can be
signified by a chain of practical action of companies. In the current context of SMEs of Pakistan,
twenty-two items are identified to measure overall level of GrSCM practices of SME’s. Thus
section “A” of the questionnaire will consist of twenty-two items which capture GrSCM actions
taken by a respondent’s organization based on opinion of industrial experts, academicians, and
from past literature of Zsidisin & Hendrick (1998); Walton, et al. (1998); Young & Kielkiewicz-
Young, (2001); Rao, (2002); Sarkis (2003); Zhu, et al. (2005); Handfield, et al. (2005); Rao
(2007); Liu, et al., (2011); Liu, et al. (2012); and R. P. Mohanty & A. Prakash (2013). The
questionnaires will be answered by agreeing with the statements regarding the environmental
action taken by the respondent’s organization by means of a five-point Likert scale, where 1= not
considering the activity at all, 2=planning to consider it, 3=considering it currently,
4=starting/partially implementation, and 5=implementing successfully.
For the independent variables as shown in the analytical framework in Figure 6, the
external pressure is conceptualized as foreign pressure external (FP(E)), and domestic pressure
42
external (DP(E)). Whereas internal factors to adopt GrSCM activities are categories into human
resource (HR), organizational culture (OC), and cost pressure (CP). Therefore section “B” of the
survey will consist of eighteen items capturing the external pressure and internal factors grounded
on different sources from past literature such as, Daily and Huang (2001); (Q. H. Zhu & Sarkis,
2006)); Zhu, Sarkis, Cordeiro, & Lai (2007); Sarkis, Gonzale-Toree, & Belarmino-Diaz (2010);
Liu, et al. (2012); (Mohanty & Prakash, 2014)3); and(Chien, 2014). The questions will be
answered by rating the degree of importance and strength of each factor in respect to stakeholder
pressures for adopting GrSCM practices by means of a five-point Likert scale where 1 = not at all;
2 = a little bit; 3 = to some degree; 4 = strong; 5 = very strong.
The data collection process by using the survey will be arranged in two stages. The
questionnaires for the first stage will only contain section “A”. The responses will be used to
identify factors of GrSCM practices. The data for this study will be collected from SMEs sector of
Pakistan specifically Karachi, Islamabad, and Lahore. The targeted respondents will be mangers
(middle or higher). Following earlier studies such as Zhus, Sarkis and Lai (2006), and cater et al
(1998). Generally, it is believed that information required for this type of study is very specific
and will only be given by specific people in the organization, therefore sampling in this study will
be purposive non-probability. The data collection will be administrated through three steps as
follows:
a) Pilot test: In order to refine the questionnaires, the pilot testing will be performed,
with industrial experts and the people having sound knowledge of SC management.
b) Convenience sampling (stage 1): For the first stage of the survey for this study the
data will be collected through convenience sampling from Islamabad and surrounding areas.
GrSCM Factor will be extracted by conducting exploratory factor analysis.

43
c) Random sampling (stage 2): A complete survey including all sections such as the
pretested dimensions, and with measures for the internal and external factors will be collected by
the respondents from Karachi, Islamabad, Hattar, and Lahore Pakistan. The stage two survey will
be independent of the stage one survey with no overlapping of samples for the two surveys. The
survey will be purposely non-probability, as we know that the specific person has the concerned
information.
In this study, the data collection process carried out by using web-based data collection
method. As stated by Sheehan and Hoy (1997), the internet based surveys are used due to
flexibility of user’s response, cost efficiency, and privacy. The favored respondents identified have
following qualities:
a. Familiarity of strategic SC management processes and practices.
b. An understanding of SC management boundary-spanning aspects.
c. Knowledge of culture and corporate green approaches.
d. Familiarity of major competitors and their conduct.
Given the above desired qualities of respondents, the ideal potential survey participants
targeted in the study were senior supply chain executives. The contribution of potential participants
was also included from operations, logistics and purchasing executives’ due to limited number of
senior SC executives.
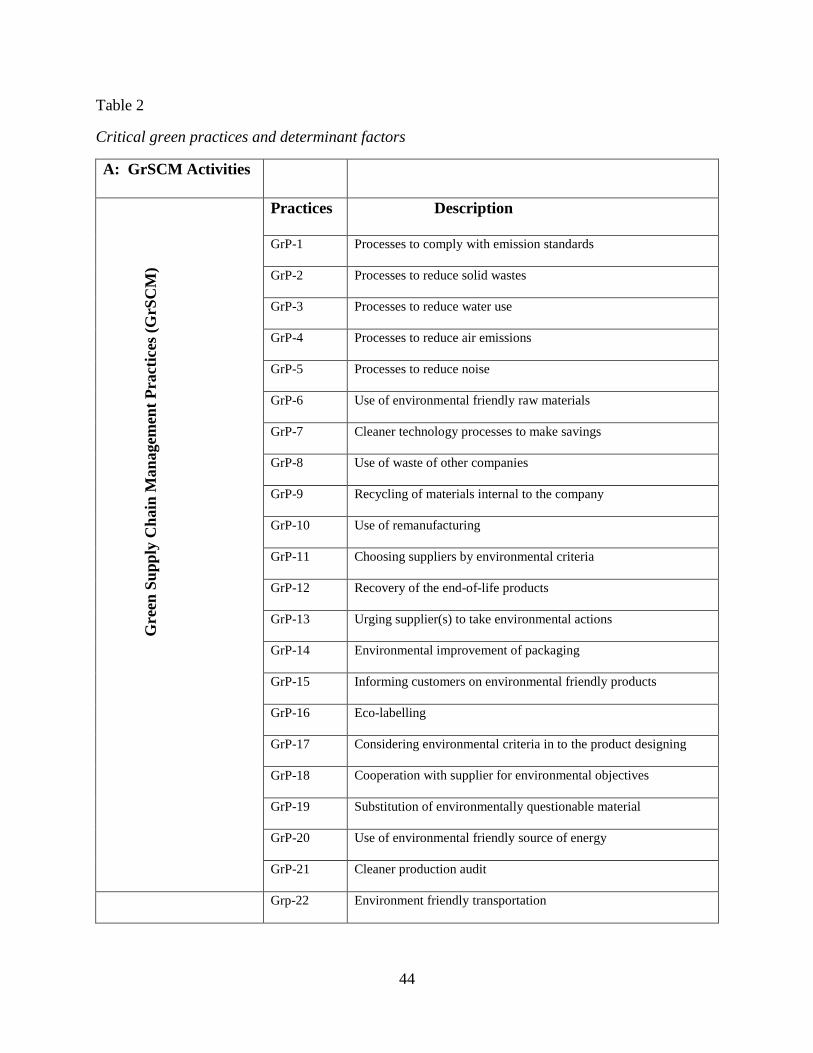
44
Table 2
Critical green practices and determinant factors
A: GrSCM Activities
Gre
en S
up
ply
Ch
ain
Man
agem
ent
Pra
ctic
es (
GrS
CM
)
Practices Description
GrP-1 Processes to comply with emission standards
GrP-2 Processes to reduce solid wastes
GrP-3 Processes to reduce water use
GrP-4 Processes to reduce air emissions
GrP-5 Processes to reduce noise
GrP-6 Use of environmental friendly raw materials
GrP-7 Cleaner technology processes to make savings
GrP-8 Use of waste of other companies
GrP-9 Recycling of materials internal to the company
GrP-10 Use of remanufacturing
GrP-11 Choosing suppliers by environmental criteria
GrP-12 Recovery of the end-of-life products
GrP-13 Urging supplier(s) to take environmental actions
GrP-14 Environmental improvement of packaging
GrP-15 Informing customers on environmental friendly products
GrP-16 Eco-labelling
GrP-17 Considering environmental criteria in to the product designing
GrP-18 Cooperation with supplier for environmental objectives
GrP-19 Substitution of environmentally questionable material
GrP-20 Use of environmental friendly source of energy
GrP-21 Cleaner production audit
Grp-22 Environment friendly transportation
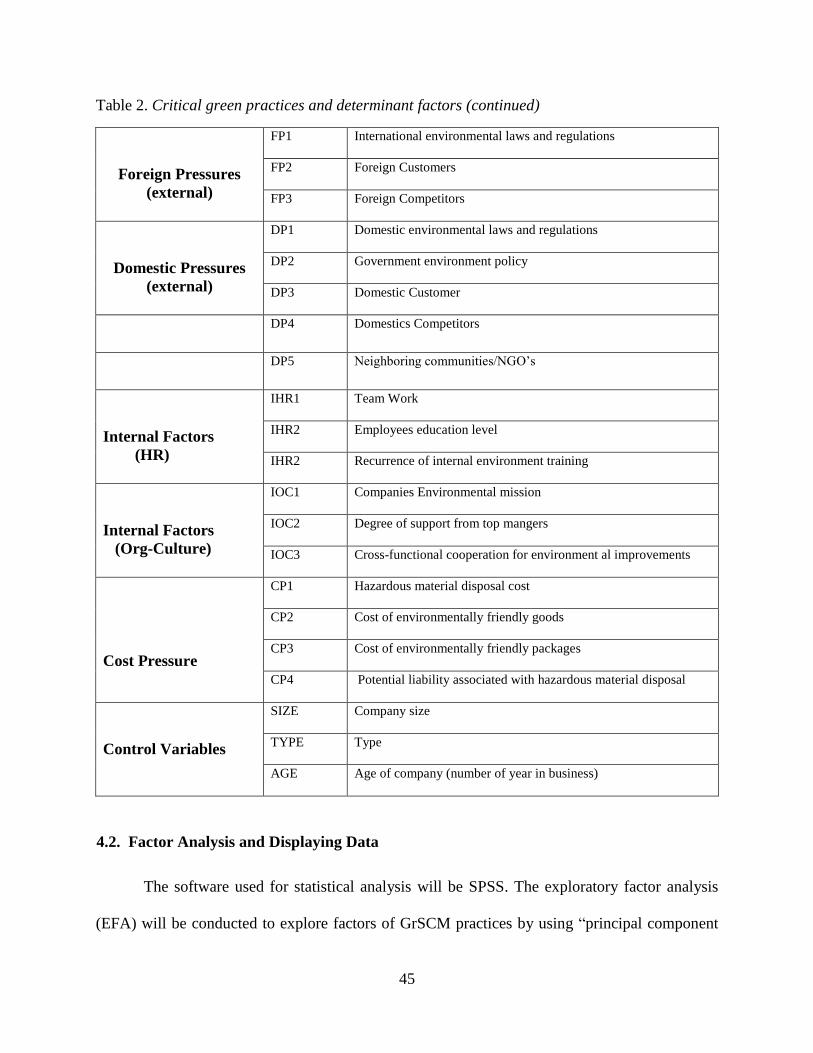
45
Table 2. Critical green practices and determinant factors (continued)
Foreign Pressures
(external)
FP1 International environmental laws and regulations
FP2 Foreign Customers
FP3 Foreign Competitors
Domestic Pressures
(external)
DP1 Domestic environmental laws and regulations
DP2 Government environment policy
DP3 Domestic Customer
DP4 Domestics Competitors
DP5 Neighboring communities/NGO’s
Internal Factors
(HR)
IHR1 Team Work
IHR2 Employees education level
IHR2 Recurrence of internal environment training
Internal Factors
(Org-Culture)
IOC1 Companies Environmental mission
IOC2 Degree of support from top mangers
IOC3 Cross-functional cooperation for environment al improvements
Cost Pressure
CP1 Hazardous material disposal cost
CP2 Cost of environmentally friendly goods
CP3 Cost of environmentally friendly packages
CP4 Potential liability associated with hazardous material disposal
Control Variables
SIZE Company size
TYPE Type
AGE Age of company (number of year in business)
4.2. Factor Analysis and Displaying Data
The software used for statistical analysis will be SPSS. The exploratory factor analysis
(EFA) will be conducted to explore factors of GrSCM practices by using “principal component

46
analysis method” followed by “varimax rotation” to check how much variance will be explained
by these factors. The Kaiser criterion (eigenvalues>1) will be employed along with scree plots to
retain factors. In the process to access the reliability of the responses a reliability test will also be
performed by calculating Cronbach’s alpha coefficient. We will also check for sampling adequacy
by calculating Kaiser –Mayer –Olkin value.
4.3. Confirmatory Factor Analysis
We know that pretesting is important when a measure/scale has been developed in order to
ensure statistical behavior of items as expected if not they may be deleted or refined. The
methodology used will be building confirmatory factor analysis (CFA) by using “maximum
likelihood” technique by means of AMOS software on the foundation of factors extracted by
principal axis factoring using varimax rotation on survey data of GrSCM. The CFA will be used
judge how observed variables load on a single factor. This is important to ensure whether or not
each sub-scale (dimension) loaded on a single factor highly.
4.4. Reliability Testing for Pretested Dimensions
The external pressure (i.e. FP (E), DP (E), the internal factors (OC, HR, CP), and the
pretested dimensions will be included in final survey. The reliability analysis will be performed
and then data will be prepared for hypothesis testing, the Pearson correlation will be calculated to
show the association between overall GrSCM practices and their determinants (external and
internal).
4.5. Structural Equation Modeling
The powerful statistical tool known as “Structural equation modeling” (SEM) will be
employed for data analysis, the SEM simultaneously pool structural model known as path analysis

47
and measurement model known as confirmatory analysis (Garver and Mentzer, 1999). SEM is
capable of handling multiple relations simultaneously and efficiently. The path model shown in
figure 6 identifies two exogenous latent variables foreign pressure and domestic pressure. Whereas
the endogenous latent variables are internal factors, GrSCM practices, and three observed control
variables. The hypothesized relationships of variables are shown in figure 5.
48
CHAPTER 5. DATA ANALYSIS
The section 5 includes the results of measurement, and hypothesized model. In order to
assess the initial survey entities a pre-test was incorporated before the main test to decide is there
any modification in measurement or procedural required. The main test was conducting by using
data collect by refined instrument. The results in this section contain descriptive statistics review,
validity and reliability of constructs, distribution of data, modifications made to develop final
measurement model and complete model testing and hypothesis testing by applying SEM
technique by using SPSS 22 and AMOS 18.
5.1. Pilot Test
In order to refine the questionnaires, pilot testing was performed. The pilot testing carried
out during two regular classes of structural equation modeling and quantitative research at NDSU.
The exercise was also carried out with academicians and industrial experts on environment &
supply chain management to pre-test the survey, by probing the relevancy and clarity of survey
items. During pilot testing we received 20 complete responses, based on the recommendations
from participants, changes were incorporated by re-wording and including a few more GrSCM
practices in the first stage data collection process. As explained in section 4.1 the process for data
collection is two stage process. Initial stage includes only GrSCM practices having 22 statements
(see table 3) catering green practices by using a web based survey instrument and was launched in
July 2015.

49
Table 3
Items of stage one survey
A: GrSCM Activities
G
reen
Su
pp
ly C
hain
Man
agem
ent
Pra
ctic
es (
GrS
CM
)
Practices Description
GrP-1 Use of remanufacturing
GrP-2 Recovery of the end-of-life products
GrP-3 Choosing suppliers by environmental criteria
GrP-4 Use of waste of other companies
GrP-5 Urging supplier(s) to take environmental actions
GrP-6 Processes to reduce noise
GrP-7 Processes to comply with emission standards
GrP-8 Use of environmental friendly raw materials
GrP-9 Processes to reduce solid waste
GrP-10 Processes to reduce water use
GrP-11 Processes to reduce air emissions
GrP-12 Recycling of waste materials internal to the company
GrP-13 Informing consumers on environmentally friendly products
GrP-14 Environmental improvement of packaging
GrP-15 Savings from cleaner technology processes
GrP-16 Cooperation with supplier(s) for environmental objectives
GrP-17 Eco-labelling
GrP-18 Considering environmental criteria in to product design
GrP-19 Substitution of environmentally questionable material
GrP-20 Use of environmental friendly source(s) of energy
GrP-21 Cleaner production audit
GrP-22 Environment friendly transportation

50
The personalized email was sent to potential participants, resulting in 89 responses received
over a period of two months after sending e-mails to 300 SMEs. Out of these only 50 respondents
fully completed the survey and the rest of responses were incomplete. After two reminders, the
response rate was 16.6%. Therefore, third party called DATA was involved to collect the data for
this study. The data was collected from Islamabad and its surroundings for first stage, 250 SMEs
were contacted and 120 completed surveys were received, and subsequently used for the first stage
analysis for identifying GrSCM factors, a 48 % response rate.
5.2. Exploratory Factor Analysis
An EFA by means of “principal component” extraction with “varimax rotation” was
applied to examine data collected in first stage of GrSCM practices. This technique is very useful
in reducing the number of variables by classifying into latent construct and identifying clear
variable structure in a construct. EFA elucidating the variation between variables by mean of less
variables called factors, this is also known as condensing of information. EFA was done using
SPSS 22.
As a first step towards EFA, we calculated the communalities. Communality means that a
common factor explains the variance of observed variable. The influence of underlying construct
considered strong if the value is high, if the communality is low, such as <0.50, it indicates there
may be too few factors extracted or unreliable variables. The initial analysis revealed low
communalities for the practices “GrP11”, GrP5”, and “Grp6”; consequently, these variables were
dropped and we got the communality values shown in table 4.
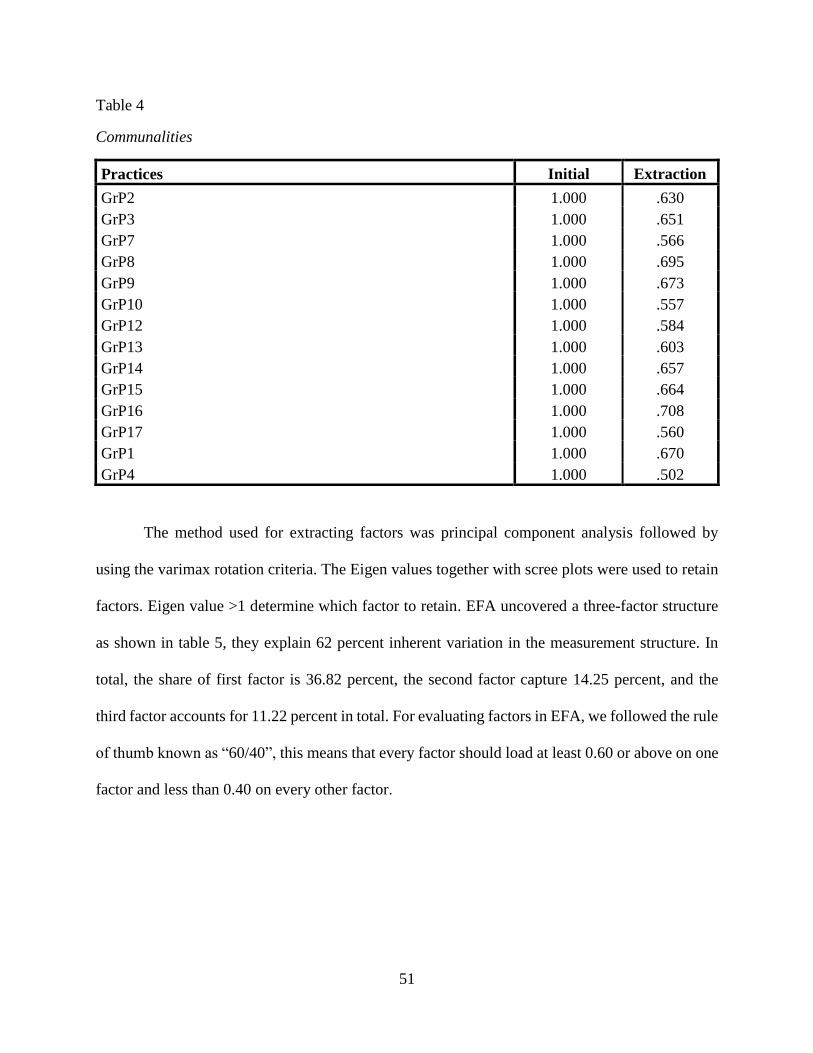
51
Table 4
Communalities
Practices Initial Extraction
GrP2 1.000 .630
GrP3 1.000 .651
GrP7 1.000 .566
GrP8 1.000 .695
GrP9 1.000 .673
GrP10 1.000 .557
GrP12 1.000 .584
GrP13 1.000 .603
GrP14 1.000 .657
GrP15 1.000 .664
GrP16 1.000 .708
GrP17 1.000 .560
GrP1 1.000 .670
GrP4 1.000 .502
The method used for extracting factors was principal component analysis followed by
using the varimax rotation criteria. The Eigen values together with scree plots were used to retain
factors. Eigen value >1 determine which factor to retain. EFA uncovered a three-factor structure
as shown in table 5, they explain 62 percent inherent variation in the measurement structure. In
total, the share of first factor is 36.82 percent, the second factor capture 14.25 percent, and the
third factor accounts for 11.22 percent in total. For evaluating factors in EFA, we followed the rule
of thumb known as “60/40”, this means that every factor should load at least 0.60 or above on one
factor and less than 0.40 on every other factor.
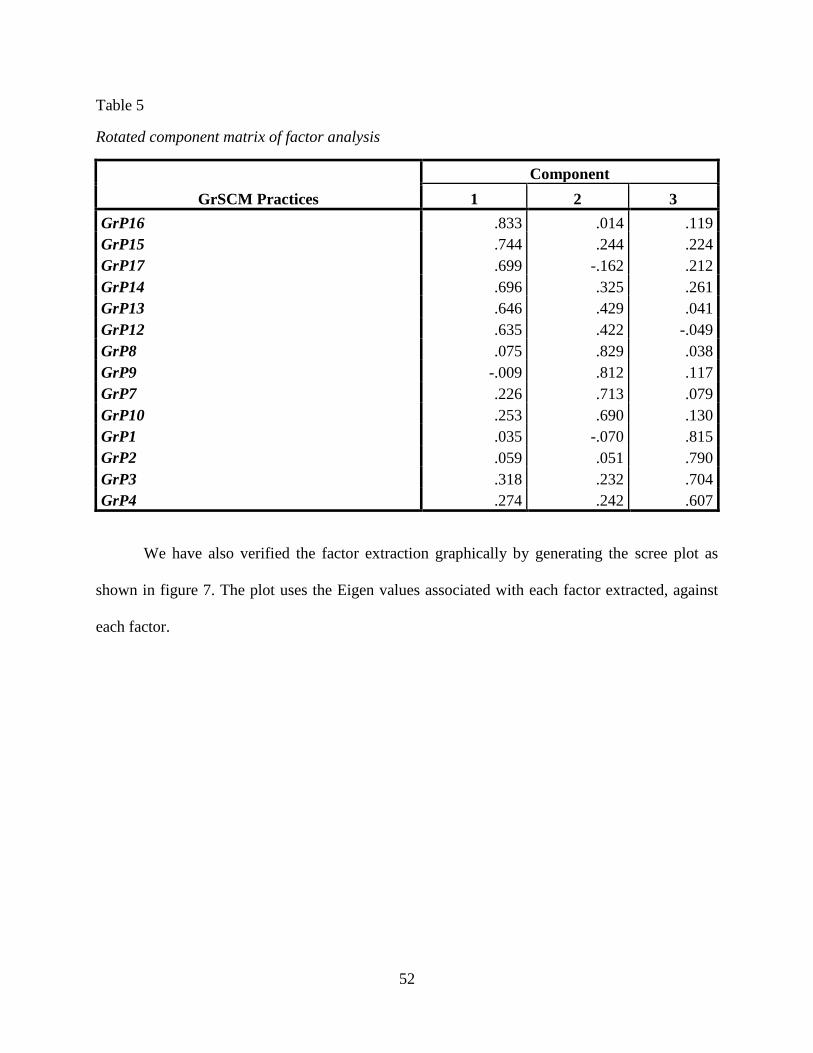
52
Table 5
Rotated component matrix of factor analysis
GrSCM Practices
Component
1 2 3
GrP16 .833 .014 .119
GrP15 .744 .244 .224
GrP17 .699 -.162 .212
GrP14 .696 .325 .261
GrP13 .646 .429 .041
GrP12 .635 .422 -.049
GrP8 .075 .829 .038
GrP9 -.009 .812 .117
GrP7 .226 .713 .079
GrP10 .253 .690 .130
GrP1 .035 -.070 .815
GrP2 .059 .051 .790
GrP3 .318 .232 .704
GrP4 .274 .242 .607
We have also verified the factor extraction graphically by generating the scree plot as
shown in figure 7. The plot uses the Eigen values associated with each factor extracted, against
each factor.

53
Figure 7. Scree plot
The factors extracted using EFA suggest the following practices as factor one: GrP12,
GrP13, GrP14, GrP15, GrP16, and GrP17. Similarly factor two includes GrP7, GrP8, GrP9, and
GrP10, whereas GrP1, GrP2, GrP3, and GrP4 are under factor three (see table 6). The Cronbach’s
(α) alpha was measured to assess each group reliability. The established values by Nunnally (1978)
is 0.70 to demonstrate the internal consistency of the scale as shown in table 6. The criteria for
demonstrating internal consistency is considered terrific if α ≥ 0.9, good for 0.7 ≤ α < 0.9,
acceptable for 0.6 ≤ α < 0.7, weak for 0.5 ≤ α < 0.6, and unacceptable for α < 0.5 (Flynn, Schroeder,
& Sakakibara, 1994; George & Mallery, 2003; Hair, Anderson, Tatham, & William, 1998; Kline,
1999). Therefore, the values we calculated in this case are good as shown in table 6.

54
Table 6
Factor loading, variance and cronbach alpha for each factor
Factors
Factor
loading
%
Variance
Cronbach’s
Alpha (α)
Factor 1: Proactive environment management
(PEM) 36.820 .849
GrP16: Use of environmental friendly source of
energy .833
GrP15: Cooperation with supplier for environmental
objectives .744
GrP17: Cleaner production audit .699
GrP14: Cleaner technology processes to make
savings .696
Gr13: Environmental improvement of packaging .646
GrP12: Informing consumers on environmental-
friendly products .635
Factor 2: Compliance Greening (CG) 14.245 .807
GrP8: Processes to reduce solid wastes .829
GrP9: Processes to reduce water use .812
GrP7: Use of environmental friendly raw materials .713
GrP10: Processes to reduce air emissions .690
Factor 3: Ecological Greening (EG) 11.217 .762
GrP1: Use of remanufacturing .815
GrP2: Recovery of the end-of-life products .790
GrP3: Choosing suppliers by environmental criteria .704
GrP4: Use of waste of other companies .607
The “Kaiser-Meyer-Olkin” measure of sampling appropriateness is calculated as 0.84. The
degree of common variance among the fourteen variables is meritorious, meaning that the factor
extracted will account for a substantial amount of variance. This value is considered excellent, as
the minimum acceptable value established by Anand Prakash, Mohanty, Kumar, and Kallurkar
(2011) is 0.5.

55
The “Bartlett’s test of sphericity” was also conducted. The null hypothesis states that “the
inter-correlation matrix comes from a population in which the variables are non-collinear (an
identity matrix)”. The result from this study shows that we will reject the null hypothesis meaning
that “the sample inter-correlation matrix did not come from a population in which the inter-
correlation matrix is an identity matrix”. Therefore, it is sufficient for stating that the matrix did
not suffer from multicollinearity or singularity.
The first factor we extracted was categorized as “Proactive environment management” and
includes the variables “Use of environmental friendly source of energy”, “Cooperation with
supplier for environmental objectives”, “Cleaner production audit”, “Cleaner technology
processes to make savings”, “Environmental improvement of packaging”, and “Informing
consumers on environmental-friendly products”. The second factor labeled “Compliance
Greening” included the variables “Processes to reduce solid wastes”, “Processes to reduce water
use”, “Use of environmental friendly raw materials”, and “Processes to reduce air emissions”. The
final variable labeled “Ecological Greening” included the variables “Use of remanufacturing”,
“Recovery of the end-of-life products”, “Choosing suppliers by environmental criteria”, and “Use
of waste of other companies” as shown in table 7.
To improve the legitimacy of the content after EFA, the factors explored were assessed by
expert from academia and agreed on three sub constructs equating proactive environment
management (PEM), compliance greening (CG), and ecological greening (EG) as a measure of
GrSCM practices as shown in table 6.
5.3. Launching of Second Stage Data Collection
An independent random survey for subsequent stage data collection was initiated. The
survey included the pre-tested dimensions of GrSCM from stage one as shown in table 6, along
56
with determinant factors. The internal factors comprised of Team work, employees education
level, and recurrence of internal environment training were classified as human resources (HR);
companies environmental mission, degree of support from s, and cross-functional cooperation for
environmental improvement were classified as organization culture; Hazardous material disposal
cost , cost of environmentally friendly goods, cost of environmentally friendly packages, and
potential liability for disposal of hazardous material were classified as cost pressure. The survey
also included the external factors comprised of international environmental laws and regulations,
foreign customers, and foreign competitors classified as external pressure foreign; domestic
environmental laws and regulations, government environment policy, domestic customers,
domestic competitors, and neighboring communities classified as external pressure domestic. In
addition, classification questions such as company size, type, and age were included, as shown
table 7.
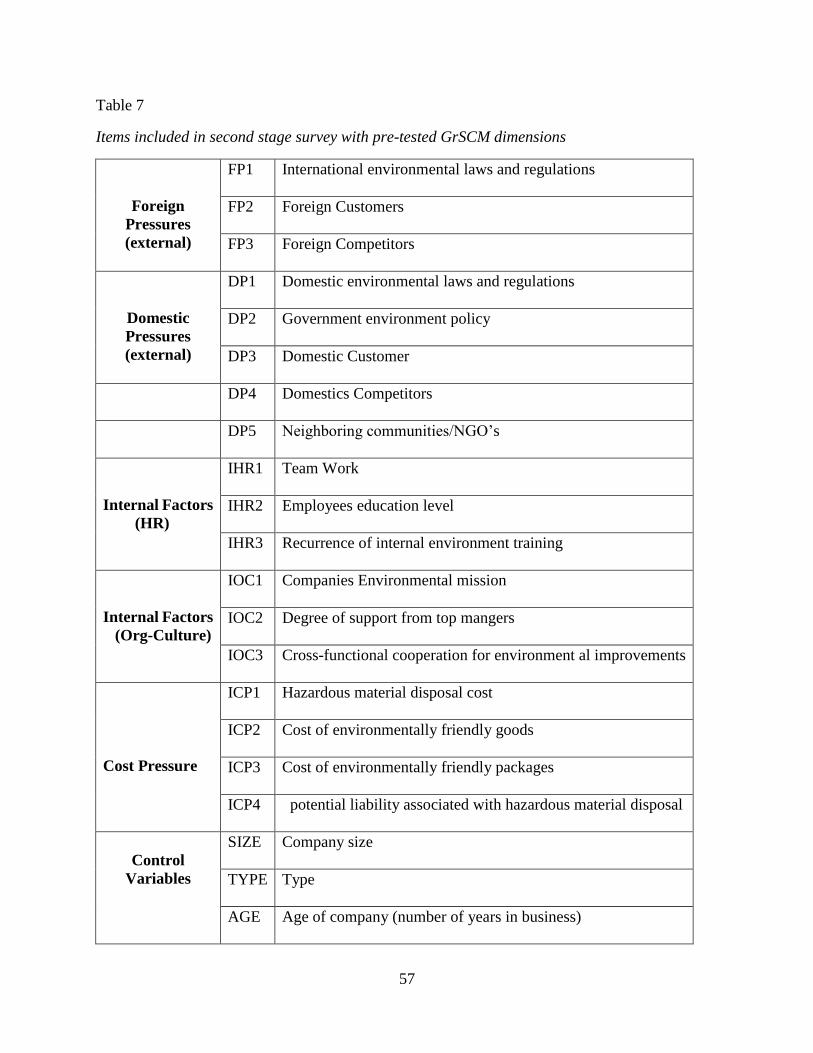
57
Table 7
Items included in second stage survey with pre-tested GrSCM dimensions
Foreign
Pressures
(external)
FP1 International environmental laws and regulations
FP2 Foreign Customers
FP3 Foreign Competitors
Domestic
Pressures
(external)
DP1 Domestic environmental laws and regulations
DP2 Government environment policy
DP3 Domestic Customer
DP4 Domestics Competitors
DP5 Neighboring communities/NGO’s
Internal Factors
(HR)
IHR1 Team Work
IHR2 Employees education level
IHR3 Recurrence of internal environment training
Internal Factors
(Org-Culture)
IOC1 Companies Environmental mission
IOC2 Degree of support from top mangers
IOC3 Cross-functional cooperation for environment al improvements
Cost Pressure
ICP1 Hazardous material disposal cost
ICP2 Cost of environmentally friendly goods
ICP3 Cost of environmentally friendly packages
ICP4 potential liability associated with hazardous material disposal
Control
Variables
SIZE Company size
TYPE Type
AGE Age of company (number of years in business)
58
5.4. Operationalizing the Variables
For operationalizing the dependent variable, in the current context of Pakistan to gauge the
current level of GrSCM of SMEs three factors were identified GrSCM as shown in tables 3-6.
GrSCM was measured by a series of practical activities by SMEs as shown in table 7. The five‐
point Likert scale used to collect the data regarding the environmental action taken by their
organization on a scale of 1-5 where 1= not considering the activity at all, 2=planning to consider
it, 3=considering it currently, 4=starting/partially implementation, and 5= implementing
successfully.
A Likert scale with five points was used to operationalize the independent variables. Each
item with respect to external pressure foreign, external pressure domestic, and internal factor
comprised of human resource (HR), organization culture (OC), and cost pressure (CP), to what
extent the manager felt pressure or the degree of importance for adopting GrSCM practices, where
1 = not at all; 2 = a little bit; 3 = to some degree; 4 = strong; and 5 = very strong. For adoption of
GrSCM these factors considered as very important determinates/or motives. The external pressure
foreign were included international environmental laws and regulations, foreign customers, and
foreign competitors; the external pressure domestic included domestic environmental laws and
regulations, government environment policy, and domestic competitors. Whereas the internal
factor consisted of three variables HR, OC, and CP, each variable is made up of different items
such as HR consisted of team work, employees educational, and recurrence internal training on
training; OC consisting of company environmental mission, amount of support from executives ,
and cooperation among different functions for improving environment ; CP consisting of
“Hazardous material disposal cost” , “cost of environmental friendly goods”, “cost associated with
environment friendly packages”, and “potential liability for disposal of hazardous material” as
59
shown in table 7. In the SEM model, the internal factor was measured as a second order by using
HR, OC, and CP.
The control variables included in the survey were size, type, age, and the industrial sector.
It is vastly believed that the industrial structure commands these activities. As explained in
institutional theory that with in the same industry the phenomena called “mimetic isomorphism”
mean that the tendency of an organization to model their practices imitate on another successful
organization’s because they consider it as beneficial/or to enhance legitimacy, the variations in
practices also reduce by this phenomena (DiMaggio & Powell, 2000). Organizational size was
controlled because the bigger companies often have additional financial resources on their disposal
to handle green issues. According to Hettige, Huq, Pargal, and Wheeler (1996), bigger companies
are anticipated as having more tendency to be involved in revolutionary environmental practices,
due to greater public scrutiny.
The size of the company was operationalized by using SMEDA’s definition “A
manufacturing company with less than 50 full-time employees and productive assets of Rs30
million, a service provider with less than 50 workers and productive assets of Rs20 million and a
trader with less than 20 employees and productive assets of Rs20 million were considered small
enterprise, and recorded as 1, and a manufacturing unit with 51-250 employees and productive
assets worth Rs30-100 million, a service provider with 51-250 workers and productive assets of
Rs20-50 million and a trader with 21-50 employees and productive assets of Rs20-50 million were
considered medium enterprises” and recorded as 2 ( 1= Small-sized, and 2 = Medium-sized). The
type of company was operationalized as 1=Non-Manufacturing and 2= Manufacturing; whereas
the age of company was calculated by taking the mean of the age data and then operationalizing
as 1 if it was less than the mean value and 2 otherwise.

60
We adopted the purposive nonprobability sampling technique, only specific people know
the survey information required. A random survey was carried out in Pakistan mainly in the
Karachi, Islamabad, Lahore, and Hattar industrial areas. The total number of organizations
contacted through personal visit by DATA was 450, with 220 questionnaires being completed, a
response rate of 48.88 %. After carefully analyzing each completed questionnaire and eliminating
overlapping in samples, 200 were retained for analysis and reliability testing was carried out for
GrSCM factors as shown in table 8.
Table 8
Reliability analysis
The reliability analysis shows that the alpha for all three factors PEM, CG, and EG, is well
above the cutoff of 0.70. Therefore, the reliability for the factors using second stage data is very
good.
Dimension Cronbach alpha (α)
Proactive environment management (PEM) 0 .85
Compliance greening (CG) 0.81
Ecological greening (EG) 0.76

61
5.5. Descriptive Statistics
Figure 8. Sample type
The overall independent sample size is 200, and was comprised of 50 % small-size
companies and 50 % medium-sized companies. We have also categorized companies on the basis
of their operations as manufacturing and non-manufacturing, in this sample size we have 62 % of
companies categorized as manufacturing and 38 % as non- manufacturing as shown in figure 8.

62
Table 9
Statistical summary of GrSCM practices
GrSCM activities Observations Mean SD Minimum Maximum
EG: Ecological greening 200 3.10 .88 1.00 5.00
GrP1 200 2.98 1.16 1.00 5.00
GrP2 200 3.16 1.08 1.00 5.00
GrP3 200 3.21 1.21 1.00 5.00
GrP4 200 3.00 1.14 1.00 5.00
CG: Compliance greening 200 2.97 1.00 1.00 5.00
GrP7 200 3.14 1.15 1.00 5.00
GrP8 200 2.76 1.28 1.00 5.00
GrP9 200 2.78 1.31 1.00 5.00
GrP10 200 3.20 1.26 1.00 5.00
PEM: Proactive environment management 200 3.32 .91 1.00 5.00
Gr12 200 3.11 1.16 1.00 5.00
GrP13 200 3.16 1.10 1.00 5.00
GrP14 200 3.30 1.18 1.00 5.00
GrP15 200 3.52 1.21 1.00 5.00
GrP16 200 3.53 1.22 1.00 5.00
(𝐺𝑟𝑆𝐶𝑀)
Overall level of GrSCM practices 200 3.13 .72 1.00 5.00
The statistical summary of GrSCM practices are presented in Table 9. The average score
of GrSCM activities is 3.13 (see table 9), indicating that GrSCM practices implementation in
Pakistani SMEs are still at a very initial phase. Among all the activities PEM have high score of
ranging from 3.53 to 3.11, indicating that the surveyed firms have started to implement PEM
activities to reasonable extend. This also suggest that the SMEs in Pakistan are more inclined
towards proactive management rather than reactive environment management. Whereas CG
averaged 2.78 to 3.20, and EG averaged 2.98 to 3.21. The lowest average was achieved by GrP8
(process to reduce solid waste) at 2.76, similarly the second lowest average was obtained by GrP9
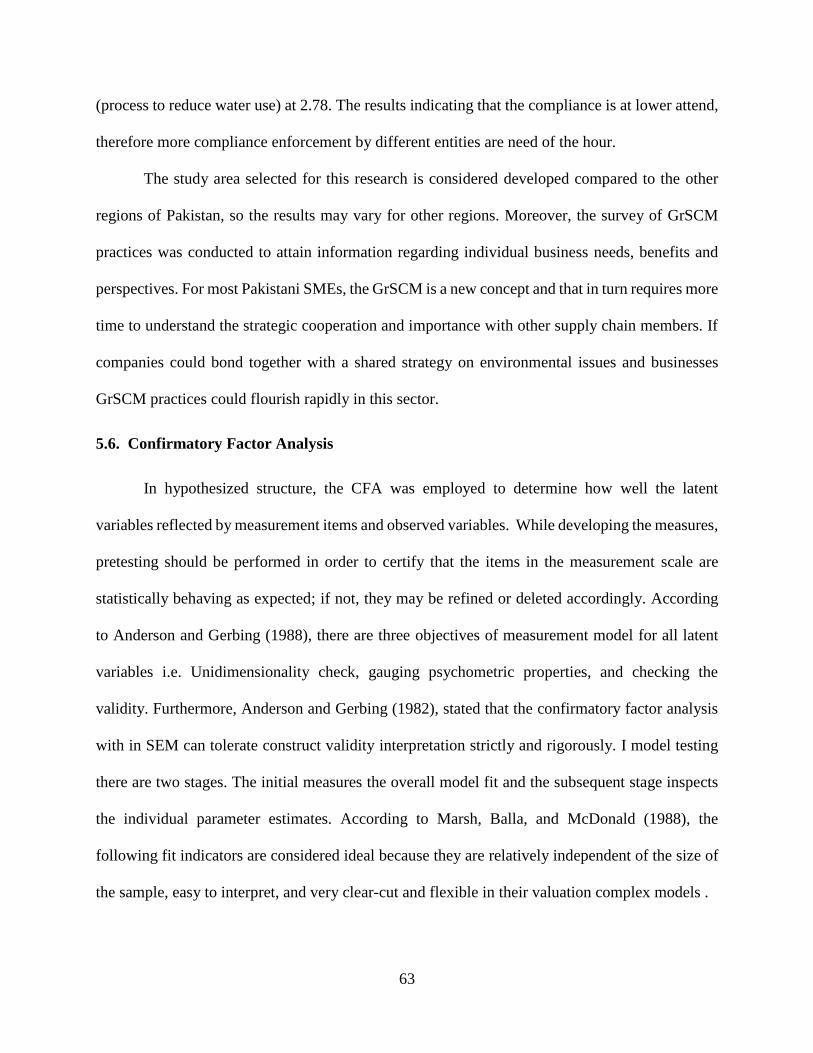
63
(process to reduce water use) at 2.78. The results indicating that the compliance is at lower attend,
therefore more compliance enforcement by different entities are need of the hour.
The study area selected for this research is considered developed compared to the other
regions of Pakistan, so the results may vary for other regions. Moreover, the survey of GrSCM
practices was conducted to attain information regarding individual business needs, benefits and
perspectives. For most Pakistani SMEs, the GrSCM is a new concept and that in turn requires more
time to understand the strategic cooperation and importance with other supply chain members. If
companies could bond together with a shared strategy on environmental issues and businesses
GrSCM practices could flourish rapidly in this sector.
5.6. Confirmatory Factor Analysis
In hypothesized structure, the CFA was employed to determine how well the latent
variables reflected by measurement items and observed variables. While developing the measures,
pretesting should be performed in order to certify that the items in the measurement scale are
statistically behaving as expected; if not, they may be refined or deleted accordingly. According
to Anderson and Gerbing (1988), there are three objectives of measurement model for all latent
variables i.e. Unidimensionality check, gauging psychometric properties, and checking the
validity. Furthermore, Anderson and Gerbing (1982), stated that the confirmatory factor analysis
with in SEM can tolerate construct validity interpretation strictly and rigorously. I model testing
there are two stages. The initial measures the overall model fit and the subsequent stage inspects
the individual parameter estimates. According to Marsh, Balla, and McDonald (1988), the
following fit indicators are considered ideal because they are relatively independent of the size of
the sample, easy to interpret, and very clear-cut and flexible in their valuation complex models .

64
a. The comparative fit index (CFI): This is the most important criteria used in
assessing the fitness of a model, it is an agreed incremental fit index which equates
base model with existing model fit supposing uncorrelated latent variables in the
model. The value for CFI ranges from 0 to 1. As stated by Medsker, Williams, and
Holahan (1994), CFI tells us the percentage of covariation in the data that can be
reproduced by the model. The larger the value the better is the model fit, generally
0.90 is considered a good fit.
b. Standardized root mean square residual (SRMR): This is an absolute measure of
fit. The standardized difference between predicted, and observed correlations is
called SRMR (Kirchoff, 2011). Generally, a value of SRMR ≤ 0.10 mean a good
fit.
c. The root mean square error of approximation (RMSEA): RMSEA tends to favor
model with more parameters since it adds in no penalty for model intricacy.
Statistically RMSEA ≤ 0.05, point to a good fit; ≤ 0.08, acceptable fit; and > 0.10
a poor fit. Moreover, Medsker et al. (1994) argued that acceptable values of
RMSEA are between 0.05 and 0.08.
d. The chi-Square (χ2 or CMIN): CMIN suitable degree estimation model indicates
the observed variance and covariance pattern data corresponding to an absolute
measure. A χ2 difference test is often used as a test measurement invariance across
group’s measure. A non-significant chi square (OLS > 0.05) suggests a good fit,
whereas a significant one suggests a poor fit. The chi square almost always turns
out to be significant due to sensitivity, especially for sample sizes 200 and above
observations. Alternatively, researchers suggested to go by the chi square ratio, the
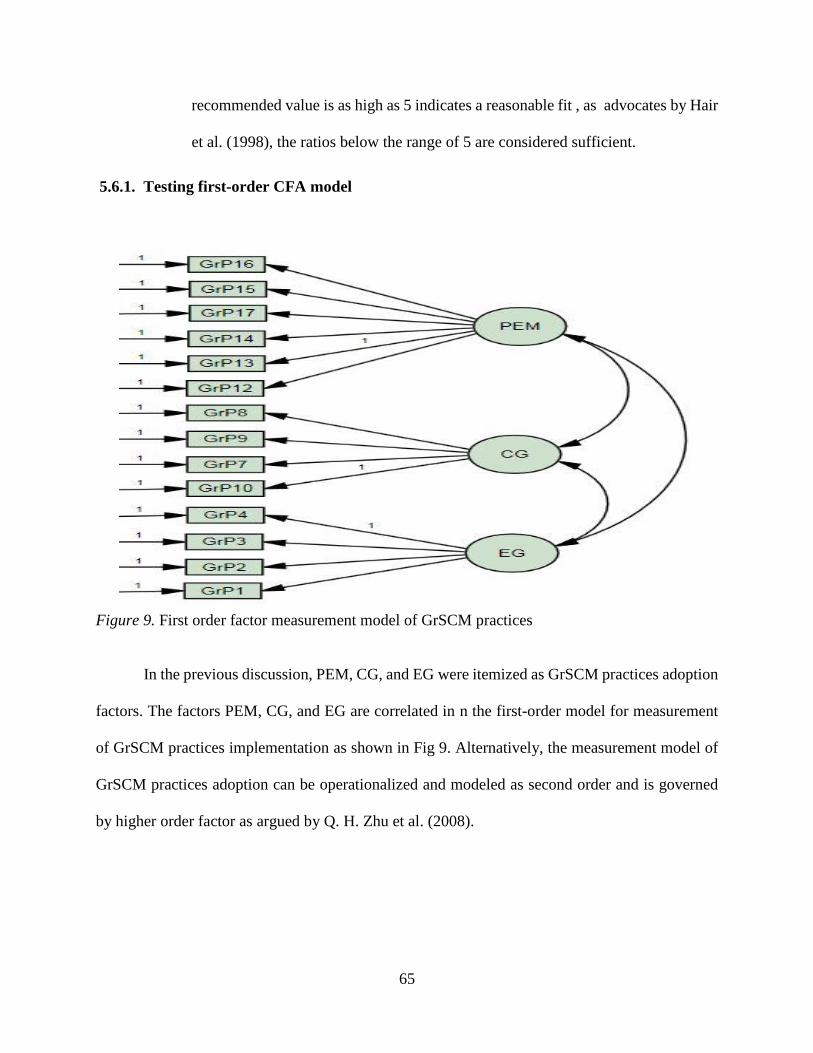
65
recommended value is as high as 5 indicates a reasonable fit , as advocates by Hair
et al. (1998), the ratios below the range of 5 are considered sufficient.
5.6.1. Testing first-order CFA model
Figure 9. First order factor measurement model of GrSCM practices
In the previous discussion, PEM, CG, and EG were itemized as GrSCM practices adoption
factors. The factors PEM, CG, and EG are correlated in n the first-order model for measurement
of GrSCM practices implementation as shown in Fig 9. Alternatively, the measurement model of
GrSCM practices adoption can be operationalized and modeled as second order and is governed
by higher order factor as argued by Q. H. Zhu et al. (2008).
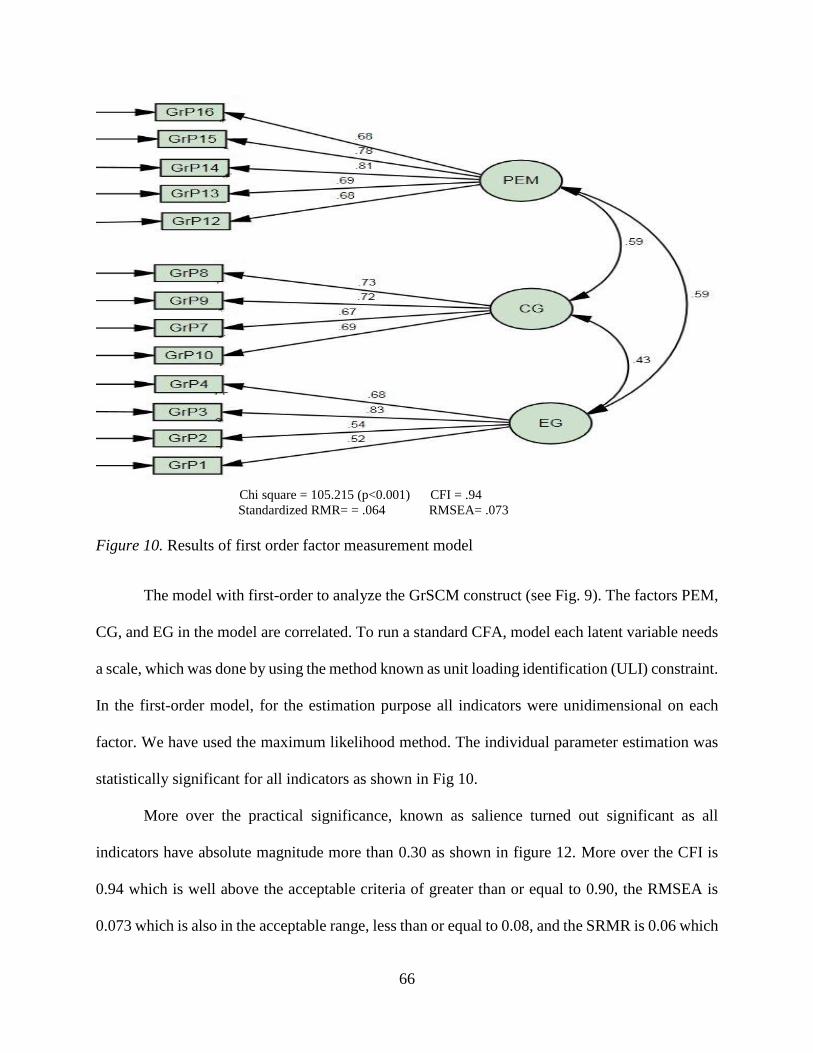
66
Chi square = 105.215 (p<0.001) CFI = .94
Standardized RMR= = .064 RMSEA= .073
Figure 10. Results of first order factor measurement model
The model with first-order to analyze the GrSCM construct (see Fig. 9). The factors PEM,
CG, and EG in the model are correlated. To run a standard CFA, model each latent variable needs
a scale, which was done by using the method known as unit loading identification (ULI) constraint.
In the first-order model, for the estimation purpose all indicators were unidimensional on each
factor. We have used the maximum likelihood method. The individual parameter estimation was
statistically significant for all indicators as shown in Fig 10.
More over the practical significance, known as salience turned out significant as all
indicators have absolute magnitude more than 0.30 as shown in figure 12. More over the CFI is
0.94 which is well above the acceptable criteria of greater than or equal to 0.90, the RMSEA is
0.073 which is also in the acceptable range, less than or equal to 0.08, and the SRMR is 0.06 which
67
shows a good fit. Although the chi square statistic is significant, the Chi square ratio of 2.06 is in
the range of less than 5 as suggested by researchers, indicating a reasonable fit (Hair et al, 1998).
Therefore, we can infer that overall model fitness very good and the results supports the
measurement model of GrSCM practices adoption as first order construct.
5.6.2. Testing second-order CFA model
Figure 11. Second order factor measurement model of GrSCM practices
Second-order model testing was operationalized as shown in Fig 11. The association
between PEM, CG, and EG govern by higher-order latent factor known as GrSCM. The second-
order model produces very good results as compared to the first order model (see Fig. 12).
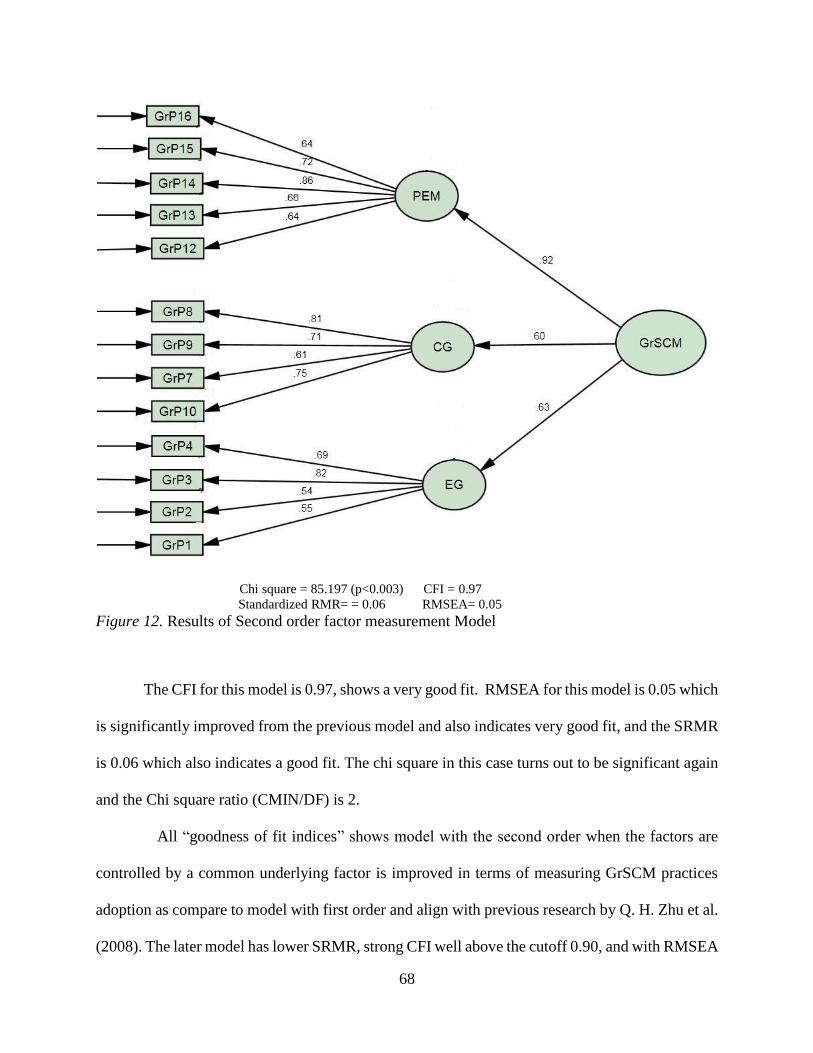
68
Chi square = 85.197 (p<0.003) CFI = 0.97
Standardized RMR= = 0.06 RMSEA= 0.05
Figure 12. Results of Second order factor measurement Model
The CFI for this model is 0.97, shows a very good fit. RMSEA for this model is 0.05 which
is significantly improved from the previous model and also indicates very good fit, and the SRMR
is 0.06 which also indicates a good fit. The chi square in this case turns out to be significant again
and the Chi square ratio (CMIN/DF) is 2.
All “goodness of fit indices” shows model with the second order when the factors are
controlled by a common underlying factor is improved in terms of measuring GrSCM practices
adoption as compare to model with first order and align with previous research by Q. H. Zhu et al.
(2008). The later model has lower SRMR, strong CFI well above the cutoff 0.90, and with RMSEA
69
meeting the strict benchmark of 0.05. Over all path analysis of GrSCM construct in the second-
order model shows the coefficient estimates (λ) of PEM, CG, and EG are statistical significate.
The loading between adoption GrSCM practices and PEM is 0.92, for path between GrSCM and
CG is 0.60, and 0.63 for EG (see table 10). Therefore, measuring the level of involvement/or
implementation of GrSCM practices can be adequately conceptualized in this study as second-
order multidimensional construct, comprising of PEM, CG, and EG. The results are align with Q.
H. Zhu et al. (2008) confirming the measurement of GrSCM practice adoption can be analyzed as
second order, but in case of SMEs of Pakistan we have fewer dimensions. Table 5 summarizes
the final loadings for each sub-scale, and 14 items were retained with final loadings > 0.50.

70
Table 10
Confirmatory factor analysis results
Practices Factors Loadings
Factor
loading on
GrSCM
Factor 1:
Proactive
environment
management
(PEM)
0.92
GrP13: Environmental improvement of
packaging .66
GrP14: Cleaner technology processes to make
savings .86
GrP15: Cooperation with supplier for
environmental objectives .72
GrP16: Use of environmental friendly source of
energy .64
GrP12: Informing consumers on
environmental-friendly products .64
Factor 2:
Compliance
Greening (CG)
0.60 GrP10: Processes to reduce air emissions .75
GrP7: Use of environmental friendly raw
materials .61
GrP9: Processes to reduce water use .71
GrP8: Processes to reduce solid wastes .81
Factor 3:
Ecological
Greening (EG)
0.63 GrP4: Use of waste of other companies .69
GrP3: Choosing suppliers by environmental
criteria .82
GrP2: Recovery of the end-of-life products .54
GrP1: Use of remanufacturing .55
5.7. Factor Confirmation
Before our model introduction and hypothesis testing, we inspect the measurement
properties, and validity of the latent constructs in this study (Qinghua Zhu, Sarkis, Cordeiro, &
Lai, 2007). To validate the measurement constructs of determinate variables of GrSCM practices

71
we employed CFA using AMOS. CFA were conducted separately in our SEM model with two sets
of constructs. For independent variables, the external pressures (i.e., foreign pressure external
(FPE), domestic pressure external (DPE)), and Internal factors (i.e., Human resources (HR),
Organization culture (OC), and Cost Pressure (CP)).
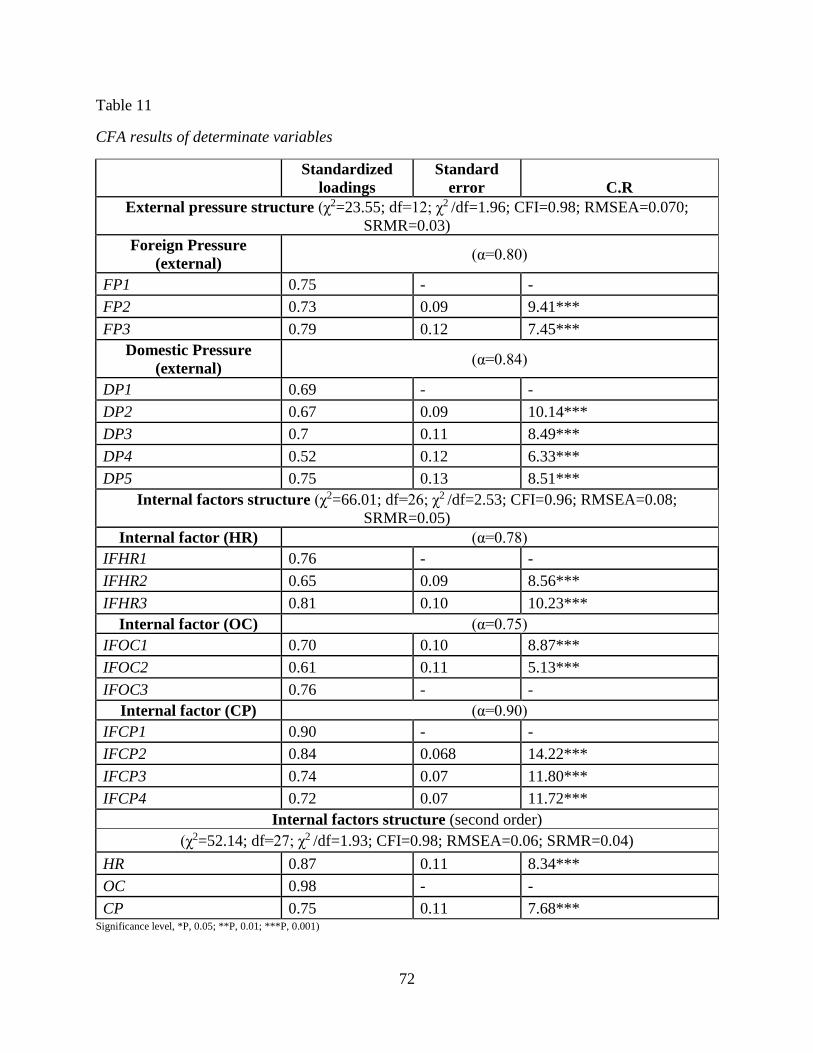
72
Table 11
CFA results of determinate variables
Standardized
loadings
Standard
error C.R
External pressure structure (χ2=23.55; df=12; χ2 /df=1.96; CFI=0.98; RMSEA=0.070;
SRMR=0.03)
Foreign Pressure
(external) (α=0.80)
FP1 0.75 - -
FP2 0.73 0.09 9.41***
FP3 0.79 0.12 7.45***
Domestic Pressure
(external) (α=0.84)
DP1 0.69 - -
DP2 0.67 0.09 10.14***
DP3 0.7 0.11 8.49***
DP4 0.52 0.12 6.33***
DP5 0.75 0.13 8.51***
Internal factors structure (χ2=66.01; df=26; χ2 /df=2.53; CFI=0.96; RMSEA=0.08;
SRMR=0.05)
Internal factor (HR) (α=0.78)
IFHR1 0.76 - -
IFHR2 0.65 0.09 8.56***
IFHR3 0.81 0.10 10.23***
Internal factor (OC) (α=0.75)
IFOC1 0.70 0.10 8.87***
IFOC2 0.61 0.11 5.13***
IFOC3 0.76 - -
Internal factor (CP) (α=0.90)
IFCP1 0.90 - -
IFCP2 0.84 0.068 14.22***
IFCP3 0.74 0.07 11.80***
IFCP4 0.72 0.07 11.72***
Internal factors structure (second order)
(χ2=52.14; df=27; χ2 /df=1.93; CFI=0.98; RMSEA=0.06; SRMR=0.04)
HR 0.87 0.11 8.34***
OC 0.98 - -
CP 0.75 0.11 7.68*** Significance level, *P, 0.05; **P, 0.01; ***P, 0.001)
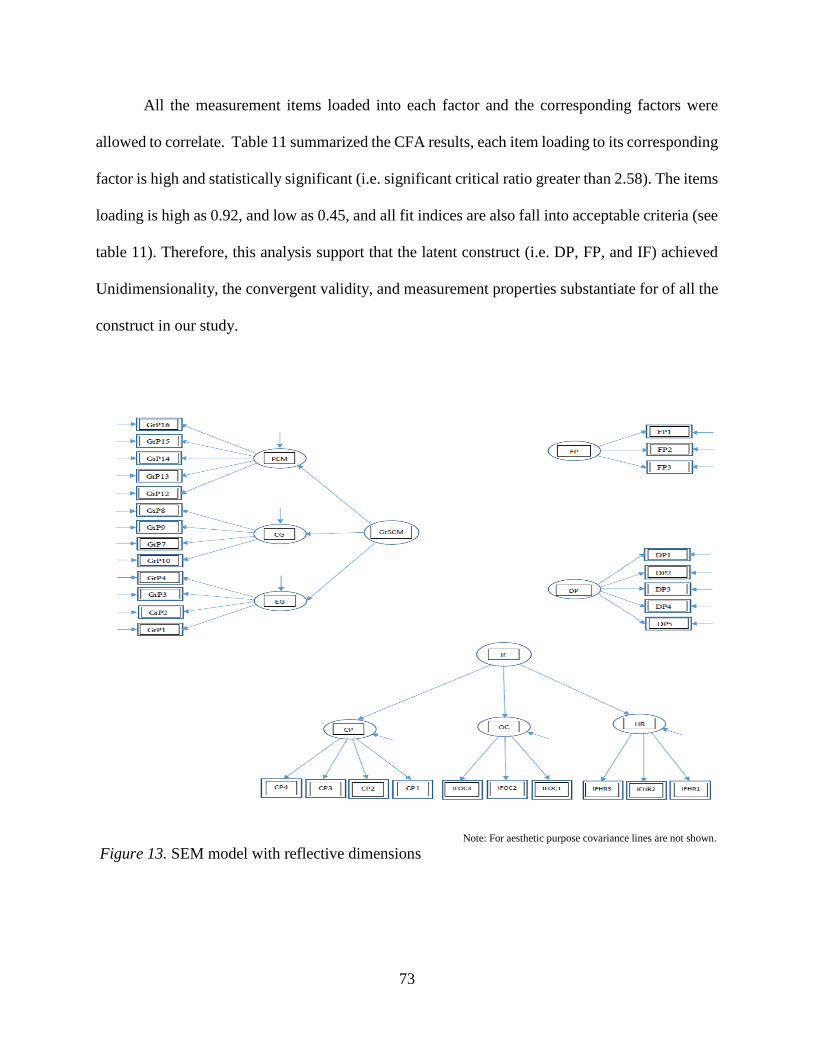
73
All the measurement items loaded into each factor and the corresponding factors were
allowed to correlate. Table 11 summarized the CFA results, each item loading to its corresponding
factor is high and statistically significant (i.e. significant critical ratio greater than 2.58). The items
loading is high as 0.92, and low as 0.45, and all fit indices are also fall into acceptable criteria (see
table 11). Therefore, this analysis support that the latent construct (i.e. DP, FP, and IF) achieved
Unidimensionality, the convergent validity, and measurement properties substantiate for of all the
construct in our study.
Note: For aesthetic purpose covariance lines are not shown.
Figure 13. SEM model with reflective dimensions
74
Churchill Jr (1979), argued that the model with multi-item scale reduces the measurement
error, improve the reliability and validity, and allows more variability among the survey
participants. Figure 15 shows the latent construct of both first order and second along with
measurement items. Before running the SEM model, we check the general assumptions of the
model (a). Multivariate normality (b). Multicollinearity (c) convergent and discriminant validity
(d) sample size (e) positive definiteness.
5.8. Multivariate Normality
Multivariate normality was assessed using Mahalanobis distance by using SPSS 22. The
Mahalanobis distance test estimates the distance in the multidimensional space of each observation
from the centroid, or the mean center of the observations. Any value greater than the Mahalanobis
critical value considered as outlier and should be removed before analysis. In this case, no outliers
were found.
5.9. Multicollinearity
In statistics, multicollinearity (also collinearity) is a phenomenon in which two or more
predictor variables in a multiple regression model are highly correlated, meaning that one can be
linearly predicted from the others with a substantial degree of accuracy. In this situation, a small
change in the data or model may lead to erratic changes in coefficient estimates. Within the sample
data set, multicollinearity only affects predictor’s calculations and does not reduce the reliability
or predictive power of the model. To detect for multicollinearity in a model many researchers
propose a proper detection of multicollinearity by calculating the variance inflation factor (VIF).
Tolerance = 1-𝑅𝑗2,
VIF =1/tolerance

75
Where 𝑅𝑗2 is the coefficient of determination of a regression of explanators j on all the other
explanators. Violating the assumption requires collinearity tolerance <0.10 and VIF > 10, or in
other words tolerance of less than 0.10 and VIF greater than 10 indicate multicollinearity. We
calculated both collinearity statistics by using SPSS 22 as shown in table 12.
Table 12
Collinearity statistics
Tolerance VIF
FP1 .399 2.509
FP2 .378 2.648
FP3 .528 1.893
DP1 .372 2.688
DP2 .465 2.153
DP3 .374 2.677
DP4 .394 2.536
DP5 .409 2.447
IFHR1 .421 2.373
IFHR2 .434 2.302
IFHR3 .446 2.241
IFOC1 .494 2.025
IFOC2 .478 2.092
IFOC3 .457 2.188
CP1 .285 3.505
CP2 .302 3.316
CP3 .274 3.654
CP4 .300 3.337
Moreover, our model is positive definitive since the determinant of the correlation matrix
we calculated is not equal to zero.
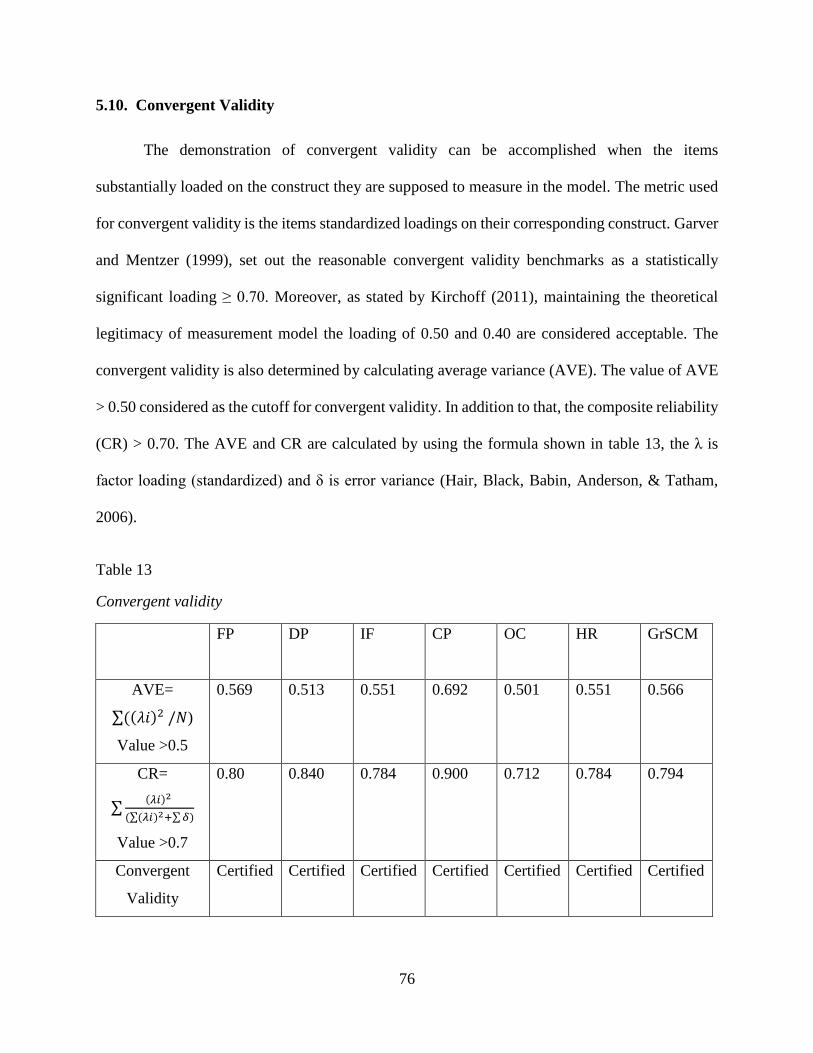
76
5.10. Convergent Validity
The demonstration of convergent validity can be accomplished when the items
substantially loaded on the construct they are supposed to measure in the model. The metric used
for convergent validity is the items standardized loadings on their corresponding construct. Garver
and Mentzer (1999), set out the reasonable convergent validity benchmarks as a statistically
significant loading ≥ 0.70. Moreover, as stated by Kirchoff (2011), maintaining the theoretical
legitimacy of measurement model the loading of 0.50 and 0.40 are considered acceptable. The
convergent validity is also determined by calculating average variance (AVE). The value of AVE
> 0.50 considered as the cutoff for convergent validity. In addition to that, the composite reliability
(CR) > 0.70. The AVE and CR are calculated by using the formula shown in table 13, the λ is
factor loading (standardized) and δ is error variance (Hair, Black, Babin, Anderson, & Tatham,
2006).
Table 13
Convergent validity
FP DP IF CP OC HR GrSCM
AVE=
∑((𝜆𝑖)2 /𝑁)
Value >0.5
0.569 0.513 0.551 0.692 0.501 0.551 0.566
CR=
∑(𝜆𝑖)2
(∑(𝜆𝑖)2+∑ 𝛿)
Value >0.7
0.80 0.840 0.784 0.900 0.712 0.784 0.794
Convergent
Validity
Certified Certified Certified Certified Certified Certified Certified
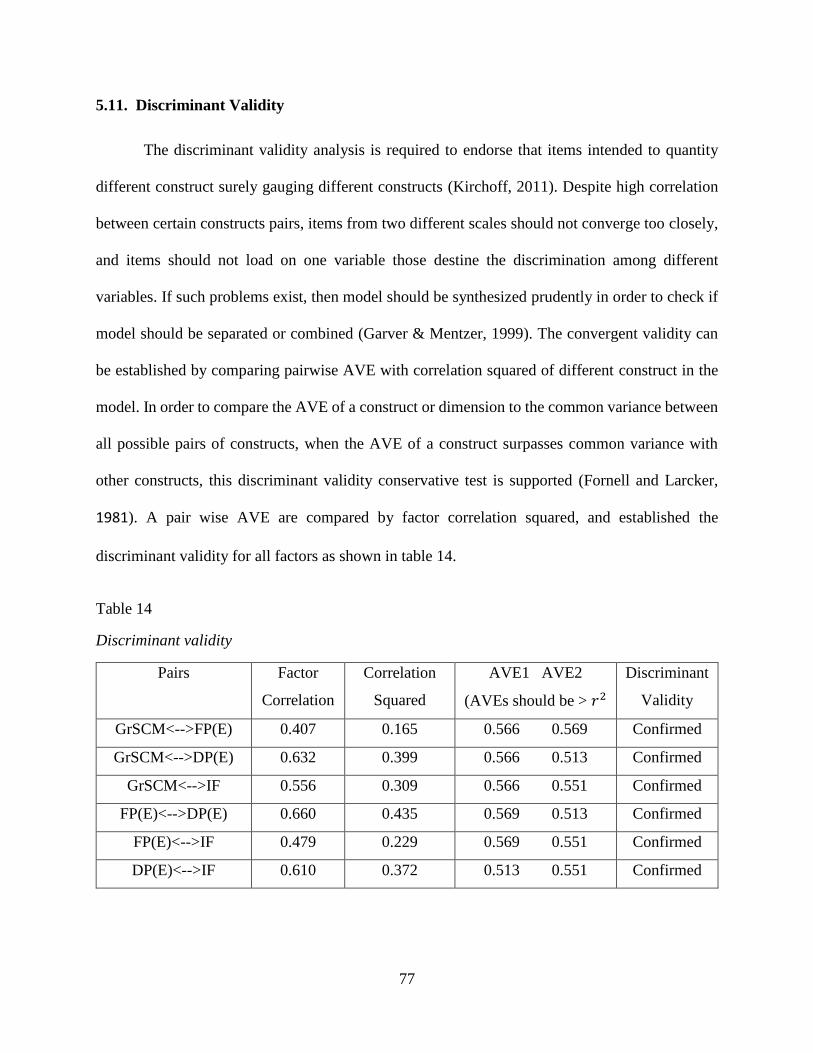
77
5.11. Discriminant Validity
The discriminant validity analysis is required to endorse that items intended to quantity
different construct surely gauging different constructs (Kirchoff, 2011). Despite high correlation
between certain constructs pairs, items from two different scales should not converge too closely,
and items should not load on one variable those destine the discrimination among different
variables. If such problems exist, then model should be synthesized prudently in order to check if
model should be separated or combined (Garver & Mentzer, 1999). The convergent validity can
be established by comparing pairwise AVE with correlation squared of different construct in the
model. In order to compare the AVE of a construct or dimension to the common variance between
all possible pairs of constructs, when the AVE of a construct surpasses common variance with
other constructs, this discriminant validity conservative test is supported (Fornell and Larcker,
1981). A pair wise AVE are compared by factor correlation squared, and established the
discriminant validity for all factors as shown in table 14.
Table 14
Discriminant validity
Pairs Factor
Correlation
Correlation
Squared
AVE1 AVE2
(AVEs should be > 𝑟2
Discriminant
Validity
GrSCM<-->FP(E) 0.407 0.165 0.566 0.569 Confirmed
GrSCM<-->DP(E) 0.632 0.399 0.566 0.513 Confirmed
GrSCM<-->IF 0.556 0.309 0.566 0.551 Confirmed
FP(E)<-->DP(E) 0.660 0.435 0.569 0.513 Confirmed
FP(E)<-->IF 0.479 0.229 0.569 0.551 Confirmed
DP(E)<-->IF 0.610 0.372 0.513 0.551 Confirmed
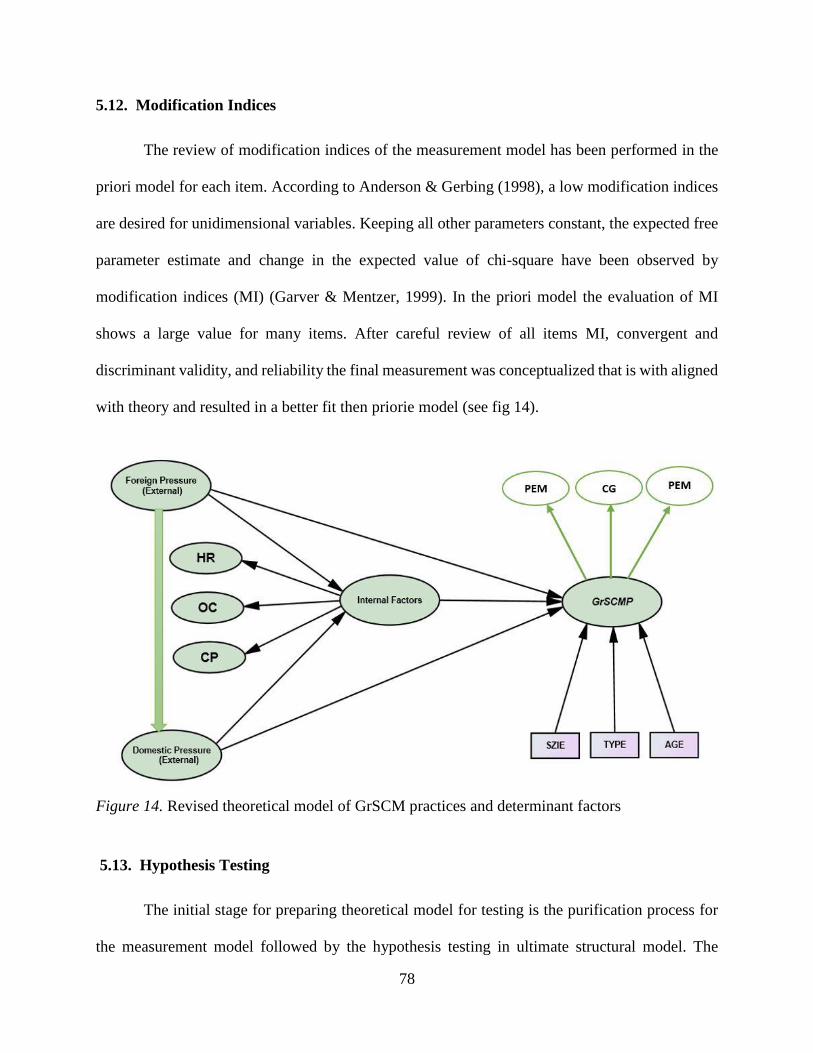
78
5.12. Modification Indices
The review of modification indices of the measurement model has been performed in the
priori model for each item. According to Anderson & Gerbing (1998), a low modification indices
are desired for unidimensional variables. Keeping all other parameters constant, the expected free
parameter estimate and change in the expected value of chi-square have been observed by
modification indices (MI) (Garver & Mentzer, 1999). In the priori model the evaluation of MI
shows a large value for many items. After careful review of all items MI, convergent and
discriminant validity, and reliability the final measurement was conceptualized that is with aligned
with theory and resulted in a better fit then priorie model (see fig 14).
Figure 14. Revised theoretical model of GrSCM practices and determinant factors
5.13. Hypothesis Testing
The initial stage for preparing theoretical model for testing is the purification process for
the measurement model followed by the hypothesis testing in ultimate structural model. The

79
ultimate model for this study shown in Figure 14 is identical to proposed model in Figure 5 with
two concessions: GrSCM practices have three dimensions (i.e. PEM, CG, and EG) and there is a
new path from foreign pressures to domestic pressures.
Significance: (*P, 0.05; **P, 0.01;***P, 0.001)
Figure 15. Result of direct connection model
The relationships between GrSCM and all three constructs in the direct relationship model
as shown in figure 17 (i.e. internal factor, foreign pressure, and domestic pressure) is statistically
significant. Association among GrSCM and Internal factor was strongest at the 0.001 level, while
the relationships with both foreign pressure, and domestic pressure are significant at the 0.01 level
(see fig 15).

80
5.13.1. Mediation
For testing mediation, the following conditions must be satisfied by the variables in
hypothesized relationships:
a. The explanatory variable should affect the dependent variable.
b. The mediator should have significant relationship with explanators.
c. There should be a significant association between mediator and dependent variable.
d. After regulating the mediator, the influence of explanators on dependent variable must
minimized.
In a hypothesized model if all of the above conditioned fulfilled and in the manifestation
of mediator the relationship of independent variable becomes in-significant then this is called
complete mediation, additionally with the same condition if the if relationship of independent and
dependent remains significant then this is called partial mediation. Moreover if there is
noncompliance of any of these condition then we can conclude that there is no mediation (Baron
& Kenny, 1986; Tepper, Shafer, Meredith, & Marsh, 1996).
The exploration of mediation can be done by various techniques such 1) correlation
statistics 2) hierarchical regression as discussed by da Silveira and Arkader (2007), and Ho, Duffy,
and Shih (2001). According to Hopwood (2007), the drawback of using regression for testing
mediation is snags in demonstrating causation and possible reverse causation due to measurement
error in the mediator scores. In order to rectify these problems SEM has been recommended. SEM
diminishes the measurement error to address the problem through the application of latent
variables. As stated by Hopwood (2007), when testing for mediation latent characteristics of SEM
also mitigate the apprehensions of method effects may be tangled with real fundamental results.
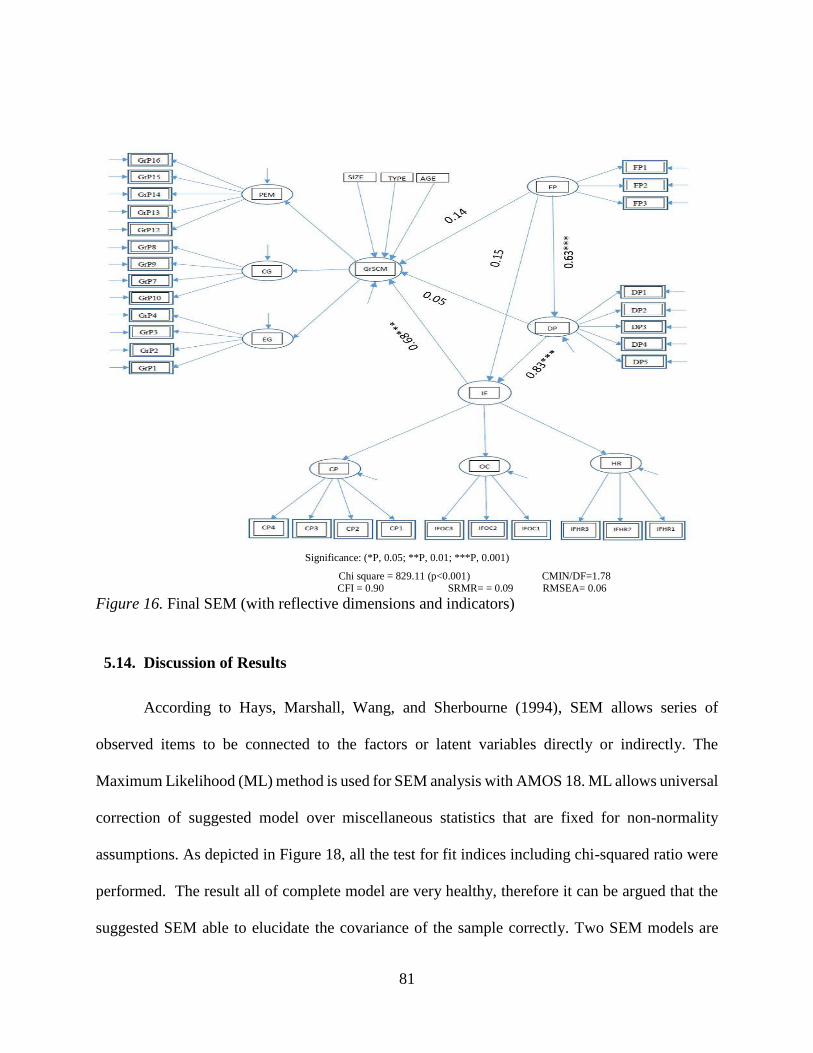
81
Significance: (*P, 0.05; **P, 0.01; ***P, 0.001)
Chi square = 829.11 (p<0.001) CMIN/DF=1.78 CFI = 0.90 SRMR= = 0.09 RMSEA= 0.06
Figure 16. Final SEM (with reflective dimensions and indicators)
5.14. Discussion of Results
According to Hays, Marshall, Wang, and Sherbourne (1994), SEM allows series of
observed items to be connected to the factors or latent variables directly or indirectly. The
Maximum Likelihood (ML) method is used for SEM analysis with AMOS 18. ML allows universal
correction of suggested model over miscellaneous statistics that are fixed for non-normality
assumptions. As depicted in Figure 18, all the test for fit indices including chi-squared ratio were
performed. The result all of complete model are very healthy, therefore it can be argued that the
suggested SEM able to elucidate the covariance of the sample correctly. Two SEM models are
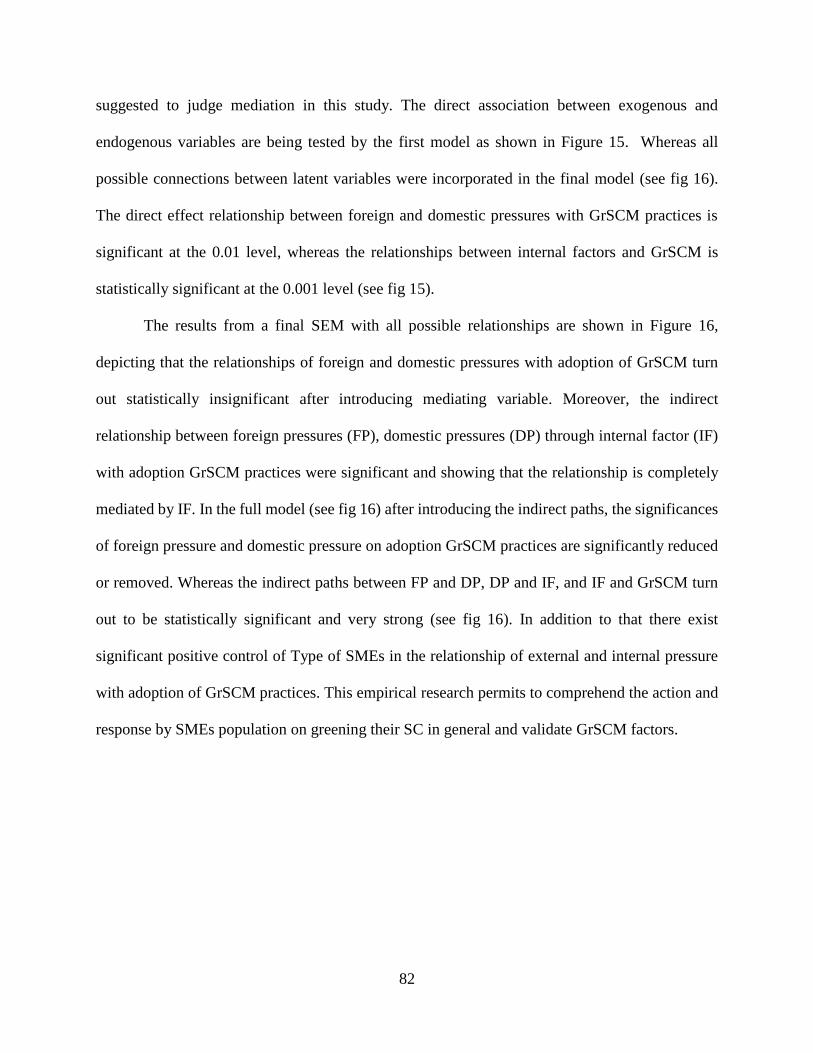
82
suggested to judge mediation in this study. The direct association between exogenous and
endogenous variables are being tested by the first model as shown in Figure 15. Whereas all
possible connections between latent variables were incorporated in the final model (see fig 16).
The direct effect relationship between foreign and domestic pressures with GrSCM practices is
significant at the 0.01 level, whereas the relationships between internal factors and GrSCM is
statistically significant at the 0.001 level (see fig 15).
The results from a final SEM with all possible relationships are shown in Figure 16,
depicting that the relationships of foreign and domestic pressures with adoption of GrSCM turn
out statistically insignificant after introducing mediating variable. Moreover, the indirect
relationship between foreign pressures (FP), domestic pressures (DP) through internal factor (IF)
with adoption GrSCM practices were significant and showing that the relationship is completely
mediated by IF. In the full model (see fig 16) after introducing the indirect paths, the significances
of foreign pressure and domestic pressure on adoption GrSCM practices are significantly reduced
or removed. Whereas the indirect paths between FP and DP, DP and IF, and IF and GrSCM turn
out to be statistically significant and very strong (see fig 16). In addition to that there exist
significant positive control of Type of SMEs in the relationship of external and internal pressure
with adoption of GrSCM practices. This empirical research permits to comprehend the action and
response by SMEs population on greening their SC in general and validate GrSCM factors.
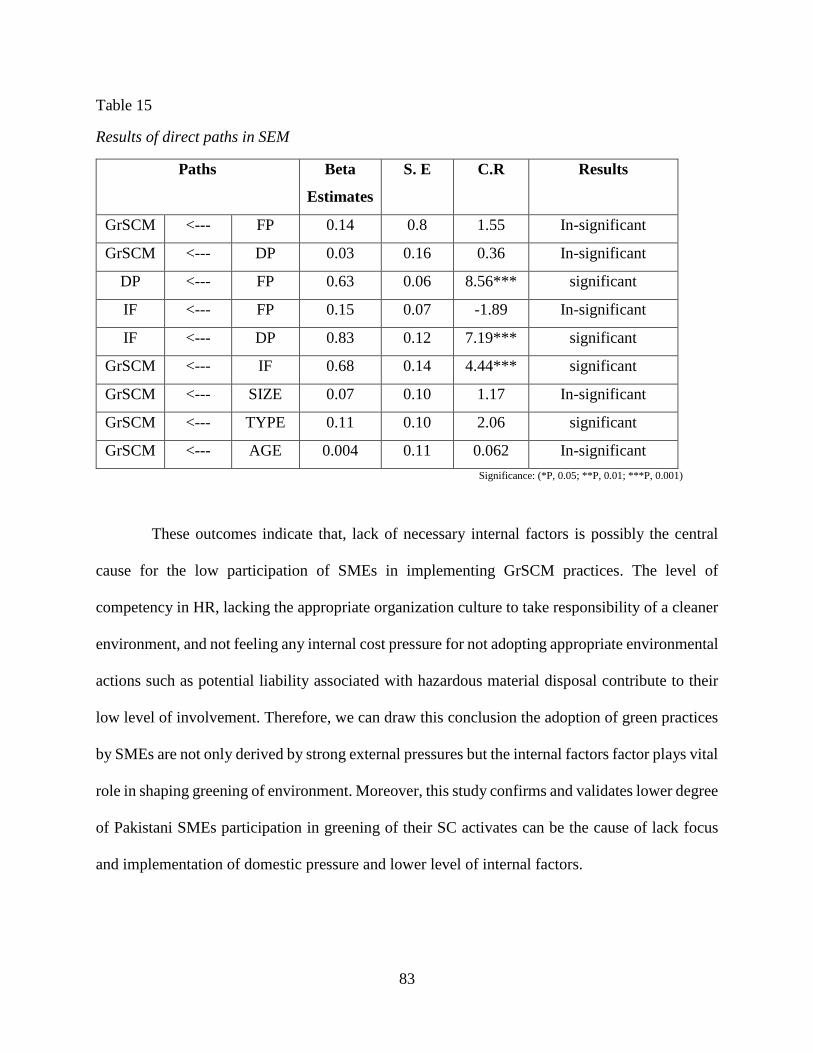
83
Table 15
Results of direct paths in SEM
Paths Beta
Estimates
S. E C.R Results
GrSCM <--- FP 0.14 0.8 1.55 In-significant
GrSCM <--- DP 0.03 0.16 0.36 In-significant
DP <--- FP 0.63 0.06 8.56*** significant
IF <--- FP 0.15 0.07 -1.89 In-significant
IF <--- DP 0.83 0.12 7.19*** significant
GrSCM <--- IF 0.68 0.14 4.44*** significant
GrSCM <--- SIZE 0.07 0.10 1.17 In-significant
GrSCM <--- TYPE 0.11 0.10 2.06 significant
GrSCM <--- AGE 0.004 0.11 0.062 In-significant
Significance: (*P, 0.05; **P, 0.01; ***P, 0.001)
These outcomes indicate that, lack of necessary internal factors is possibly the central
cause for the low participation of SMEs in implementing GrSCM practices. The level of
competency in HR, lacking the appropriate organization culture to take responsibility of a cleaner
environment, and not feeling any internal cost pressure for not adopting appropriate environmental
actions such as potential liability associated with hazardous material disposal contribute to their
low level of involvement. Therefore, we can draw this conclusion the adoption of green practices
by SMEs are not only derived by strong external pressures but the internal factors factor plays vital
role in shaping greening of environment. Moreover, this study confirms and validates lower degree
of Pakistani SMEs participation in greening of their SC activates can be the cause of lack focus
and implementation of domestic pressure and lower level of internal factors.
84
The test statistic for indirect effect is calculated by the following formulas presented by
Sobel (1982).
Z= 𝑎𝑏/√(𝑎2𝑆𝐸𝑎2 + 𝑏2𝑆𝐸𝑏
2)
Z= 𝑎𝑏𝑐/√(𝑎2𝑆𝐸𝑎2 + 𝑏2𝑆𝐸𝑏
2 + 𝑐2𝑆𝐸𝑐2)
Whereas a, b, and c are unstandardized path coefficients and SE is the standard error
attached to each regression weight. The result is interpreted as a z-score so that Z>1.96 is
significant at 0.05 level, and Z>2.58 is significant at the 0.01 level. Moreover, if all the paths in
the chain that make up an indirect effect are statistically significant, then the entire indirect effect
is assumed to be significant.
Table 16
Results of indirect paths in SEM
Indirect Paths Beta
Estimates
C.R Results
GrSCM<---IF<---DP<---FP 0.36 2.017* significant
GrSCM<---IF<---FP 0.10 1.73 In-significant
GrSCM<---IF<---DP 0.568 3.78** significant
GrSCM<---DP<---FP 0.0315 0.36 In-significant
Significance: (*P, 0.05; **P, 0.01; ***P, 0.001)
The final model has better fit indices and was acceptable (Chi square = 829.11;
CMIN/DF=1.78; CFI = 0.90; SRMR= = 0.09; RMSEA= 0.06). The CFI meets the threshold of
0.90, the chi square/df ratio of 1.78 is in the tolerable range. Moreover, the RMSEA value is 0.06
is also within the acceptable range, as is the SRMR of 0.09.

85
The results of this study provide the empirical evidence that the adoption of green practices
by SMEs in Pakistan are majorly determined by external factors (i.e. foreign, and domestic
pressures) and completely mediated by internal factors, although the greening of SC is in initial
phase. The mediation of internal factors established that the implementation of green practices was
greatly dependent on SMEs internal business environment such as HR, OC, and CP. In order to
positively response foreign and domestic pressure related to environment the internal capacity of
SMEs should be enhanced. When there are foreign pressures for adopting green practices, the
hypothesis testing found no support for adoption of green practices until and unless domestic
pressures are in place. Apart from the importance of internal factors, domestic pressures play a
significant motivation for SMEs to adopt green practices in Pakistan. The learning capacity of
SMEs can play significantly positive role in transforming the traditional SC in to green SC.
86
CHAPTER 6. CONCLUSIONS
6.1. Overview
This study set forth to probe the GrSCM practices adopted by SMEs in Pakistan in
response to the global greening issue and to explore the determinant factors for adoption of
GrSCM practices by identifying and addressing the following gaps in the literature: 1) the dearth
of attention on classification of external determinants (factors) into ‘foreign pressure’ and domestic
pressure especially in the SME’s sector; 2) “internal factors” including human resources,
organization culture , and cost pressure related to GrSCM ; 3) lack of research on the internal
factors mediation in the association between domestic and foreign pressures with GrSCM in
developing economies, like Pakistan; and 4) the limited literature on GrSCM practices of SMEs in
developing economies. Additionally, GrSCM is one of the major themes in recent environmental
management studies, very little is known about the factors that encourage GrSCM adoption in
SMEs. To close this gap, this study analyzed the influence of several relevant determinants
constructs (i.e. foreign pressure, domestic pressure, and internal factors) for adoption of GrSCM.
For this purpose, we explored the green practices adopted by SMEs in Pakistan and found
an appropriate construct to measure the level of GrSCM involvement of these SMEs. After careful
analysis by exploratory and confirmatory factor analysis we came up with 13 item measurement
scale for practitioners to estimate diverse facet of GrSCM adoption by SMEs. The empirical results
from exploratory, and confirmatory factor analysis suggested a three-dimension structure (i.e.
PEM, CG, and EG) to measure the adoption of GrSCM practices by SMEs in Pakistan. The total
number of activities in these dimensions are 13. The SMEs desiring to increase their level of
involvement in GrSCM practices need to constantly monitor these three underlying factors (i.e.
PEM, CG, EG). Moreover, the measurement scale established in this dissertation can be applied
87
as a self-diagnostic instrument for identifying the areas in supply chain that requires improvement
or additional application.
Furthermore, identifying the determinants of GrSCM practices for SMEs and mediation
testing of internal factors in the association of foreign and domestic pressure with the adoption of
GrSCM practices were also major parts of this dissertation. This study explored the determinant
factors of GrSCM practices adopted by SMEs in Pakistan, the construct of determinant factors was
identified with the help of previous studies in the area of GrSCM (de Sousa Jabbour et al., 2013;
Mohanty & Prakash, 2014; Q. Zhu, J. Sarkis, & K.-h. Lai, 2012; Q. H. Zhu, J. Sarkis, et al., 2012).
The item structures in previous studies for cost pressure (Qinghua Zhu et al., 2007), for human
resources (Daily & Huang, 2001), and organization culture led the confirmatory factor analysis,
and revealed internal factors as second order measures for the three first order constructs (i.e. HR,
OC, and CP). The external actors/pressures were grouped as foreign and domestic pressures (Q.
Zhu et al., 2012).
The significant outcome this analysis was that the empirical evidence for mediating role of
internal factors and domestic pressures in the hypothesized relationship. As it is evident from
results that foreign pressures (FP) were mediated by domestic pressures (DP), and DP are mediated
by internal factors. The understanding of the indirect (chain of relationship) from foreign to
domestic and to internal factors in adoption of GrSCM is very important. This means that without
the presence of domestic pressures SMEs are less likely to adopt GrSCM practices such as
domestic competition, domestic environmental laws and regulations, government environmental
policy, and neighboring communities playing a major role in transforming environmental actions.

88
Furthermore, the results of this study specify that internal factors mediate the association
among pressure (foreign and domestic) from stakeholders with green practices. These results
demonstrate that the adoption of green practices by SMEs in response to external pressure depends
on internal factors such as organizational culture, cost pressure, and human resources. Therefore,
to positively respond to external pressure the development of SMEs’ capacities (tangible and
intangible) is deemed very important and without incorporating these internal factors these
external pressures may go unheeded. Moreover, the internal factors function as dual role such as
the motivator, and required capacity for adopting GrSCM practices. According to (Johansson,
2002), for environmentally friendly design, innovative companies need technical personnel.
Moreover, Boks (2006) argued that the by building human resource capacity the chances of
implementing green practices in SC significantly increased.
Our examination possibly provides a vital course of action towards promoting GrSCM
practices in SMEs of Pakistan. It is indispensable for SMEs to understand the benefits of GrSCM
practices, as they are the major contributors to environmental degradation in the country. There is
greater need to educate these SMEs on the approaches and advantages of greening their supply
chain. The empirical evidence from this research will contribute and support this objective, and it
will assist in increasing their motivation to adopt GrSCM practices.
6.2. Contributions
Varadarajan (2003), argued that academic investigation should fill exiting gap in literature,
and extend the current body of knowledge for managers and researchers. The results from this
study add to existing literature of GrSCM practices, determinates factors for adoption GrSCM
practices, and the mediating role of internal factors in SMEs.

89
6.2.1. Theoretical Suggestions
The study of external pressure as foreign and domestic in the hypothesized model as
compared to previous studies, such as Mohanty and Prakash (2014) and X. B. Liu et al. (2012)
which did not distinguished pressures as foreign and domestic; and building the second order
construct for internal factors to test the mediation in this study add value and a new demission to
the current literature on adoption of GrSCM practices by SMEs. In the previous literature,
complete empirical testing was lacking. The outcomes furnish the evidence of indirect linkages
from foreign pressures to domestic pressure, and from domestic to internal factors to adoption of
green practices. The conceptual and quantitative research of GrSCM practice adoption was
extended by evidence that SMEs with a competent level of HR, positive OC, and significant CP
are more likely to adopt GrSCM practices and are in a better position to respond to external
pressure to remain competitive.
6.2.2. Measuring GrSCM as a Second Order Construct with Three First-Order Dimensions
Previously GrSCM practices adoption was measured as a second-order construct with six
dimensions: “reverse logistics greening, inbound greening, compliance greening, ecological
greening, outbound greening, and technological greening” for micro, small and medium
enterprises (R. P. Mohanty & A. Prakash, 2013). Moreover, some suggested a second-order
construct with five dimensions: “internal environmental management, green purchasing,
cooperation with customers including environmental requirements, eco design, and investment
recovery” (Q. H. Zhu & Sarkis, 2004; Q. H. Zhu et al., 2008). This study came up with only three
dimensions i.e. proactive environment management, compliance greening, and ecological
greening, after the EFA and CFA analysis by using data collect from the SME sector of Pakistan.
90
The other dimensions as suggested by R. P. Mohanty & A. Prakash (2013), were not confirmed ,
instead the findings show that many items collapsed onto a single dimension.
6.2.3. Managerial Suggestions
Former studies in the area of green SC management have debated numerous issues. This
study adds knowledge by exploring the critical green practices and the vital determinant factors of
GrSCM practices adoption in the SME sector of Pakistan, in addition to providing a different
construct for operationalizing the GrSCM practices. Policymakers and SC managers can benefit
by gauging green practice levels in intra and inter firm SC, this study offers a better understanding
and a framework for evaluating their present GrSCM adoption capabilities and initiatives. The
confirmation of the mediating role of internal factors in response to external pressure on
environmental issues also helps managers to better understand the implementation of a green SC.
Moreover, Hart (1995), argued that a proactive environmental policy pursues the goal of
creating value, and gaining competitive advantage by continuous improvement of green
performance throughout its operation. Moreover, the preemptive environmental management
approach by executives to evaluate the green strategies in their companies SC and enforcing the
green strategy, the companies are more likely to gain competitive advantage and realize more
monetary benefits.
GrSCM can be seen as a development tool for SMEs to make them structurally healthier
and more effective. There is potential to gain competitive advantages by adopting green practices.
This study has considered the determining reasons of GrSCM adoption classified as ‘Foreign
Pressure’, mostly related to international environmental laws and regulations, foreign customers,
and foreign competitors; ‘Domestic Pressures’, mostly related to domestic environmental laws and
regulations, government environment policy, domestic customer, domestic competitors, and
91
NGO’s/Neighboring communities; and ‘Internal Pressures’ as ‘HR’ comprised of team work,
employees education levels , and recurrence of internal environment training; ‘OC’, comprised of
companies environmental mission, amount of support from executives , and cross-functional
cooperation for environmental improvement; and ‘CP’, “cost for disposal of hazardous material”,
cost of environmentally friendly goods, cost of environmentally friendly packages, and potential
liability for disposal of hazardous material”. The results demonstrate the low level of GrSCM
practices involvement by SMEs in Pakistan can be attributed to a lack of the necessary external
and internal pressures. Therefore, there is a need for aggressive implementation of domestic laws
and regulations related to the environment. Additionally, managers of SMEs need to become better
educated in developing collaborative relationships with regulators, customers (both domestic and
international), neighboring communities, and major challengers in the same industry for collective
greening. The ability for executing inventive ecological approaches can be boosted by improving
internal factors dimensions such as HR, organizational culture, and understanding the cost
structure associated with each activity in the SC.
6.3. Limitations and Future Research Directions
The designs and methods used in any research have strengths and weaknesses (McGrath
1982). According to Kirchoff (2011), the generalizability of findings can be maximized by using
survey methodology, whereas on the flip side sanity of the context and precision is weaker.
Precaution was taken while carrying out this study to make sure that respondent with knowledge
and understanding of their position in the firm respond to the questionnaire. Inorder to ensure the
applicability and salient for respondent the phrasing of surveys questionaries’ prudently edited in
both stages i.e. development and after pre-testing.

92
This research has some key limitations. Firstly, the profundity achieved through Likert-
scale survey is limited. This study was incapable to apprehend any supplementary facts that might
narrate the under-investigation phenomenon. For instance, to understand the respondent view on
other type of GrSCM practices, their opinions on different constraints for adoption of green
practices, and how it can benefit their organization would be very interesting. These responses
may be very helpful in providing additional material to better understand the construct relationship
in theoretical model.
Managers’ insight of the GrSCM phenomenon and causes for adoption of green practices
were the prime focus of this dissertation. Nevertheless, for complete view it is important to
understand and track specific phase evaluation of this phenomenon over the period of time because
GrSCM is predominantly a developing concept and executive attitude both in short and long-term
may vary significantly.
Moreover, the additional imperative question is how to deliberate the effects of adoption
of GrSCM activities. Investigating whether this effect is positive or negative, and how the
implementation of green practices brings changes in performance of SMEs, since in this
dissertation we are only investigating the implementation of GrSCM practices and their
determinants. The study on subsequent performance outcomes may add more value, greater
motivation, and understanding the importance of green practices to SMEs. A case study might be
best option for conducting this type of research.
Another limitation of this study is construct and sample size. The low online response
forced us to collect data through a third party, due to cost factors we had a smaller sample size, but
still within the acceptable range for applying SEM. If we had a larger sample size, that could have
given us more robust results. Additionally, the study including the respondent from both developed
93
and developing countries may advance the generalizability, external reliability, and comprehend
the true attitudes of managers.
According to DeVellis (1991), the authentication of measurement scale is an ongoing
procedure and legitimacy is proven only over a sequence of investigation that advance, improve
and test items on multiple countries and companies. Therefore, on instrumentation of adopting
GrSCM there exist a wide scope for future research, moreover these measurements can grow and
evolve into a lot of new areas assist the building and validation of theories. Additionally, another
research direction can be a comparisons study of GrSCM practices adoption between countries,
inorder to determine model construct is robust culturally and the measurement scale is a steady fit
regardless of different countries. Furthermore, the exploration of the interaction effect of the
different construct of external and internal factors on adoption GrSCM practices would be very
interesting.
94
REFERENCES
Anderson, J. C., & Gerbing, D. W. (1982). Some methods for respecifying measurement models
to obtain unidimensional construct measurement. Journal of marketing research, 453-460.
Anderson, J. C., & Gerbing, D. W. (1988). Structural equation modeling in practice: A review and
recommended two-step approach. Psychological bulletin, 103(3), 411.
Atlas, M., & Florida, R. (1998). Green manufacturing. Handbook of Technology Management,
1385-1393.
Baron, R. M., & Kenny, D. A. (1986). The moderator–mediator variable distinction in social
psychological research: Conceptual, strategic, and statistical considerations. Journal of
personality and social psychology, 51(6), 1173.
Bauman, Z. (2004). New Frontiers and Universal Values. URL: http://urban. cccb. org.
Beamon, B. M. (1999). Designing the green supply chain. Logistics information management,
12(4), 332-342.
Bianchi, C., & Winch, G. W. (2006). Unleashing growth potential in'stunted'SMEs: insights from
simulator experiments. International Journal of Entrepreneurship and Small Business,
3(1), 92-105.
Birou, L. M., Fawcett, S. E., & Magnan, G. M. (1998). The product life cycle: a tool for functional
strategic alignment. International Journal of Purchasing and Materials Management,
34(1), 37-52.
Boks, C. (2006). The soft side of ecodesign. Journal of cleaner production, 14(15), 1346-1356.
Bowen, F. E., Cousins, P. D., Lamming, R. C., & Faruk, A. C. (2001). The role of supply
management capabilities in green supply. Production and operations management, 10(2),
174-189.
Brundtland, G. H. (1987). Report of the World Commission on environment and development:"
our common future.": United Nations.
Carter, C. R., & Ellram, L. M. (1998). REVERSE LOGISTICS--A REVIEW OF THE
LITERATURE AND FRAMEWORK FOR FUTURE INVESTIGATION. Journal of
Business logistics.
Chien, M.-K. (2014). Influences of green supply chain management practices on organizational
sustainable performance. International Journal of Environment Monitoring and
Protection, 12-23.
95
Churchill Jr, G. A. (1979). A paradigm for developing better measures of marketing constructs.
Journal of marketing research, 64-73.
Cooke, P., & Wills, D. (1999). Small firms, social capital and the enhancement of business
performance through innovation programmes. Small Business Economics, 13(3), 219-234.
doi:Doi 10.1023/A:1008178808631
Cowling, K., & Sugden, R. (1999). The wealth of localities, regions and nations: developing
multinational economies. New political economy, 4(3), 361-378.
da Silveira, G. J., & Arkader, R. (2007). The direct and mediated relationships between supply
chain coordination investments and delivery performance. International Journal of
Operations & Production Management, 27(2), 140-158.
Daily, B. F., & Huang, S. C. (2001). Achieving sustainability through attention to human resource
factors in environmental management. International Journal of Operations & Production
Management, 21(12), 1539-1552. doi:Doi 10.1108/01443570110410892
de Sousa Jabbour, A. B. L., Jabbour, C. J. C., Govindan, K., Kannan, D., Salgado, M. H., & Zanon,
C. J. (2013). Factors affecting the adoption of green supply chain management practices in
Brazil: empirical evidence. International Journal of Environmental Studies, 70(2), 302-
315.
DeVellis, R. F. (1991). Guidelines in scale development. Scale Development: Theory and
Applications. Newbury Park, Calif: Sage, 5191.
DiMaggio, P. J., & Powell, W. W. (2000). The iron cage revisited-Institutional isomorphism and
collective rationality in organizational fields (Reprinted from the American Sociological
Association vol 48, pg 147-160, 1983) (Vol. 17, pp. 143-166): JAI PRESS INC 100
PROSPECT STREET, STAMFORD, CT 06901-1640 USA.
Doonan, J., Lanoie, P., & Laplante, B. (2005). Determinants of environmental performance in the
Canadian pulp and paper industry: An assessment from inside the industry. Ecological
Economics, 55(1), 73-84. doi:10.1016/j.ecolecon.2004.10.017
Drumwright, M. E. (1994). Socially Responsible Organizational Buying - Environmental Concern
as a Noneconomic Buying Criterion. Journal of Marketing, 58(3), 1-19. doi:Doi
10.2307/1252307
Elkington, J. (1999). The triple bottom line: Implications for the oil industry. Oil & Gas Journal,
97(50), 139-141.
Fiksel, J. (1996). Design for environment: creating eco-efficient products and processes: McGraw-
Hill New York.
96
Flynn, B. B., Schroeder, R. G., & Sakakibara, S. (1994). A framework for quality management
research and an associated measurement instrument. Journal of Operations Management,
11(4), 339-366.
Garver, M. S., & Mentzer, J. T. (1999). Logistics research methods: employing structural equation
modeling to test for construct validity. Journal of Business logistics, 20(1), 33.
George, D., & Mallery, M. (2003). Using SPSS for Windows step by step: a simple guide and
reference.
Goldberg, C., & Jonsson, G. (2009). Exploring a Swedish SME entering the Congolese Electricity
Market: A Case Study of PPC Engineering AB.
Green, K., Morton, B., & New, S. (1998). Green purchasing and supply policies: do they improve
companies’ environmental performance? Supply Chain Management: An International
Journal, 3(2), 89-95.
Guiffrida, A. L., Datta, P., Kim, I., & Min, H. (2011). Measuring supply chain efficiency from a
green perspective. Management Research Review, 34(11), 1169-1189.
Gunningham, N., Kagan, R. A., & Thornton, D. (2003). Shades of green: business, regulation, and
environment: Stanford University Press.
Hair, J. F., Anderson, R. E., Tatham, R. L., & William, C. (1998). Black (1998), Multivariate data
analysis: Upper Saddle River, NJ: Prentice Hall.
Hair, J. F., Black, W. C., Babin, B. J., Anderson, R. E., & Tatham, R. L. (2006). Multivariate data
analysis (Vol. 6): Upper Saddle River, NJ: Pearson Prentice Hall.
Hall, J. (2000). Environmental supply chain dynamics. Journal of cleaner production, 8(6), 455-
471.
Hall, J., & Clark, W. W. (2003). Special Issue: Environmental innovation. Journal of cleaner
production, 11(4), 343-346. doi:10.1016/S0959-6526(02)00070-7
Handfield, R., Sroufe, R., & Walton, S. (2005). Integrating environmental management and supply
chain strategies. Business Strategy and the Environment, 14(1), 1-19.
Hart, S. L. (1995). A Natural-Resource-Based View of the Firm. Academy of management review,
20(4), 986-1014. doi:Doi 10.2307/258963
Hays, R. D., Marshall, G. N., Wang, E. Y. I., & Sherbourne, C. D. (1994). Four-year cross-lagged
associations between physical and mental health in the Medical Outcomes Study. Journal
of consulting and clinical psychology, 62(3), 441.

97
Hendrickson, C., Conway-Schempf, N., Lave, L., & McMichael, F. (1997). Introduction to green
design. Manuscript. Green Design Initiative. Carnegie Mellon University. Pittsburgh, PA.
Henriques, I., & Sadorsky, P. (1996). The determinants of an environmentally responsive firm: An
empirical approach. Journal of environmental economics and management, 30(3), 381-
395. doi:DOI 10.1006/jeem.1996.0026
Hervani, A. A., Helms, M. M., & Sarkis, J. (2005). Performance measurement for green supply
chain management. Benchmarking: An International Journal, 12(4), 330-353.
Hettige, H., Huq, M., Pargal, S., & Wheeler, D. (1996). Determinants of pollution abatement in
developing countries: evidence from South and Southeast Asia. World Development,
24(12), 1891-1904.
Ho, D., Duffy, V., & Shih, H. (2001). Total quality management: an empirical test for mediation
effect. International Journal of Production Research, 39(3), 529-548.
Hopwood, C. J. (2007). Moderation and mediation in structural equation modeling: Applications
for early intervention research. Journal of Early Intervention, 29(3), 262-272.
Hoshino, T., Yura, K., & Hitomi, K. (1995). Optimization Analysis for Recycle-Oriented
Manufacturing Systems. International Journal of Production Research, 33(8), 2069-2078.
doi:Doi 10.1080/00207549508904802
Hutchinson, V., & Quintas, P. (2008). Do SMEs do knowledge management? Or simply manage
what they know? International Small Business Journal, 26(2), 131-154.
Johansson, G. (2002). Success factors for integration of ecodesign in product development: a
review of state of the art. Environmental Management and Health, 13(1), 98-107.
Johansson, G., & Winroth, M. (2009). Lean vs. Green manufacturing: Similarities and differences.
Paper presented at the Proceedings of the 16th International Annual EurOMA Conference,
Implementation Realizing Operations Management Knowledge, Göteborg, Sweden.
Kearney, M. (2004). Walking the walk? Community participation in HIA: A qualitative interview
study. Environmental Impact Assessment Review, 24(2), 217-229.
Kirchoff, J. F. (2011). A resource-based perspective on green supply chain management and firm
performance.
Kline, P. (1999). The handbook of psychological testing routledge: London.
Kuei, C. H., & Lu, M. H. (2013). Integrating quality management principles into sustainability
management. Total Quality Management & Business Excellence, 24(1-2), 62-78.
doi:10.1080/14783363.2012.669536
98
Lacroix, R. (2008). Green Procurement and Entrepreneurship. Harokopeio University.
Lages, L. F., & Montgomery, D. B. (2004). Export performance as an antecedent of export
commitment and marketing strategy adaptation: Evidence from small and medium-sized
exporters. European Journal of Marketing, 38(9/10), 1186-1214.
Lamond, D., Dwyer, R., Huang, Y.-C., & Jim Wu, Y.-C. (2010). The effects of organizational
factors on green new product success: evidence from high-tech industries in Taiwan.
Management Decision, 48(10), 1539-1567.
Linton, J., Klassen, R., & Jayaraman, V. (2007). Sustainable Supply Chains: An engine
remanufacturing. Journal of cleaner production, 15(11), 1147-1157.
Liu, X., Wang, L., Dong, Y., Yang, J., & Bao, C. (2011). Case studies of green supply chain
management in China. International Journal of Economics and Management Engineering
(IJEME), 1(1), 22-34.
Liu, X. B., Yang, J., Qu, S. X., Wang, L. N., Shishime, T., & Bao, C. K. (2012). Sustainable
Production: Practices and Determinant Factors of Green Supply Chain Management of
Chinese Companies. Business Strategy and the Environment, 21(1), 1-16.
doi:10.1002/bse.705
Lukács, E. (2005). The economic role of SMEs in world economy, especially in Europe. European
Integration Studies(1 (4), 3-12.
Madu, C. N., & Madu, A. A. (2002). Dimensions of e-quality. International Journal of Quality &
reliability management, 19(3), 246-258.
Markovits-Somogyi, R., Nagy, Z., & Török, Á. (2009). Greening supply chain management. Acta
Technica Jaurinensis, 2(3).
Marsh, H. W., Balla, J. R., & McDonald, R. P. (1988). Goodness-of-fit indexes in confirmatory
factor analysis: The effect of sample size. Psychological bulletin, 103(3), 391.
Matopoulos, A., & Bourlakis, M. (2010). Sustainability practices and indicators in food retail
logistics: findings from an exploratory study. Journal on Chain and Network Science,
10(3), 207-218. doi:10.3920/JCNS2010.x179
Medsker, G. J., Williams, L. J., & Holahan, P. J. (1994). A review of current practices for
evaluating causal models in organizational behavior and human resources management
research. Journal of Management, 20(2), 439-464.
Mentzer, J. T., DeWitt, W., Keebler, J. S., Min, S., Nix, N. W., Smith, C. D., & Zacharia, Z. G.
(2001). Defining supply chain management. Journal of Business logistics, 22(2), 1-25.

99
Min, H., & Galle, W. P. (1997). Green purchasing strategies: trends and implications. International
Journal of Purchasing and Materials Management, 33(2), 10-17.
Mohanty, R., & Prakash, A. (2013). Green supply chain management practices in India: an
empirical study. Production Planning & Control(ahead-of-print), 1-16.
Mohanty, R. P., & Prakash, A. (2013). Green supply chain management practices in India: an
empirical study. Production Planning & Control, 25(16), 1322-1337.
doi:10.1080/09537287.2013.832822
Mohanty, R. P., & Prakash, A. (2014). Green supply chain management practices in India: a
confirmatory empirical study. Production & Manufacturing Research, 2(1), 438-456.
doi:10.1080/21693277.2014.921127
Nagel, M. H. (2000). Environmental supply-chain management versus green procurement in the
scope of a business and leadership perspective. Paper presented at the Electronics and the
Environment, 2000. ISEE 2000. Proceedings of the 2000 IEEE International Symposium
on.
NAVTN-CHANDRA, D. (1994). The recovery problem in product design. Journal of Engeering
Design, 5(1), 65-86.
Nelson, J. C., Rashid, H., Galvin, V. G., Essien, J. D., & Levine, L. M. (1999). Public/private
partners. Key factors in creating a strategic alliance for community health. Am J Prev Med,
16(3 Suppl), 94-102.
Network, G. B. (2001). Going Green Upstream: The promise of supplier environmental
management. Green Business Network, The National Environmental Education &
Training Foundation.
Nunnally, J. (1978). Psychometric methods: New York: McGraw-Hill.
Peres, W., & Stumpo, G. (2000). Small and medium-sized manufacturing enterprises in Latin
America and the Caribbean under the new economic model. World Development, 28(9),
1643-1655. doi:Doi 10.1016/S0305-750x(00)00046-2
Piore, M. J. (1984). The second industrial divide: possibilities for prosperity: Basic books.
Prakash, A. (2000). Greening the firm: the politics of corporate environmentalism: Cambridge
University Press.
Prakash, A., Mohanty, R., Kumar, S., & Kallurkar, S. (2011). Validation of multiple-item scale for
measuring service quality in life insurance business: structural equation modelling
approach. International Journal of Productivity and Quality Management, 8(4), 433-458.

100
Rao, P. (2002). Greening the supply chain: a new initiative in South East Asia. International
Journal of Operations & Production Management, 22(5-6), 632-655.
doi:10.1108/01443570210427668
Rao, P. (2004). Greening production: A South-East Asian experience. International Journal of
Operations & Production Management, 24(3-4), 289-320.
doi:10.1108/01443570410519042
Rao, P. (2007). Greening of the supply chain: An empirical study for SMES in the Philippine
context. Journal of Asia Business Studies, 1(2), 55-66.
Rao, P., & Holt, D. (2005). Do green supply chains lead to competitiveness and economic
performance? International Journal of Operations & Production Management, 25(9), 898-
916.
Richards, D. J. (1994). Environmentally conscious manufacturing. World Class Design to
Manufacture, 1(3), 15-22.
Salam, M. (2008). Green procurement adoption in manufacturing supply chain. Paper presented
at the Proceedings of the 9th Asia Pasific Industrial Engineering & Management Systems
Conference.
Sarkis, J. (1998). Evaluating environmentally conscious business practices. European journal of
operational research, 107(1), 159-174. doi:Doi 10.1016/S0377-2217(97)00160-4
Sarkis, J. (1999). A methodological framework for evaluating environmentally conscious
manufacturing programs. Computers & Industrial Engineering, 36(4), 793-810. doi:Doi
10.1016/S0360-8352(99)00166-7
Sarkis, J. (2003). A strategic decision framework for green supply chain management. Journal of
cleaner production, 11(4), 397-409. doi:10.1016/S0959-6526(02)00062-8
Sarkis, J., Gonzale-Toree, P., & Belarmino-Diaz. (2010). Satakeholder pressure and the adoption
of enviromental practices:The mediating effect of training. Journal of Operations
Management, 163-176.
Sarkis, J., & Tamarkin, M. (2005). Real options analysis for “green trading”: the case of
greenhouse gases. The Engineering Economist, 50(3), 273-294.
Schecterle, R., & Senxian, J. (2008). Building a green supply chain: social responsibility for fun
and profit. Aberdeen Group.
Seuring, S. (2004). Industrial ecology, life cycles, supply chains: differences and interrelations.
Business Strategy and the Environment, 13(5), 306-319.
101
Shaikh, F. M., Shafiq, K., & Shah, A. A. (2011). Impact of Small and Medium Enterprises SMEs
on rural development in Sindh. Modern Applied Science, 5(3), p258.
Sheu, J. B., Chou, Y. H., & Hu, C. C. (2005). An integrated logistics operational model for green-
supply chain management. Transportation Research Part E-Logistics and Transportation
Review, 41(4), 287-313. doi:10.1016/j.tre.2004.07.001
Sobel, M. E. (1982). Asymptotic confidence intervals for indirect effects in structural equation
models. Sociological methodology, 13(1982), 290-312.
Srivastava, S. K. (2007). Green supply‐chain management: a state‐of‐the‐art literature review.
International journal of management reviews, 9(1), 53-80.
Sroufe, R. (2006). A framework for strategic environmental sourcing Greening the supply chain
(pp. 3-23): Springer.
Stadtler, H. (2007). A general quantity discount and supplier selection mixed integer programming
model. OR Spectrum, 29(4), 723-744. doi:10.1007/s00291-006-0066-z
Tepper, B. J., Shafer, S. M., Meredith, J. R., & Marsh, R. (1996). A clarification on conceptual
and methodological issues related to the job characteristics model: A reply. Journal of
Operations Management, 14(4), 369-372.
Tribune, T. e. (2014). Progress analysis: SMEs vital to long-term sustainable growth, says Thaver.
The express Tribune. Retrieved from http://tribune.com.pk/story/750956/progress-
analysis-smes-vital-to-long-term-sustainable-growth-says-thaver/
Vachon, S. (2007). Green supply chain practices and the selection of environmental technologies.
International Journal of Production Research, 45(18-19), 4357-4379.
doi:10.1080/00207540701440303
van Hoek, R. I. (2000). Role of third party logistic services in customization through
postponement. International Journal of Service Industry Management, 11(4), 374-387.
Varadarajan, P. R. (2003). Musings on relevance and rigor of scholarly research in marketing.
Journal of the Academy of Marketing Science, 31(4), 368-376.
Varma, S., Wadhwa, S., & Deshmukh, S. (2006). Implementing supply chain management in a
firm: issues and remedies. Asia Pacific Journal of Marketing and Logistics, 18(3), 223-
243.
Wallerius, J., & Zakrisson, M. (2010). Green Supply Chain Management in Thailand: An
Investigation of the Use in the Electrical and Electronics Industry.

102
Walton, S. V., Handfield, R. B., & Melnyk, S. A. (1998). The green supply chain: integrating
suppliers into environmental management processes. International Journal of Purchasing
and Materials Management, 34(1), 2-11.
Wu, J., Dunn, S., & Forman, H. (2012). A study on green supply chain management practices
among large global corporations. Journal of Supply Chain and Operations Management,
10(1), 182-194.
Yingluo, W., Nengmin, W., & Linyan, S. (2003). The basic principles of green supply chain
management [J]. Engineering Science, 11, 013.
Young, A., & Kielkiewicz-Young, A. (2001). Sustainable supply network management. Corporate
Environmental Strategy, 8(3), 260-268.
Zhu, Q., Geng, Y., Fujita, T., & Hashimoto, S. (2010). Green supply chain management in leading
manufacturers: Case studies in Japanese large companies. Management Research Review,
33(4), 380-392.
Zhu, Q., Sarkis, J., Cordeiro, J. J., & Lai, K.-H. (2007). Firm-level correlates of emergent green
supply chain management practices in the chinese context. Omega The International
Journal of Management Science, 577-591.
Zhu, Q., Sarkis, J., & Lai, K.-h. (2012). Internationalization and environmentally-related
organizational learning among Chinese manufacturers. Technological Forecasting and
Social Change, 79(1), 142-154.
Zhu, Q., Sarkis, J., & Lai, K. H. (2007). Initiatives and outcomes of green supply chain
management implementation by Chinese manufacturers. J Environ Manage, 85(1), 179-
189. doi:10.1016/j.jenvman.2006.09.003
Zhu, Q. H., & Cote, R. P. (2004). Integrating green supply chain management into an embryonic
eco-industrial development: a case study of the Guitang Group. Journal of cleaner
production, 12(8-10), 1025-1035. doi:10.1016/j.jclepro.2004.02.030
Zhu, Q. H., & Sarkis, J. (2004). Relationships between operational practices and performance
among early adopters of green supply chain management practices in Chinese
manufacturing enterprises. Journal of Operations Management, 22(3), 265-289.
doi:10.1016/j.jom.2004.01.005
Zhu, Q. H., & Sarkis, J. (2006). An inter-sectoral comparison of green supply chain management
in China: Drivers and practices. Journal of cleaner production, 14(5), 472-486.
doi:10.1016/j.jclepro.2005.01.003
Zhu, Q. H., Sarkis, J., & Geng, Y. (2005). Green supply chain management in China: Pressures,
practices and performance. International Journal of Operations & Production
Management, 25(5-6), 449-468. doi:10.1108/01443570510593148
103
Zhu, Q. H., Sarkis, J., & Lai, K. H. (2008). Confirmation of a measurement model for green supply
chain management practices implementation. International journal of production
economics, 111(2), 261-273. doi:10.1016/j.ijpe.2006.11.029
Zhu, Q. H., Sarkis, J., & Lai, K. H. (2012). Internationalization and environmentally-related
organizational learning among Chinese manufacturers. Technological Forecasting and
Social Change, 79(1), 142-154. doi:10.1016/j.techfore.2011.08.018
Zhu, Q. H., Tian, Y. H., & Sarkis, J. (2012). Diffusion of selected green supply chain management
practices: an assessment of Chinese enterprises. Production Planning & Control, 23(10-
11), 837-850. doi:10.1080/09537287.2011.642188
Zsidisin, G. A., & Hendrick, T. E. (1998). Purchasing's involvement in environmental issues: a
multi-country perspective. Industrial Management & Data Systems, 98(7-8), 313-+.
doi:Doi 10.1108/02635579810241773