Embed Size (px)
Citation preview
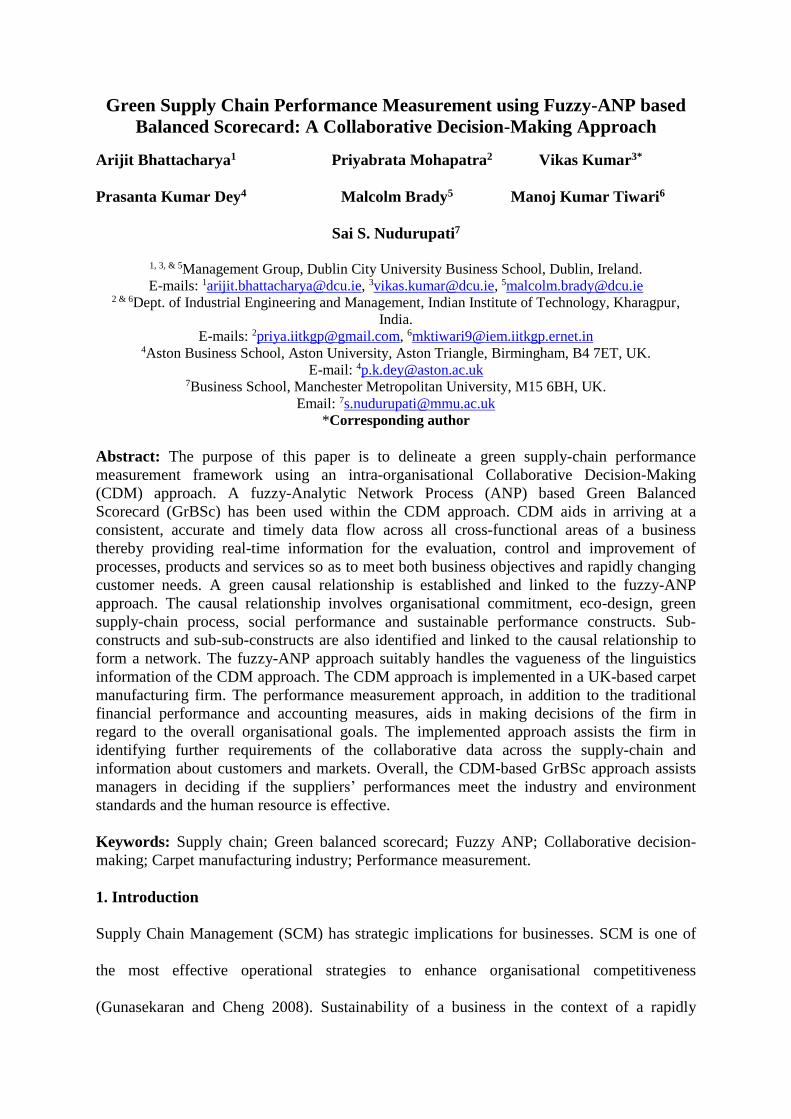
Green Supply Chain Performance Measurement using Fuzzy-ANP based
Balanced Scorecard: A Collaborative Decision-Making Approach
Arijit Bhattacharya1 Priyabrata Mohapatra2 Vikas Kumar3*
Prasanta Kumar Dey4 Malcolm Brady5 Manoj Kumar Tiwari6
Sai S. Nudurupati7
1, 3, & 5Management Group, Dublin City University Business School, Dublin, Ireland.
E-mails: [email protected], [email protected], [email protected] 2 & 6Dept. of Industrial Engineering and Management, Indian Institute of Technology, Kharagpur,
India.
E-mails: [email protected], [email protected] 4Aston Business School, Aston University, Aston Triangle, Birmingham, B4 7ET, UK.
E-mail: [email protected] 7Business School, Manchester Metropolitan University, M15 6BH, UK.
Email: [email protected]
*Corresponding author
Abstract: The purpose of this paper is to delineate a green supply-chain performance
measurement framework using an intra-organisational Collaborative Decision-Making
(CDM) approach. A fuzzy-Analytic Network Process (ANP) based Green Balanced
Scorecard (GrBSc) has been used within the CDM approach. CDM aids in arriving at a
consistent, accurate and timely data flow across all cross-functional areas of a business
thereby providing real-time information for the evaluation, control and improvement of
processes, products and services so as to meet both business objectives and rapidly changing
customer needs. A green causal relationship is established and linked to the fuzzy-ANP
approach. The causal relationship involves organisational commitment, eco-design, green
supply-chain process, social performance and sustainable performance constructs. Sub-
constructs and sub-sub-constructs are also identified and linked to the causal relationship to
form a network. The fuzzy-ANP approach suitably handles the vagueness of the linguistics
information of the CDM approach. The CDM approach is implemented in a UK-based carpet
manufacturing firm. The performance measurement approach, in addition to the traditional
financial performance and accounting measures, aids in making decisions of the firm in
regard to the overall organisational goals. The implemented approach assists the firm in
identifying further requirements of the collaborative data across the supply-chain and
information about customers and markets. Overall, the CDM-based GrBSc approach assists
managers in deciding if the suppliers’ performances meet the industry and environment
standards and the human resource is effective.
Keywords: Supply chain; Green balanced scorecard; Fuzzy ANP; Collaborative decision-
making; Carpet manufacturing industry; Performance measurement.
1. Introduction
Supply Chain Management (SCM) has strategic implications for businesses. SCM is one of
the most effective operational strategies to enhance organisational competitiveness
(Gunasekaran and Cheng 2008). Sustainability of a business in the context of a rapidly
changing global economy requires identifying performance measures on most of the critical
evaluating criteria of the Supply-Chain (SC). Such a procedure considers critical evaluation
of the dependent business strategies as an integral part of the business. The traditional SCM
model defines the SC performance as the degree of fit between ideal profiles of knowledge
elements (i.e., critical evaluating criteria) and business strategies (Hult et al. 2006). In recent
times manufacturing operations have been strongly influenced by changing environmental
requirements (Beamon 1999). Therefore, adequate attention is required to incorporate green
operational strategies in an SC. Effective and efficient green management strategies, when
combined with manufacturing operational strategies, facilitate the business in evaluating,
managing, enhancing and controlling the individual performances of the manufacturing
operations.
Although a good number of studies have been reported in the literature, there is a lack of
benchmarked knowledge on the measurement of green performance in SCs (Björklund et al.
2012). Existing performance measurement approaches disregard sustainable development
elements, viz., social and green aspects (Cuthbertson and Piotrowicz 2008). Therefore, a
thorough investigation into the links between green constructs and sub-constructs of SC is
necessitated considering other contributing inter-organisational elements responsible for
performance measurement.
In order to bridge the existing gap a Collaborative Decision-Making (CDM) approach has
been adopted in this paper. This paper demonstrates how a Green Balanced Scorecard
(GrBSc) method is developed and implemented for a UK-based carpet manufacturing
company in order to measure SC performance within a CDM environment. The company has
systematic plan to reduce waste. Their workers are appropriately trained and educated to
contribute in the waste reduction process. They have identified eight wastes in manufacturing
and implemented methods to reduce those. Additionally, they have invested in training their
human resources to implement an effective waste reduction process. The company is
currently extending its quality management programs to major critical suppliers.
The intra-organisational CDM supports an efficient information exchange among disparate
stakeholders of the carpet manufacturing firm. The firm’s stakeholders working together to
create technological, managerial and procedural solutions in both the pre- and post-
manufacturing processes share knowledge-base that contributes to efficient decision-making.
A multi-criteria decision-making tool, fuzzy-Analytic Network Process (ANP) (Saaty 1996),
assists in coordinating the various functionalities of the company required to arrive at timely
collective decisions, enabling all relevant stakeholders to participate in the process for an
effective decision-making process through the design and use of a GrBSc. A synergistic
effect of three inter-dependent major functions is considered in this article so as to enable
effective green intra-company collaboration and networking thereby forming the basis of the
CDM platform. These are: (i) discussion and overlay knowledge (both the subjective and
objective), (ii) knowledge sharing and (iii) collective decision for the best course of action.
The paper is organised in the following manner. Section 2 illustrates a comprehensive
background based on a systematic literature review. The next section elucidates the GrBSc
framework. Section 4 delineates the implementation of GrBSc focusing on a case of a UK-
based carpet manufacturing company. Section 5 discusses observations from the
implemented approach followed by a discussion. The last section concludes the paper
indicating the scope for further research.
2. Background
A considerable number of performance measurement approaches exists in the literature
(Bhagwat and Sharma 2009; Alfaro et al 2007; Mettänen 2005; Gunasekaran et al. 2004).
Key performance indicators (Camarinha-Matos and Abreu 2007) and their measures and
metrics in SCM are reported in literature based on a survey and case studies (Gunasekaran
and Kobu 2007). Yang (2011) reports a conceptual framework for evaluating the knowledge
sharing effect of SC capabilities on SC performance. It is observed that an effective
performance measurement approach should consider managerial accounting along with
operational strategies. Manufacturing synergy can be developed if a strong link is developed
among strategies, operational actions and performance (Ketokivi and Heikkilä 2003).
However, gaps between these two disciplines exist within SC research (Hofmann and Locker
2009).
The scope of this paper is limited to green SC performance using a BSc-based CDM
approach. Therefore, a critique of the literature in the arena of green-SC performance and
BSc-based performance measurement frameworks is relevant.
2.1 Green supply chain performance
Significant awareness amongst manufacturers, increased level of societal awareness among
consumers and regulatory pressures on businesses are steadily forcing SCs to meet consumer
demand for “greener” products (Hitchcock 2012). Therefore, it is envisaged that the
organisation performance would take a different shape when green and societal aspects of
SCs are considered. The literature on the green SC performance is wide-ranging (Dey and
Cheffi 2012; Olugu et al. 2010; Tsoulfas and Pappis 2008). A good level of recognition is
found amongst practitioners on the necessity for more knowledge on environmental
performance across different actors in an SC (Björklund et al. 2012). Modern SC
performance measurement includes ‘ecological sustainable performance measure’ as a
component (Bai et al. 2012). Taking into account present challenges and obstacles, a
definition of green-SCM is as follows: “to maximise overall environmental profit by
adopting a life cycle approach through product design, material selection, manufacturing,
and sales and recovery, and therefore helps the firm to realise its sustainable development
and improvement” (Shi et al. 2012). Therefore, in addition to economic performance measure
(Rao and Holt 2005) it is essential to identify the SC constructs, ecological aspects of
performance measures and causal relationships that form the building blocks of these green-
SC elements within an organisation.
2.2 Balanced scorecard and its variants for performance measurement
The purpose of BSc is to keep balanced the scores of a set of performance measures. The
measures comprise short and long-term objectives, financial and non-financial measures,
lagging and leading indicators and internal and external performance perspectives (Kaplan
and Norton 1992, 1996). Three most relevant ways have been elucidated for utilising a BSc
framework in assessing performance (Malmi 2001): (i) to focus on management of the
organisation by objectives, (ii) to use as an information system and (iii) to visualise the cause
and effect relationships between different measures. Customised forms of BSc have been
adopted by many companies (Lee et al. 2008). Businesses are aligned to new strategies
thereby opening growth opportunities based on more customised, value-added products and
services (Martinsons et al. 1999). Empirical evidence from Dutch firms suggests that
appropriate usage of BSc improves performance of the company (Braam and Nijssen 2004).
Examples of the application of BSc framework in various sectors for performance
measurement are abundant (Mendes et al. 2012; Sawalqa et al. 2011). However, the way of
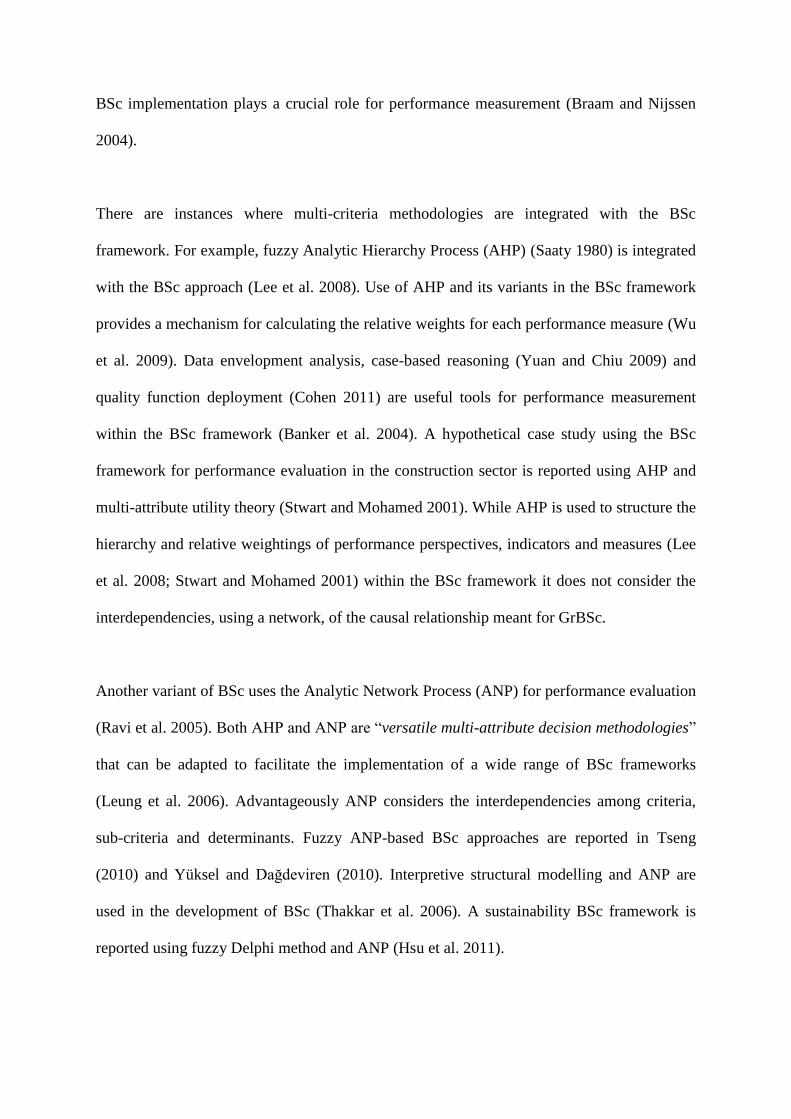
BSc implementation plays a crucial role for performance measurement (Braam and Nijssen
2004).
There are instances where multi-criteria methodologies are integrated with the BSc
framework. For example, fuzzy Analytic Hierarchy Process (AHP) (Saaty 1980) is integrated
with the BSc approach (Lee et al. 2008). Use of AHP and its variants in the BSc framework
provides a mechanism for calculating the relative weights for each performance measure (Wu
et al. 2009). Data envelopment analysis, case-based reasoning (Yuan and Chiu 2009) and
quality function deployment (Cohen 2011) are useful tools for performance measurement
within the BSc framework (Banker et al. 2004). A hypothetical case study using the BSc
framework for performance evaluation in the construction sector is reported using AHP and
multi-attribute utility theory (Stwart and Mohamed 2001). While AHP is used to structure the
hierarchy and relative weightings of performance perspectives, indicators and measures (Lee
et al. 2008; Stwart and Mohamed 2001) within the BSc framework it does not consider the
interdependencies, using a network, of the causal relationship meant for GrBSc.
Another variant of BSc uses the Analytic Network Process (ANP) for performance evaluation
(Ravi et al. 2005). Both AHP and ANP are “versatile multi-attribute decision methodologies”
that can be adapted to facilitate the implementation of a wide range of BSc frameworks
(Leung et al. 2006). Advantageously ANP considers the interdependencies among criteria,
sub-criteria and determinants. Fuzzy ANP-based BSc approaches are reported in Tseng
(2010) and Yüksel and Dağdeviren (2010). Interpretive structural modelling and ANP are
used in the development of BSc (Thakkar et al. 2006). A sustainability BSc framework is
reported using fuzzy Delphi method and ANP (Hsu et al. 2011).
BSc can be successfully used for managing environmental aspects of performance
(Länsiluoto and Järvenpää 2010). Wynder (2010) opines that environmental performance can
be recognised as a driver of financial performance. A BSc-based green-SC performance
measurement approach is reported in Cheffi and Dey (2012). Relationship between
sustainable BSc and eco-efficiency analysis is found in Möller and Schaltegger (2005). Ways
to incorporate sustainable practices into BSc are reported in Butler et al. (2011). Instances
prevail where environmental and social aspects are integrated with the organisational aspects
of a company within a BSc framework (Figge et al. 2002).
The CDM approach framed in this article to assess green-SC performance of aUK-based
manufacturing company seeks to answer the following research questions:
(i) How are green-SC constructs, sub-constructs and sub-sub constructs related according
to strategic, tactical and operational levels of management and what are the
implications of these for green-SC decision making?
(ii) What are the critical evaluating factors responsible for measuring green-SC
performance?
(iii) How do the constructs, sub-constructs and sub-sub-constructs of an SC form a green-
network?
(iv) How does a green causal relationship, comprising the green-network, serve as a black-
box for green-SC performance measurement?
(v) What are the elements that contribute to the GrBSc while measuring SC performance?
(vi) How are the collaborative opinions, in linguistic terms, of stakeholders of a
manufacturing company considered in GrBSc?
(vii) How is qualitative and vague information, in linguistic terms, of the stakeholders
tackled in the inter-dependent network for measuring green-SC performance of the
manufacturing firm?
This research extends the literature in the field of green-SC by developing a novel green-SC
performance framework for a UK-based carpet manufacturing firm by devising a novel
GrBSc approach through integration of holistic green-SC performance constructs and
implementing a collaborative decision-making approach.
3. Green Balanced Scorecard-based Framework
The British carpet industry is striving to survive amidst several competitors in EU. One of the
sustainable manufacturing goals in the British carpet sector is the inclusion of a green
element in the production planning processes. The manufacturing company under
consideration takes such “green” elements and its environmental and social responsibilities
seriously. The company is committed to the long-term aims of sustainable development in all
business activities. Green-SC management is central to the entire business as the product is
intrinsically ‘green’. Carpets are manufactured from renewable resources, viz., wool from
grass-fed sheep. The products have extended lifecycles. The manufacturing plants continually
strive to reduce their environmental footprint through training of the employees in regard to
environmental awareness in sustainable communities. Further, the green-SC includes
recycling process waste and finished carpet at the end of its life. The company contributes
positively to the Leadership in Energy and Environmental Design (LEED) building
certification criteria as a part of the recognition of its sustainability credentials. The company
meets the stringent standards of the Carpet and Rug Institute Green Label Plus programme
thereby contributing to a healthy indoor environment.
Organisational
commitment
(ORG)
Eco-design
(ECD)
Green
supply-chain process
(GSC)
Social
performance
(SP)
Sustainable
performance
(SSP)
Innovation &
learningInternal Customer Finance
Green supply chain
performance measurement
Organisational
commitmentEco-design
Green supply-
chain processes
Social
performance
Sustainable
performance
Top management
commitment
Middle management
commitment
Cross functional
cooperation
Employee
involvement
Design of products for
reduced materials and
energy consumption
Design of products for
reuse, recycle, recovery
materials & component
parts
Design of products to
avoid or reduce use of
harmful products &
manufacturing process
Green purchasing
Green marketing
Investment recovery
Environmental
practices
Business ethics
CSR activities
Employment
generation
Positive image
Environmental
performance
Economic
performance
Operational
performance
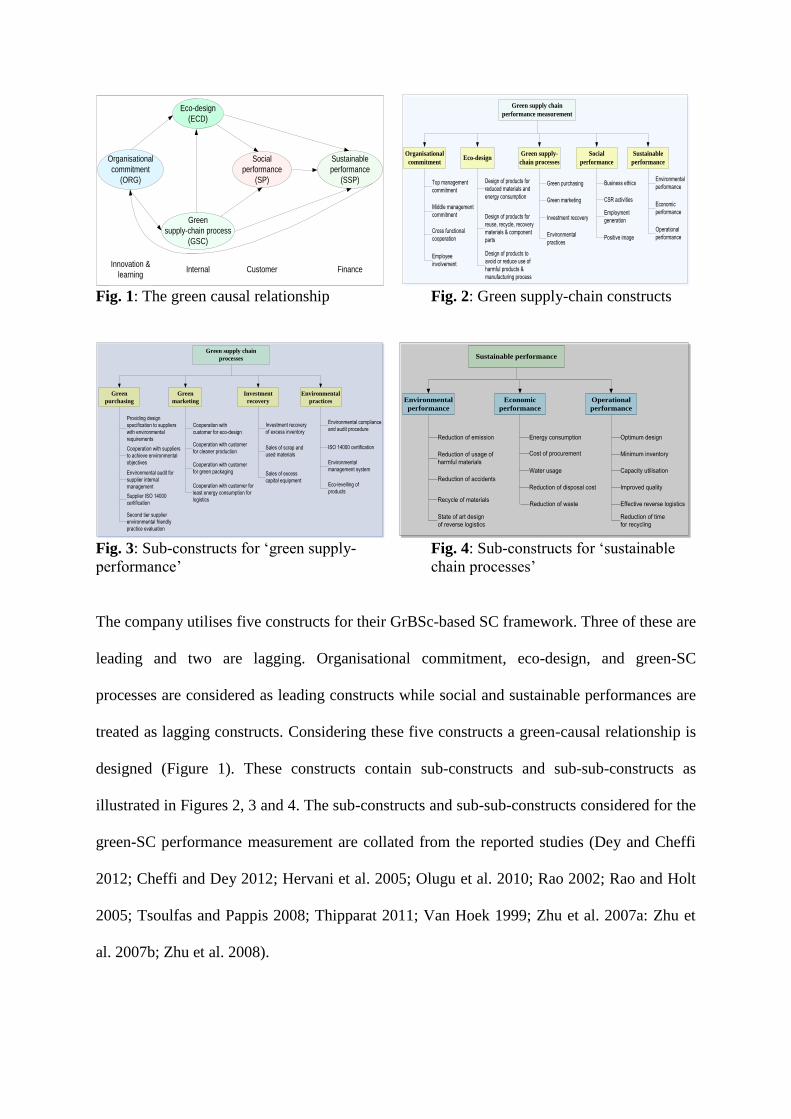
Fig. 1: The green causal relationship Fig. 2: Green supply-chain constructs
Green supply chain
processes
Green
purchasing
Green
marketing
Investment
recovery
Environmental
practices
Providing design
specification to suppliers
with environmental
requirements
Cooperation with suppliers
to achieve environmental
objectives
Environmental audit for
supplier internal
management
Supplier ISO 14000
certification
Cooperation with
customer for eco-design
Cooperation with customer
for cleaner production
Cooperation with customer
for green packaging
Investment recovery
of excess inventory
Sales of scrap and
used materials
Sales of excess
capital equipment
Second tier supplier
environmental friendly
practice evaluation
Cooperation with customer for
least energy consumption for
logistics
Environmental compliance
and audit procedure
ISO 14000 certification
Environmental
management system
Eco-levelling of
products
Sustainable performance
Environmental
performance
Economic
performance
Operational
performance
Reduction of emission
Reduction of usage of
harmful materials
Reduction of accidents
State of art design
of reverse logistics
Energy consumption
Cost of procurement
Water usage
Recycle of materials
Optimum design
Minimum inventory
Capacity utilisation
Improved quality
Reduction of waste
Reduction of disposal cost
Effective reverse logistics
Reduction of time
for recycling
Fig. 3: Sub-constructs for ‘green supply- Fig. 4: Sub-constructs for ‘sustainable
performance’ chain processes’
The company utilises five constructs for their GrBSc-based SC framework. Three of these are
leading and two are lagging. Organisational commitment, eco-design, and green-SC
processes are considered as leading constructs while social and sustainable performances are
treated as lagging constructs. Considering these five constructs a green-causal relationship is
designed (Figure 1). These constructs contain sub-constructs and sub-sub-constructs as
illustrated in Figures 2, 3 and 4. The sub-constructs and sub-sub-constructs considered for the
green-SC performance measurement are collated from the reported studies (Dey and Cheffi
2012; Cheffi and Dey 2012; Hervani et al. 2005; Olugu et al. 2010; Rao 2002; Rao and Holt
2005; Tsoulfas and Pappis 2008; Thipparat 2011; Van Hoek 1999; Zhu et al. 2007a: Zhu et
al. 2007b; Zhu et al. 2008).
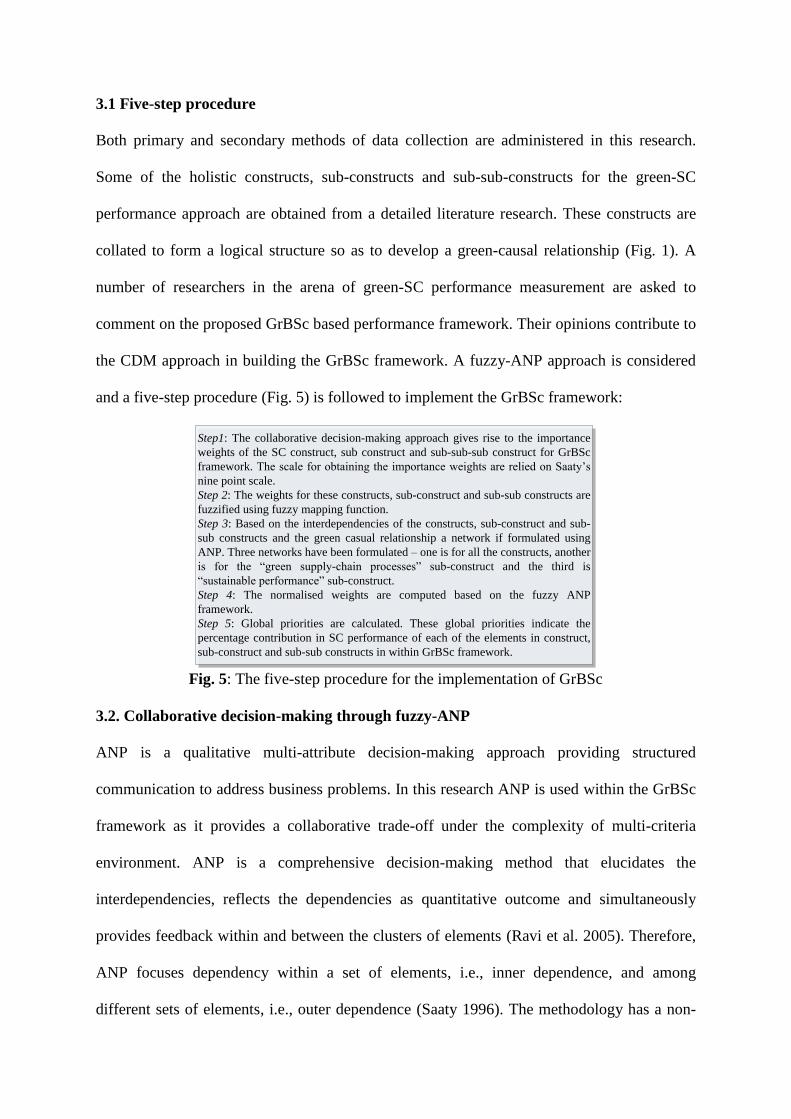
3.1 Five-step procedure
Both primary and secondary methods of data collection are administered in this research.
Some of the holistic constructs, sub-constructs and sub-sub-constructs for the green-SC
performance approach are obtained from a detailed literature research. These constructs are
collated to form a logical structure so as to develop a green-causal relationship (Fig. 1). A
number of researchers in the arena of green-SC performance measurement are asked to
comment on the proposed GrBSc based performance framework. Their opinions contribute to
the CDM approach in building the GrBSc framework. A fuzzy-ANP approach is considered
and a five-step procedure (Fig. 5) is followed to implement the GrBSc framework:
Step1: The collaborative decision-making approach gives rise to the importance
weights of the SC construct, sub construct and sub-sub-sub construct for GrBSc
framework. The scale for obtaining the importance weights are relied on Saaty’s
nine point scale.
Step 2: The weights for these constructs, sub-construct and sub-sub constructs are
fuzzified using fuzzy mapping function.
Step 3: Based on the interdependencies of the constructs, sub-construct and sub-
sub constructs and the green casual relationship a network if formulated using
ANP. Three networks have been formulated – one is for all the constructs, another
is for the “green supply-chain processes” sub-construct and the third is
“sustainable performance” sub-construct.
Step 4: The normalised weights are computed based on the fuzzy ANP
framework.
Step 5: Global priorities are calculated. These global priorities indicate the
percentage contribution in SC performance of each of the elements in construct,
sub-construct and sub-sub constructs in within GrBSc framework.
Fig. 5: The five-step procedure for the implementation of GrBSc
3.2. Collaborative decision-making through fuzzy-ANP
ANP is a qualitative multi-attribute decision-making approach providing structured
communication to address business problems. In this research ANP is used within the GrBSc
framework as it provides a collaborative trade-off under the complexity of multi-criteria
environment. ANP is a comprehensive decision-making method that elucidates the
interdependencies, reflects the dependencies as quantitative outcome and simultaneously
provides feedback within and between the clusters of elements (Ravi et al. 2005). Therefore,
ANP focuses dependency within a set of elements, i.e., inner dependence, and among
different sets of elements, i.e., outer dependence (Saaty 1996). The methodology has a non-
linear structure dealing with sources, cycles and sinks while having a hierarchy of linear
form, like AHP (Ravi et al. 2005). In this research the CDM approach works in two linked
segments. One segment influences the dependencies of constructs, sub-constructs and sub-
sub-constructs through building network while the other segment generates a network having
control over all the elements and clusters.
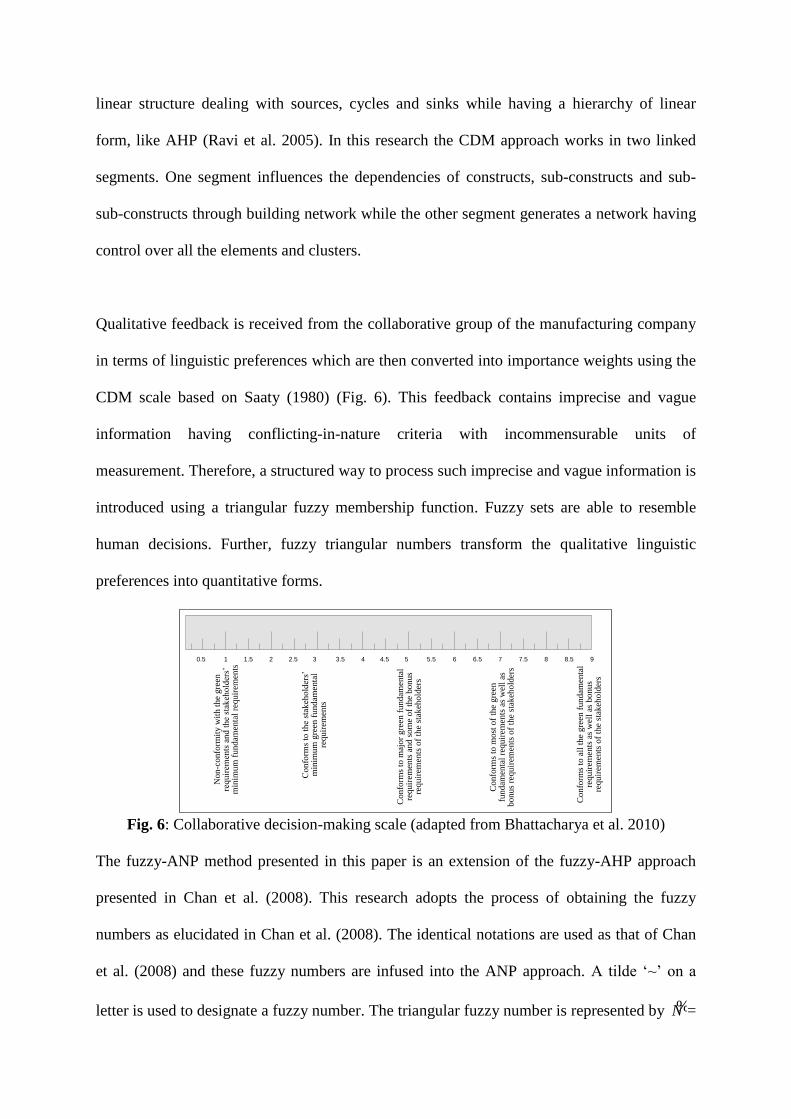
Qualitative feedback is received from the collaborative group of the manufacturing company
in terms of linguistic preferences which are then converted into importance weights using the
CDM scale based on Saaty (1980) (Fig. 6). This feedback contains imprecise and vague
information having conflicting-in-nature criteria with incommensurable units of
measurement. Therefore, a structured way to process such imprecise and vague information is
introduced using a triangular fuzzy membership function. Fuzzy sets are able to resemble
human decisions. Further, fuzzy triangular numbers transform the qualitative linguistic
preferences into quantitative forms.
0.5 1 1.5 2 2.5 3 3.5 4 4.5 5 5.5 6 6.5 7 7.5 8 8.5 9
Non-c
onfo
rmit
y w
ith t
he
gre
en
requir
emen
ts a
nd t
he
stak
ehold
ers’
m
inim
um
fundam
enta
l re
quir
emen
ts
Confo
rms
to t
he
stak
ehold
ers’
m
inim
um
gre
en f
undam
enta
l re
quir
emen
ts
Confo
rms
to m
ajor
gre
en f
undam
enta
l re
quir
emen
ts a
nd s
om
e of
the
bonus
requir
emen
ts o
f th
e st
akeh
old
ers
Confo
rms
to m
ost
of
the
gre
en
fundam
enta
l re
quir
emen
ts a
s w
ell
as
bonus
requir
emen
ts o
f th
e st
akeh
old
ers
Confo
rms
to a
ll t
he
gre
en f
undam
enta
l re
quir
emen
ts a
s w
ell
as b
onus
requir
emen
ts o
f th
e st
akeh
old
ers
Fig. 6: Collaborative decision-making scale (adapted from Bhattacharya et al. 2010)
The fuzzy-ANP method presented in this paper is an extension of the fuzzy-AHP approach
presented in Chan et al. (2008). This research adopts the process of obtaining the fuzzy
numbers as elucidated in Chan et al. (2008). The identical notations are used as that of Chan
et al. (2008) and these fuzzy numbers are infused into the ANP approach. A tilde ‘~’ on a
letter is used to designate a fuzzy number. The triangular fuzzy number is represented by N%=
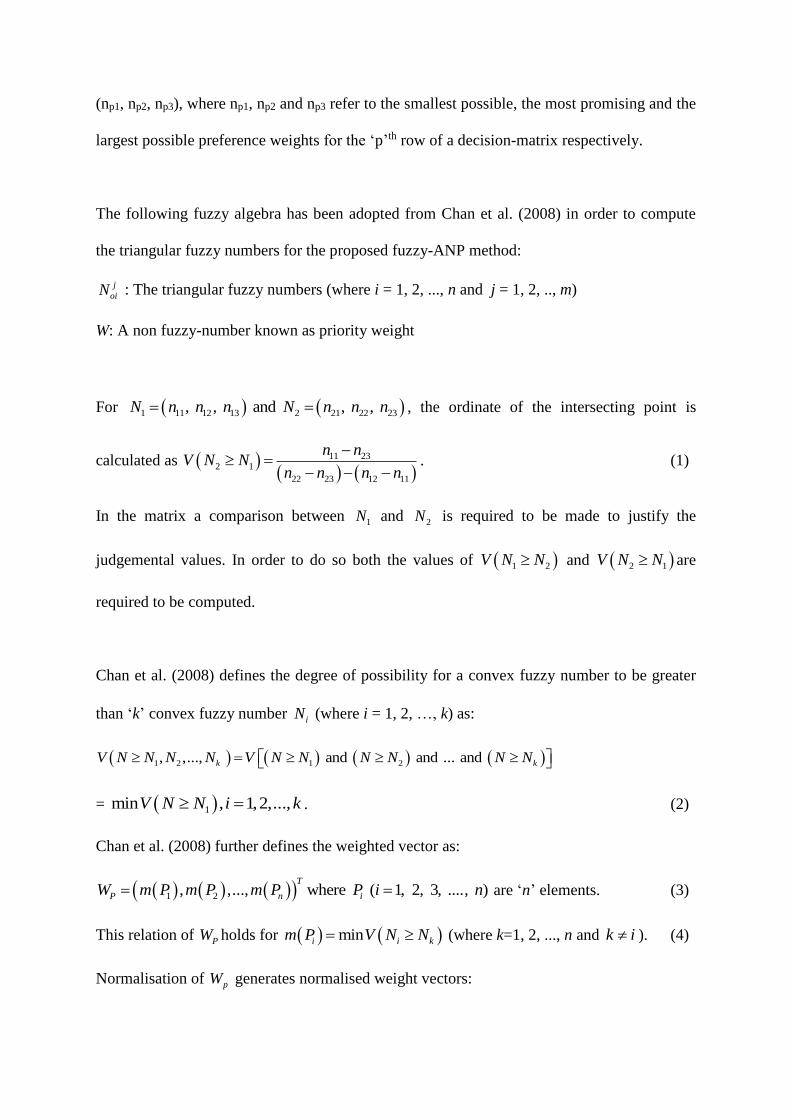
(np1, np2, np3), where np1, np2 and np3 refer to the smallest possible, the most promising and the
largest possible preference weights for the ‘p’th row of a decision-matrix respectively.
The following fuzzy algebra has been adopted from Chan et al. (2008) in order to compute
the triangular fuzzy numbers for the proposed fuzzy-ANP method:
j
oiN : The triangular fuzzy numbers (where i = 1, 2, ..., n and j = 1, 2, .., m)
W: A non fuzzy-number known as priority weight
For 1 11 12 13 2 21 22 23, , and , , N n n n N n n n , the ordinate of the intersecting point is
calculated as
11 232 1
22 23 12 11
n nV N N
n n n n
. (1)
In the matrix a comparison between 1N and 2N is required to be made to justify the
judgemental values. In order to do so both the values of 1 2V N N and 2 1V N N are
required to be computed.
Chan et al. (2008) defines the degree of possibility for a convex fuzzy number to be greater
than ‘k’ convex fuzzy number iN (where i = 1, 2, …, k) as:
1 2 1 2, ,..., and and ... and k kV N N N N V N N N N N N
= 1min , 1,2,...,V N N i k . (2)
Chan et al. (2008) further defines the weighted vector as:
1 2, ,..., where ( 1, 2, 3, ...., )T
P n iW m P m P m P P i n are ‘n’ elements. (3)
This relation of PW holds for mini i km P V N N (where k=1, 2, ..., n and k i ). (4)
Normalisation of pW generates normalised weight vectors:
1 2, ,...,T
nW w P w P w P , (5)
where W is a non-fuzzy number that provides priority weights of one alternative over other.
4. Case Study of a Manufacturing Industry
The UK-based carpet manufacturing company has a stringent environmental policy reviewed
through external audit. The company under consideration achieves all emissions and energy
consumption targets of the regulators. There is no reverse logistic system in place for their
products. There is no environmental performance measurement framework in practice for
measuring carbon footprint, carbon offsetting etc. Further, the company does not use
renewable energy.
The manufacturing company has a dedicated marketing team that remains in touch with its
customers. Interviews revealed that there are several issues that need to be addressed in order
to improve information integration with customers. These evolve mainly due to fast changing
customer requirements. In addition, customers often change their requirements even after
placing the orders. Moreover, there is evidence of order cancellation and delay in processing
during production because of communication gaps. Hence, there remains room for
improvements in information integration that may result in improvement to the overall green
performance of the SC.
The company’s environmental policy allows purchasing materials only from reliable and
recognised suppliers, who can conform to the company’s stringent environmental
requirements. They have more than 300 suppliers ofwhich around 20 suppliers are strategic,
i.e., with long-term relationship. The company’s purchasing procedures are audited by the
British Standard Institute as a part of the company’s ISO 9002 certification process. All the
chemicals used conform to COSHH regulations. The company has also initiated special
agreements with suppliers to ensure that all containers and other materials brought on to the
company’s premises are either returned to the manufacturer for recycling or are disposed of
by safe, secure and legal methods. The introduction of the ISO 14000 certification standard
focuses attention on the environmental impact performance of the firm’s processes. Purchase
is one of the key processes, which is assessed in ISO 14000 because it is responsible for not
only procurement of the materials but also their disposal at the end of their useful life.
4.1. Collaborative decision-making
Development of a set of green performance measurement constructs for GrBSc involves a
complicated process and is challenging for businesses. Although in a typical firm a certain
number of performance metrics is prevalent for assessing its financial performance, green-SC
related performance metrics have not been widely adopted as businesses are typically
uninformed of them. Firms often find that there is a lack of operational guidelines on how to
develop performance measurement criteria and constructs (Lapide, 2000). Therefore, a group
decision-making process assists in developing green-SC performance measurement metrics
and criteria hierarchically across the cross-functional levels. Stakeholders of the carpet
manufacturing firm are selected from the following departments: marketing, production,
purchasing, information, projects and human resources. Six key actors are selected from each
stakeholder for their participation in the interviews. The interviewees from each stakeholder
comprise one person from manager, deputy manager and assistant manager levels and three
key officers.
There are many decision points and variables within the company’s decision-making
processes. They are complex and need consideration of multiple factors and the involvement
of various stakeholders. Although the decisions are currently being made with the
involvement of concerned stakeholders, an appropriate collaborative decision-support system
could help to standardise decision-making processes for making the right decision quickly.
The company works closely in a coordinated manner with their strategic suppliers, viz., wool
and jute manufacturers. They coordinate with their suppliers when making critical decisions
with regard to materials specification, design option selection and production planning.
A focus group has been formed within the manufacturing company to consider decision-
support aspects. This group comprises persons from each stakeholder, viz., marketing,
production, purchasing, information, projects, and human resources. All members of the
group have more than twenty years’ experience in manufacturing and have at least five years’
experience with the company. They have been briefed on the objectives (green-SC
performance measurement). The green-SC performance method is then explained to them
including the rationale for each construct and their inter-relationships. The fuzzy-ANP
method is then elaborated in order to explain not only how the green-SC performance method
is to be undertaken but also to allow them to understand its rationale for selection. Next, the
participants are asked to compare pair-wise the high level constructs for deriving their
importance. Subsequently, they also compare sub-constructs pair-wise. These comparisons
are synthesised using the fuzzy-ANP framework to determine the importance of all the
bottom level sub-constructs. Each functional manager is then asked to derive their green-SC
performance against each bottom level sub-constructs.
The group forms a consensus decision in linguistic terms under the chairmanship of the
operational director of the company. The process of decision-making is collaborative as flow
and subsequent sharing of information is from one functional area to another. The procedures
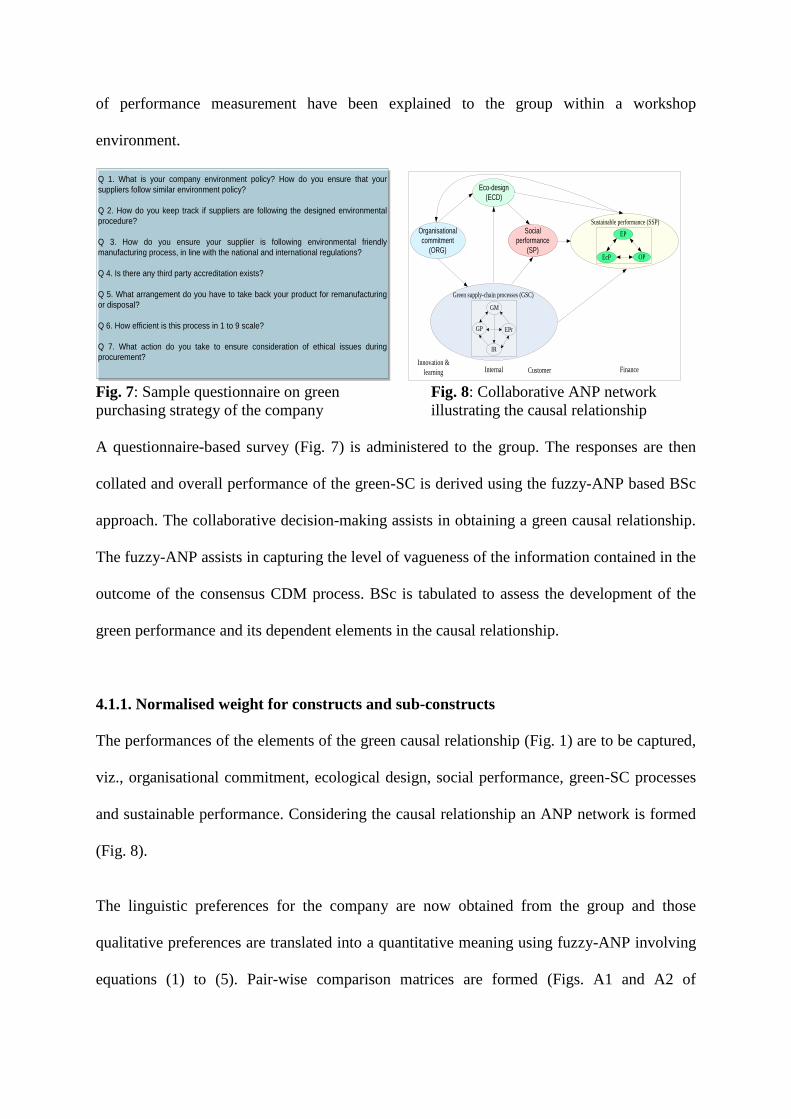
of performance measurement have been explained to the group within a workshop
environment.
Q 1. What is your company environment policy? How do you ensure that your
suppliers follow similar environment policy?
Q 2. How do you keep track if suppliers are following the designed environmental
procedure?
Q 3. How do you ensure your supplier is following environmental friendly
manufacturing process, in line with the national and international regulations?
Q 4. Is there any third party accreditation exists?
Q 5. What arrangement do you have to take back your product for remanufacturing
or disposal?
Q 6. How efficient is this process in 1 to 9 scale?
Q 7. What action do you take to ensure consideration of ethical issues during
procurement?
Organisational
commitment
(ORG)
Eco-design
(ECD)
Social
performance
(SP)
Innovation &
learning Internal Customer Finance
Green supply-chain processes (GSC)
Sustainable performance (SSP)
EP
EcP OP
GM
GP EPr
IR
Fig. 7: Sample questionnaire on green Fig. 8: Collaborative ANP network
purchasing strategy of the company illustrating the causal relationship
A questionnaire-based survey (Fig. 7) is administered to the group. The responses are then
collated and overall performance of the green-SC is derived using the fuzzy-ANP based BSc
approach. The collaborative decision-making assists in obtaining a green causal relationship.
The fuzzy-ANP assists in capturing the level of vagueness of the information contained in the
outcome of the consensus CDM process. BSc is tabulated to assess the development of the
green performance and its dependent elements in the causal relationship.
4.1.1. Normalised weight for constructs and sub-constructs
The performances of the elements of the green causal relationship (Fig. 1) are to be captured,
viz., organisational commitment, ecological design, social performance, green-SC processes
and sustainable performance. Considering the causal relationship an ANP network is formed
(Fig. 8).
The linguistic preferences for the company are now obtained from the group and those
qualitative preferences are translated into a quantitative meaning using fuzzy-ANP involving
equations (1) to (5). Pair-wise comparison matrices are formed (Figs. A1 and A2 of
Appendix) taking into consideration the sub-constructs embedded within each construct.
Interdependencies of the constructs are established once the fuzzy quantitative measures for
the linguistic preferences are obtained (Fig. A3 of Appendix).
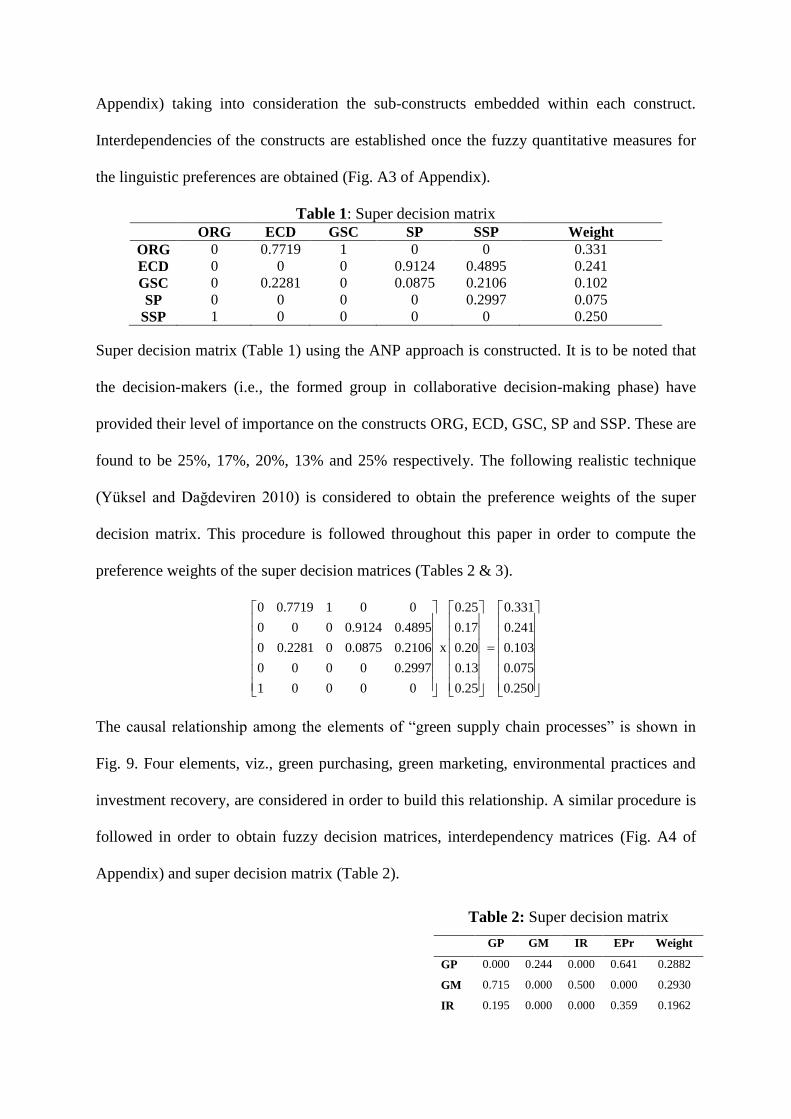
Table 1: Super decision matrix ORG ECD GSC SP SSP Weight
ORG 0 0.7719 1 0 0 0.331
ECD 0 0 0 0.9124 0.4895 0.241
GSC 0 0.2281 0 0.0875 0.2106 0.102
SP 0 0 0 0 0.2997 0.075
SSP 1 0 0 0 0 0.250
Super decision matrix (Table 1) using the ANP approach is constructed. It is to be noted that
the decision-makers (i.e., the formed group in collaborative decision-making phase) have
provided their level of importance on the constructs ORG, ECD, GSC, SP and SSP. These are
found to be 25%, 17%, 20%, 13% and 25% respectively. The following realistic technique
(Yüksel and Dağdeviren 2010) is considered to obtain the preference weights of the super
decision matrix. This procedure is followed throughout this paper in order to compute the
preference weights of the super decision matrices (Tables 2 & 3).
0 0.7719 1 0 0 0.25 0.331
0 0 0 0.9124 0.4895 0.17 0.241
x0 0.2281 0 0.0875 0.2106 0.20 0.103
0 0 0 0 0.2997 0.13 0.075
1 0 0 0 0 0.25 0.250
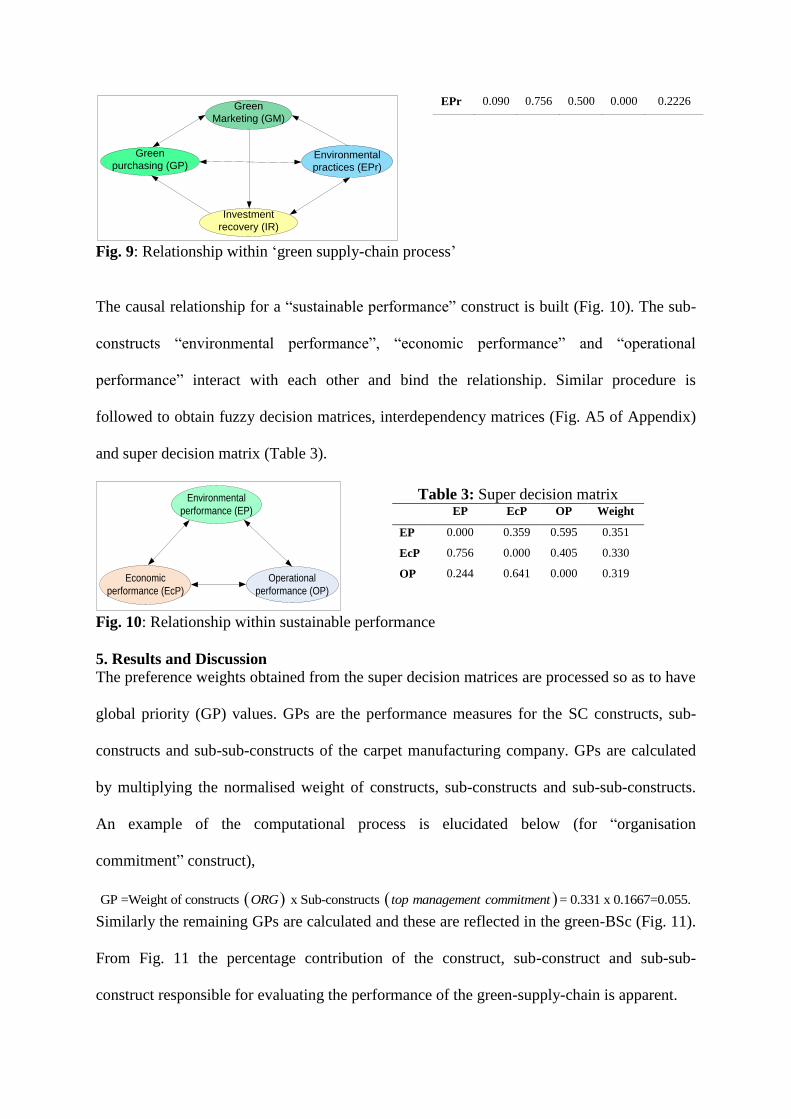
The causal relationship among the elements of “green supply chain processes” is shown in
Fig. 9. Four elements, viz., green purchasing, green marketing, environmental practices and
investment recovery, are considered in order to build this relationship. A similar procedure is
followed in order to obtain fuzzy decision matrices, interdependency matrices (Fig. A4 of
Appendix) and super decision matrix (Table 2).
Table 2: Super decision matrix
GP GM IR EPr Weight
GP 0.000 0.244 0.000 0.641 0.2882
GM 0.715 0.000 0.500 0.000 0.2930
IR 0.195 0.000 0.000 0.359 0.1962
Green
Marketing (GM)
Green
purchasing (GP)Environmental
practices (EPr)
Investment
recovery (IR)
Fig. 9: Relationship within ‘green supply-chain process’
The causal relationship for a “sustainable performance” construct is built (Fig. 10). The sub-
constructs “environmental performance”, “economic performance” and “operational
performance” interact with each other and bind the relationship. Similar procedure is
followed to obtain fuzzy decision matrices, interdependency matrices (Fig. A5 of Appendix)
and super decision matrix (Table 3).
Environmental
performance (EP)
Economic
performance (EcP)
Operational
performance (OP)
Fig. 10: Relationship within sustainable performance
5. Results and Discussion
The preference weights obtained from the super decision matrices are processed so as to have
global priority (GP) values. GPs are the performance measures for the SC constructs, sub-
constructs and sub-sub-constructs of the carpet manufacturing company. GPs are calculated
by multiplying the normalised weight of constructs, sub-constructs and sub-sub-constructs.
An example of the computational process is elucidated below (for “organisation
commitment” construct),
GP =Weight of constructs x Sub-constructs = 0.331 x 0.1667=0.055.ORG top management commitment
Similarly the remaining GPs are calculated and these are reflected in the green-BSc (Fig. 11).
From Fig. 11 the percentage contribution of the construct, sub-construct and sub-sub-
construct responsible for evaluating the performance of the green-supply-chain is apparent.
EPr 0.090 0.756 0.500 0.000 0.2226
Table 3: Super decision matrix EP EcP OP Weight
EP 0.000 0.359 0.595 0.351
EcP 0.756 0.000 0.405 0.330
OP 0.244 0.641 0.000 0.319
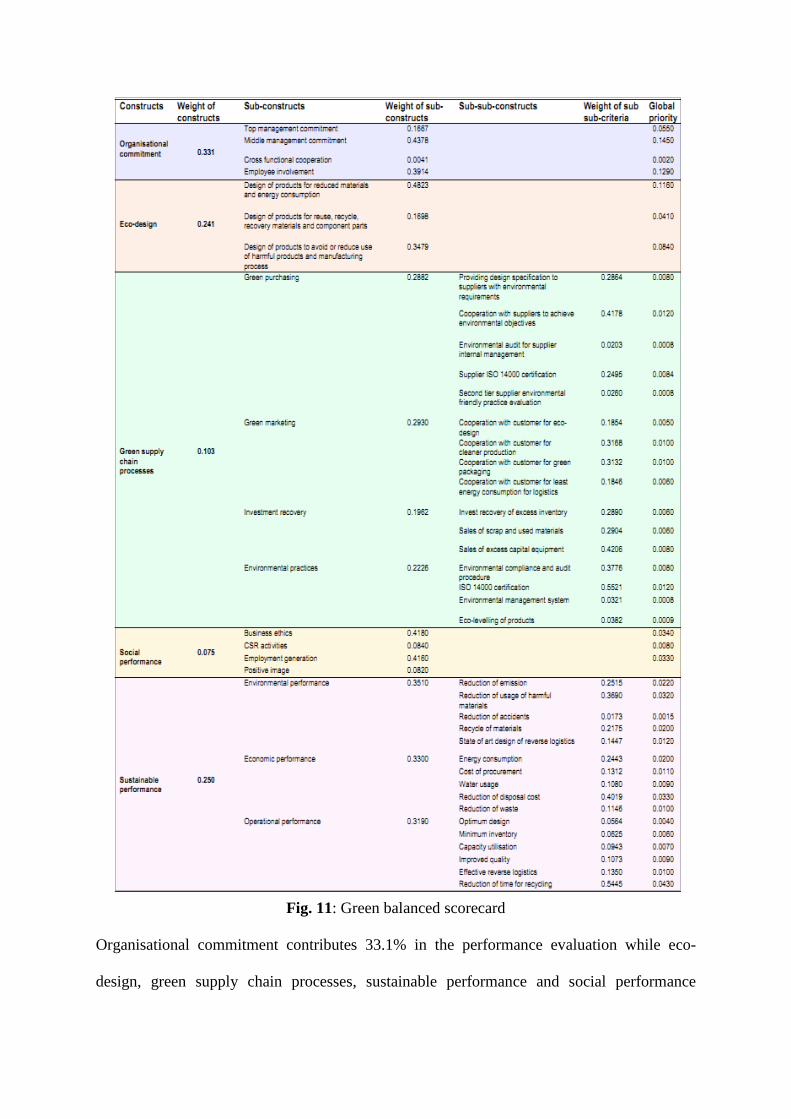
Fig. 11: Green balanced scorecard
Organisational commitment contributes 33.1% in the performance evaluation while eco-
design, green supply chain processes, sustainable performance and social performance
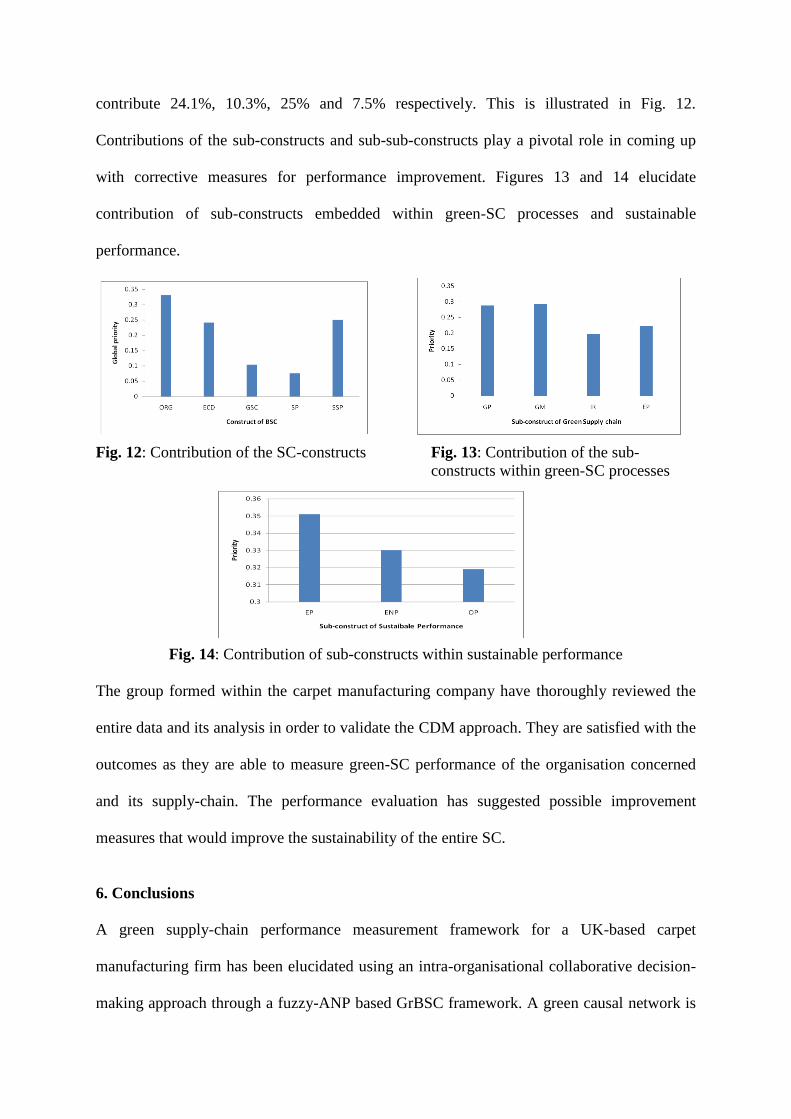
contribute 24.1%, 10.3%, 25% and 7.5% respectively. This is illustrated in Fig. 12.
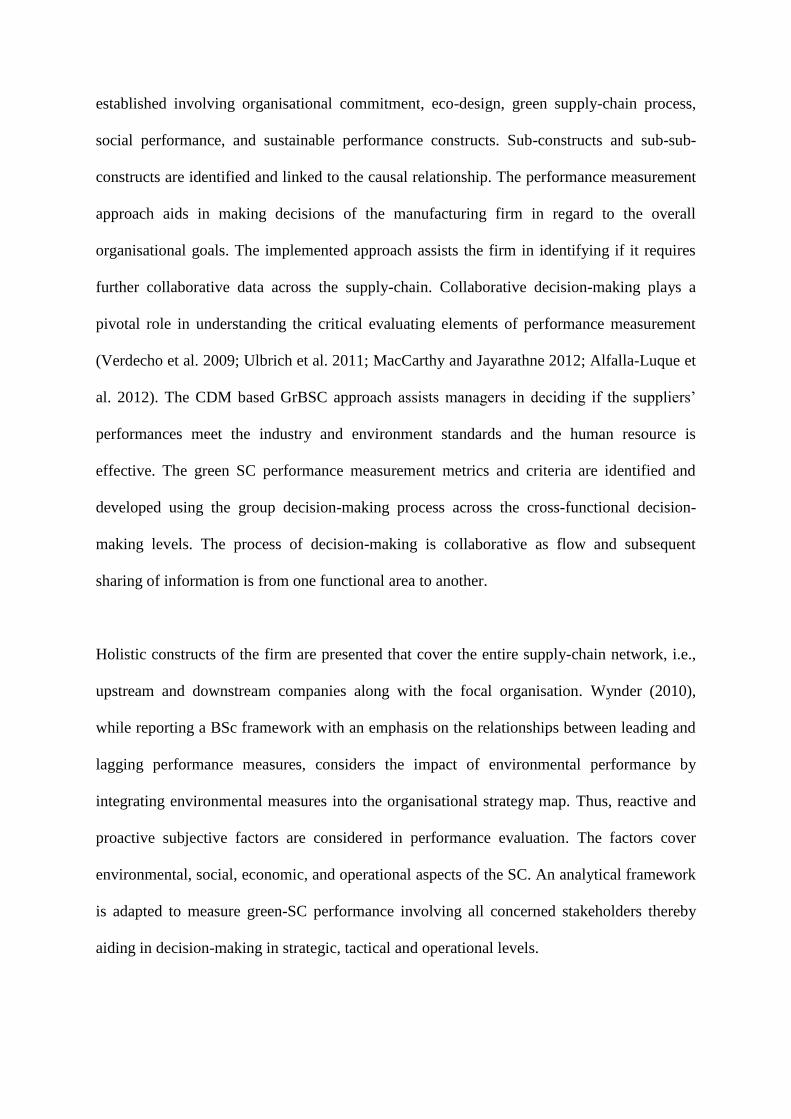
Contributions of the sub-constructs and sub-sub-constructs play a pivotal role in coming up
with corrective measures for performance improvement. Figures 13 and 14 elucidate
contribution of sub-constructs embedded within green-SC processes and sustainable
performance.
Fig. 12: Contribution of the SC-constructs Fig. 13: Contribution of the sub-
constructs within green-SC processes
Fig. 14: Contribution of sub-constructs within sustainable performance
The group formed within the carpet manufacturing company have thoroughly reviewed the
entire data and its analysis in order to validate the CDM approach. They are satisfied with the
outcomes as they are able to measure green-SC performance of the organisation concerned
and its supply-chain. The performance evaluation has suggested possible improvement
measures that would improve the sustainability of the entire SC.
6. Conclusions
A green supply-chain performance measurement framework for a UK-based carpet
manufacturing firm has been elucidated using an intra-organisational collaborative decision-
making approach through a fuzzy-ANP based GrBSC framework. A green causal network is
established involving organisational commitment, eco-design, green supply-chain process,
social performance, and sustainable performance constructs. Sub-constructs and sub-sub-
constructs are identified and linked to the causal relationship. The performance measurement
approach aids in making decisions of the manufacturing firm in regard to the overall
organisational goals. The implemented approach assists the firm in identifying if it requires
further collaborative data across the supply-chain. Collaborative decision-making plays a
pivotal role in understanding the critical evaluating elements of performance measurement
(Verdecho et al. 2009; Ulbrich et al. 2011; MacCarthy and Jayarathne 2012; Alfalla-Luque et
al. 2012). The CDM based GrBSC approach assists managers in deciding if the suppliers’
performances meet the industry and environment standards and the human resource is
effective. The green SC performance measurement metrics and criteria are identified and
developed using the group decision-making process across the cross-functional decision-
making levels. The process of decision-making is collaborative as flow and subsequent
sharing of information is from one functional area to another.
Holistic constructs of the firm are presented that cover the entire supply-chain network, i.e.,
upstream and downstream companies along with the focal organisation. Wynder (2010),
while reporting a BSc framework with an emphasis on the relationships between leading and
lagging performance measures, considers the impact of environmental performance by
integrating environmental measures into the organisational strategy map. Thus, reactive and
proactive subjective factors are considered in performance evaluation. The factors cover
environmental, social, economic, and operational aspects of the SC. An analytical framework
is adapted to measure green-SC performance involving all concerned stakeholders thereby
aiding in decision-making in strategic, tactical and operational levels.
The practical implication of this research is diverse. Managers of organisations would benefit
in terms of decision-making performance and better managerial decision-making should
result in improved company performance. Scope to analyse and benchmark an organisation’s
environmental initiatives across the entire supply-chain is indicated in this research. The
empirical investigation into the UK-based carpet manufacturing company shows that internal
operations play a pivotal role in assessing environmental performance. It has also been
revealed that internal operations are dependent on suppliers’ activities. The outcome of
environmental initiatives and the level of integration of the SC may encourage managers to
pay more attention to audit and performance thereby improving overall green-SC
performance.
This empirical investigation into green-SC performance measurement determines the scope
for further improvement between the company and suppliers in regard to collaborative
information sharing, communication, eco-design and sustainable supply-chain performance.
Further, the outcome of the investigation generates room for improvement in regard to
supplier-customer-company relationship and various other improvement initiatives to achieve
better green supply-chain performance of the company. The limitation of the study lies in the
unscrupulous use of Saaty’s nine-point scale in arriving at a pre-determined consensus
opinion during the CDM process.
Although the company has stringent purchasing procedures there is no evidence that their
suppliers have green environmental practices embedded in their manufacturing processes.
Therefore, more emphasis should be placed on environmental issues by identifying and
implementing key environmental indicators, viz., biodegradable product, environment
friendly packaging, recycling. Further, the purchasing managers of the company feel that
there is room for improvement in providing more technical support to suppliers. Future
research could include implementation of the case with a more efficient CDM approach such
as integrated fuzzy multi-criteria planning tool combining quality function deployment and
ANP.
References
Alfalla-Luque, R., Medina-Lopez, C. and Dey, P.K., 2012. Supply chain integration framework using literature
review. Production Planning & Control: The Management of Operations, 1–18, iFirst.
Alfaro, J., Ortiz, A. and Poler, R., 2007. Performance measurement system for business processes. Production
Planning & Control: The Management of Operations, 18(8), 641–654.
Bai, C., Sarkis, J., Wei, X. and Koh, L., 2012. Evaluating ecological sustainable performance measures for
supply chain management. Supply Chain Management: An International Journal, 17(1), 78–92.
Beamon, B.M., 1999. Designing the green supply chain. Logistics Information Management, 12(4), 332–342.
Bhagwat, R. and Sharma, M.K., 2009. An application of the integrated AHP-PGP model for performance
measurement of supply chain management. Production Planning & Control: The Management of Operations,
20(8), 678–690.
Bhattacharya, A., Geraghty, J. and Young, P., 2010. Supplier selection paradigm: An integrated hierarchical
QFD methodology under multiple-criteria environment. Applied Soft Computing, 10(4), 1013–1027.
Björklund, M., Martinsen, U., Abrahamsson, M., 2012. Performance measurements in the greening of supply
chains. Supply Chain Management: An International Journal, 17(1), 29–39.
Braam, G.J.M. and Nijssen, E.J., 2004. Performance effects of using the Balanced Scorecard: a note on the
Dutch experience. Long Range Planning, 37(4), 335–349.
Butler, J.B., Henderson, S.C. and Raiborn, C., 2011. Sustainability and the balanced scorecard: integrating green
measures into business reporting. Management Accounting Quarterly, 12(2), 1–10.
Camarinha-Matos, L.M. and Abreu, A., 2007. Performance indicators for collaborative networks based on
collaboration benefits. Production Planning & Control: The Management of Operations, 18(7), 592–609.
Chan, F.T.S., Kumar, N., Tiwari, M.K., Lau, H.C.W. and Choy, K.L., 2008. Global supplier selection: a fuzzy-
AHP approach. International Journal of Production Research, 46(14), 3825-3857.
Cheffi, W. and Dey, P.K., 2012. Green supply chain performance measurement using balance scorecard in the
manufacturing industry. In: T. Baines, B. Clegg, and D. Harrison (Eds.), Proceedings of the 10th International
Conference on Manufacturing Research, Vol. 2, pp. 811-817, 11-13th September, Birmingham.
Cohen, Y., 2011. A new technique for evaluating the balanced scorecard dashboard values. Problems and
Perspectives in Management, 9(1), 78-84.
Cuthbertson, R. and Piotrowicz, W., 2008. Supply chain best practices – identification and categorisation of
measures and benefits. International Journal of Productivity and Performance Management, 57(5), 389–404.
Dey, P.K. and Cheffi, W., 2012. Green supply chain performance measurement using the analytic hierarchy
process: a comparative analysis of manufacturing organisations. Production Planning & Control: The
Management of Operations, iFirst, 1–19.
Figge, F., Hahn, T., Schaltegger, S. and Wagner, M., 2002. The sustainability balanced scorecard – linking
sustainability management to business strategy. Business Strategy and the Environment, 11(5), 269–284.
Gunasekaran, A. and Cheng, T.C.E., 2008. Special Issue on logistics: new perspectives and challenges. Omega
– The International Journal of Management Science, 36(4), 505–508.
Gunasekaran, A. and Kobu, B., 2007. Performance measures and metrics in logistics and supply chain
management: a review of recent literature (1995–2004) for research and applications. International Journal of
Production Research, 45(12), 2819–2840.
Gunasekaran, A., Patel, C. and McGaughey, R.E., 2004. A framework for supply chain performance
measurement. International Journal of Production Economics, 87(3), 333–347.
Hitchcock, T., 2012. Low carbon and green supply chains: the legal drivers and commercial pressures. Supply
Chain Management: An International Journal, 17(1), 98–101.
Hervani, A.A., Helms, M.M. and Sarkis, J., 2005. Performance measurement for green supply chain
management. Benchmarking: An International Journal, 12(4), 330-353.
Hofmann, E. and Locker, A., 2009. Value-based performance measurement in supply chains: a case study from
the packaging industry. Production Planning & Control: The Management of Operations, 20(1), 68–81.
van Hoek, R.I., 1999. From reversed logistics to green supply chains. Supply Chain Management: An
International Journal, 4(3), 129 – 135.
Hsu, C.-W., Hu, A.H., Chiou, C.-Y. and Chen, T.-C., 2011. Using the FDM and ANP to construct a
sustainability balanced scorecard for the semiconductor industry. Expert Systems with Applications, 38(10),
12891–12899.
Hult, G.T.M., Ketchen Jr., D.J., Cavusgil, S.T. and Calantone, R.J., 2006. Knowledge as a strategic resource in
supply chains. Journal of Operations Management, 24(5), 458–475.
Kaplan, R. S. and Norton, D. P., 1992. The balanced scorecard – measures that drive performance. Harvard
Business Review, 70(1), 71-79.
Kaplan, R.S. and Norton, D.P., 1996. The balanced scorecard: translating strategy into action. Boston: Harvard
Business School Press.
Ketokivi, M. and Heikkilä, J., 2003. A strategic management system for manufacturing: linking action to
performance. Production Planning & Control: The Management of Operations, 14(6), 487–486.
Lapide, L., 2000. What about measuring supply chain performance? White paper, ASCET, 2 (15), 287–297,
URL: http://ftp.gunadarma.ac.id/idkf/idkf-wireless/aplikasi/e-commerce/lapide.pdf, Accessed on 3 January
2013.
Länsiluoto, A. and Järvenpää, M., 2010. Greening the balanced scorecard. Business Horizons, 53(4), 385—395.
Lee, A.H.I., Chen, W.-C. and Chang, C.-J., 2008. A fuzzy AHP and BSC approach for evaluating performance
of IT department in the manufacturing industry in Taiwan. Expert Systems with Applications, 34(1), 96–107.
Leung, L.C., Lam, K.C. and Cao, D., 2006. Implementing the balanced scorecard using the analytic hierarchy
process & the analytic network process. The Journal of the Operational Research Society, 57(6), 682-691.
MacCarthy, B.L. and Jayarathne, P.G.S.A., 2012. Sustainable collaborative supply networks in the international
clothing industry: a comparative analysis of two retailers. Production Planning & Control: The Management of
Operations, 23(4), 252-268.
Malmi, T., 2001. Balanced scorecards in Finnish companies: A research note. Management Accounting
Research, 12(2), 207—220.
Martinsons, M., Davison, R. and Tse, D., 1999. The balanced scorecard: a foundation for the strategic
management of information systems. Decision Support Systems, 25(1), 71–88.
Mendes, P., Santos, A.C., Perna, F. and Teixeira, M.R., 2012. The balanced scorecard as an integrated model
applied to the Portuguese public service: a case study in the waste sector. Journal of Cleaner Production, 24
(March), 20–29.
Mettänen, P., 2005. Design and implementation of a performance measurement system for a research
organization. Production Planning & Control: The Management of Operations, 16(2), 178–188.
Möller, A. and Schaltegger, S., 2005. The sustainability balanced scorecard as a framework for eco-efficiency
analysis. Journal of Industrial Ecology, 9(4), 73–83.
Olugu, E.-U., Wong, K.-Y. and Shaharoun, A.-M., 2010. Development of key performance measures for the
automobile green supply chain. Resources Conservation and Recycling, 65(6), 567–579.
Rao, P., 2002. Greening the supply chain: a new initiative in South East Asia. International Journal of
Operations & Production Management, 22(6), 632 – 655.
Rao, P. and Holt, D., 2005. Do green supply chains lead to competitiveness and economic performance?
International Journal of Operations & Production Management, 25(9), 898–916.
Ravi, V., Shankar, R. and Tiwari, M.K., 2005. Analyzing alternatives in reverse logistics for end-of-life
computers: ANP and balanced scorecard approach. Computers and Industrial Engineering, 48(2), 327–356.
Saaty, T. L., 1980. The analytic hierarchy process. New York: McGraw-Hill.
Saaty, T. L., 1996. Decision making with dependence and feedback: The analytic network process. Pittsburgh,
PA: RWS Publications.
Sawalqa, F.A., Holloway, D. and Alam, M., 2011. Balanced scorecard implementation in Jordan. International
Journal of Electronic Business Management, 9(3), 196-210.
Shi, V.G., Koh, S.C.L., Baldwin, J. and Cucchiella, F., 2012. Natural resource based green supply chain
management. Supply Chain Management: An International Journal, 17(1), 54–67.
Stwart, R.A. and Mohamed, S., 2001. Utilizing the balanced scorecard for IT/IS performance evaluation in
construction. Construction Innovation, 1(3), 147–163.
Thakkar, J., Deshmukh, S.G., Gupta, A.D. and Shankar, R., 2006. Development of a balanced scorecard: an
integrated approach of Interpretive Structural Modeling (ISM) and Analytic Network Process (ANP).
International Journal of Productivity and Performance Management, 56(1), 25–59.
Tseng, M.-L., 2010. Implementation and performance evaluation using the fuzzy network balanced scorecard.
Computers & Education, 55(1), 188–201.
Tsoulfas, G. and Pappis, C., 2008. A model for supply chains environmental performance analysis and decision
making. Journal of Cleaner Production, 16(15), 1647–1657.
Ulbrich, S., Troitzsch, H., van den Anker, F., Plüss, A. and Huber, C., 2011. How teams in networked
organisations develop collaborative capability: processes, critical incidents and success factors. Production
Planning & Control: The Management of Operations, 22(5-6), 488-500.
Verdecho, M.J., Alfaro, J.J. and Rodriguez-Rodriguez, R., 2009. Foundations for collaborative performance
measurement. Production Planning & Control: The Management of Operations, 20(3), 193-205.
Wu, H.-Y., Tzeng, G.-H. and Chen, Y.-H., 2009. A fuzzy MCDM approach for evaluating banking performance
based on Balanced Scorecard. Expert Systems with Applications, 36(6), 10135–10147.
Wynder, M., 2010. Chemico: Evaluating performance based on the Balanced Scorecard. Journal of Accounting
Education, 28(3–4), 221–236.
Yang, J., 2011. A structural model of supply chain performance in an emerging economy. International Journal
of Production Research, iFirst, 1–9.
Yuan, F.-C. and Chiu, C., 2009. A hierarchical design of case-based reasoning in the balanced scorecard
application. Expert Systems with Applications, 36(1), 333–342.
Yüksel, Ì. and Dağdeviren, M., 2010. Using the fuzzy analytic network process (ANP) for Balanced Scorecard
(BSC): A case study for a manufacturing firm. Expert Systems with Applications, 37(2), 1270–1278.
Zhu, Q., Sarkis, J. and Lai, K.-h., 2007a. Green supply chain management: pressures, practices and performance
within the Chinese automobile industry. Journal of Cleaner Production, 15(11–12), 1041–1052.
Zhu, Q., Sarkis, J. and Lai, K.-h., 2007b. Initiatives and outcomes of green supply chain management
implementation by Chinese manufacturers. Journal of Environmental Management, 85(1), 179–189.
Zhu, Q., Sarkis, J. and Lai, K.-h., 2008. Confirmation of a measurement model for green supply chain
management practices implementation. International Journal of Production Economics, 111(2), 261–273.
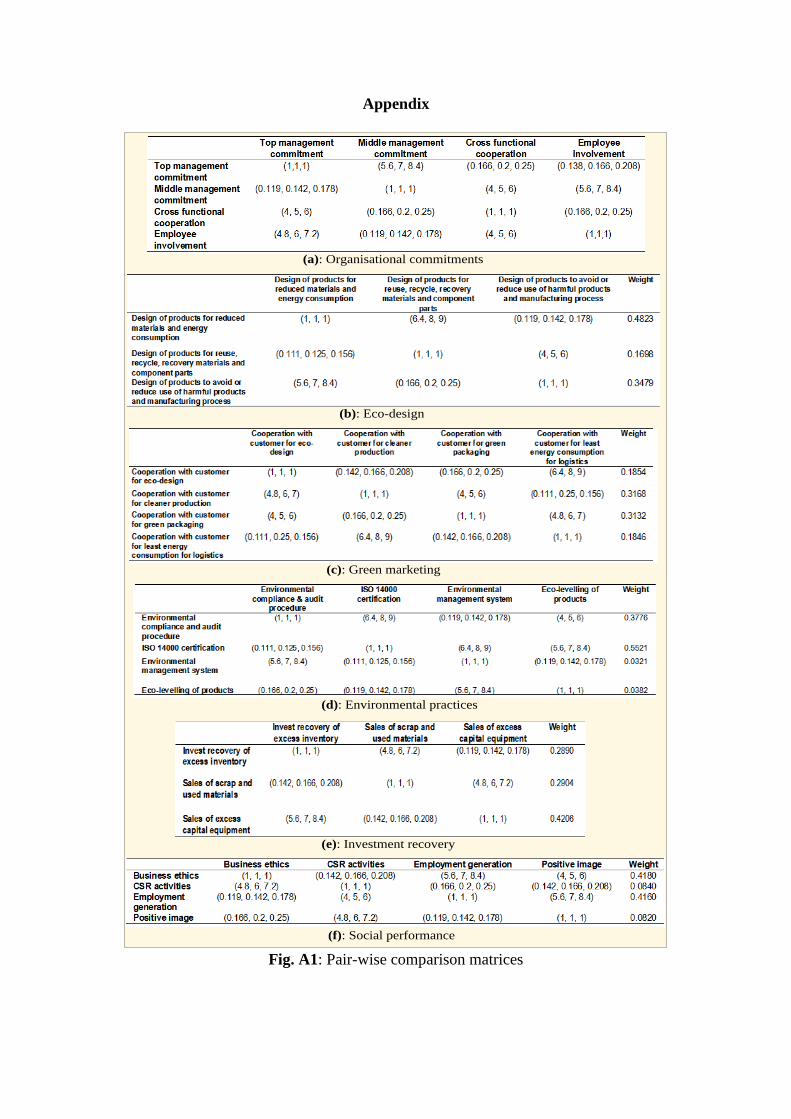
Appendix
(a): Organisational commitments
(b): Eco-design
(c): Green marketing
(d): Environmental practices
(e): Investment recovery
(f): Social performance
Fig. A1: Pair-wise comparison matrices
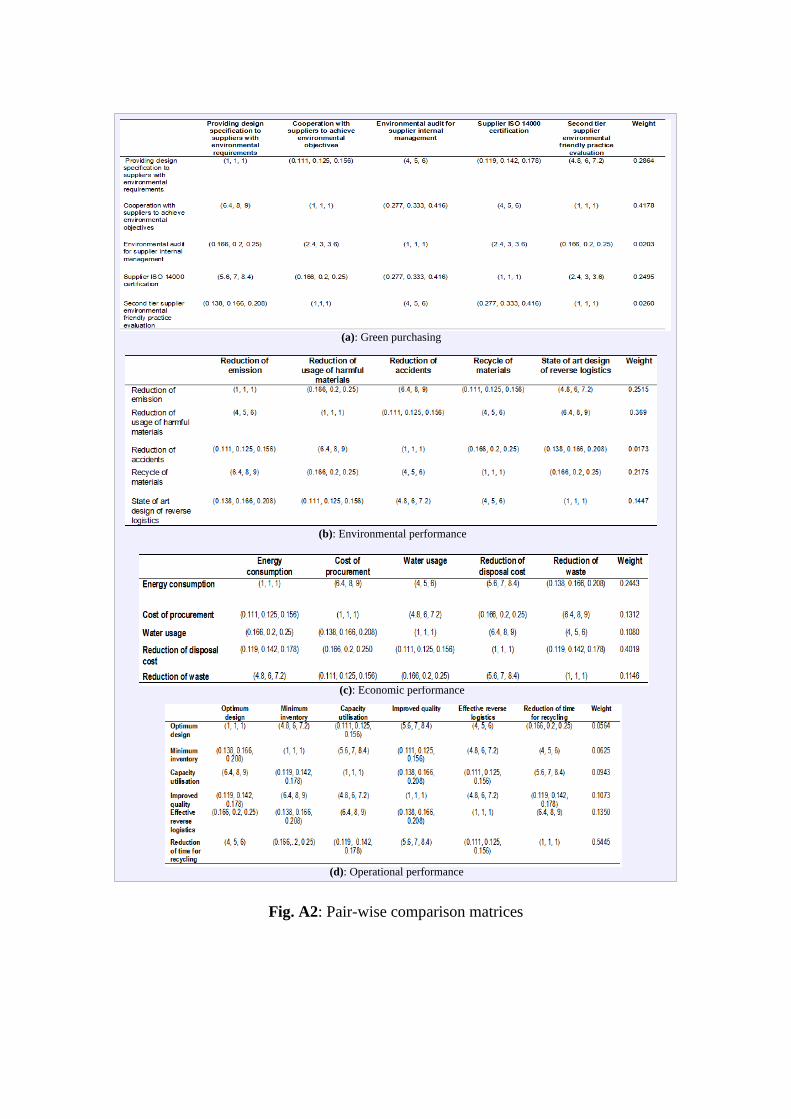
(a): Green purchasing
(b): Environmental performance
(c): Economic performance
(d): Operational performance
Fig. A2: Pair-wise comparison matrices
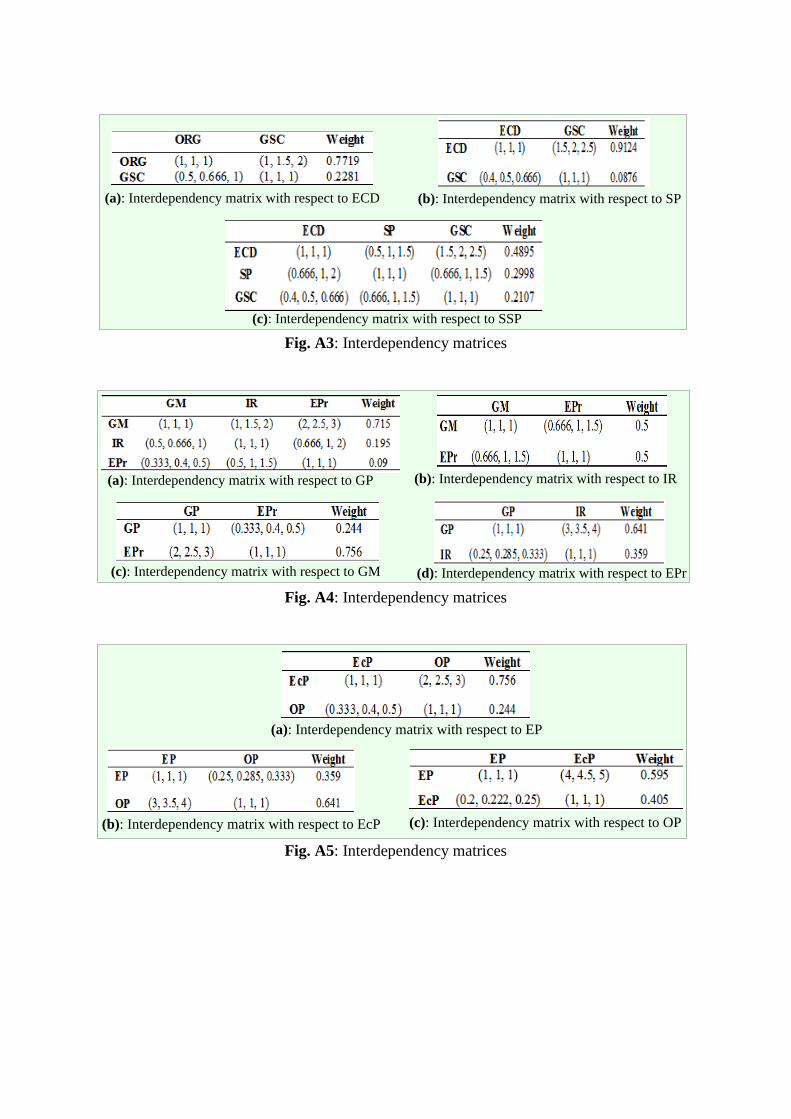
(a): Interdependency matrix with respect to ECD (b): Interdependency matrix with respect to SP
(c): Interdependency matrix with respect to SSP
Fig. A3: Interdependency matrices
(a): Interdependency matrix with respect to GP (b): Interdependency matrix with respect to IR
(c): Interdependency matrix with respect to GM (d): Interdependency matrix with respect to EPr
Fig. A4: Interdependency matrices
(a): Interdependency matrix with respect to EP
(b): Interdependency matrix with respect to EcP (c): Interdependency matrix with respect to OP
Fig. A5: Interdependency matrices