Embed Size (px)
Citation preview

GREEN SYNTHESIS, CHARACTERIZATION OF
ZINC OXIDE NANOPARTICLES AND THEIR
PHOTOCATALYTIC ACTIVITY
WONG HONG LIANG
BACHELOR OF SCIENCE (HONS) CHEMISTRY
FACULTY OF SCIENCE
UNIVERSITI TUNKU ABDUL RAHMAN
MAY 2016
GREEN SYNTHESIS, CHARACTERIZATION OF
ZINC OXIDE NANOPARTICLES AND THEIR
PHOTOCATALYTIC ACTIVITY
By
WONG HONG LIANG
A project report submitted to the Department of Chemical Science,
Faculty of Science,
Universiti Tunku Abdul Rahman,
in partial fulfillment of the requirements for the degree of
Bachelor of Science (Hons) Chemistry
May 2016
ii
ABSTRACT
GREEN SYNTHESIS, CHARACTERIZATION OF
ZINC OXIDE NANOPARTICLES AND THEIR
PHOTOCATALYTIC ACTIVITY
WONG HONG LIANG
Zinc oxide (ZnO) is a well- known n-type semiconductor with a band gap of 3.37
eV and excitation binding energy of 60 meV, hence consider as one of the best
photocatalyst for degradation of pollutants in water. In order to enhance the
photocatalytic activity of ZnO, nano-sized ZnO (ZnO NPs) have been synthesized
to increase the surface area and enhance the photocatalytic activity. However, the
synthesis of zinc oxide nanoparticles by conventional chemical methods always
involves utilization of toxic chemical and expensive instruments along with the
tedious process control. Therefore, it is a great demand for developing a simple,
low cost and environmentally-friendly green method for synthesizing of ZnO NPs.
In this study, synthesis of ZnO NPs using Cavendish banana peel extract (BP) as
reducing agent and capping agent was reported. BP extract was prepared by
boiling clean BP with deionized water for 10 minutes and filtered through filter
paper twice. Then, BP extract was added dropwise into a pre-prepared zinc
iii
acetate salt solution and stirred for 10 minutes on magnetic stirring hotplate. Zinc
metal was precipitated out by adding in a base, 2M NaOH until the pH of the
solution becomes pH 12 and finally, ZnO NPs was obtained through washing with
water, filtration and dried in a 60oC oven. The synthesized ZnO NPs have been
characterized using XRD, EDX, FTIR spectroscopy, UV-Vis spectroscopy, SEM
and PSA. The photocatalytic activity of ZnO NPs has been investigated by
degradation of Congo Red (CR) and Malachite Green (MG) dyes in aqueous
solution with exposure to sunlight. The extent of dye degradation by ZnO NPs is
monitored by using UV-Vis spectrophotometer.
iv
ABSTRAK
SINTESIS, PENCIRIAN
DAN AKTIVITI FOTOKATALITIK
ZINK OKSIDA NANOPARTIKEL
WONG HONG LIANG
Zink oksida (ZnO) merupakan n-jenis semikonduktor yang terkenal dengan
jurang jalur 3.37 eV dan tenaga ikatan teruja 60 MeV, oleh itu zink oksida
dianggap sebagai salah satu fotokatalis yang terbaik untuk degradasi bahan
pencemaran dalam air buangan. Untuk meningkatkan aktiviti fotokatalitik ZnO,
ZnO yang bersaiz nano (ZnO NPs) telah disintesis untuk meningkatkan kawasan
permukaan dan aktiviti fotokatalitik. Walau bagaimanapun, sintesis nanopartikel
zink oksida yang diperolehi dengan kaedah kimia konvensional melibatkan
penggunaan bahan kimia yang bertoksik dan kos instrumen yang mahal tambahan
lagi dengan kawalan proses yang rumit. Oleh itu, pada masa kini terdapat
permintaan yang besar untuk mensintesi ZnO NPs dengan cara yang lebih mudah,
melibatkan kos rendah dan mengguna kaedah hijau mesra alam. Dalam kajian ini,
sintesis ZnO NPs menggunakan Cavendish ekstrak kulit pisang (BP) sebagai agen
penurunan dan agen penstabil dilaporkan. Ekstrak BP telah disediakan dengan

v
mendidih BP yang bersih dalam air ternyahion selama 10 minit dan ditapis
melalui kertas penapis dua kali. Kemudian, ekstrak BP telah ditambah setitik-
setitik ke dalam larutan zink asetat garam dengan proses pengacauan dijalankan
selama 10 minit dengan magnet kacau plat panas. Logam zink dicetuskan dengan
menambah dalam pangkalan, 2M NaOH sehingga pH penyelesaian menjadi pH
12 dan akhirnya, ZnO NPs dicuci dengan menggunakan air ternyahion beberapa
kali, penapisan dan dikeringkan dalam ketuhar 60oC. Pencirian ZnO NPs yang
disintesis dikenalpastikan dengan mengguna XRD, EDX, FTIR spektroskopi,
spektroskopi ultra lembayung-cahaya nampak, SEM dan PSA. Aktiviti
fotokatalitik ZnO NPs telah dikaji melalui degradasi Congo Red (CR) dan
Malachite Green (MG) pewarna dalam larutan akueus dengan penyinaran cahaya
matahari. Tahap degradasi pewarna oleh ZnO NPs dipantau dengan menggunakan
spektrofotometer ultra lembayung-cahaya nampak.

vi
ACKNOWLEDGEMENTS
First of all, I would like to express my sincere gratitude to Faculty of Science,
Universiti Tunku Abdul Rahman (UTAR) for providing me such a great
opportunity to explore on the research field. This opportunity has been provided
me precious experience on how a basic research really looks like.
Next, I would like to express my deep appreciation to my final year project’s
supervisor, Dr. Mohammod Aminuzzaman for his enthusiasm, guidance and
constant encouragement throughout the research period. His regular advice and
suggestion made my work easier and proficient. I really appreciate the time he has
taken to supervise me on skill and knowledge, thank you once again.
Furthermore, I am really feeling grateful to receive help from all laboratory
officers from Faculty of Science (especially Mr. Ooh Keng Fei, Mr. Leong Thung
Lim, Mr. Seou Chi Kien and Mr. Saravanan a/l Sivasangaran), Faculty of
Engineering and Green Technology (Mr. Chin Kah Seng) and Dr. Ooi Mei Lee.
They provided me a lot of useful techniques on handling equipment correctly as
well as assisted me to run my synthesized product by using XRD, EDX, SEM,
Particle Size Analyzer and LC-MS.
Last but not least, a special word of thanks also goes to my amazing family and
friends (especially my lab partner, Ms. Leong Mei Kei) for their continuous and
unconditional support, love and encouragement throughout the progress of this
research.

vii
DECLARATION
I hereby declare that the project report is based on my original work except for
quotations and citations which have been duly acknowledged. I also declare that it
has not been previously or concurrently submitted for any other degree at UTAR
or other institutions.
___________________
WONG HONG LIANG

viii
APPROVAL SHEET
I certify that, this project report entitled “GREEN SYNTHESIS,
CHARACTERIZATION OF ZINC OXIDE NANOPARTICLES AND
THEIR PHOTOCATALYTIC ACTIVITY” was prepared by WONG HONG
LIANG and submitted as partial fulfillment of the requirements for the degree of
Bachelor of Science (Hons) Chemistry at Universiti Tunku Abdul Rahman.
Approved by:
___________________________________ Date: ________________
(Asst. Prof. Dr. Mohammod Aminuzzaman)
Supervisor
Department of Chemical Science
Faculty of Science
Universiti Tunku Abdul Rahman
ix
FACULTY OF SCIENCE
UNIVERSITI TUNKU ABDUL RAHMAN
Date: ___________________
PERMISSION SHEET
It is hereby certified that WONG HONG LIANG (ID No: 12ADB03697) has
completed this thesis entitled “GREEN SYNTHESIS, CHARACTERIZATION
OF ZINC OXIDE NANOPARTICLES AND THEIR PHOTOCATALYTIC
ACTIVITY” under supervision of Asst. Prof. Dr. Mohammod Aminuzzaman
from Department of Chemical Science, Faculty of Science.
I hereby give permission to the University to upload the softcopy of my thesis in
pdf format into the UTAR Institutional Repository, which may be made
accessible to the UTAR community and public.
Yours truly,
_____________________
(WONG HONG LIANG)
x
TABLE OF CONTENTS
Page
ABSTRACT ii
ACKNOWLEDGEMENTS vi
DECLARATION vii
APPROVAL SHEET viii
PERMISSION SHEET ix
TABLE OF CONTENTS x
LIST OF TABLES xiii
LIST OF FIGURES xiv
LIST OF ABBREVIATIONS xix
CHAPTER
1 INTRODUCTION 1
1.1 Background of Study 1
1.2 Zinc Oxide Nanoparticles 2
1.2.1 Synthesis of Zinc Oxide Nanoparticles 4
1.3 Mechanism of Photocatalysis In Degradation of Dye 9
1.4 Objectives of Study 11
2 LITERATURE REVIEW 12
xi
2.1 Green Synthesis of ZnO NPs 12
2.1.1 Synthesis Using Plant Extracts 13
2.1.2 Synthesis Using Agricultural Waste or Fruit Extracts 20
3 METHODOLOGY 28
3.1 Chemicals 28
3.2 Preparation of Cavendish Banana Peel (BP) Extract 28
3.3 Green Synthesis of Zinc Oxide Nanoparticles 30
3.4 Characterization of Synthesized Zinc Oxide Nanoparticles 32
3.5 Photocatalytic Activity of Synthesized Zinc Oxide
Nanoparticles 36
3.5.1 Preparation of Dye Aqueous Solutions 36
3.5.2 Photocatalytic Dye Degradation 36
3.5.3 Determination of Percentage of Degradation 39
3.5.4 Identification of Degradation Products 39
4 RESULTS AND DISCUSSION 40
4.1 Green Synthesis of Zinc Oxide Nanoparticles 40
4.2 Characterization of Synthesized Zinc Oxide Nanoparticles 42
4.2.1 X-ray Diffraction (XRD) 42
4.2.2 Energy Dispersive X-ray Spectroscopy (EDX) 44

xii
4.2.3 Fourier Transform Infrared Spectroscopy (FTIR) 46
4.2.4 Ultraviolet-Visible Spectroscopy
(UV-Vis Spectroscopy) 48
4.2.5 Scanning Electron Microscope (SEM) 50
4.2.6 Particle Size Analyzer (PSA) 51
4.3 Evaluation of Photocatalytic Activity of Synthesized Zinc
Oxide Nanoparticles 52
4.3.1 Degradation of Congo Red Dye in Aqueous Solution
Using ZnO NPs under Solar Irradiation 53
4.3.2 Degradation of Malachite Green Dye in Aqueous
Solution Using ZnO NPs under Solar Irradiation 56
4.3.3 Adsorption-Desorption and Photodegradation of
Dye Aqueous Solution 59
4.3.4 Identification of Degradation Products for Malachite
Green Dye Aqueous Solution by Liquid
Chromatography-Mass Spectrometry 61
5 CONCLUSION 66
REFERENCES 68
APPENDICES 77

xiii
LIST OF TABLES
Table Page
1.1 Conventional chemical synthesis methods for ZnO NPs 6
3.1 Time intervals for beakers to be collected during
degradation process 37
4.1 EDX analysis processing data 44
xiv
LIST OF FIGURES
Figure Page
1.1 Hexagonal-Wurzite structure of ZnO 2
1.2 Application of ZnO NPs 3
1.3 Synthetic methods for nanoparticles 4
1.4 Schematic diagram illustrated top-down and bottom-up
synthesis 5
1.5 Schematic diagram for the uses of plant extract in
nanoparticles synthesis 8
1.6 Chemical structure of dopamine and L-DOPA 8
1.7 Schematic diagram of photocatalysis degradation mechanism 9
2.1 Ocium tenuiflorum plant 13
2.2 Characterization of ZnO NPs produced using Ocium
tenuiflorum plant extract - (A) XRD analysis and (B)
SEM image 14
2.3 Overview of Duranta erecta L. plant 15
2.4 Various parts of Duranta erecta L. plant 15
2.5 Characterization of ZnO NPs produced using Trifolium
pratense flower extract- (A) SEM image and EDX spectrum
and (B) FTIR spectrum 16
2.6 Green tea leaves (A) Before and (B) After drying 17

xv
2.7 Characterization of ZnO NPs produced using Camellia
sinesis leaves extract - (A) Particle size analysis data, (B) SEM
image and (C) UV-Vis spectrum 18
2.8 Limonia acidissima L. leaves 19
2.9 Characterization of ZnO NPs produced using Limonia
acidissima L. leaves extract- (A) UV-Vis spectrum,
(B) TEM image, (C) 2-D AFM topography and
(D) 3-D AFM topography 19
2.10 Poncirus trifoliata or trifoliate orange 21
2.11 Characterization of ZnO NPs produced using Poncirus
trifoliata- (A) TEM image, (B) SEM image and (C) EDX
spectrum 21
2.12 Artocarpus gomezianus 22
2.13 Characterization of ZnO NPs produced using
Artocarpus gomezianus- (A) TEM image and (B) SEM image 22
2.14 3-D AFM topography of ZnO NPs produced using
Nephelium lappaceum L. peel extracts 23
2.15 Proposed reaction mechanism for Nephelium lappaceum L.
peel extract 24
2.16 (A) Plant of Rosa canina and (B) Riped Fruit of Rosa
canina, Rosehip 25

xvi
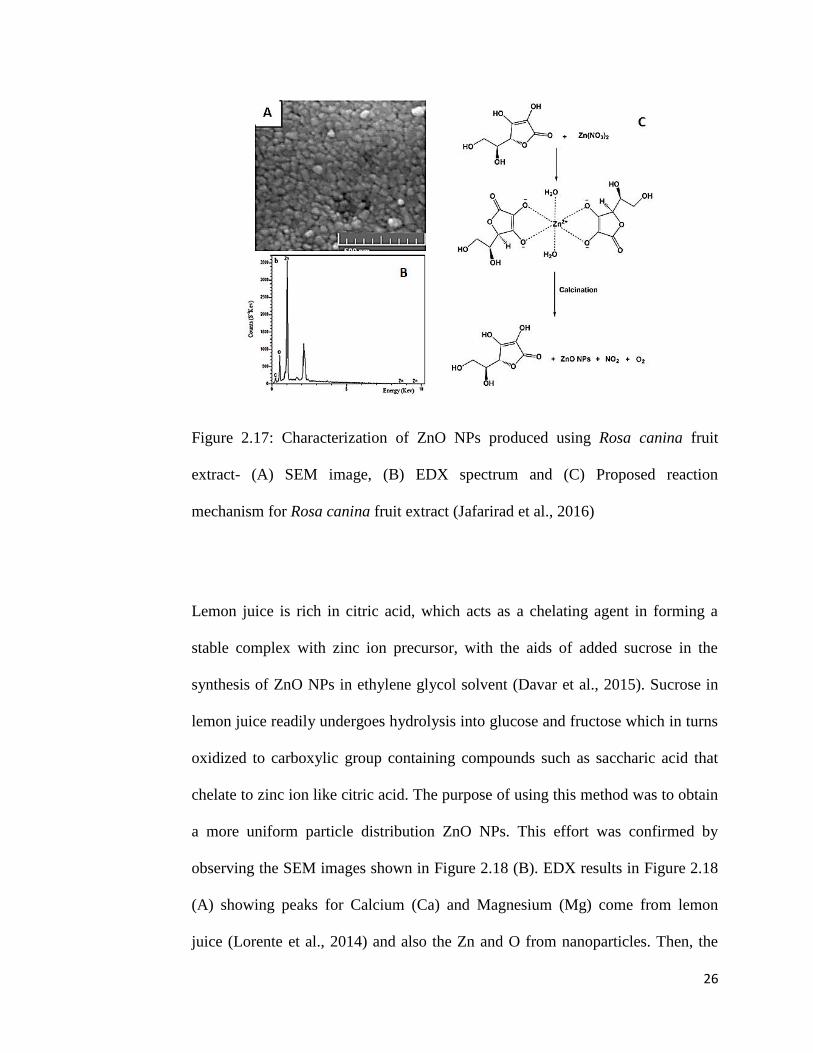
2.17 Characterization of ZnO NPs produced using Rosa canina
fruit extract- (A) SEM image, (B) EDX spectrum and (C)
Proposed reaction mechanism for Rosa canina fruit extracts 26
2.18 Characterization of ZnO NPs produced using lemon juice-
(A) EDX spectrum and (B) SEM image 27
2.19 Proposed reaction mechanism for lemon juice 27
3.1 Process flowcharts for the preparation of Cavendish BP
extract 29
3.2 Process flowcharts for the preparation of ZnO NPs using
BP extract 31
3.3 Shimadzu XRD 6000 33
3.4 Perkin Elmer RX 1 FTIR Spectrometer 34
3.5 Perkin Elmer Lambda 35 UV-Visible Spectrophotometer 34
3.6 JEOL JSM-6701F SEM-EDX 35
3.7 Malvern Particle Size Mastersizer 2000 35
3.8 Process flowchart of photocatalytic dye degradation under solar
irradiation 38
4.1 Photograph of ZnO NPs synthesized using Cavendish BP
extract 40
4.2 XRD Diffractogram of Synthesized ZnO NPs 42
4.3 EDX spectrum of synthesized ZnO NPs 44

xvii
4.4 FTIR spectra of synthesized ZnO NPs with BP extract 46
4.5 UV-Visible spectrum of synthesized ZnO NPs 48
4.6 SEM images of synthesized ZnO NPs at different
magnifications 50
4.7 Particle size analysis spectrum with processing data 51
4.8 UV-Vis spectrum of CR dye degradation as a function of
contact time (minutes) 53
4.9 Photograph of degraded CR dye aqueous solution in different
time interval 53
4.10 Chemical structure of CR dye 54
4.11 Degradation percentage of CR as a function of time 54
4.12 UV-Vis spectrum of MG dye degradation as a function of
contact time (minutes) 56
4.13 Photograph of degraded MG dye aqueous solution in different
time intervals 56
4.14 Chemical structure of MG dye 57
4.15 Degradation percentage of MG as a function of time 57
4.16 Mass spectra of (A) 4-hydroxybenzoic acid,
(B) 4-(dimethylamino)-benzophenone, (C) didesmethyl MG,
(D) desmethyl MG, (E) MG, (F) Leuco MG and
(G) MG leucocarbinol 61

xviii
4.17 Tentative degradation pathway of MG dye in aqueous
solution using ZnO NPs 64

xix
LIST OF ABBREVIATIONS
2-D Two dimensional
3-D Three dimensional
A Ampere or absorbance
Å Angstrom
Ao Initial absorbance of dye solutions
Ai Absorbance of dye solutions at a given contact time
AA Ascorbic acid
AFM Atomic Force Microscope
Al Aluminum
BP Banana peel
C Carbon
c Speed of light
Ca Calcium
CB Conduction band
cm-1
Frequency unit or wavenumber
CO2 Carbon dioxide
CR Congo Red
Ebg Band gap energy
EDX Energy Dispersive X-ray

xx
eV Electronvolt
e- Electron
FTIR Fourier Transform Infrared
FWHM Full width half maximum
g Gram
GC-MS Gas chromatography-mass spectrometry
h Planck’s constant
HO Hydroxyl radical
HO Hydroperoxyl radical
hv Light
H2O Water molecule
H2O2 Hydrogen peroxide
JCPDS Joint Committee on Powder Diffraction Standards
k Sherrer constant
KBr Potassium bromide
kV Kilovolt
L Liter
LC-MS Liquid chromatography-mass spectrometry
M Mega or molar concentration
m Milli
MB Methylene Blue

xxi
MG Malachite Green
Mg Magnesium
MO Methyl Orange
MR Methyl Red
MS Mass spectrum
NaOH Sodium hydroxide
nm Nanometer
O Oxygen
OH- Hydroxide ion
OM Organic molecules
O2 Oxygen
O -
Superoxide
PEG Polyethylene glycol
pH Potential of hydrogen
pHzpc pH point of zero charge
ppm Part per million
PSA Particle Size Analyzer
Q-TOF Quadrupole-Time-Of-Flight
rpm Revolution per minute
SDS Sodium dodecyl sulphate
SEM Scanning Electron Microscope

xxii
TEM Transmission Electron Microscope
TiO2 Titanium (IV) dioxide
UV Ultraviolet
UV-Vis Ultraviolet-Visible
VB Valence band
VOC Volatile organic solvent
W Waltz
XRD X-ray Diffraction
ZnO Zinc oxide
ZnO NPs Zinc oxide nanoparticles
Zn(0) Zinc(0)
Zn(II) Zinc(II)
Zn(OH)2 Zinc hydroxide
λ Wavelength of X-ray source or lambda
λmax Lambda maximum
oC Degree Celsius
θ Bragg’s diffraction angle
β Full width at half-maximum of the diffraction peak
π Pi
μ Micro

1
CHAPTER 1
INTRODUCTION
1.1 Background of Study
Nanotechnology is being widely applied in the field of material science in the past
decades. This concept was first attempted in an American physicist, Richard
Feynman’s lecture in 1959 (Kavitha et al., 2013). Nanotechnology is dealing with
the production of materials in a nanometer scale level, normally from 1 to 100
nanometers (nm) such as carbon nanotube (Martel et al., 1998), metal nanowire
(Penner et al., 2003) with unique electrical and mechanical properties and
nanoparticles. Nanoparticles are of great interest due to their small size and large
surface area to volume ratio (Poinern et al., 2015) that give rise to some of the
superior properties than their bulk phase such as antimicrobial, catalytic,
electronic, magnetic and optical properties (Shah et al., 2015)

2
1.2 Zinc Oxide Nanoparticles
Metal and metal oxide nanoparticles such as titanium (IV) dioxide (TiO2) and zinc
oxide (ZnO) have been extensively studied by many researchers due to their good
stability toward harsh process conditions (Ramesh et al., 2014). Zinc oxide
nanoparticles (ZnO NPs) are one of the metal oxide nanoparticles which are non-
toxic, insoluble in water with density of 5.606 g cm-1
and appear as a white
powder with refractive index of 2.0041. It also possesses a high boiling and
melting points which are 2360oC and 1975
oC respectively. The crystal structure of
ZnO is in hexagonal-wurzite shown in Figure 1.1 where oxygen atoms (white
spheres) are tetrahedral coordinated to Zn atom (black spheres).
Figure 1.1: Hexagonal-Wurzite structure of ZnO (Sabir et al., 2014)

3
The most attractive factor in using ZnO NPs is that it has versatile application
where some of them are shown in Figure 1.2.
Figure 1.2: Application of ZnO NPs (Kolodziejczak-Radzimska et al., 2014;
Oudhia et al., 2015 and Gnanasangeetha and Thambavani, 2014)
ZnO NPs is a semiconductor with wide band gap energy of 3.37 eV and large
excitation binding energy of 60 MeV. (Varghese and George, 2015). The
similarity of semiconductor properties between ZnO NPs and the well-known
photocatalyst system in the degradation of organic dyes, TiO2 NPs with 3.2 eV
band gap energy (Giwa et al., 2012) makes it another powerful photocatalyst
possible in the degradation of dyes.
Application of ZnO NPs
Rubber Industry
Pharmaceutical and Cosmetic
Industries
Photocatalysis
Micellaneous applications
Electronics and Electrotechnology
Industries
Textile Industry

4
1.2.1 Synthesis of Zinc Oxide Nanoparticles
There are various synthetic methods have been reported by researchers to
synthesize nanoparticles mainly divided into three classes shown in Figure 1.3.
Figure 1.3: Synthetic methods for nanoparticles (Kumar et al., 2015)
Nanoparticles can be obtained via either top-down or bottom-up processes shown
in Figure 1.4. Top-down process also called physical methods involved the
breaking down of bulk into small using mechanical energy such as lithography
whereas bottom-up process also called chemical methods involved the joining
atom by atom forming nano-sized particles (Saravanan et al., 2008).
Method of Nanoparticles
Synthesis
Physical Method
Ultrasonication, Laser Ablation and Irradiation
Chemical Method
Microemulsion, Hydrothermal, Electrochemical and Sol Gels methods
Biological Method
Microorganisms and Plant Extract

5
Figure 1.4: Schematic diagram illustrated top-down and bottom-up synthesis
In order to obtain a desired size, shape, stability and physiochemical properties of
synthesized nanoparticles, the reaction conditions must be properly designed in
some factors such as the temperature and pressure control, and the requirement of
the reducing agent (reduction of metal ion) and stabilizing agent (restrict
nanoparticles from agglomeration) towards the metal ion precursor
(Shamsuzzaman et al., 2014). In the conventional synthetic method, both physical
and chemical often required reducing agent and stabilizing agent that are non-
benign and highly toxic to the surrounding environment. Besides, these methods
are also costly, high energy consumption and the high possibility for the
formation of toxic by-product (Senthilkumar and Sivakumar, 2014). A list of
chemical synthesis method in details was shown in Table 1.1.

6
Table 1.1: Conventional chemical synthesis methods for ZnO NPs
(Kolodziejczak-Radzimska et al., 2014)
Chemical Methods Precursors Reaction Conditions
Precipitation with
surfactants
Zinc nitrate, NaOH, SDS
and triethanolamine
Temperature:101oC
Duration: 50-55 minutes
Sol-Gel Method
Zinc acetate, oxalic acid,
ethanol and methanol
Temperature: 60oC
Drying: 80oC for 24 h
Calcination: 500oC
Hydrothermal
Method
Zinc chloride, NaOH
Temperature: 100-220oC
Duration: 5-10 h
Equipment: Teflon-lined
autoclave
Microemulsion
Zinc nitrate, NaOH,
heptane, hexanol, Triton
X-100, PEG-400
Temperature: 140oC
Duration: 15 h
Drying: 60oC
However, these problems can be effectively reduced through a greener approach
in using the biological method production. This method employs the use of
microorganisms such as bacteria and fungi or plant extract. Plant extract has been
reported to be more advantageous over the microbes as it does not required high
cost of isolation, cultivation and maintenance, high yield can be obtained in a
short period of time for industrial scale consideration and etc. (Shamsuzzaman et
al., 2014).

7
Plant extract is used as a potential substitute for the reducing agent and stabilizing
agent due to the combination of its bio-components such as alkaloids, terpenoids,
tannins, phenolics, amino acids, proteins, enzymes, polysaccharides, saponins,
vitamins and etc. (Ahmed et al., 2016). Besides, various fruits peel extracts are of
great interest because somehow they are having the similar properties to the plant
extract as certain fruit peels are also rich in these bio-components and easily
available. Meanwhile, it is a very good practice in the sense of fully utilizing the
waste created and reduces their impacts to the environment that highly fulfilled
the green chemistry aspect. On the basis of reported information, banana peel
extract is one of the potential materials available for the synthesis of nanoparticles
because it contained a huge amount of dopamine and L-DOPA as well as other
bio-components that serve as the reducing agent and macromolecules such as
lignins, pectins, and hemicellulose with stabilizing properties (Kokila et al., 2015).
Dopamine and L-DOPA are catecholamine with high antioxidant activity due to
the presence of catechol functional group (Gonzalez-Montelongo et al., 2010;
Jodko-Piorecka et al., 2015).

8
Figure 1.5: Schematic diagram for the uses of plant extract in nanoparticles
synthesis (Poinern et al., 2015)
Dopamine L-DOPA
Figure 1.6: Chemical structure of dopamine and L-DOPA
(Jodko-Piorecka et al., 2015)

9
1.3 Mechanism of Photocatalysis In Degradation of Dye
Figure 1.7: Schematic diagram of photocatalysis degradation mechanism
(Giwa et al., 2012)
Figure 1.7 shows the mechanism of photocatalysis where a series of reaction
occurred on the surface of ZnO NPs. Photocatalysis is first initiated by placing
ZnO NPs suspension under natural sunlight, an electron (e-) will be promoted
from the valence band (VB) to the conduction band (CB) of semiconductor
through absorbing energy from UV-light generates an excited electron and a hole
shown in (1.1).

10
n n (h e-) (1.1)
This pair of electron and hole can be either recombine with each other or initiates
a series of photo-oxidation and photo-reduction reactions with oxygen on the
surface of the ZnO NPs semiconductor shown in (1.2) to (1.9).
2 e- 2
- (1.2)
2 - h
2
(1.3)
2 2
2 2 2 (1.4)
2 - 2
2 2
- (1.5)
2- 2 2 (1.6)
2 2 hv 2 (1.7)
2 2 2 -
- 2 (1.8)
2 2 e-
- (1.9)
(Curri et al., 2003; Giwa et al., 2012)
In the solution, hole generated oxidizes the hydroxide ion (-OH) and water (H2O)
forming hydroxyl radical shown in (1.10) to (1.11). These reactions resulted in the
formation of a very powerful oxidizing agent, hydroxyl radical ( ) which is the
species responsible to complete the mineralization of dye molecules (OM) into
end product carbon dioxide (CO2) and water (H2O) if time permitted (1.12).

11
h
-
(1.10)
h 2
(1.11)
Degradation ntermediates C 2 2 salt (1.12)
(Curri et al., 2003; Giwa et al., 2012)
1.4 Objectives of Study
1. To synthesize ZnO NPs through a green synthetic pathway using
Cavendish banana peel extract.
2. To characterize synthesized ZnO NPs using Fourier Transform Infrared
(FTIR) Spectroscopy, Ultraviolet-Visible (UV-Vis) Spectroscopy, Energy
Dispersive X-ray Spectroscopy (EDX), Scanning Electron Microscope
(SEM), X-ray Diffraction (XRD) and Particle Size Analyzer (PSA).
3. To evaluate the photocatalytic activity of the synthesized ZnO NPs by
degradation of diazo dye, Congo Red (CR) and cationic dye, Malachite
Green (MG) in aqueous solution with exposure to natural sunlight. The
extent of dye degradation by ZnO NPs is monitored by using UV-Vis
spectrophotometer. Preliminary screening of the intermediate products as
well as the photocatalytic degradation pathway of MG are analyzed,
identified and proposed using Liquid Chromatography-Mass Spectrometry
(LC-MS).

12
CHAPTER 2
LITERATURE REVIEW
2.1 Green Synthesis of ZnO NPs
The usefulness of nanoparticles is so attractive that bulk synthesis often required.
Researchers nowadays are more preferred to synthesize nanoparticles using plant,
agricultural waste and fruit extract to minimize the uses of toxic chemicals and
harsh reaction conditions that consequently contribute significant risk to the
environment. In this literature review, ZnO NPs synthesized using green methods
are listed into two categories which are plant extracts (Duranta erecta L., Ocium
tenuiflorum, Camellia sinesis, Limonia acidissima L., and Trifolium pretense) and
agricultural waste and fruit extracts (Rambutan peel, lemon juice, Artocarpus
gomezianus, trifoliate orange and Rosa canina fruit) that has been studied by
other researchers.

13
2.1.1 Synthesis Using Plant Extracts
A member of Lamiacece family, Ocium tenuiflorum plant leaves extract of was
used by Raut et al., (2013) to synthesize ZnO NPs. The authors reported that a
mixture of Ocium tenuiflorum plant extract and zinc nitrate solution was stirred
together forms a light yellow color ZnO NPs with an average crystalline size of
13.86 nm and 11-25 nm hexagonal particle diameters from XRD analysis and
SEM image shown in Figure 2.2. The presence of bio-components, mainly
alkaloids, tannins, glycosides, ursolic acid flavonoids etc. (Joshi et al., 2010;
Devendran et al., 2011; Aqil et al., 2006) on the surface of nanoparticles was
observed through the FTIR analysis where hydroxyl, amine, alkyl halide and etc.
bond vibrational bands were found in the spectrum. The formation of ZnO NPs
was confirmed by observing the Zn-O bond vibration in fingerprint region of the
spectrum.
Figure 2.1: Ocium tenuiflorum plant (Raut et al., 2013)

14
Figure 2.2: Characterization of ZnO NPs produced using Ocium tenuiflorum plant
extract- (A) XRD analysis and (B) SEM image (Raut et al., 2013)
Shekhawat et al., (2016) reported the uses of fruits, leaves, flowers, stems and
roots of a Verbenaceae family member often found in tropical and subtropical
country around the world which normally used for decoration, Duranta erecta L.
plant to synthesize ZnO NPs and characterized using UV-Vis spectroscopy.
Previous study was done by other researchers verified that it contains some
phytoconstituents in methanolic extract such as polyphenols (tannins and
flavonoids), saponins, alkaloids and glycosides (Ahmed et al., 2009; Khanal et al.,
2014; Sharma et al., 2012). It possesses the antioxidant properties due to the
presence of flavonoids, alkaloids, tannins and etc. By referring to the UV-Vis
spectra obtained, each part of the plant extract given the different values of λmax
under the Ultraviolet (UV) region which are 293 nm for roots, 299 nm for flowers
and stems, 302 nm for leaves and 317 nm for fruits. These values of λmax in the
range of 290 nm – 320 nm are the characteristic absorption peaks from ZnO NPs.
15
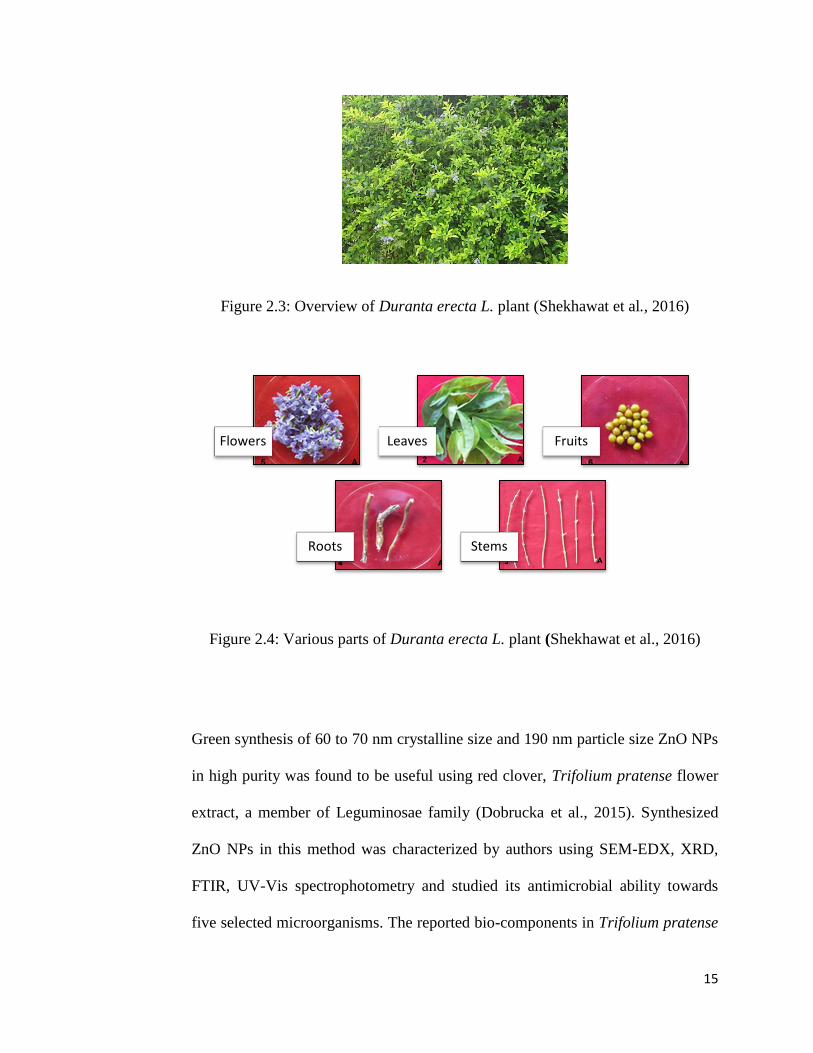
Figure 2.3: Overview of Duranta erecta L. plant (Shekhawat et al., 2016)
Figure 2.4: Various parts of Duranta erecta L. plant (Shekhawat et al., 2016)
Green synthesis of 60 to 70 nm crystalline size and 190 nm particle size ZnO NPs
in high purity was found to be useful using red clover, Trifolium pratense flower
extract, a member of Leguminosae family (Dobrucka et al., 2015). Synthesized
ZnO NPs in this method was characterized by authors using SEM-EDX, XRD,
FTIR, UV-Vis spectrophotometry and studied its antimicrobial ability towards
five selected microorganisms. The reported bio-components in Trifolium pratense
Flowers Leaves Fruits
Roots Stems

16
were major in estrogenic isoflavones and flavonoids such as biochanin A-G-M,
formononetin-G-M and quercetin-G-M (Klejdus et al., 2001; Saviranta et al.,
2010) that are responsible for reducing and stabilizing purpose. Characterization
results were shown in Figure 2.5. FTIR analysis revealed some important
vibrational bands such as hydroxyl group, C-O, Zn-O etc. that correspond to the
ZnO NPs and also the bio-compounds that present on its surface. The λmax
belongs to ZnO NPs in UV-Vis spectrum was measured at 283 nm using double
distilled water as blank.
Figure 2.5: Characterization of ZnO NPs produced using Trifolium pratense
flower extract- (A) SEM image and EDX spectrum and (B) FTIR spectrum
(Dobrucka et al., 2015)

17
A very common antioxidant, green tea, Camellia sinesis leaves extract was also
used to synthesize ZnO NPs and studied its antimicrobial activity on certain
selected microbes (Shah et al., 2015; Senthilkumar et al., 2014). Characterization
results were shown in Figure 2.7. The reported average crystalline size and
particle size of synthesized ZnO NPs were 16 nm and 853 nm respectively, signal
generated from XRD analysis and PSA with a number of aggregates observed in
SEM images. Besides, the presence of the λmax in spectrum of UV region at 325
nm to 330 nm corresponds to the absorption from ZnO NPs. FTIR spectrum
showed some significant bands such as hydroxyl group, amine, carbonyl, and
aromatic stretching produced by the polyphenols, amino acids, proteins and other
bio-components. According to the authors, these Camellia sinesis leaves extract
induced synthesis of ZnO NPs possesses a very good antimicrobial activity
towards the bacteria (Gram positive and Gram negative) and fungal strains as
compared with a positive control.
Figure 2.6: Green tea leaves (A) Before and (B) After drying
(Senthilkumar et al., 2014)

18
Figure 2.7: Characterization of ZnO NPs produced using Camellia sinesis leaves
extract- (A) Particle size analysis data, (B) SEM image and (C) UV-Vis spectrum
(Shah et al., 2015)
Spherical ZnO NPs in particle size range of 12-53 nm was produced using extract
of a member from Rutaceae family mostly found in India, Limonia acidissima L.
leaves with zinc nitrate solution precursor (Bheemanagouda et al., 2016).
Phytochemical analysis of Limonia acidissima L. leaves extract shows high
amount of flavonoids and tannins, compounds that give high antioxidant
properties (Pandavadra et al., 2014). According to the authors, the synthesized
ZnO NPs was characterized using FTIR and UV-Vis spectrophotometry whereas
size and morphology was analyzed using TEM, AFM and XRD. Characterization
results were shown in Figure 2.9. Functional group vibrational bands shown in
FTIR spectrum confirmed the presence of phenolic compounds and proteins

19
(macromolecules) that covered on the nanoparticles together with characteristic
Zn-O band. The maximum absorption of the synthesized ZnO NPs was found at
378 nm in UV region of spectrum.
Figure 2.8: Limonia acidissima L. leaves (Pandavadra et al., 2014)
Figure 2.9: Characterization of ZnO NPs produced using Limonia acidissima L.
leaves extract- (A) UV-Vis spectrum, (B) TEM image, (C) 2-D AFM topography
and (D) 3-D AFM topography (Bheemanagouda et al., 2016)

20
2.1.2 Synthesis Using Agricultural Waste or Fruit Extracts
Synthesis of ZnO NPs using another member from Rutaceae family, Poncirus
trifoliate fruits extract, trifoliate orange was done by Nagajyothi et al., (2013) and
their catalytic activity in Claisen Schmidt condensation reaction between
acetophenone and 3,4-dimethylbenzaldehyde was evaluated. According to Nogata
et al., (2006), Poncirus trifoliate fruits extract was found to be contains large
amount of flavonoids, including flavanone, flavone and polymethoxylated flavone
that participating in the reduction of zinc ion during the synthesis of ZnO NPs due
to their excellent antioxidant ability. Characterization results were shown in
Figure 2.11. The spherical particle sizes obtained were 21.12 nm in average
according to SEM and TEM images, UV-Vis spectrum, XRD and EDX analysis
confirmed the identity of the synthesized ZnO NPs and also FTIR analysis
verified the presence of bio-components coated on the surface of NPs by
observing certain functional group vibrational modes in the spectrum such as
alcohol, phenol, aromatic and 1o amine.

21
Figure 2.10: Poncirus trifoliata or trifoliate orange (Hardy, 2004)
Figure 2.11: Characterization of ZnO NPs produced using Poncirus trifoliata- (A)
TEM image, (B) SEM image and (C) EDX spectrum (Nagajyothi et al., 2013)
Artocarpus gomezianus extract assisted synthesis of ZnO NPs and their
photocatalytic ability evaluation on Methylene Blue (MB) organic dye
degradation was done by Suresh et al., (2015). Artocarpus gomezianus belongs to
Artocarpus family that normally found in Central Western Ghats which are rich in
flavonoids, stilbenoids, arylbenzofurons and Jacalin (Jagtap et al., 2010).
However, according to the phytochemical studies done by Krishnamurthy et al.,
(2013), Artocarpus gomezianus fruit extract is richest in alkaloids and poor in
steroids. Suresh et al., (2015) reported there is 17.16% polyphenol and 22% of
flavonoids in Artocarpus gomezianus fruit extract. These secondary metabolites

22
were useful in the reduction of zinc ion that leads to the formation of ZnO NPs.
The authors characterized the synthesized NPs using XRD and UV-Vis
spectrophotometry and studied their surface morphology using SEM and TEM.
Characterization results were shown in Figure 2.13. The crystalline size obtained
from this methodology is 11.53 nm in spherical shape. MB was effectively
removed by this synthesized ZnO NPs where > 90% MB can be degraded under
the natural sunlight irradiation.
Figure 2.12: Artocarpus gomezianus (Suresh et al., 2015)
Figure 2.13: Characterization of ZnO NPs produced using Artocarpus
gomezianus- (A) TEM image and (B) SEM image (Suresh et al., 2015)
23
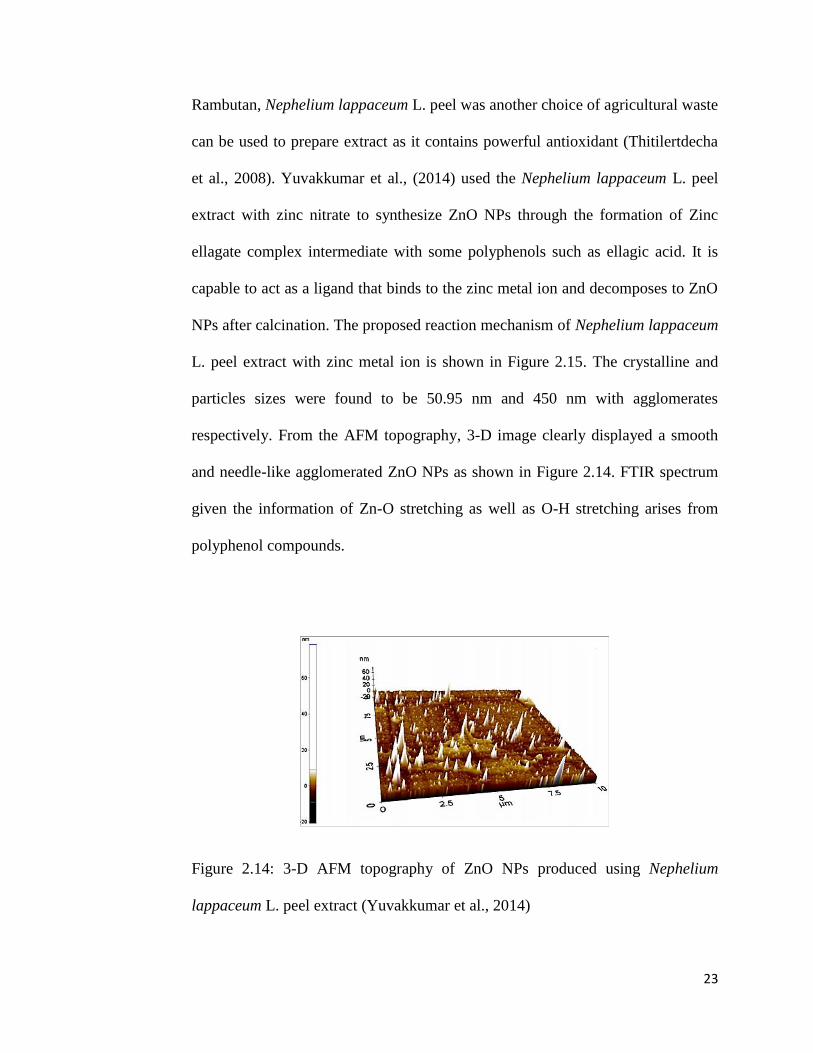
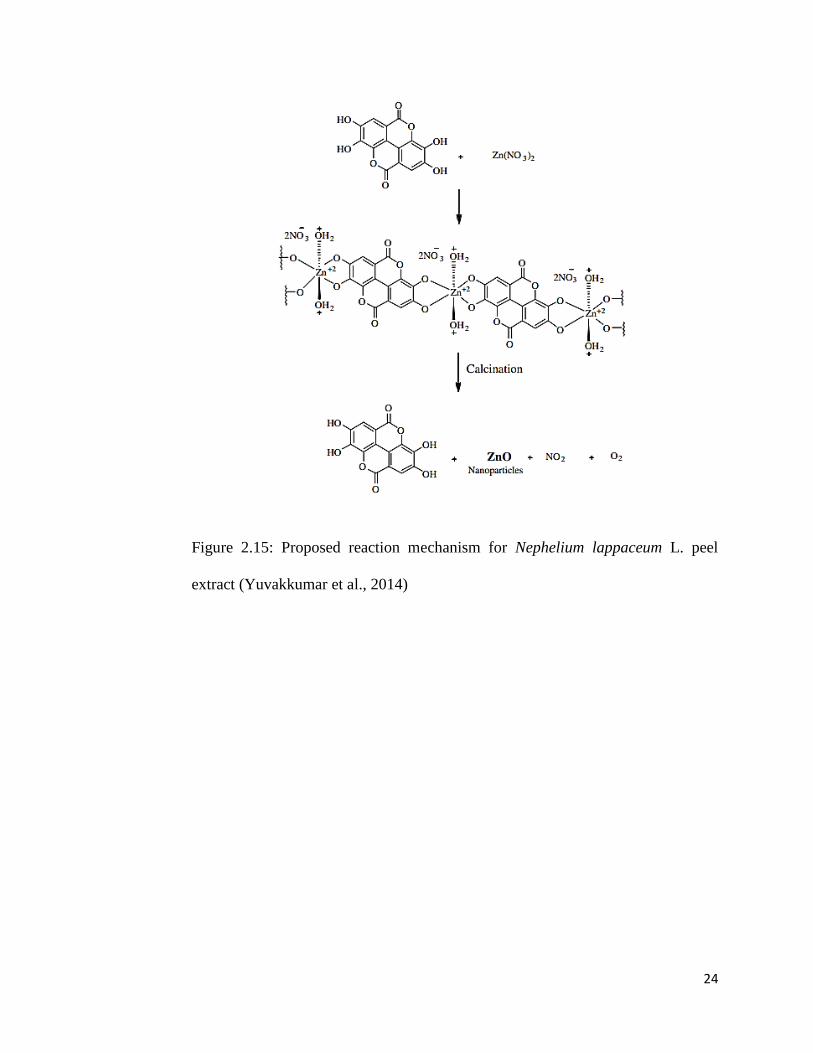
Rambutan, Nephelium lappaceum L. peel was another choice of agricultural waste
can be used to prepare extract as it contains powerful antioxidant (Thitilertdecha
et al., 2008). Yuvakkumar et al., (2014) used the Nephelium lappaceum L. peel
extract with zinc nitrate to synthesize ZnO NPs through the formation of Zinc
ellagate complex intermediate with some polyphenols such as ellagic acid. It is
capable to act as a ligand that binds to the zinc metal ion and decomposes to ZnO
NPs after calcination. The proposed reaction mechanism of Nephelium lappaceum
L. peel extract with zinc metal ion is shown in Figure 2.15. The crystalline and
particles sizes were found to be 50.95 nm and 450 nm with agglomerates
respectively. From the AFM topography, 3-D image clearly displayed a smooth
and needle-like agglomerated ZnO NPs as shown in Figure 2.14. FTIR spectrum
given the information of Zn-O stretching as well as O-H stretching arises from
polyphenol compounds.
Figure 2.14: 3-D AFM topography of ZnO NPs produced using Nephelium
lappaceum L. peel extract (Yuvakkumar et al., 2014)
24
Figure 2.15: Proposed reaction mechanism for Nephelium lappaceum L. peel
extract (Yuvakkumar et al., 2014)

25
Demir et al., 2014 reported that a member from Rosaceae family, Rosa canina
fruit, rosehip extract possesses high antioxidant activity due to the presence of
phenolic acids such as gallic acid, flavonoids such as catechin, proanthocyanidin
such as procyanidin B2, sugars and organic acids such as ascorbic acid (AA or
vitamin C). Based on these analysis data, Jafarirad et al., (2016) used the same
concept as Thitilertdecha et al., (2008) produced ZnO NPs with the stabilizing
activity from the chelation of AA to the zinc ion through its polar hydroxyl
functional group. The reaction mechanism is shown in Figure 2.17 (C). Spherical
ZnO NPs with crystalline and particle sizes synthesized from microwave
irradiation were 11.3 nm and < 50 nm respectively. EDX data shown in Figure
2.17 (B) confirmed the high purity of synthesized ZnO NPs where the weight
percent of Zn gives 65.19% and oxygen gives 34.81%. FTIR spectrum reveals
the presence of AA on the surface of ZnO NPs from the detected bond vibrations
such as C=O, C-O stretch of ester, C-H, O-H stretch as well as Zn-O stretches.
Figure 2.16: (A) Plant of Rosa canina and (B) Riped Fruit of Rosa canina,
Rosehip (Ahmad et al., 2016)
26
Figure 2.17: Characterization of ZnO NPs produced using Rosa canina fruit
extract- (A) SEM image, (B) EDX spectrum and (C) Proposed reaction
mechanism for Rosa canina fruit extract (Jafarirad et al., 2016)
Lemon juice is rich in citric acid, which acts as a chelating agent in forming a
stable complex with zinc ion precursor, with the aids of added sucrose in the
synthesis of ZnO NPs in ethylene glycol solvent (Davar et al., 2015). Sucrose in
lemon juice readily undergoes hydrolysis into glucose and fructose which in turns
oxidized to carboxylic group containing compounds such as saccharic acid that
chelate to zinc ion like citric acid. The purpose of using this method was to obtain
a more uniform particle distribution ZnO NPs. This effort was confirmed by
observing the SEM images shown in Figure 2.18 (B). EDX results in Figure 2.18
(A) showing peaks for Calcium (Ca) and Magnesium (Mg) come from lemon
juice (Lorente et al., 2014) and also the Zn and O from nanoparticles. Then, the

27
photocatalytic activity of synthesized ZnO NPs was evaluated on degradation of
methyl orange (MO), methyl red (MR), MB organic and reactive blue 21 textile
dyes. MO shows almost 100% degradation efficiency while MR and MB show
only up to 60% after 35 minutes degradation. Reactive blue 21 shows more than
75% degraded after 4 hours 30 minutes irradiation.
Figure 2.18: Characterization of ZnO NPs produced using lemon juice- (A) EDX
spectrum and (B) SEM image (Davar et al., 2015)
Figure 2.19: Proposed reaction mechanism for lemon juice (Davar et al., 2015)

28
CHAPTER 3
METHODOLOGY
3.1 Chemicals
Cavendish banana was purchased from Tesco Kampar, Perak, Malaysia. Sodium
hydroxide (NaOH) pellets was purchased from Sigma-Aldrich together with
deionized water that used in the preparation of extract. Zinc acetate dihydrate salt
precursor was purchased from MERCK. Congo Red and Malachite Green dyes
were obtained from R&M Chemicals and QRec (Quality Reagent Chemical
Product) respectively. All glasswares were properly cleaned with deionized water
and dried in an oven before use.
3.2 Preparation of Cavendish Banana Peel (BP) Extract
Cavendish BP was washed repeatedly with deionized water to remove particulate
matter and other impurities on it. Then, the peels were dried on paper toweling
and cut into pieces. About 50 g of peels were weighed and added into 250 mL
beaker containing 50 mL of deionized water and boiled in 80o
C for 10 minutes.

29
The weight of peels and volume of deionized water used can be varied as long as
it remains in the ratio of 1:1. Finally, the peel extract was cooled down and
filtered through Whatman No.1 filter paper twice on filter funnel. The resulting
filtrate was directly used in the next step of the synthesis part.
Figure 3.1 Process flowcharts for the preparation of Cavendish BP extract

30
3.3 Green Synthesis of Zinc Oxide Nanoparticles
About 0.25 g of zinc acetate dihydrate was stirred to dissolve in a 250 mL beaker
containing 50 mL of deionized water. Then, 4 mL of BP extract prepared in
Section 3.2 was added dropwise and stirred on a magnetic stirring hotplate with
magnetic stirrer for 10 minutes. After 10 minutes, 2M NaOH (8.0 g NaOH pellets
dissolved in 100 mL deionized water) was added dropwise until pH 12 and
continue stirring for 2 hours. The pH of solution was tested using universal pH
paper. The precipitate obtained was filtered using suction filtration, washed
repeatedly with deionized water and absolute ethanol and finally dried in an oven
overnight at 60o C.

31
Figure 3.2: Process flowcharts for the preparation of ZnO NPs using BP extract

32
3.4 Characterization of Synthesized Zinc Oxide Nanoparticles
The synthesized ZnO NPs was characterized using Fourier Transform Infrared
Spectroscopy (FTIR), Ultraviolet-Visible (UV-Vis) Spectroscopy, X-ray
Diffraction (XRD), Scanning Electron Microscope (SEM), Energy Dispersive X-
Ray Spectroscopy (EDX) and Particle Size Analyzer (PSA).
The identification of ZnO NPs crystalline characteristics and its crystalline size
were characterized by XRD using Shimadzu XRD 6000 Diffractometer with Cu
Kα radiation (Voltage = 40 kV, Current = 30 mA, λ = 1.5406 , scan rate of 2.0
omin
-1 and scan range of 2θ from 10 – 80
o). From the XRD data obtained, the
crystalline size of synthesized ZnO NPs was obtained from the Debye-Scherrer’s
Equation as shown below:-
D = kλ
cosθ (3.1)
where,
k = Sherrer constant (usually 0.9)
λ = Wavelength of X-Ray source, Cu Kα radiation (1.5406 )
= Full width at half-maximum (FWHM) of the diffraction peak in radian
θ = Bragg’s diffraction angle
33
obtained from the XRD data was converted to radian unit using the equation
shown below:-
= FW in 2θ x
180o (3.2)
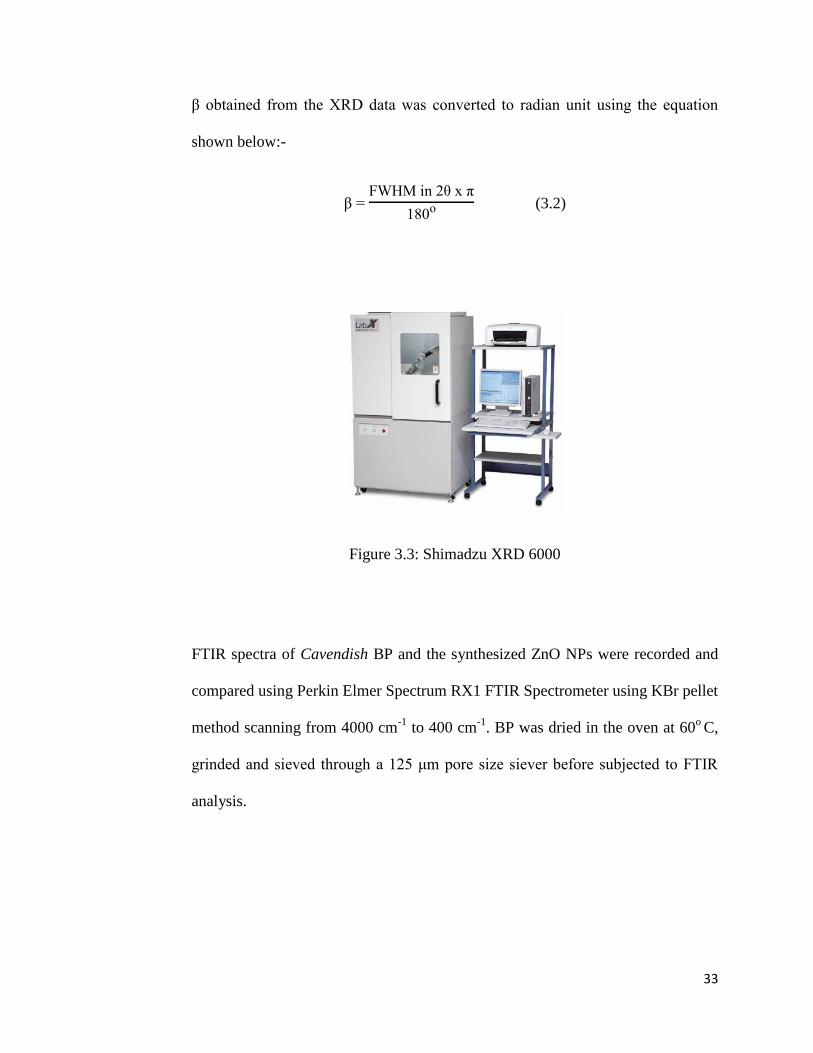
Figure 3.3: Shimadzu XRD 6000
FTIR spectra of Cavendish BP and the synthesized ZnO NPs were recorded and
compared using Perkin Elmer Spectrum RX1 FTIR Spectrometer using KBr pellet
method scanning from 4000 cm-1
to 400 cm-1
. BP was dried in the oven at 60o
C,
grinded and sieved through a 125 μm pore size siever before subjected to FT R
analysis.

34
Figure 3.4: Perkin Elmer RX 1 FTIR Spectrometer
Optical properties of ZnO NPs were evaluated in the UV-Vis spectrum using
Perkin Elmer Lambda 35 UV-Visible Spectrophotometer scanning from 800 nm
to 200 nm using deionized water as blank. Sample solution was prepared by
dispersing 1 mg of synthesized ZnO NPs in 10 mL of deionized water on a
magnetic stirring hotplate with magnetic stirrer.
Figure 3.5: Perkin Elmer Lambda 35 UV-Visible Spectrophotometer

35
The surface morphology, particle size and elemental analysis of synthesized ZnO
NPs were studied using Scanning Electron Microscope (JEOL JSM-6701F) with
Oxford Instruments X-Max Energy Dispersive X-ray Diffractometer.
Figure 3.6: JEOL JSM-6701F SEM-EDX
The average particles size of the synthesized ZnO NPs was also determined using
Malvern Particle Size Mastersizer 2000.
Figure 3.7: Malvern Particle Size Mastersizer 2000

36
3.5 Photocatalytic Activity of Synthesized Zinc Oxide Nanoparticles
3.5.1 Preparation of Dye Aqueous Solutions
10 ppm of CR and MG dye aqueous solutions were prepared by dissolving 5 mg
of CR and MG powder in a 500 mL volumetric flask containing deionized water.
The resulting mixture was magnetically stirred on a magnetic stirring hotplate for
20 minutes to ensure homogeneous dye solutions.
3.5.2 Photocatalytic Dye Degradation
50 mg of photocatalyst, synthesized ZnO NPs was added into a 100 mL beaker
containing 50 mL pre-prepared 10 ppm dye aqueous solutions. A total of eight
beakers were prepared with the same weight of photocatalyst and volume of dye
aqueous solutions. Prior to natural sunlight irradiation, each beaker was
magnetically stirred for 30 minutes in dark on magnetic stirring hotplate to
achieve the adsorption and desorption equilibrium between photocatalyst with dye
molecules. A control was also prepared without the addition of photocatalyst.
Then, these beakers were subjected to UV irradiation under natural sunlight
within time with strongest light intensity at 12 pm to 3 pm. The light intensity was
maintained in the range of 10-12 mW/cm2 through measurement using UVA/B

37
Light Meter 850009. At certain time interval, dye solution with photocatalyst in
the beaker was centrifuged using Centrifuge 5430 at 7830 rpm for 5 minutes. The
supernatant layers were carefully taken and used to evaluate the photocatalytic
activity of ZnO NPs by measuring the absorbance in different wavelength
(spectrum) of the supernatant layers collected in different time using Thermo
Fischer Scientific Genesys 10S series UV-Visible Spectrophotometer. The
number of beakers together with their times to be collected for CR and MG dye
solutions were shown in the table below:-
Table 3.1: Time intervals for beakers to be collected during degradation process
No. of Beakers
Time (minutes)
CR Dye Aqueous Solution MG Dye Aqueous Solution
1 Control Control
2 5 10
3 10 20
4 20 30
5 30 60
6 40 90
7 50 150
8 60 210

38
Figure 3.8: Process flowchart of photocatalytic dye degradation under solar
irradiation
39
3.5.3 Determination of Percentage of Degradation
By using the absorbance obtained from the λmax in visible region of the dye
solutions, CR and MG dye solutions are 498 nm and 615 nm respectively, the
percentage of dye degradation was estimated using the formula below:-
Percentage of Dye Degradation = Ao- Ai
Ao x 100% (3.3)
where,
Ao= Initial absorbance of dye solutions
Ai = Absorbance of dye solutions at a given contact time
3.5.4 Identification of Degradation Products
The intermediate degradation products formed in the photodegradation process of
MG dye aqueous solutions were evaluated using Agilent 6520 Accurate-Mass
Hybrid Quadrupole TOF (Q-TOF) Liquid Chromatography-Mass Spectrometry
(LC-MS). From the evaluated intermediate products, a tentative degradation
pathway of MG was proposed.

40
CHAPTER 4
RESULTS AND DISCUSSION
4.1 Green Synthesis of Zinc Oxide Nanoparticles
Greyish-white ZnO NPs shown in Figure 4.1 was synthesized using co-
precipitation method with the aid of Cavendish BP extract. This approach was
considered green as it involved the uses of agricultural waste to replace toxic
chemical such as surfactants or polymers (to control the growth of particles),
universal green solvent, water (H2O) instead of volatile organic solvent (VOC)
and low energy consumption (reaction proceeded in room temperature) that
fulfilled the principles of green chemistry.
Figure 4.1: Photograph of ZnO NPs synthesized using Cavendish BP extract

41
The synthesis of ZnO NPs involved a redox process. BP extract was first added
into salt of zinc acetate dihydrate aqueous solution that reduced Zn(II) to Zn(0)
and maintains the size of particles formed in nano scale by capping them from
come into contact with each other. A cloudy solution was formed indicates the
occurrence of reduction reaction. Sodium hydroxide (NaOH) was added as an
accelerant to enhance the rate of reduction and nucleation process by direct
precipitation of Zn2+
to Zn(OH)2 in alkaline condition, pH 12 followed by loss of
water to form ZnO NPs (Balavandy et al., 2015; Nishimura et al., 2011). The
related chemical reactions are shown in the equation below:-
n( CC 3)2 n2 2C 3C - (4.1)
n2 2 - n( )2 (4.2)
n( )2
→ n 2 (4.3)
Synthesized ZnO NPs using Cavendish BP extract contains impurities on the
particle surface. Higher purity was obtained through washing with water followed
by ethanol several times during vacuum suction filtration to remove the water
soluble and also water insoluble impurities present on the surface of synthesized
nanoparticles.
42
4.2 Characterization of Synthesized Zinc Oxide Nanoparticles
The synthesized greyish-white ZnO NPs was characterized accordingly using
total of six techniques which are XRD, EDX, FTIR, UV-Vis Spectroscopy, SEM
and PSA.
4.2.1 X-ray Diffraction (XRD)
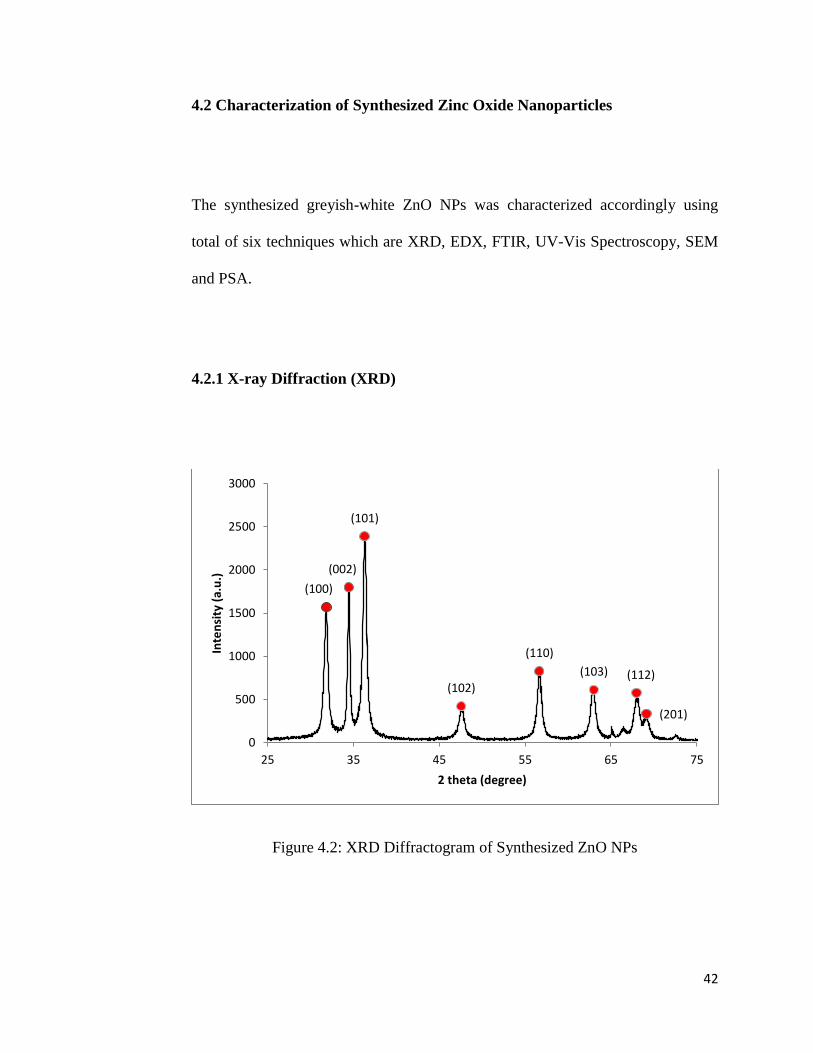
Figure 4.2: XRD Diffractogram of Synthesized ZnO NPs
(101)
(100)
(002)
(102)
(110)
(103) (112)
(201)
0
500
1000
1500
2000
2500
3000
25 35 45 55 65 75
Inte
nsi
ty (
a.u
.)
2 theta (degree)
43
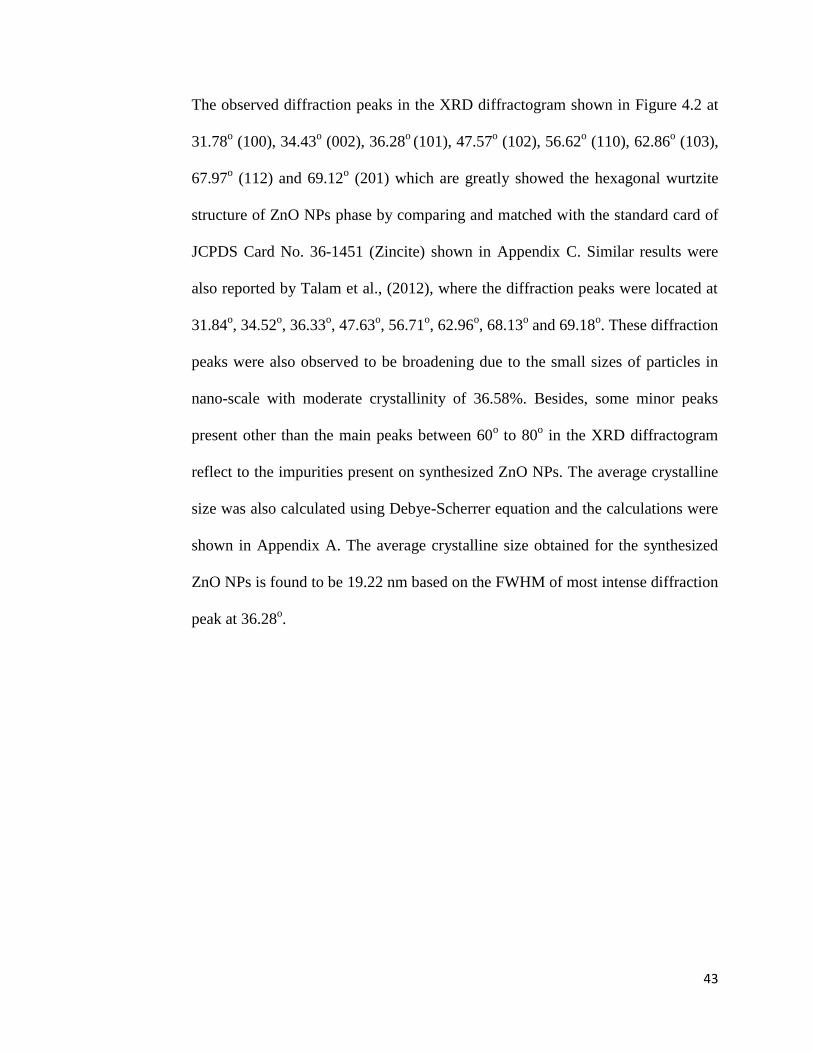
The observed diffraction peaks in the XRD diffractogram shown in Figure 4.2 at
31.78o (100), 34.43
o (002), 36.28
o (101), 47.57
o (102), 56.62
o (110), 62.86
o (103),
67.97o (112) and 69.12
o (201) which are greatly showed the hexagonal wurtzite
structure of ZnO NPs phase by comparing and matched with the standard card of
JCPDS Card No. 36-1451 (Zincite) shown in Appendix C. Similar results were
also reported by Talam et al., (2012), where the diffraction peaks were located at
31.84o, 34.52
o, 36.33
o, 47.63
o, 56.71
o, 62.96
o, 68.13
o and 69.18
o. These diffraction
peaks were also observed to be broadening due to the small sizes of particles in
nano-scale with moderate crystallinity of 36.58%. Besides, some minor peaks
present other than the main peaks between 60o to 80
o in the XRD diffractogram
reflect to the impurities present on synthesized ZnO NPs. The average crystalline
size was also calculated using Debye-Scherrer equation and the calculations were
shown in Appendix A. The average crystalline size obtained for the synthesized
ZnO NPs is found to be 19.22 nm based on the FWHM of most intense diffraction
peak at 36.28o.

44
4.2.2 Energy Dispersive X-ray Spectroscopy (EDX)
Figure 4.3: EDX spectrum of synthesized ZnO NPs
Table 4.1: EDX analysis processing data
Elements Weight % Atomic %
C 17.07 36.13
O 26.19 41.61
Al 0.37 0.35
Zn 56.37 21.92
Total 100.00 100.00

45
Elemental analysis was done by using EDX spectroscopy and the results are
summarized in Figure 4.6 and Table 4.1. There are total of four elements present
in the synthesized ZnO NPs which are carbon, oxygen, aluminum and zinc.
Carbon occupied unusually high weight %, 17.07 in the ZnO NPs. These carbons
are suspected to be come from those organic substituents in the BP extract that
served as capping agent remain on the nanoparticles during synthesis. Trace
amount of aluminum is also found in the ZnO NPs with weight % of 0.37 which
might be contributed by the trace aluminum impurity contained chemicals used
during synthesis.

46
C-H and
-CH2- stretch
4.2.3 Fourier Transform Infrared Spectroscopy (FTIR)
Figure 4.4: FTIR spectra of synthesized ZnO NPs with BP extract
FTIR spectra comparison between synthesized ZnO NPs using BP extract and the
BP extract alone is shown in Figure 4.4. Bands shown in between 3500 cm-1
to
3200 cm1 belongs to O-H stretches from alcohol, phenol or maybe some water
residues remain on the nanoparticles, 2990 cm-1
to 2850 cm-1
correspond to the
symmetric and asymmetric stretching vibrations of C-H in –CH3 and –CH2- of
aliphatic chain, 2750 cm-1
to 2350 cm-1
belongs to the N-H stretching vibrational
mode in –NH3+ amine, 1580 cm
-1 to 1640 cm
-1 are NH3
+ deformation of NH3
+ in
amino acids or carboxylic acid salt (COO-) anti-symmetric stretches and 1065 cm
-
1 to 1015 cm
-1 is the C-O vibrational stretching from an alcohol (C-OH). These
4000.0 3600 3200 2800 2400 2000 1800 1600 1400 1200 1000 800 600 400.0
cm-1
%T
3436
2360
1630
1032
511
2920
2851
3437
2364
1638
1048
2920
2851
Synthesized ZnO NPs
BP Extract O-H stretches
N-H stretch in
NH3+ amine
NH3+ deformation
and COO- anti-
symmetric stretch
C-O stretches
Zn-O stretches

47
vibrational bands are mostly found in the structures of dopamine and L-DOPA,
abundant catecholamine in BP extract as well as others compounds such as
cellulose, pectin and hemicellulose. According to Kokila et al., (2015), the shift of
bands to lower frequency indicates the participation of these compounds in the
synthesis of ZnO NPs. For example, 3437 cm-1
shifted to 3436 cm-1
, 2364 cm-1
to
2360 cm-1
, 1638 cm-1
to 1630 cm-1
and 1048 cm-1
to 1032 cm-1
. Besides, there is a
significant band appeared at 511 cm-1
which is owned by Zn-O vibrational
stretching that further confirmed the formation of ZnO NPs.

48
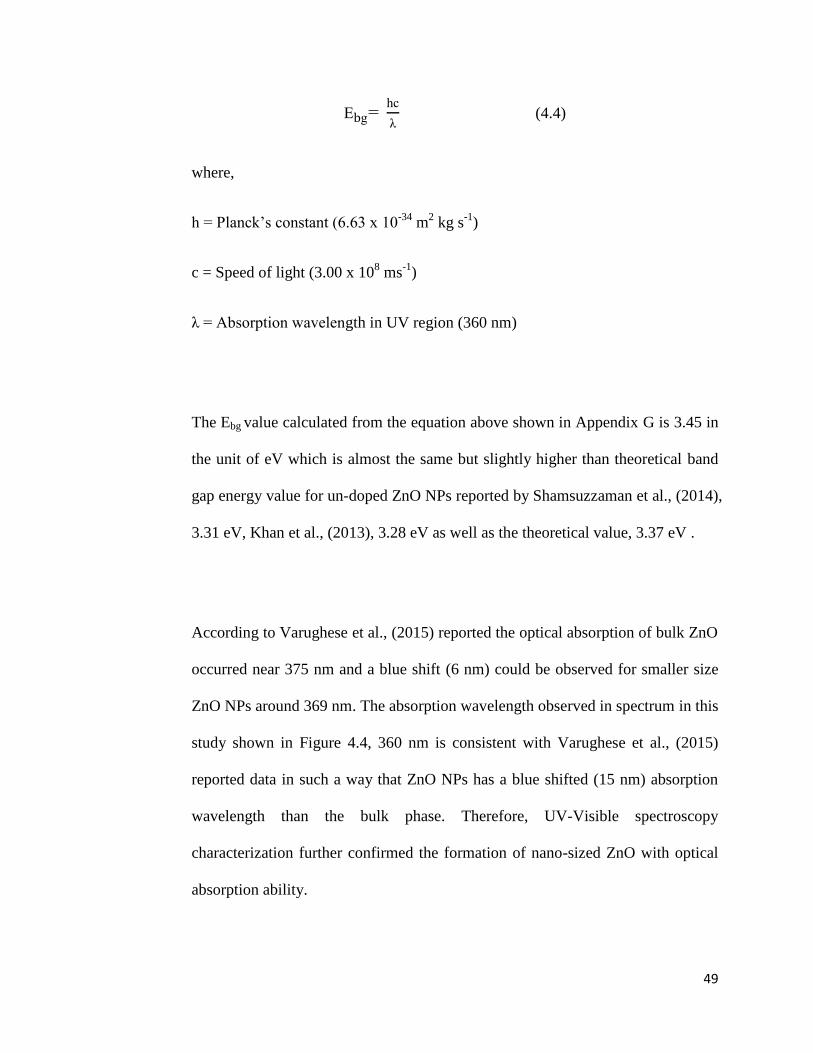
4.2.4 Ultraviolet-Visible Spectroscopy (UV-Vis Spectroscopy)
Figure 4.5: UV-Visible spectrum of synthesized ZnO NPs
An intense absorption peak observed in UV-Vis spectrum shown in Figure 4.4
under Ultraviolet (UV) region (200 nm to 400 nm) at 360 nm corresponds to the
optical absorption of the synthesized ZnO NPs. The absorption at this wavelength
can be related to the band gap energy (Ebg) between valence band (VB) and
conduction band (CB) of the synthesized semiconductor, ZnO NPs using equation
4.4 where bound electron from VB of semiconductor tends to be excited to CB by
absorbing energy from the UV light.
200.0 220 240 260 280 300 320 340 360 380 400 420 440 460 480 500 520 540 560 580 600 620 640 660 680 700.0
0.192
0.20
0.22
0.24
0.26
0.28
0.30
0.32
0.34
0.36
0.38
0.40
0.42
0.44
0.46
0.48
0.50
0.52
0.54
0.550
nm
A
360.24,0.52598
329.02,0.46311
49
E g= hc
λ (4.4)
where,
h = Planck’s constant (6.63 x 10⁻³⁴
m2 kg s
-1)
c = Speed of light (3.00 x 10⁸ ms
-1)
λ = Absorption wavelength in UV region (360 nm)
The Ebg value calculated from the equation above shown in Appendix G is 3.45 in
the unit of eV which is almost the same but slightly higher than theoretical band
gap energy value for un-doped ZnO NPs reported by Shamsuzzaman et al., (2014),
3.31 eV, Khan et al., (2013), 3.28 eV as well as the theoretical value, 3.37 eV .
According to Varughese et al., (2015) reported the optical absorption of bulk ZnO
occurred near 375 nm and a blue shift (6 nm) could be observed for smaller size
ZnO NPs around 369 nm. The absorption wavelength observed in spectrum in this
study shown in Figure 4.4, 360 nm is consistent with Varughese et al., (2015)
reported data in such a way that ZnO NPs has a blue shifted (15 nm) absorption
wavelength than the bulk phase. Therefore, UV-Visible spectroscopy
characterization further confirmed the formation of nano-sized ZnO with optical
absorption ability.

50
4.2.5 Scanning Electron Microscope (SEM)
Figure 4.6: SEM images of synthesized ZnO NPs at different magnifications
Surface morphology of synthesized ZnO NPs was studied by observing the
images captured under SEM using different magnification shown in Figure 4.5. A
huge number of ZnO NPs were aggregated forming a nano-flower like
morphology with various irregular shapes of agglomerated particles. A rough idea
on the average particle size was also obtained from the given SEM images with a
diameter of 96.2 nm.

51
4.2.6 Particle Size Analyzer (PSA)
Figure 4.7: Particle size analysis spectrum with processing data

52
A more specific type of particle size analysis on the synthesized ZnO NPs was
done by using PSA. The particle sizes of agglomerated synthesized ZnO NPs
were found to be in the range of 138 nm to 158 nm. This range of particle sizes
can be considered as consistent with the particle size hypothesized from the SEM
Images (96.2 nm) stated in Section 4.2.4. There is also another peak observed in
the particle size distribution curve beside the dominant peak (138 nm to 158 nm)
within the range of 550 nm to 631 nm that might belongs to the agglomerated
ZnO NPs.
4.3 Evaluation of Photocatalytic Activity of Synthesized Zinc Oxide
Nanoparticles
Under this section, the photocatalytic activity of the green synthesized ZnO NPs
was evaluated through the degradation of a diazo anionic dye (Congo Red) and a
cationic dye (Malachite Green) aqueous solution under natural sunlight.
Preliminary screening for the occurrence of degradation was done by observing
the color fading of dyes aqueous solutions before subjected to optical absorption
measurement using UV-Vis spectroscopic analysis. Then, the percentage of
degradation was calculated based on the absorbance values obtained to determine
the photocatalytic efficiency of the synthesized ZnO NPs.

53
4.3.1 Degradation of Congo Red Dye In Aqueous Solution Using ZnO NPs
under Solar Irradiation
Figure 4.8: UV-Vis spectrum of CR dye degradation as a function of contact time
(minutes)
Figure 4.9: Photograph of degraded CR dye aqueous solution in different time
interval
0 5 10 20 30 40 50 60 mins

54
Figure 4.10: Chemical structure of CR dye
Figure 4.11: Degradation percentage of CR as a function of time
0
10
20
30
40
50
60
70
80
90
05
1020
3040
5060
% D
egr
adat
ion
Contact Time (mins)

55
CR is an anionic dye with highly conjugated system between azo bridge,
naphthalene and benzene structure shown in Figure 4.10. It appeared to be
reddish-orange in color by absorbing energy from the wavelength of blue-green
region of visible spectrum. A 10 ppm CR dye aqueous solution was used as a
control (0 minutes) for photodegradation with an absorbance value of 0.4063 at
λmax = 498 nm. Besides, two minor absorption peaks occurred in the UV region at
232 nm and 345 nm belong to the benzene and naphthalene rings chromophores
present in the CR molecular structure.
The UV-Vis spectrum shown in Figure 4.8 above reflected the photodegradation
of a 10 ppm CR dye aqueous solution using synthesized ZnO NPs in 60 minutes
contact time. According to the photograph shown in Figure 4.9, the color of the
CR dye aqueous solutions were faded from reddish-orange to orange and turns
into pale orange. It is also clearly stated that the absorption peaks at 498 nm were
gradually decreasing from the absorbance of 0.4063 at 0 minute to 0.0680 at 60
minutes. The λmax at 498 nm was disappeared starting from 50 minutes onwards
due to the destruction of chromophoric azo (-N=N-) groups from CR molecules
accompanied by the decreases in absorbance for 232 nm and 345 nm absorption
peaks. There is no new absorption peak was formed in either one region during
the degradation process. The percentage degradation of CR dye aqueous solution
in 60 minutes contact time was shown in the Figure 4.11 (bar graph) above where
the overall percentage of degradation was found to be 83.26%.

56
4.3.2 Degradation of Malachite Green Dye In Aqueous Solution Using ZnO
NPs under Solar Irradiation
Figure 4.12: UV-Vis spectrum of MG dye degradation as a function of contact
time (minutes)
Figure 4.13: Photograph of degraded MG dye aqueous solution in different time
intervals
0 10 20 30 60 90 150 210 mins

57
Figure 4.14: Chemical structure of MG dye
Figure 4.15: Degradation percentage of MG as a function of time
0
10
20
30
40
50
60
70
80
90
100
010
2030
6090
150210
% D
egr
adat
ion
Contact Time (mins)
58
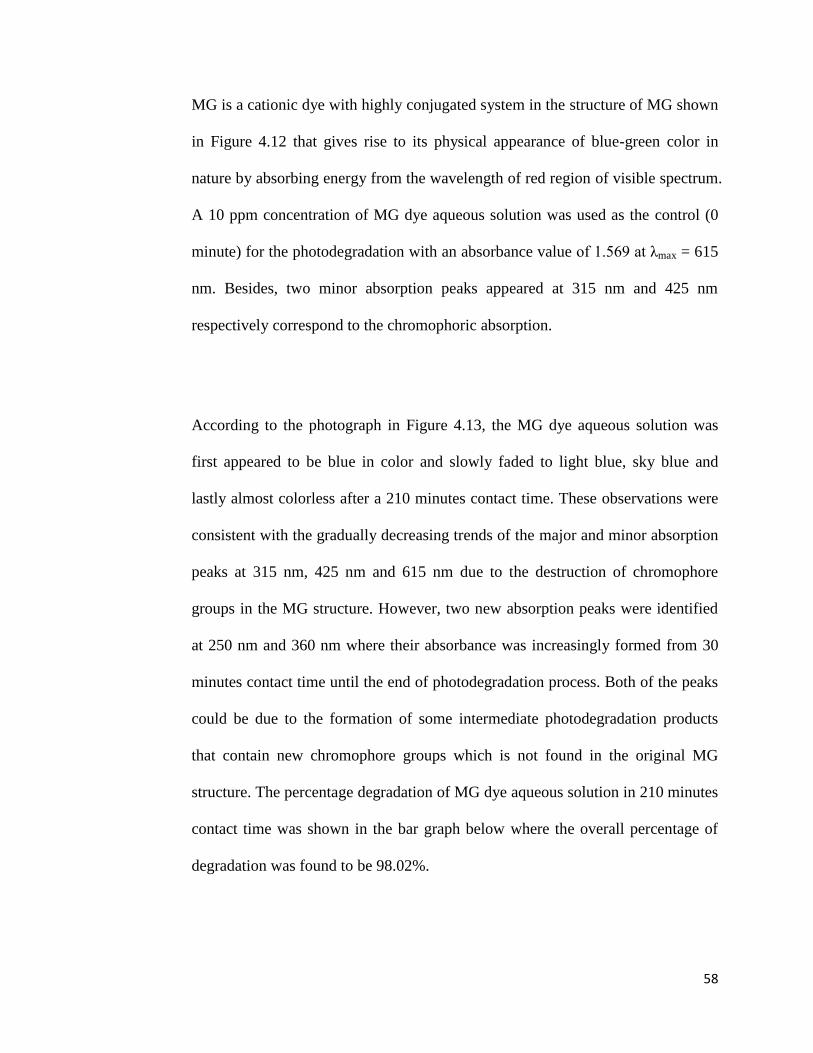
MG is a cationic dye with highly conjugated system in the structure of MG shown
in Figure 4.12 that gives rise to its physical appearance of blue-green color in
nature by absorbing energy from the wavelength of red region of visible spectrum.
A 10 ppm concentration of MG dye aqueous solution was used as the control (0
minute) for the photodegradation with an absorbance value of 1.569 at λmax = 615
nm. Besides, two minor absorption peaks appeared at 315 nm and 425 nm
respectively correspond to the chromophoric absorption.
According to the photograph in Figure 4.13, the MG dye aqueous solution was
first appeared to be blue in color and slowly faded to light blue, sky blue and
lastly almost colorless after a 210 minutes contact time. These observations were
consistent with the gradually decreasing trends of the major and minor absorption
peaks at 315 nm, 425 nm and 615 nm due to the destruction of chromophore
groups in the MG structure. However, two new absorption peaks were identified
at 250 nm and 360 nm where their absorbance was increasingly formed from 30
minutes contact time until the end of photodegradation process. Both of the peaks
could be due to the formation of some intermediate photodegradation products
that contain new chromophore groups which is not found in the original MG
structure. The percentage degradation of MG dye aqueous solution in 210 minutes
contact time was shown in the bar graph below where the overall percentage of
degradation was found to be 98.02%.
59
4.3.3 Adsorption-Desorption and Photodegradation of Dye Aqueous Solution
Photocatalytic degradation involved two processes which are adsorption-
desorption and photodegradation. In the first 30 minutes, the percentage
degradation of CR and MG dye aqueous solutions were increased drastically to
73.47% and 85.02% respectively and gradually increased after 30 minutes. This is
mainly due to the adsorption process of the dye molecules onto the surface of
ZnO NPs. Similar phenomenon was reported by Ljubas et al., (2015) that the CR
dye solution gives 60% reduction of absorbance for the first 5 minutes under
ultrasonication stirring due to the adsorption of CR dye molecules onto the
surface of TiO2 nanoparticles.
There are two types of adsorption which are physisorption and chemisorption.
Physisorption involved the formation of weak Vander Waals Forces between the
photocatalyst and dye molecules whereas chemisorption can be occur through
hydrogen bonding or electrostatic attraction. According to Elaziouti et al., (2011),
the isoelectric point of ZnO NPs is pHzpc = 9.0 and the surface charge of ZnO NPs
is strongly depends on the pH of the solution according to the equations shown
below:-

60
pH < 9.0, n- n 2 (4.5)
pH > 9.0, n- - n
- 2 (4.6)
In this study, neutral (p ≈ 7) pH dye aqueous solutions were used in order to
compromise the concentration of OH- and dye molecules on the surface of ZnO
NPs. The surface charge of ZnO NPs tends to be positively charge (pH 7 < pHzpc)
that can be interact with anionic dye molecules as well as OH- via electrostatic
attraction that favor the photodegradation process. Besides, anionic and cationic
dye molecules can also bind to the surface of ZnO NPs via hydrogen bonding
through the sulphonate or amine groups for CR dye molecules and amine groups
for MG dye molecules (Bagheri et al., 2014).
As the contact time goes on, adsorption sites on the surface of ZnO NPs were
increasingly loaded. Adsorption rate will be much slower as it has reached the
saturation point where most of the adsorption sites have been filled up. Once the
dye molecule reached the surface of photocatalyst, degradation was initiated by
the powerful oxidant ( ) produced on the surface of ZnO NPs and leaves the
degradation end-product, CO2 followed by adsorption of another dye molecule.
These adsorption and degradation processes are time consuming and therefore,
the absorbance at 498 nm and 615 nm declined in a slower rate (% degradation
from 73.47% to 83.26% for CR and 85.02% to 98.02% for MG dye aqueous
solutions) after 30 minutes contact time.

61
4.3.4 Identification of Degradation Products for MG Dye Aqueous Solution
by Liquid Chromatography-Mass Spectrometry (LC-MS)
Photocatalytic degradation of MG dye aqueous solution using ZnO NPs involved
the oxidation of dye molecules by a very powerful oxidizing agent, hydroxyl
radicals ( ) via free radical mechanism. Therefore, a series of intermediate
degradation products were formed and analyzed using LC/MS. There are total of
7 compounds have been identified as intermediate products as well as the original
MG molecules according to their mass-to-charge (m/z) ratio in the MS spectrum
shown in Figure 4.16 below.
138.10
A

62
226.13
301.30
315.19
B
C
D

63
Figure 4.16: Mass spectra of (A) 4-hydroxybenzoic acid, (B) 4-(dimethylamino)-
benzophenone, (C) didesmethyl MG, (D) desmethyl MG, (E) MG, (F) Leuco MG
and (G) MG leucocarbinol
329.21
330.21
347.21
E
F
G
64
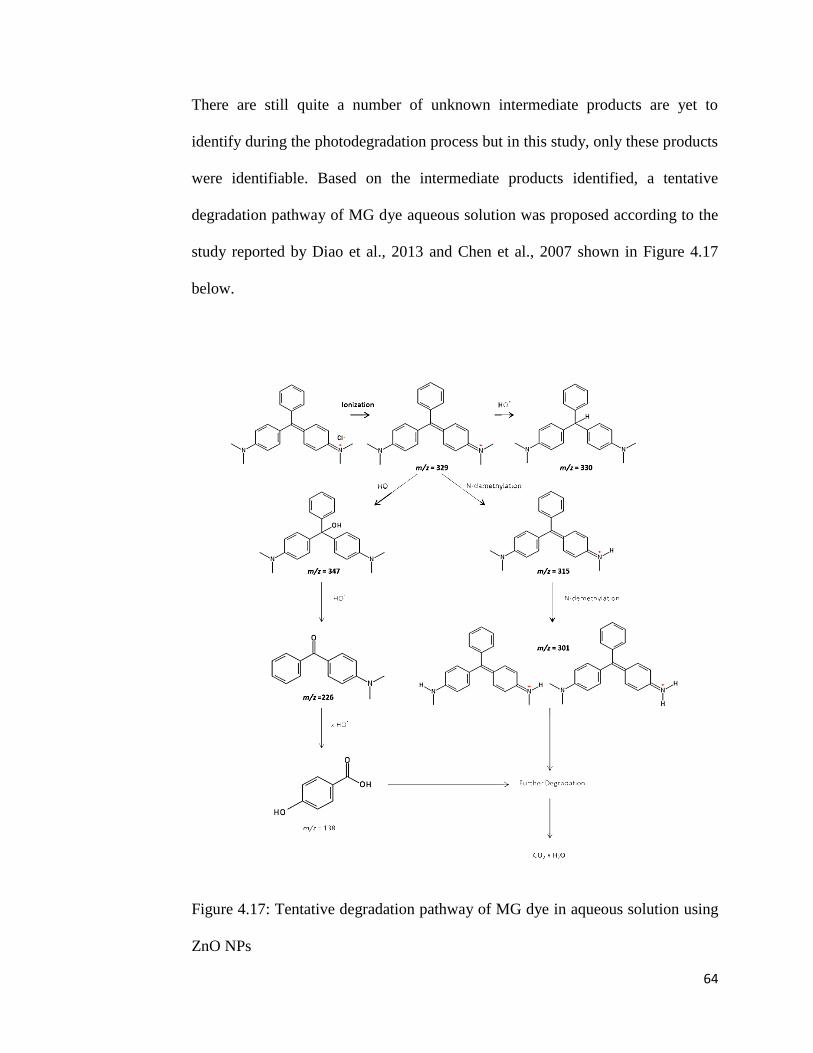
There are still quite a number of unknown intermediate products are yet to
identify during the photodegradation process but in this study, only these products
were identifiable. Based on the intermediate products identified, a tentative
degradation pathway of MG dye aqueous solution was proposed according to the
study reported by Diao et al., 2013 and Chen et al., 2007 shown in Figure 4.17
below.
Figure 4.17: Tentative degradation pathway of MG dye in aqueous solution using
ZnO NPs

65
Degradation was initiated by ionization of MG forming a positively charged on
the nitrogen atom. Two possible degradation pathways occurred on MG dye
molecules either through N-demethylation forming desmethyl MG (m/z = 315) or
undergoing hydroxylation that attack by hydroxyl radical forming MG
leucocarbinol (m/z = 347).
- N-demethylation pathway: desmethyl MG tends to undergo N-
demethylation once again forming didesmethyl MG (m/z = 301) followed
by a series of degradation processes end up with the mineralized products,
CO2 and H2O.
- Hydroxylation pathway: MG leucocarbinol formed was oxidized by
forming 4-(dimethylamino)-benzophenone (m/z = 226) followed by a
series of oxidation, demethylation and deamination produced 4-
hydroxybenzoic acid (m/z = 138) then mineralized to CO2 and H2O.
66
CHAPTER 5
CONCLUSION
In this study, ZnO NPs has been successfully synthesized through a green
synthetic pathway with the aid of Cavendish BP extract as reducing agent as well
as stabilizing agent. The synthesized ZnO NPs was characterized using XRD,
EDX, FTIR, UV-Vis spectroscopy, SEM and PSA. The particle size of
synthesized ZnO NPs in the range between 138 nm to 158 nm observed from the
particle size distribution curve and crystalline size 19.22 nm calculated from
Debye-Scherrer’s Equation according to the highest diffraction peaks in the XRD
diffractogram. SEM images revealed the morphology of synthesized ZnO NPs as
nano-flowers with various irregular shapes of agglomerated particles.
According to the analysis on photodegradation of CR anionic and MG cationic
dye aqueous solutions, the synthesized ZnO NPs shows an excellent
photocatalytic activity towards CR and MG dyes as dye solutions have been
successfully degraded up to 83.26% in 60 minutes contact time and 98.02% in
210 minutes contact time respectively. Several intermediates degradation products
for MG dye have been identified through the LC-MS analysis and based on these
identified intermediates, a tentative degradation pathway has been proposed.

67
However, there are still quite a number of intermediates are un-identifiable. In
order to view on the overall degradation pathway of MG dye molecules, further
work is required. Couple the data from LC-MS as well as GC-MS could be one of
the possible ways to further identify and confirm the presence of some
intermediates formed in the photodegradation process. Furthermore, the
determination of intermediate degradation products is not done on the
photodegradation of CR dye in this study due to time constraint, therefore LC-MS
and GC-MS can also be applied to identify, analyze and proposed a possible
degradation pathway for CR dye aqueous solution.

68
REFERENCES
Journal:
Ahmed, S., Ahmad, M., Swami, B. L. and Ikram, S. (2016). A review on plants
extract mediated synthesis of silver nanoparticles for antimicrobial
applications: a green expertise. Journal of Advance Research., 7, pp.17-28.
Ahmed, W. S., Mohamed, M. A., El-Dib, R. A. and Hamed, M. M. (2009). New
triterpene saponins from Duranta repens Linn. and their cytotoxic
activity. Molecules, 4, pp.1952-1965.
Aqil, F., Ahmad, I. and Mehmood, Z. (2006). Antioxidant and free radical
scavenging properties of twelve traditionally used Indian medicinal
plants. Turk J Biol, 30, pp.177-183.
Bagheri, M., Mahjoub, A. R. and Mehri, B. (2014). Enhanced photocatalytic
degradation of congo red by solvothermally synthesized CulnSe2-ZnO
nanocomposites. RSC Advances, 4, pp.21757-21764.
Balavandy, S. K., Shameli, K. and Abidin, Z. Z. (2015). Rapid and green
synthesis of silver nanoparticles via sodium alginate media. International
Journal of Electrochemical Science, 10, pp.486-497.
Bheemanagouda, N., Patil, N. and Taranath, T. C. (2016). Limonia acidissima L.
leaf mediated synthesis of zinc oxide nanoparticles: a potent tool against
Mycobacterium tuberculosis. International Journal of Mycobacteriology, 5,
pp.197-204.
69
Chen, C. C., Lu, C. S., Chung, Y. C. and Jan, J. L. (2007). UV light induced
photodegradation of malachite green on TiO2 nanoparticles. Journal of
Hazardous Materials, 141, pp.520-528.
Curri, M. L., Comparelli, R., Cozzoli, P. D., Mascolo, G. and Agostiano, A.
(2003). Colloidal oxide nanoparticles for the photocatalytic degradation of
organic dye. Materials Science and Engineering, 23, pp.285-289.
Davar, F., Majedi, A. and Mirzaei, A. (2015). Green synthesis of ZnO
nanoparticles and its application in the degradation of some dyes. Journal of
the American Ceramic Society, 98(6), pp.1739-1746.
Demir, N., Yildiz, O., Alpaslan, M. and Hayaloglu, A. A. (2014). Evaluation of
volatiles, phenolic compounds and antioxidant activities of rose hip (Rosa L.)
fruits in Turkey. LWT- Food Science and Technology, 57, pp.126-133.
Devendran, G. and Balasubramanian, U. (2011). Qualitative phytochemical
screening and GC-MS analysis of Ocimum sanctum L. leaves. Asian Journal
of Plant Science and Research, 1(4), pp.44-48.
Diao, Z. H., Li, M. Y., Zeng, F. Y., Song, L. and Qiu, R. L. (2013). Degradation
pathway of malachite green in a novel dual-tank photoelectrochemical
catalytic reactor. Journal of Hazardous Materials, 260, pp.585-592.
Dobrucka, R. and Dugaszewska, J. (2016). Biosynthesis and antibacterial activity
of ZnO nanoparticles using Trifolium pratense flower extract. Saudi Journal
of Biological Sciences, 23, pp.517-523.
Elaziouti, Laouedj, N. and Ahmed, B. (2011). ZnO-assisted photocatalytic
degradation of congo red and benzopurpurine 4B in aqueous solution.
Journal of Chemical Engineering & Process Technology, 2(2), pp.1-9.
70
Giwa, A., Nkeonye, P. O., Bello, K. A. and Kolawole, K. A. (2012).
Photocatalytic decolourization and degradation of C.I. basic blue 41 using
TiO2 nanoparticles. Journal of Environment Protection, 3, pp.1063-1069.
Gnanasangeetha, D. and Thambavani, S. D. (2014). Facile and eco-friendly
method for the synthesis of zinc oxide nanoparticles using Azadirachta and
Emblica. International Journal of Pharmaceutical Sciences And Research,
5(7), pp.2866-2873.
Gonzalez-Montelongo, R., Lobo, M. G. and Gonzalez, M. (2010). Antioxidant
activity in banana peel extracts: testing extraction conditions and related
bioactive compounds. Food Chemistry, 119, pp.1030-1039.
Jafarirad, S., Mehrabi, M., Divband, B. and Kosari-Nasab, M. (2016).
Biofabrication of zinc oxide nanoparticles using fruit extract of Rosa canina
and their potential against bacteria: a mechanistic approach. Materials
Science and Engineering C, 59, pp.296-302.
Jagtap, U. B. and Bapat V. A. (2010). Artocarpus: A review of its traditional uses,
phytochemistry and pharmacology. Journal of Ethnopharmacology, 129,
pp.142-166.
Jodko-Piorecka, K. and Litwinienko, G. (2015). Antioxidant activity of dopamine
and L-D PA in lipid micelles and their cooperation with an analogue of α-
tocopherol. Free Radical Biology and Medicine, 83, pp.1-11.
Joshi, B., Sah, G. P., Basnet, B. B., Bhatt, M. R., Sharma, D., Subedi, K., Pandey,
J. and Malla, R. (2010). Phytochemical extraction and antimicrobial
properties of different medicinal plants: Ocium sanctum (tulsi), Eugenia
caryophyllata (clove), Achyranthes bidentata (datiwan) and Azadirachta
indica (neem). Journal of Microbiology and Antimicrobials, 3(1), pp.1-7.

71
Kavitha, K. S., Baker, S., Rakshith, D., Kavitha, H.U., Yashwantha, R. H. C.,
Harini, B. P. and Satish, S. (2013). Plants as green source towards synthesis
of nanoparticles. International Research Journal of Biological Sciences, 2(6),
pp.66-76.
Khan, W., Khan, Z. A., Saad, A. A., Shervani, S., Saleem, A. and Naqvi, A. H.
(2013). Synthesis and characterization of Al doped ZnO nanoparticles.
International Journal of Modern Physics: Conference Series, 22, pp.630-636.
Khanal, D. P., Raut, B., Majhi, R. K., Kaini, A., Basnet, R. and Mahat, P. K.
(2014). Phytochemical and biological studies on fruits of Duranta repens
L.. An International Journal of Advances in Pharmaceutical Sciences, 5(2),
pp.1958-1962.
Klejdus, B., Vitamvasova-Sterbova, D. and Kuban, V. (2001). Identification of
isoflavone conjugates in red clover (Trifolium pratense) by liquid
chromatography-mass spectrometry after two-dimensional solid-phase
extraction. Analytical Chemica Acta, 450, pp.81-97.
Kokila, T., Ramesh, P. S. and Geetha, D. (2015). Biosynthesis of silver
nanoparticles from Cavendish banana peel extract and its antibacterial and
free radical scavenging assay: a novel biological approach. Applied
Nanoscience, 5, pp.911-920.
Kolodziejczak-Radzimska, A. and Jesionowski, T. (2014). Zinc oxide-from
synthesis to application: a review. Materials, 7, pp.2833-2881.
Krishnamurthy, S. R. and Sarala, P. (2013). Phytochemical studies of Artocarpus
gomezianus fruits collected from various altitudes of Central Western
Ghats. Indian Journal of Natural Products and Resources, 4(4), pp.398-411.
Kumar, R., Singh, V. P., Maurya, D and Pandey, A. K. (2015). Bionanoparticles:
a green nanochemical approach. PharmaTutor, 3(9), pp.28-35.
72
Ljubas, D., Smoljanic, G. and Juretic, H. (2015). Degradation of methyl orange
and congo red dyes by using TiO2 nanoparticles activated by the solar and
the solar-like radiation. Journal of Environment Management, 161, pp.83-91.
Lorente, J., Vegara, S., Mart, N., Ibarz, A., Coll, L., Hernandez, J., Valero, M. and
Saura, D. (2014). Chemical guide parameters for Spanish lemon (Citrus
limon (L.) Burm.) juices. Food Chemistry, 162, pp.186-191.
Martel, R., Schmidt, T., Shea, H., Hertel, T. and Avouris, P. (1998). Single- and
multi-wall carbon nanotube field-effect transistors. Applied Physics Letters,
73(17), pp.2447-2449.
Nagajyothi, P. C., An, T. N. M., Sreekanth, T. V. M., Lee, J., Lee, D. J. and Lee,
K. D. (2013). Green route biosynthesis: characterization and catalytic activity
of ZnO nanoparticles. Materials Letters, 108, pp.160-163.
Nishimura, S., Mott, D., Takagaki, A., Maenosono, S. and Ebitani, K. (2011).
Role of base in the formation of silver nanoparticles synthesized using
sodium acrylate as a dual reducing and encapsulating agent. Physical
Chemistry Chemical Physics, 13, pp.9335-9343.
Nogata, Y., Sakamoto, K., Shiratsuchi, H., Ishii, T., Yano, M. and Ohta, H.
(2006). Flavonoid composition of fruit tissues of citrus species. Bioscience,
Biotechnology, and Biochemistry, 70(1), pp.178-192.
Oudhia, A., Kulkarni, P. and Sharma, S. (2015). Green synthesis of ZnO
nanotubes For bioapplications. International Journal of Advanced
Engineering Research and Studies, pp.280-281.
Pandavadra, M. and Chanda, S. (2014). Development of quality control
parameters for the standardization of Limonia acidissima L. leaf and
stem. Asian Pacific Journal of Tropical Medicine, 7(1), pp.244-248.

73
Penner, R. M., Walter, E. C., Zach, M. P., Favier, F., Murray, B. J., Inazu, K. and
Hemminger, J. C. (2003). Metal nanowire arrays by
electrodeposition. Chemphychem, 4, pp.131-138.
Poinern, G. E. J., Tripathy, S. K., Sharma, S., Fawcett, D. and Shah, M. (2015).
Green synthesis of metallic nanoparticles via biological entities. Materials, 8,
pp.7278-7308.
Ramesh, P., Rajendran, A. and Meenakshisundaram, M. (2014). Green synthesis
of zinc oxide nanoparticles using flower extract Cassia auriculata. Journal of
NanoScience and NanoTechnology, 2(1), pp.41-45.
Raut, S., Thorat, P. V., Thakre, R. (2013). Green synthesis of zinc oxide (ZnO)
nanoparticles using Ocium tenuiflorum leaves. International Journal of
Science and Research, 4(5), pp.1225-1228.
Sabir, S., Arshad, M. and Chaudhari, S. K. (2014). Zinc oxide nanoparticles for
revolutionizing agriculture: synthesis and applications. The Scientific World
Journal, pp.1-8.
Saravanan, P., Gopalan, R. and Chandrasekaran, V. (2008). Synthesis and
characterization of nanomaterials. Defence Science Journal, 58(4), pp.504-
516.
Saviranta, N. M. M., Julkunen-Tiitto, R., Oksanen, E. and Karjalainen, R. O.
(2010). Leaf phenolic compounds in red clover (Trifolium pratense L.)
induced by exposure to moderately elevated ozone. Environmental Pollution,
158, pp.440-446.
Senthilkumar, S. R. and Sivakumar, T. (2014). Green tea (Camellia sinensis)
mediated synthesis of zinc oxide (ZnO) nanoparticles and studies on their
antimicrobial activities. International Journal of Pharmacy and
Pharmaceutical Sciences, 6(6), pp.461-465.

74
Shah, R. K., Boruah, F. and Parween, N. (2015). Synthesis and characterization of
ZnO nanoparticles using leaf extract of Camellia sinesis and evaluation of
their antimicrobial efficacy. International Journal of Current Microbiology
and Applied Sciences, 4(8), pp.444-450.
Shamsuzzaman, Ali, A., Asif, M., Mashrai, A. and Khanam, H. (2014). Green
synthesis of ZnO nanoparticles using Bacillus subtilis and their catalytic
performance in the one-pot synthesis of steroidal thiophenes. Europen
Chemical Bulletin, 3(9), pp.939-945.
Sharma, P., Khandelwal, S., Singh, T. and Vijayvergia, R. (2012). Phytochemical
analysis and antifungal potential of Duranta erecta against some
phytopatogenic fungi. International Journal Of Pharmaceutical Sciences and
Research, 3(8), pp.2686-2689.
Shekhawat, M. S., Ravindran, C. P. and Manokari, M. (2016). Biogenic
production of zinc oxide nanoparticles from aqueous extracts of Duranta
erecta L. World Scientific News, 28, pp.30-40.
Suresh, D., Shobharani, R. M., Nethravathi, P. C., Kumar, M. A. P.,
Nagabhushana, H. and Sharma, S. C. (2015). Artocarpus gomezianus aided
green synthesis of ZnO nanoparticles: luminescence, photocatalytic and
antioxidant properties. Spectrochimica Acta Part A: Molecular and
Biomolecular Spectroscopy, 141, pp.128-134.
Talam, S., Karumuri, S. R. and Gunnam, N. (2012). Synthesis, characterization,
and spectroscopic properties of ZnO nanoparticles. ISRN Nanotechnology,
2012, pp.1-6.
Thitilertdecha, N., Teerawutgulrag, A. and Rakariyatham, N. (2008). Antioxidant
and antibacterial activities of Nephelium lappaceum L. extracts. Food
Science and Technology, 41, pp.2029-2035.

75
Varghese, E. and George, M. (2015). Green synthesis of zinc oxide
nanoparticles. International Journal of Advanced Research In Science And
Engineering, 4(1), pp.307-314.
Varughese, G., Jithin, P. W. and Usha, K. T. (2015). Determination of optical
band gap energy of wurtzite ZnO: Ce nanocrystallites. Physical Science
International Journal, 5(2), pp.146-154.
Veerasamy, R., Tiah, Z. X., Gunasagaran, S., Foo, W. X., Fang, C. Y., Jeyakumar,
N. and Dhanaraj, S. A. (2010). Biosynthesis of silver nanoparticles using
mangosteen leaf extract and evaluation of their antimicrobial
activities. Journal of Saudi Chemical Society, 15, pp.113-120.
Yuvakkumar, R., Suresh, J., Nathanael, A. J., Sundrarajan, M. and Hong, S. I.
(2014). Novel green synthetic strategy to prepare ZnO nanocrystals using
rambutan (Nephelium lappaceum L.) peel extract and its antibacterial
applications. Materials Science and Engineering, 41, pp-17-27.
Edited Book:
Ahmad, N., Anwar, F. and Gilani, A. U. (2016). Rose hip (Rosa canina L.) oils. In:
Preedy, V. R., eds. Essential Oils in Food Preservation, Flavor and Safety.
Academic Press. pp. 667-675.
Yahya, N., Puspitasari, P. and Latiff, N. R. A. (2013). Hardness improvement of
dental amalgam using zinc oxide and aluminum oxide nanoparticles. In:
Ochsner, A., Silva, L. F. M. and Altenbach, H., eds. Characterization and
Development of Biosystems and Biomaterials. Berlin Heidelberg: Springer-
Verlag. pp. 20-21.

76
Internet Website:
Hardy, S. (2004). Growing lemons in Australia- a production manual. Lemons
Growing Manual. [online] Available at:
http://www.dpi.nsw.gov.au/__data/assets/pdf_file/ 0016/148120/5b-lemon-
rootstocks.pdf [Accessed 17 July 2016].

77
APPENDICES
Appendix A
Crystalline size of synthesized ZnO NPs
Calculation for
= FW in 2θ x
180o
= 0.51420 x
180o
= 8.97 x 10⁻³
Calculation for crystalline size by Debye-Scherrer Equation
D = kλ
cosθ
= (0.9) x
(8.97 x 1 cos (36.2847)
= 19.22 nm
where,
k = Sherrer' constant (usually 0.9)
λ = Wavelength of X-Ray source, Cu Kα radiation (1.5406 )
= Full width at half-maximum (FWHM) of the diffraction peak in radian
θ = Bragg’s diffraction angle
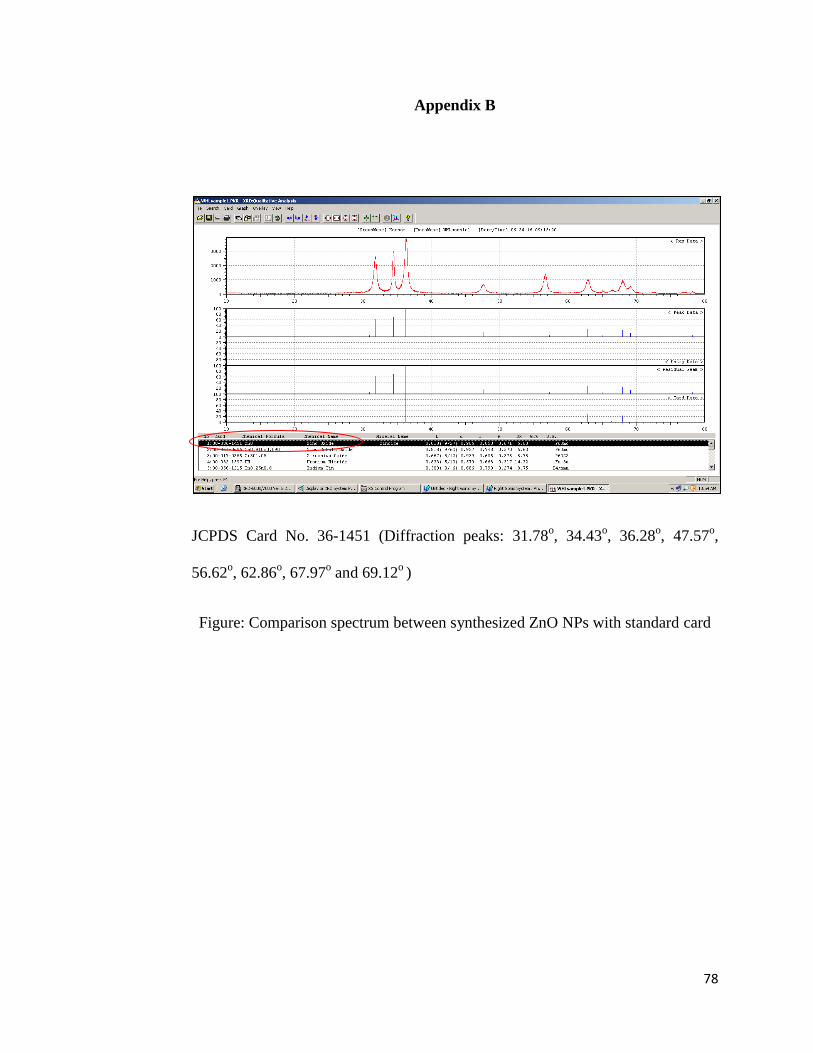
78
Appendix B
JCPDS Card No. 36-1451 (Diffraction peaks: 31.78o, 34.43
o, 36.28
o, 47.57
o,
56.62o, 62.86
o, 67.97
o and 69.12
o )
Figure: Comparison spectrum between synthesized ZnO NPs with standard card

79
Appendix C
Figure: Crystallinity of synthesized ZnO NPs
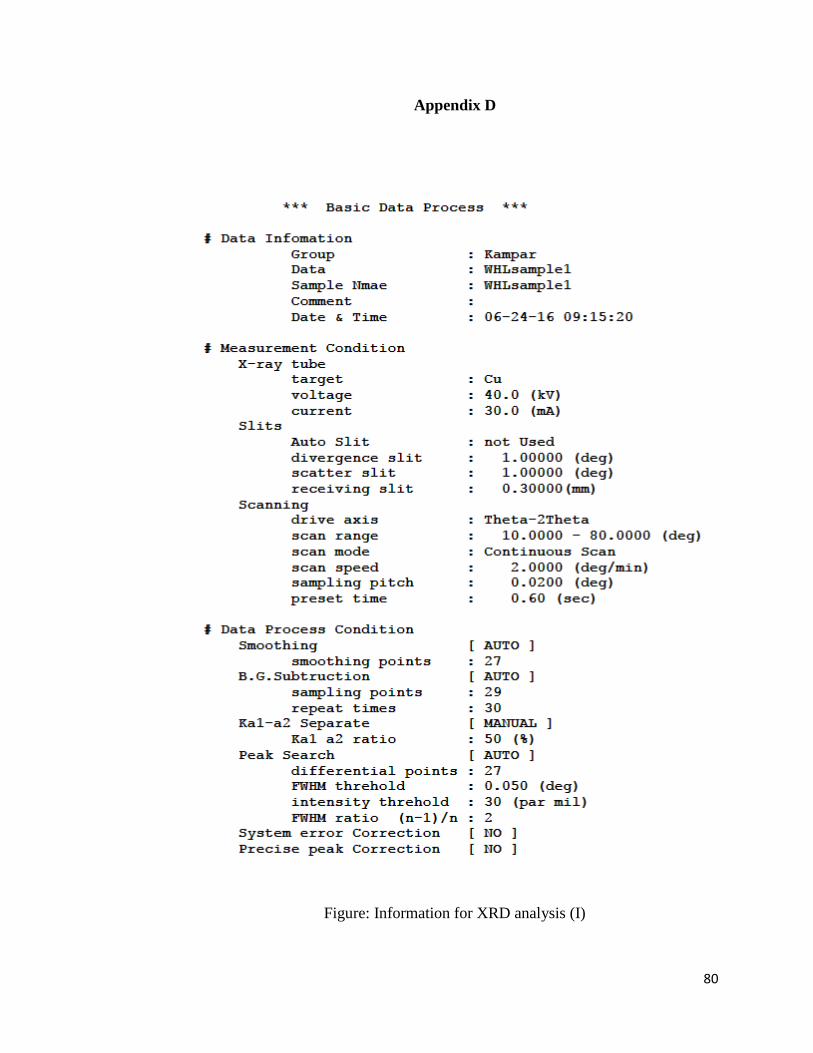
80
Appendix D
Figure: Information for XRD analysis (I)

81
Appendix E
Figure: Information for XRD analysis (II)

82
Appendix F
Figure: Information for XRD analysis (III)

83
Appendix G
Calculation for band gap energy, E g
E g= hc
λ
= (6.63 x 1 x (3.0 x 1
(360 )
= 5.525 x 10-19
x 6.242 x 1018
eV
= 3.45 eV
where,
h = Planck’s constant (6.63 x 10⁻³⁴
m2 kg s
-1)
c = Speed of light (3.00 x 10⁸ ms
-1)
λ = Absorption wavelength in UV region (360 nm)

84
Appendix H
% Dye Degradation = Ao- Ai
Ao x 100%
where,
Ao= Initial absorbance of dye solutions
Ai = Absorbance of dye solutions after photocatalytic degradation
Photodegradation CR Dye
Table: Degradation Percentage of CR dye as a function of contact time
Contact Time
(mins)
Initial
Absorbance
Final
Absorbance
Degradation
Percentage (%)
0 0.4063 0.4063 0
5 0.4063 0.2920 28.13
10 0.4063 0.1773 56.36
20 0.4063 0.1150 71.70
30 0.4063 0.1078 73.47
40 0.4063 0.0825 79.69
50 0.4063 0.0735 81.91
60 0.4063 0.0680 83.26

85
Appendix I
Photodegradation of MG Dye
Table: Degradation Percentage of MG dye as a function of contact time
Contact Time
(mins)
Initial
Absorbance
Final
Absorbance
Degradation
Percentage (%)
0 1.5690 1.5690 0
10 1.5690 0.4980 68.26
20 1.5690 0.4220 73.10
30 1.5690 0.2350 85.02
60 1.5690 0.1760 88.78
90 1.5690 0.1430 90.89
150 1.5690 0.0730 95.35
210 1.5690 0.0310 98.02