Embed Size (px)
Citation preview
Prefatory Note
The attached document represents the most complete and accurate version available based on original files from the FOMC Secretariat at the Board of Governors of the Federal Reserve System.
Please note that some material may have been redacted from this document if that material was received on a confidential basis. Redacted material is indicated by occasional gaps in the text or by gray boxes around non-text content. All redacted passages are exempt from disclosure under applicable provisions of the Freedom of Information Act.
Content last modified 01/29/2016.
Class II FOMC - Restricted (FR)
CURRENT ECONOMIC AND FINANCIAL CONDITIONS
Part 1
Summary and Outlook
Prepared for the Federal Open Market Committee by the staff of the Board of Governors of the Federal Reserve System
January 20, 2010

Class II FOMC - Restricted (FR)
January 20, 2010
Summary and Outlook
Prepared for the Federal Open Market Committee by the staff of the Board of Governors of the Federal Reserve System
__________________________
Class II FOMC—Restricted (FR)
Domestic Developments
Note: A list of abbreviations is available at the end of Part 1.
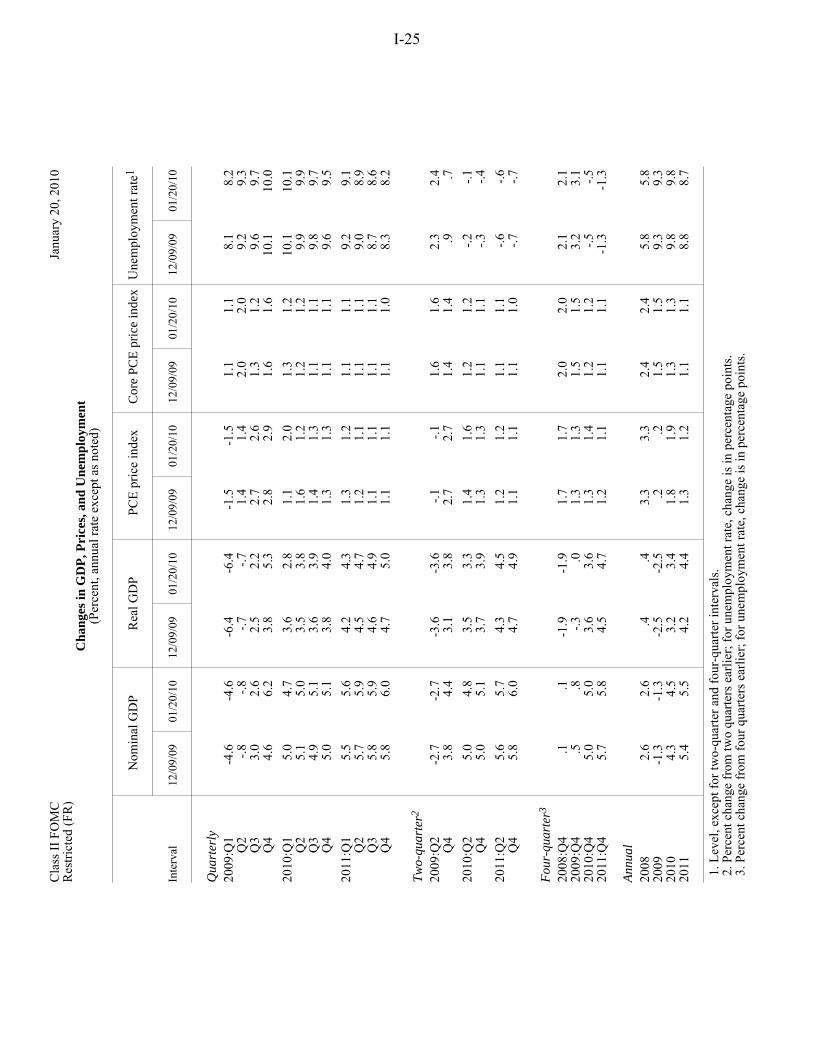
In response to the incoming data, we revised up our estimate of the increase in real GDP in the fourth quarter of 2009 to an annual rate of 5¼ percent, 1½ percentage points above our projection in the December Greenbook. However, this upward revision occurred wholly in inventory investment (including an enormous increase in wholesale stocks of farm products); final sales are estimated to have increased at an annual rate of 1½ percent, unchanged from the December Greenbook. With firms having moved earlier than we had anticipated to stem the pace of inventory liquidation, the economy seems to have entered 2010 with production in closer alignment with sales than we had anticipated last month. Accordingly, we have lowered our projection for real GDP growth in the current quarter to 2¾ percent, ¾ percentage point below our previous forecast.
Apart from the fluctuations in inventories, economic developments have largely followed the script laid out in the December Greenbook. The incoming information on the labor market and industrial production has been broadly consistent with our expectations. And although housing activity seems to be on a lower trajectory than we had anticipated, the recent news on business capital spending has been better. We continue to project a moderate recovery in economic activity over the next two years, with economic growth supported by the accommodative stance of monetary policy and by a further waning of the factors that have weighed on spending and production over the past two years; indeed, financial headwinds seem to be receding a little faster than we had anticipated, as evidenced by a larger-than-expected drop in corporate bond spreads. All told, we continue to expect real GDP to increase 3½ percent in 2010 as a smaller contribution from inventory investment is offset by a slightly stronger path of final sales; we have edged up our projection for GDP growth in 2011 to 4¾ percent, ¼ percentage point more than in the December Greenbook. These changes are not large enough to take up much additional resource slack, and the unemployment rate is still expected to be in the neighborhood of 8¼ percent at the end of next year.
With the projected margin of slack about the same as in the December Greenbook, and with no major surprises in the incoming price data or significant changes to our assumptions for oil prices and the dollar, our projection of core inflation is little changed. After rising 1.5 percent in 2009, core PCE prices are expected to increase 1.2 percent in 2010 and 1.1 percent in 2011. Given our projection for consumer energy prices, headline
I-1
1 Most of this increase occurred during the week between the December Greenbook and the December FOMC meeting. Since the FOMC meeting, the 10-year yield has risen 10 basis points.
I-2 Class II FOMC—Restricted (FR) Part 1: Summary and Outlook, January 20, 2010
inflation is projected to run somewhat above core inflation in 2010, but it slows to the same rate as core in 2011.
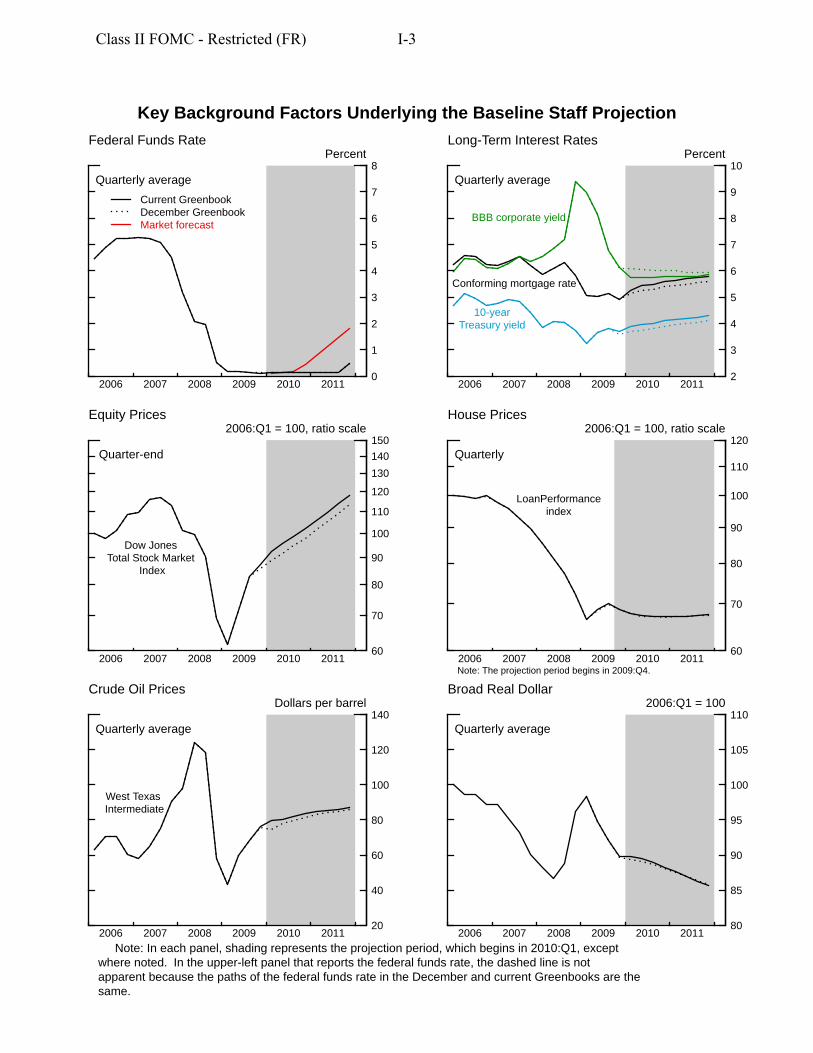
Key Background Factors We continue to assume that the FOMC will hold the target federal funds rate in the current range of 0 to ¼ percent through the third quarter of 2011, with liftoff occurring in the fourth quarter of that year. Our assumptions for nontraditional policy actions are essentially unchanged from the December Greenbook. As before, we expect that the Federal Reserve will have purchased a total of slightly more than $1.7 trillion of longterm securities by the end of the current quarter—$300 billion of Treasury debt, $175 billion of agency debt, and $1.25 trillion of agency mortgage-backed securities (MBS). As discussed in the Bluebook, the System’s holdings of these securities are now assumed to run off a bit more gradually than we had anticipated in December, declining to $1.4 trillion by the end of 2011.
The 10-year Treasury yield has risen 30 basis points since we closed the December Greenbook, apparently lifted by incoming data that confirmed the recovery remains on track.1 We assume that this rate will increase another 40 basis points between now and the end of 2011. As in prior forecasts, the projected rise in the Treasury yield over the next two years largely reflects the upward pressure on rates from the movement of the 10-year valuation window through the period of near-zero short-term rates. This influence more than offsets the downward pressure on long-term yields that we assume will be imparted as market participants gradually revise down their expectations for the federal funds rate toward the path incorporated in our baseline forecast.
The average interest rate on conforming fixed-rate mortgages has risen about 25 basis points since the time of the December Greenbook and now stands a shade above 5 percent; we expect it to move up to about 5¾ percent by the end of 2011, reflecting both the expected increase in long-term Treasury yields and some widening of the mortgage rate spread associated with the end of the Federal Reserve’s MBS purchases. Meanwhile, the yield on BBB-rated corporate bonds has fallen 25 basis points over the past six weeks, and the spread relative to the 10-year Treasury yield has dropped substantially below the level we had assumed in our last forecast. We have reduced the degree to which spreads will continue to narrow in this projection relative to December and now expect corporate bond yields to drift up a touch from here on.
Class II FOMC - Restricted (FR) I-3
Key Background Factors Underlying the Baseline Staff Projection
Federal Funds Rate LongTerm Interest Rates Percent Percent
Quarterly average
Current Greenbook December Greenbook Market forecast
2006 2007 2008 2009 2010 2011 0
1
2
3
4
5
6
7
8 Quarterly average
Conforming mortgage rate
10year Treasury yield
BBB corporate yield
2006 2007 2008 2009 2010 2011 2
3
4
5
6
7
8
9
10
Equity Prices House Prices 2006:Q1 = 100, ratio scale 2006:Q1 = 100, ratio scale
Quarterend
Dow Jones Total Stock Market
Index
2006 2007 2008 2009 2010 2011 60
70
80
90
100
110
120
130
140
150
Note: The projection period begins in 2009:Q4.
Quarterly
LoanPerformance index
2006 2007 2008 2009 2010 2011 60
70
80
90
100
110
120
Crude Oil Prices Broad Real Dollar Dollars per barrel 2006:Q1 = 100
Quarterly average
West Texas Intermediate
2006 2007 2008 2009 2010 2011 20
40
60
80
100
120
140 Quarterly average
80
85
90
95
100
105
110
2006 2007 2008 2009 2010 2011
Note: In each panel, shading represents the projection period, which begins in 2010:Q1, except where noted. In the upperleft panel that reports the federal funds rate, the dashed line is not apparent because the paths of the federal funds rate in the December and current Greenbooks are the same.
I-4 Class II FOMC—Restricted (FR) Part 1: Summary and Outlook, January 20, 2010
Broad indexes of equity prices currently stand about 4 percent above the level assumed in the December Greenbook, and we have raised the projected path for stock prices by a similar amount. As before, we project that the equity premium, which remains high compared with longer-run norms, will decline over the forecast period. As a result, we have equity prices rising about 15 percent per year, on average, in 2010 and 2011.
Our projection for house prices is about the same as that in the December Greenbook. As we had expected, the LoanPerformance (LP) home price index has turned back down in recent months after a string of increases, and our estimate for the decline in the fourth quarter remains at 6½ percent at an annual rate. We expect the LP index to edge down another 2½ percent in 2010 as foreclosure-related sales and tighter-than-normal credit supply conditions offset the effects of gradually strengthening demand. Home prices are expected to inch up in 2011.
On the fiscal front, we have assumed that the Congress will provide another $75 billion in grants-in-aid to state and local governments, consistent with the jobs package passed by the House in December. These grants, which will be mostly spent over the next several years, should generate a small incremental boost to economic activity. However, the difference is not large enough to materially change our estimate that federal fiscal policy will provide an impetus to real GDP growth (on an annual-average basis) of about 1 percentage point in 2010; we continue to expect federal fiscal impetus to turn slightly negative in 2011.
Our forecast for the unified budget is about the same as in the December Greenbook, with the deficit expected to total about $1.4 trillion (10 percent of GDP) in fiscal 2010 and $1.2 trillion (8 percent of GDP) in fiscal 2011. In the main, the narrowing of the deficit in 2011 reflects the budgetary effects of the economic recovery as well as the winding down of stimulus spending (even under our new assumptions).
In the foreign exchange markets, the broad real dollar has changed little, on net, since we closed the December Greenbook; we continue to project it to depreciate at a pace of about 2½ percent per year, on average, in 2010 and 2011. As for economic activity abroad, foreign real GDP appears to have risen at an annual rate of more than 3½ percent in the second half of 2009; we expect it to expand at a similar pace this year before picking up to a 4 percent pace in 2011.
2 Because of the late harvest, some of the net accumulation of inventories of farm products that typically occurs in the third quarter appears to have been delayed until the fourth quarter. Our rough estimate is that, all else being equal, the lateness of the harvest caused third-quarter real GDP growth to be understated by ¾ percentage point, fourth-quarter growth to be overstated by 1½ percentage points, and will cause first-quarter growth to be understated by ¾ percentage point. Thus, abstracting from these harvest-related inventory swings, we estimate that real GDP growth was 3 percent in the third quarter, 3¾ percent in the fourth quarter, and will be 3½ percent in the first quarter of 2010.
Domestic Developments Class II FOMC—Restricted (FR) I-5
The spot price of West Texas Intermediate (WTI) crude oil has risen about $6 per barrel on net over the past six weeks, to $79 per barrel. Based on the path for futures prices, we assume that the spot price of WTI will rise to $87 per barrel by the end of 2011, essentially the same as our assumption in the December Greenbook.
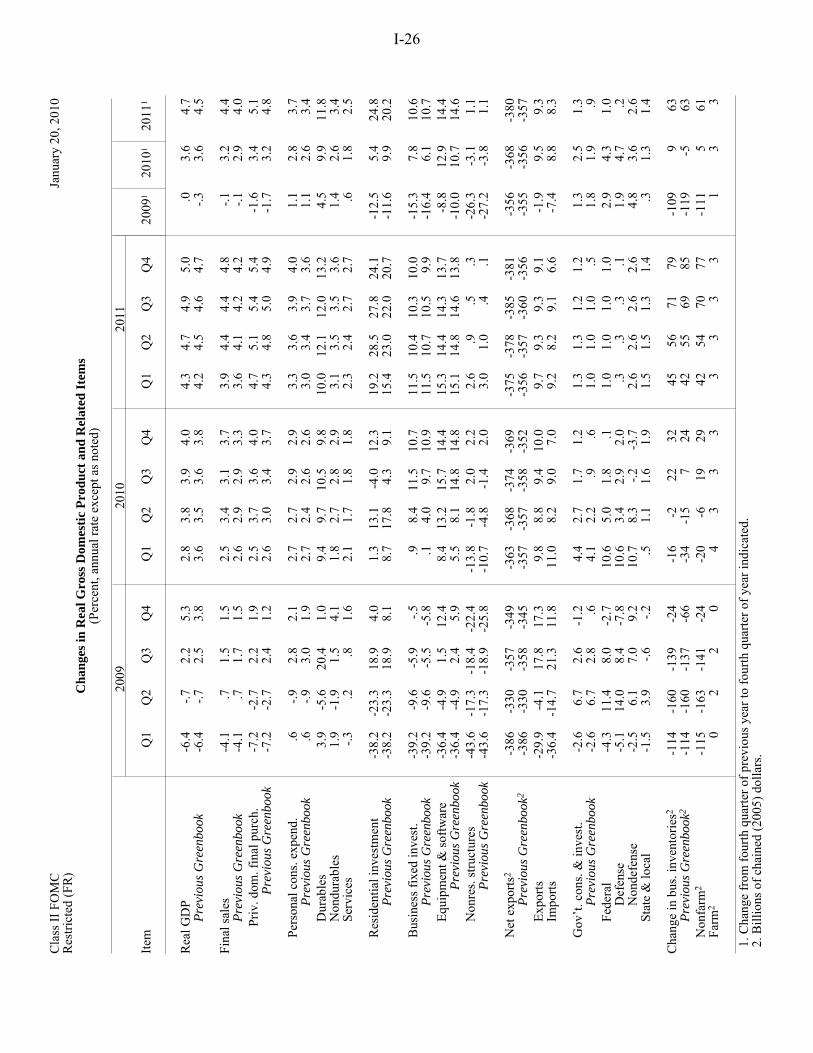
Recent Developments and the Near-Term Outlook As noted above, we have revised up our estimate of real GDP growth in the fourth quarter of 2009 to an annual rate of 5¼ percent. This upward revision is largely the result of incoming data that point to a substantially larger contribution from inventory investment than we were expecting, reflecting both a sizable accumulation of farm products in the aftermath of a big, late harvest and a marked slowing in the pace of inventory liquidation elsewhere.2 In contrast, the increase in final sales—at 1½ percent— was in line with our expectations as a larger-than-anticipated rise in business fixed investment offset lower readings for some other sectors. In the current quarter, we expect real GDP to rise about 2¾ percent, as the growth of final sales steps up while the contribution to growth from inventory investment recedes.
In the labor market, the pace of job loss has continued to moderate about as we had expected. Declines in private payrolls slowed from about 170,000 per month, on average, in the third quarter of last year to about 75,000 per month in the fourth quarter, and the unemployment rate leveled off at the end of last year. Given the recent readings on initial claims and other near-term indicators, we expect private payrolls to edge down in January; we are looking for modest increases in February and March. The unemployment rate is expected to average 10.1 percent this quarter, one-tenth more than in the fourth quarter, as the small net gain in employment falls short of the rise in the labor force.
Smoothing through the ups and downs in the monthly data, output in the manufacturing sector has continued to trend up. Production of motor vehicles rose significantly over the second half of 2009 as manufacturers stepped up assemblies to satisfy rising demand and restock dealers’ lots; current schedules call for another increase in production in the
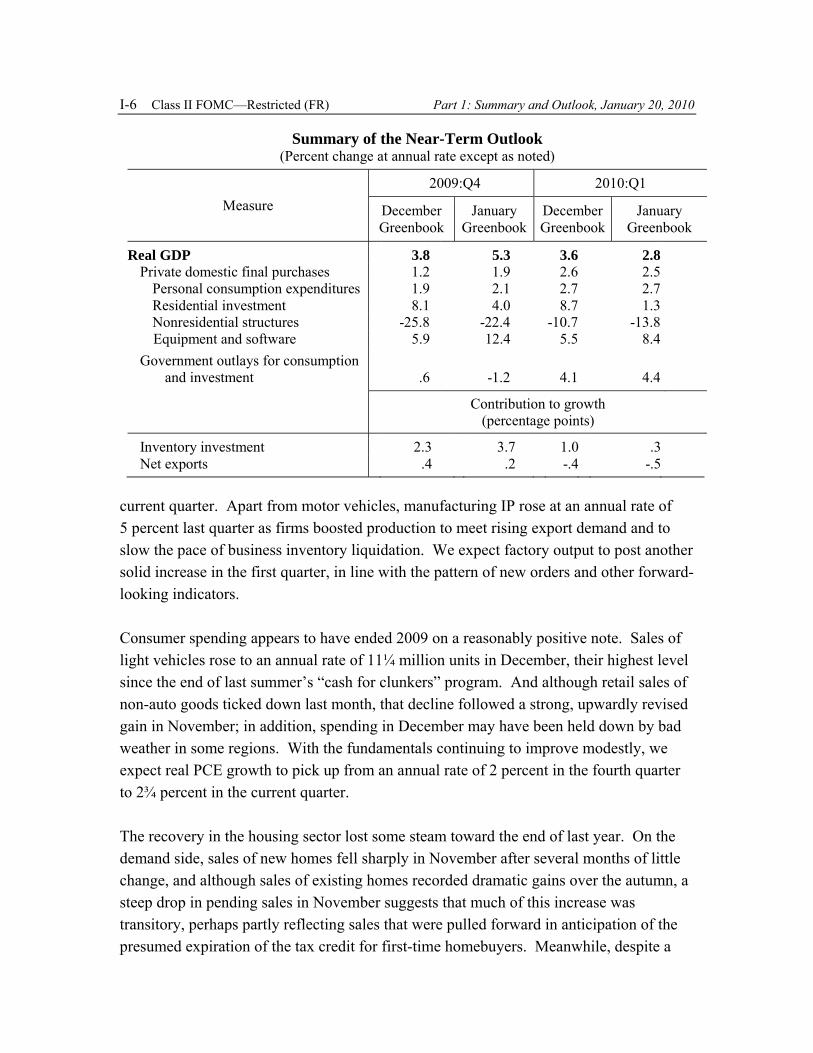
Summary of the Near-Term Outlook (Percent change at annual rate except as noted)
Measure 2009:Q4 2010:Q1
December Greenbook
January Greenbook
December Greenbook
January Greenbook
Real GDP Private domestic final purchases
Personal consumption expenditures Residential investment
Nonresidential structures Equipment and software
Government outlays for consumption and investment
3.8 5.3 3.6 2.8 1.2 1.9 2.6 2.51.9 2.1 2.7 2.7 8.1 4.0 8.7 1.3
-25.8 -22.4 -10.7 -13.85.9 12.4 5.5 8.4
.6 -1.2 4.1 4.4
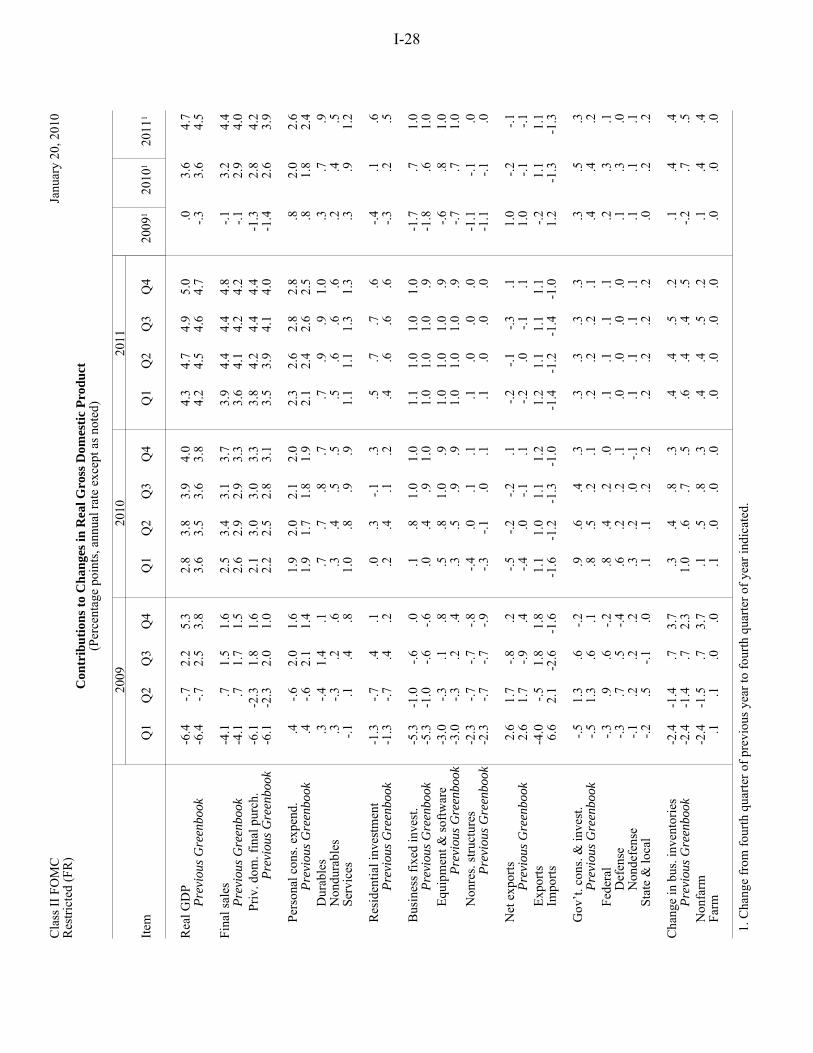
Contribution to growth (percentage points)
Inventory investment Net exports
2.3 3.7 1.0 .3 .4 .2 -.4 -.5
I-6 Class II FOMC—Restricted (FR) Part 1: Summary and Outlook, January 20, 2010
current quarter. Apart from motor vehicles, manufacturing IP rose at an annual rate of 5 percent last quarter as firms boosted production to meet rising export demand and to slow the pace of business inventory liquidation. We expect factory output to post another solid increase in the first quarter, in line with the pattern of new orders and other forward-looking indicators.
Consumer spending appears to have ended 2009 on a reasonably positive note. Sales of light vehicles rose to an annual rate of 11¼ million units in December, their highest level since the end of last summer’s “cash for clunkers” program. And although retail sales of non-auto goods ticked down last month, that decline followed a strong, upwardly revised gain in November; in addition, spending in December may have been held down by bad weather in some regions. With the fundamentals continuing to improve modestly, we expect real PCE growth to pick up from an annual rate of 2 percent in the fourth quarter to 2¾ percent in the current quarter.
The recovery in the housing sector lost some steam toward the end of last year. On the demand side, sales of new homes fell sharply in November after several months of little change, and although sales of existing homes recorded dramatic gains over the autumn, a steep drop in pending sales in November suggests that much of this increase was transitory, perhaps partly reflecting sales that were pulled forward in anticipation of the presumed expiration of the tax credit for first-time homebuyers. Meanwhile, despite a
Domestic Developments Class II FOMC—Restricted (FR) I-7
sizable reduction in inventories of unsold new homes, single-family starts have been moving sideways since last June, likely reflecting concerns about the future trajectory of new home sales as well as difficulties faced by some builders in obtaining financing for new construction. We expect construction to pick up in the current quarter, consistent with the noticeable upturn in permits in December. Nonetheless, our forecast for single-family starts—at an annual rate of 530,000 units—is 60,000 units below that in the December Greenbook. All told, we now expect residential investment to contribute less than 0.1 percentage point to real GDP growth, on average, in the fourth and first quarters.
We estimate that real investment in equipment and software (E&S) rose at an annual rate of 12½ percent in the fourth quarter. Businesses added light vehicles to their fleets and stepped up their purchases of heavy trucks in advance of new environmental regulations on diesel engines. Meanwhile, spending on high-tech equipment and software rose briskly, and spending outside of high-tech and transportation equipment stabilized after falling about 20 percent over the preceding four quarters. Given the recent improvement in orders for nondefense capital goods, upbeat reports from the high-tech sector, and more favorable financial conditions, we expect E&S to post another sizable increase in the current quarter.
We estimate that real outlays on nonresidential structures fell at an annual rate of 22 percent in the fourth quarter, with sharp drops in all major categories except drilling and mining. Given the downbeat tone of near-term indicators, such as vacancy rates and the architectural billings index, we are projecting another marked contraction in construction in the current quarter.
In the government sector, real federal expenditures for consumption and gross investment appear to have fallen at an annual rate of nearly 3 percent in the fourth quarter. This decline is primarily the result of a large decrease in defense spending, which can be volatile from quarter to quarter. Indeed, we expect federal outlays to rebound in the current quarter, as defense spending bounces back to a trend more consistent with appropriations and nondefense spending continues to be bolstered by stimulus funds; hiring for the decennial census also adds a bit to spending this quarter. Meanwhile, state and local purchases appear to be holding up despite ongoing budget pressures: Employment was about flat, on net, in the fourth quarter after dropping in the third quarter, and although construction outlays appear to have hit a soft patch in late 2009, we expect growth in these outlays to pick back up in the first quarter given the
I-8 Class II FOMC—Restricted (FR) Part 1: Summary and Outlook, January 20, 2010
availability of federal stimulus funds and generally favorable conditions in municipal bond markets.
Based on international trade data through November and other information, we estimate that net exports added slightly to the increase in real GDP in the fourth quarter as a sizable increase in real imports was accompanied by an even larger increase in real exports. Although both exports and imports are expected to post solid increases in the first quarter as foreign and domestic demand continue to expand, the projected rise in imports exceeds that of exports, and the external sector’s contribution to real GDP growth turns negative.
As we had projected in the December Greenbook, core PCE prices appear to have risen at an annual rate of 1½ percent in the fourth quarter, pushed up by higher-than-average readings for the erratic nonmarket prices. We expect core PCE inflation to drop back to 1¼ percent in the current quarter as nonmarket prices return to a more normal rate of increase. Appreciable increases in energy prices lift headline inflation to 3 percent in the fourth quarter and 2 percent in the first quarter.
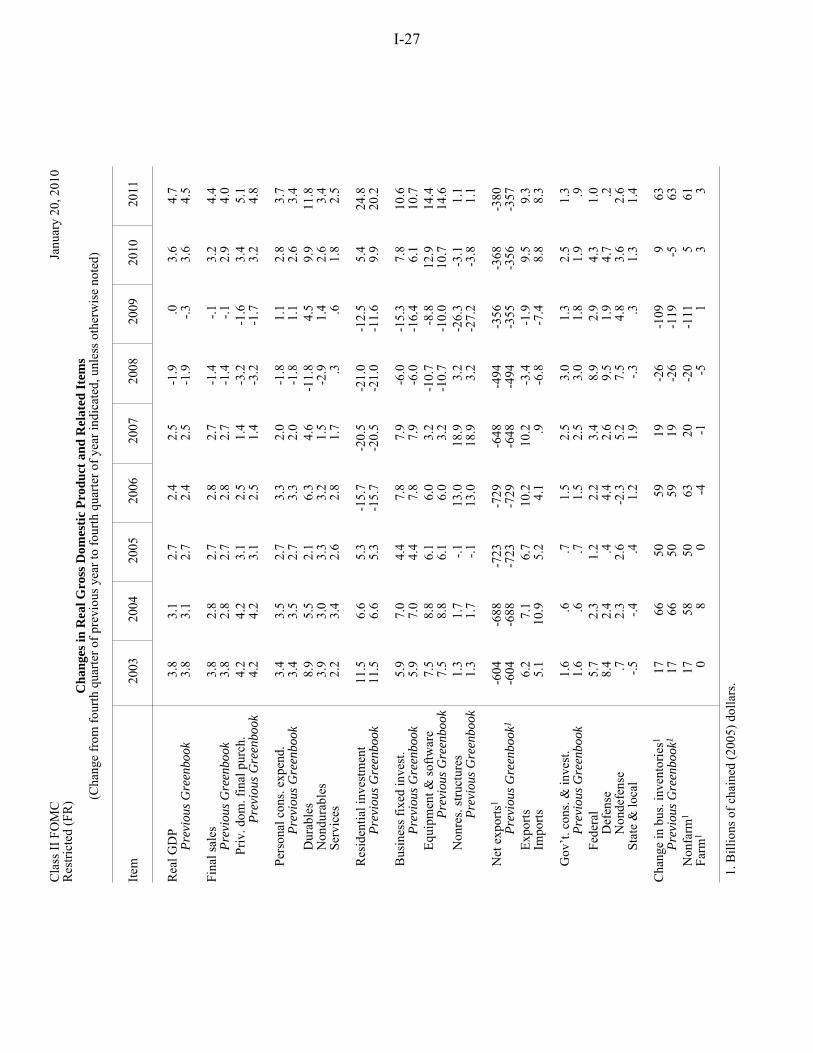
The Medium-Term Outlook The basic contour of our medium-term forecast is very similar to that in the December Greenbook. We continue to expect the pace of economic activity to firm over the next two years as monetary policy remains accommodative, financial stresses ease further, the drag from earlier declines in wealth lessens, and household and business confidence improves. That said, we have edged up our projection a bit, in part because financial conditions seem to be improving a little faster than we had anticipated; we have also built slightly more fiscal stimulus into this projection. Even so, the recovery is modest by historical standards, and economic slack remains sizable throughout the forecast period, with the level of real GDP still about 4 percent below the level of potential output at the end of 2011.
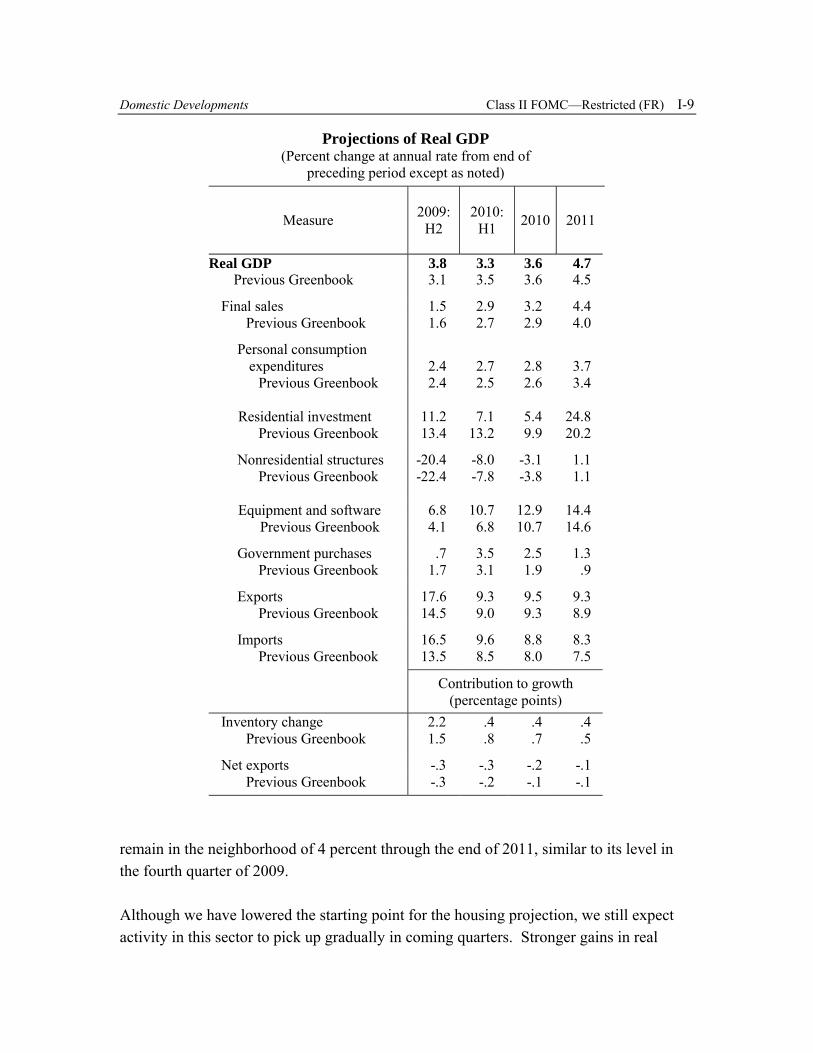
Household sector. We project growth in real consumer spending to pick up from an annual rate of 2½ percent in the second half of 2009 to about 2¾ percent in 2010 and 3¾ percent in 2011. The gains in PCE are consistent with the improvement in the labor market and the waning of negative wealth effects. And although restraints on consumer credit will likely continue to damp spending to some extent in coming quarters, those restraints should diminish as we move into 2011. The personal saving rate is expected to
Projections of Real GDP (Percent change at annual rate from end of
preceding period except as noted)
Measure 2009: H2
2010: H1 2010 2011
Real GDP Previous Greenbook
Final sales Previous Greenbook
Personal consumption expenditures Previous Greenbook
Residential investment Previous Greenbook
Nonresidential structures Previous Greenbook
Equipment and software Previous Greenbook
Government purchases Previous Greenbook
Exports Previous Greenbook
Imports Previous Greenbook
3.8 3.3 3.6 4.7 3.1 3.5 3.6 4.5
1.5 2.9 3.2 4.4 1.6 2.7 2.9 4.0
2.4 2.7 2.8 3.7 2.4 2.5 2.6 3.4
11.2 7.1 5.4 24.813.4 13.2 9.9 20.2
-20.4 -8.0 -3.1 1.1 -22.4 -7.8 -3.8 1.1
6.8 10.7 12.9 14.44.1 6.8 10.7 14.6
.7 3.5 2.5 1.3 1.7 3.1 1.9 .9
17.6 9.3 9.5 9.3 14.5 9.0 9.3 8.9
16.5 9.6 8.8 8.3 13.5 8.5 8.0 7.5
Contribution to growth (percentage points)
Inventory change 2.2 .4 .4 .4 Previous Greenbook 1.5 .8 .7 .5
Net exports -.3 -.3 -.2 -.1 Previous Greenbook -.3 -.2 -.1 -.1
Domestic Develo pments Class II FOMC—Restricted (FR) I-9
remain in the neighborhood of 4 percent through the end of 2011, similar to its level in the fourth quarter of 2009.
Although we have lowered the starting point for the housing projection, we still expect activity in this sector to pick up gradually in coming quarters. Stronger gains in real
I-10 Class II FOMC—Restricted (FR) Part 1: Summary and Outlook, January 20, 2010
household incomes and continued low mortgage rates should provide support for demand this year and next, and with real estate prices perceived to be nearing bottom, potential buyers should become more willing to purchase a home. Given the current low level of new home inventories, we expect the increase in new home sales to translate into an upturn in starts. As a result, our forecast calls for single-family housing starts to move up from about 500,000 units at an annual rate in the second half of 2009 to a 650,000 unit pace by the end of 2010 and to reach 1 million units by the end of 2011. Multifamily construction will probably continue to be crimped in 2010 by the limited availability of credit for such projects and the downward pressure on rents from high vacancy rates, but these negatives should lessen in 2011. Given our projected path for total housing starts, we expect residential investment to rise 5½ percent in 2010 and 25 percent in 2011.
Business investment. Real E&S spending appears to be picking up, and we expect it to strengthen further in coming quarters as access to credit continues to improve and prospects for business sales continue to brighten. Moreover, because the recent low level of gross investment has not been sufficient to prevent equipment stocks from falling, firms will likely want to boost their outlays appreciably over time to expand their productive capacity as economic activity recovers. In all, we expect real outlays on E&S to increase 13 percent in 2010 and 14½ percent in 2011, after falling 9 percent in 2009.
We continue to expect real outlays for nonresidential structures to decline this year— albeit much less rapidly than in 2009—before turning up slightly in 2011. Given our path for energy prices, investment in drilling and mining structures should increase somewhat from its low current level. But spending on nonresidential buildings likely will continue to contract through 2011, given the high vacancy rates and tight credit conditions facing this sector.
We expect that firms will trim inventories a bit more in the first half of this year, but stockbuilding should resume in the second half and rise steadily over the course of 2011 as final sales strengthen. In all, inventory investment is expected to contribute nearly ½ percentage point to real GDP growth in both 2010 and 2011.
Government spending. Real federal purchases are projected to rise 4¼ percent in 2010, reflecting both increases in defense spending and the support to nondefense spending stemming from stimulus funds. In 2011, we expect federal spending to decelerate significantly as defense spending flattens out and the growth in nondefense spending slows. Meanwhile, with state and local governments now assumed to receive some
additional stimulus grants, we expect real purchases in that sector to rise a bit more than 1¼ percent per year in 2010 and 2011, nearly ½ percentage point per year more, on average, than in the December Greenbook.
Net exports.
3 To be clear, the 5¼ percent figure for the NAIRU does not include the effects of extended and emergency unemployment benefits (EEB). EEB programs add to the unemployment rate by inducing individuals who would otherwise have dropped out of the labor force to report themselves as unemployed in order to receive these benefits, and perhaps by enabling jobseekers to be more deliberate in their search. We estimate that these programs are currently boosting the unemployment rate by close to 1 percentage point, and we anticipate that this effect will continue through 2011. As a result, the amount of unemployment not representative of slack in resource utilization—which could be thought of as an “effective” NAIRU—is currently around 6¼ percent.
.
Domestic Developments Class II FOMC—Restricted (FR) I-11
Real exports are expected to rise more than 9 percent in each of the next two years, reflecting the ongoing recovery in global activity and the effects of past and projected dollar depreciation. Imports are also expected to rebound, rising more than 8 percent per year over the forecast period. As in the December Greenbook, net exports are projected to have little net effect on the change in real GDP in either 2010 or 2011. (The “International Developments” section provides more detail on the outlook for the external sector.)
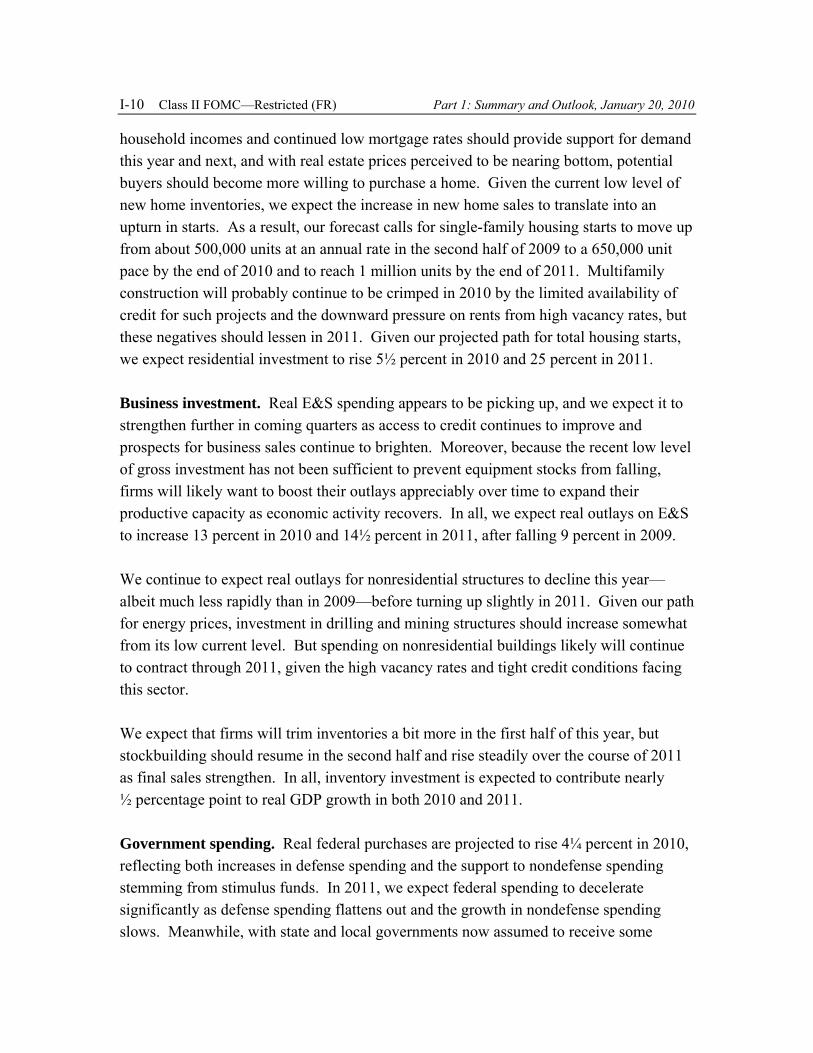
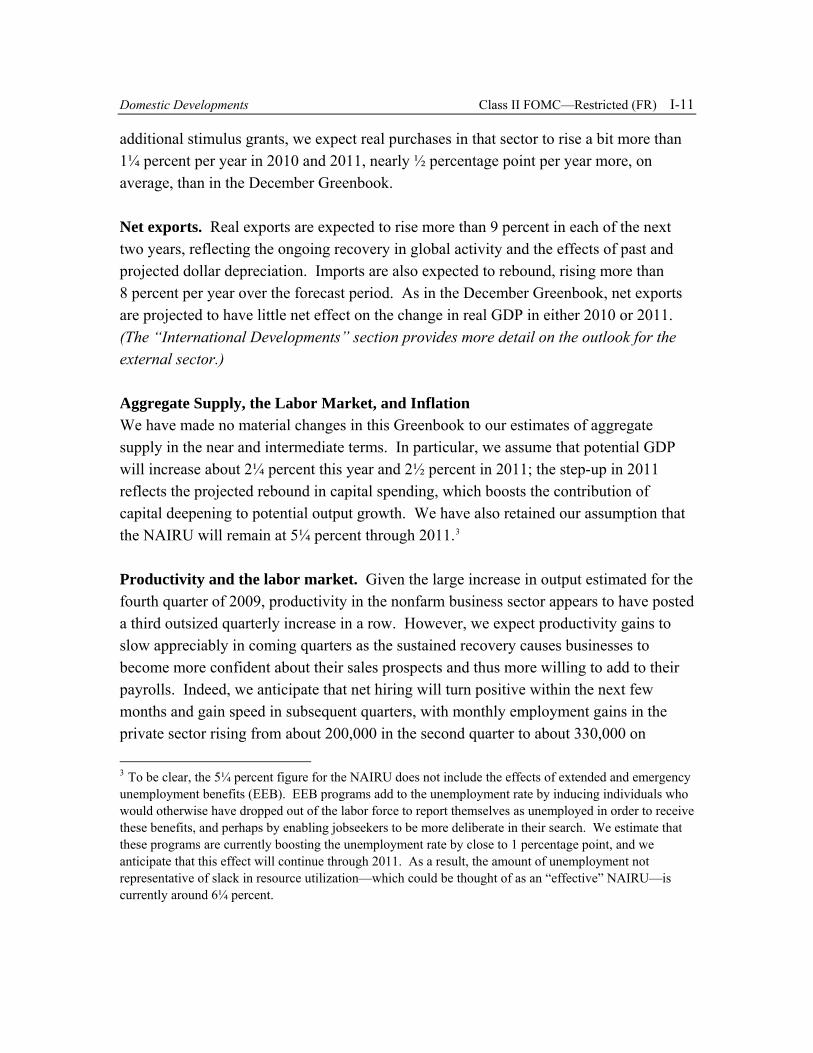
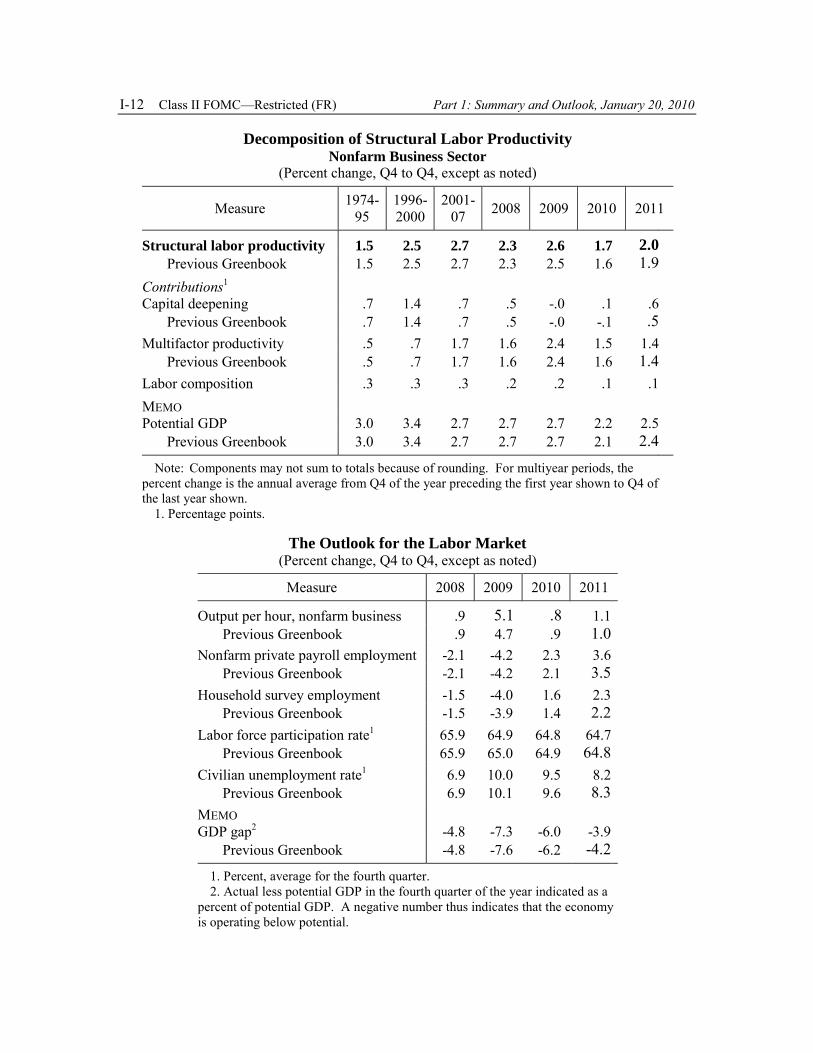
Aggregate Supply, the Labor Market, and Inflation We have made no material changes in this Greenbook to our estimates of aggregate supply in the near and intermediate terms. In particular, we assume that potential GDP will increase about 2¼ percent this year and 2½ percent in 2011; the step-up in 2011 reflects the projected rebound in capital spending, which boosts the contribution of capital deepening to potential output growth. We have also retained our assumption that the NAIRU will remain at 5¼ percent through 2011 3
Productivity and the labor market. Given the large increase in output estimated for the fourth quarter of 2009, productivity in the nonfarm business sector appears to have posted a third outsized quarterly increase in a row. However, we expect productivity gains to slow appreciably in coming quarters as the sustained recovery causes businesses to become more confident about their sales prospects and thus more willing to add to their payrolls. Indeed, we anticipate that net hiring will turn positive within the next few months and gain speed in subsequent quarters, with monthly employment gains in the private sector rising from about 200,000 in the second quarter to about 330,000 on
Decomposition of Structural Labor Productivity Nonfarm Business Sector
(Percent change, Q4 to Q4, except as noted)
Measure 197495
19962000
200107 2008 2009 2010 2011
Structural labor productivity Previous Greenbook Contributions1
Capital deepening Previous Greenbook Multifactor productivity Previous Greenbook Labor composition MEMO Potential GDP Previous Greenbook
1.5 1.5
.7
.7
.5
.5
.3
3.0 3.0
2.5 2.5
1.4 1.4 .7 .7 .3
3.4 3.4
2.7 2.7
.7
.7 1.7 1.7 .3
2.7 2.7
2.3 2.3
.5
.5 1.6 1.6
.2
2.7 2.7
2.6 2.5
-.0 -.02.4 2.4
.2
2.7 2.7
1.7 1.6
.1 -.1 1.5 1.6
.1
2.2 2.1
2.01.9
.6
.5 1.41.4
.1
2.52.4
Note: Components may not sum to totals because of rounding. For multiyear periods, the percent change is the annual average from Q4 of the year preceding the first year shown to Q4 of the last year shown.
1. Percentage points.
The Outlook for the Labor Market (Percent change, Q4 to Q4, except as noted)
Measure 2008 2009 2010 2011
Output per hour, nonfarm business .9 5.1 .8 1.1 Previous Greenbook .9 4.7 .9 1.0 Nonfarm private payroll employment -2.1 -4.2 2.3 3.6 Previous Greenbook -2.1 -4.2 2.1 3.5 Household survey employment -1.5 -4.0 1.6 2.3 Previous Greenbook -1.5 -3.9 1.4 2.2 Labor force participation rate1 65.9 64.9 64.8 64.7 Previous Greenbook 65.9 65.0 64.9 64.8 Civilian unemployment rate1 6.9 10.0 9.5 8.2 Previous Greenbook 6.9 10.1 9.6 8.3 MEMO GDP gap2 -4.8 -7.3 -6.0 -3.9 Previous Greenbook -4.8 -7.6 -6.2 -4.2
1. Percent, average for the fourth quarter. 2. Actual less potential GDP in the fourth quarter of the year indicated as a
percent of potential GDP. A negative number thus indicates that the economy is operating below potential.
I-12 Class II FOMC—Restricted (FR) Part 1: Summary and Outlook, January 20, 2010
Inflation Projections (Percent change, Q4 to Q4, except as noted)
Measure 2008 2009 2010 2011
PCE chain-weighted price index 1.7 1.3 1.4 1.1 Previous Greenbook 1.7 1.3 1.3 1.2
Food and beverages 6.8 -1.6 1.6 .7 Previous Greenbook 6.8 -1.6 1.3 .7
Energy -9.1 3.3 5.6 2.8 Previous Greenbook -9.1 2.8 4.3 3.5
Excluding food and energy 2.0 1.5 1.2 1.1 Previous Greenbook 2.0 1.5 1.2 1.1
Consumer price index 1.5 1.5 1.7 1.3 Previous Greenbook 1.5 1.4 1.6 1.4
Excluding food and energy 2.0 1.7 1.3 1.2 Previous Greenbook 2.0 1.8 1.3 1.2
GDP chain-weighted price index 1.9 .8 1.3 1.1 Previous Greenbook 1.9 .8 1.3 1.1
ECI for compensation of private industry workers1 2.4 1.3 2.1 2.0 Previous Greenbook 2.4 1.2 1.8 1.9
Compensation per hour, nonfarm business sector 2.6 2.4 2.4 2.2
Previous Greenbook 2.6 2.4 2.0 2.0
Prices of core goods imports2 3.8 -1.3 2.4 1.0 Previous Greenbook 3.8 -1.4 1.9 1.0
1. December to December. 2. Core goods imports exclude computers, semiconductors, oil, and natural gas.
Domestic Developments Class II FOMC—Restricted (FR) I-13
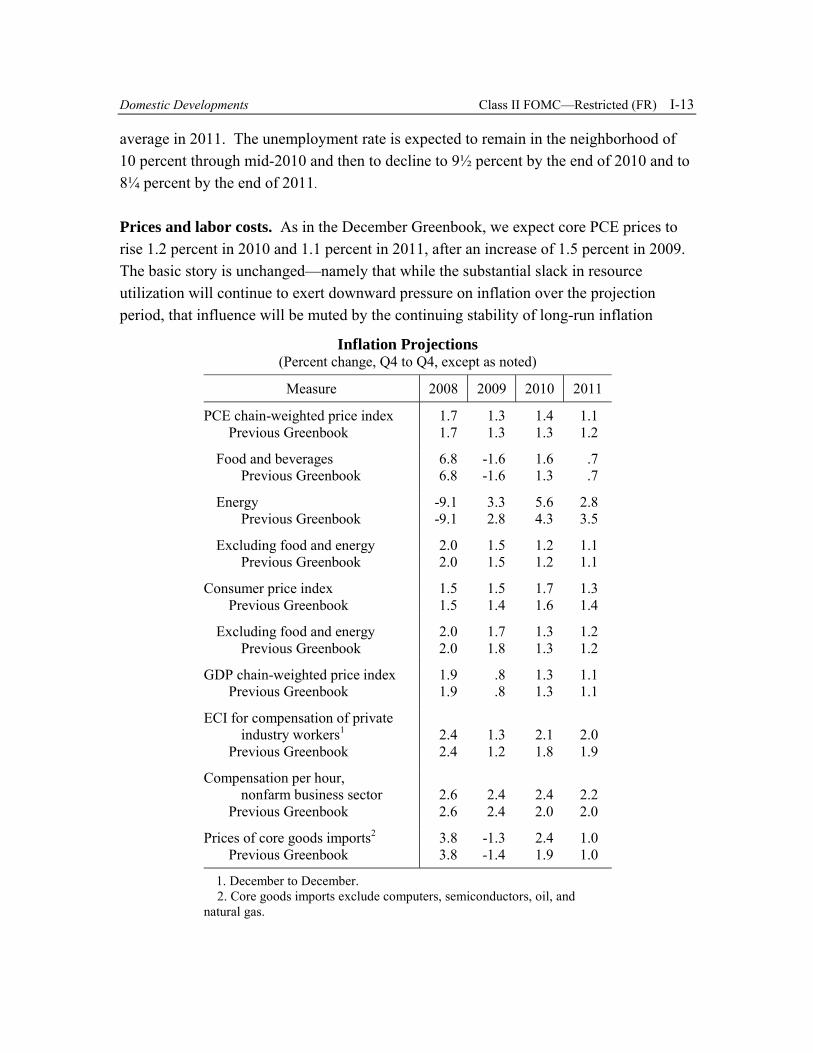
average in 2011. The unemployment rate is expected to remain in the neighborhood of 10 percent through mid-2010 and then to decline to 9½ percent by the end of 2010 and to 8¼ percent by the end of 2011.
Prices and labor costs. As in the December Greenbook, we expect core PCE prices to rise 1.2 percent in 2010 and 1.1 percent in 2011, after an increase of 1.5 percent in 2009. The basic story is unchanged—namely that while the substantial slack in resource utilization will continue to exert downward pressure on inflation over the projection period, that influence will be muted by the continuing stability of long-run inflation
I-14 Class II FOMC—Restricted (FR) Part 1: Summary and Outlook, January 20, 2010
expectations. Given our path for energy prices, total PCE inflation is expected to be somewhat above core inflation in 2010 and in line with core in 2011.
We have added nearly ½ percentage point to the projected increase in hourly compensation costs in 2010. This revision reflects the tax increases being levied on employers to replenish states’ depleted unemployment insurance trust funds as well as reports that bonus payments are likely to be higher than we had expected in December. Nonetheless, given the high rates of unemployment and low rates of price inflation in our forecast, we expect the productivity and cost measure of compensation per hour to rise only about 2¼ percent per year, on average, in 2010 and 2011. The employment cost index is expected to rise about 2 percent in each year.
Financial Flows and Conditions We project that domestic nonfinancial debt will expand at an annual rate of 2¾ percent this quarter; this rise is due almost entirely to a further increase in federal debt. Over the projection period, we anticipate that debt will increase at an average annual pace of 5¼ percent; this forecast reflects rapid growth for the federal government, a moderate rise for state and local governments, and sluggish increases for the household and nonfinancial business sectors.
Household debt is estimated to have contracted 2 percent last year, and we expect it to decline a bit further in the current quarter. Although we anticipate that household debt will begin to expand in the second half of this year, that increase is expected to be tepid through 2011 because of roughly flat home prices, continued deleveraging by households, relatively tight lending standards, and loan charge-offs that remain elevated for some time.
Nonfinancial business debt is projected to edge up in the current quarter after having contracted slightly last year. Firms with direct access to capital markets are expected to continue to issue bonds at a robust pace in the current quarter. Other forms of debt— particularly commercial mortgages and C&I loans—are expected to contract further, on balance, this quarter. Although commercial mortgage debt is expected to continue to shrink through 2011, we anticipate that C&I loans will begin to expand later this year, broadly consistent with indications from the January 2010 Senior Loan Officer Opinion Survey that the tightening of lending standards is coming to an end (see the appendix to the “Domestic Financial Developments” section in Part 2). Nonetheless, we expect only
Domestic Developments Class II FOMC—Restricted (FR) I-15
a modest rise in total business debt over the forecast period, as demand for external funds stays soft and remaining restrictions on the supply of credit ease only gradually.
Federal government debt is expected to balloon further over the forecast period as deficits remain extremely large. We project federal borrowing of roughly $1.5 trillion in 2010 and $1.1 trillion in 2011. In the state and local government sector, borrowing recovered last year as earlier strains in the municipal bond market eased, and we expect moderate debt growth over the projection period.
M2 is expected to be about flat in the current quarter, as a reallocation of household wealth toward higher-yielding non-M2 assets likely continues to weigh somewhat on money demand. As that process wanes, we expect M2 to increase at a pace closer to that of nominal GDP.
The Long-Term Outlook We have extended the staff forecast to 2014 using the FRB/US model and staff assessments of long-run supply-side conditions, fiscal policy, and other factors. The contour of the long-run outlook depends on the following key assumptions:
• Monetary policy aims to stabilize PCE inflation at 2 percent in the long run, consistent with the majority of longer-term inflation projections provided by FOMC participants at the October meeting.
• No further nontraditional monetary policy actions are undertaken beyond those that have already been announced. This assumption implies a gradual shrinking of the Federal Reserve’s balance sheet over time, in part as long-term assets mature.
• Risk premiums on corporate bonds and equity, which are expected to be near historically normal levels at the end of 2011, remain about flat thereafter. Banks ease their lending terms and standards somewhat further beyond 2011.
• Fiscal stimulus policies continue to boost the level of government purchases through 2012. The federal government budget deficit narrows to about 5 percent of GDP by the end of 2014. This improvement comes about as the economic expansion boosts receipts and lowers transfer payments and as policy actions after 2011 are assumed to reduce the deficit.
The Long-Term Outlook (Percent change, Q4 to Q4, except as noted)
Measure 2009 2010 2011 2012 2013 2014
Real GDPCivilian unemployment rate1
PCE prices, total Core PCE prices Federal funds rate1
.0 10.0 1.3 1.5 .1
3.6 9.5
1.4 1.2 .1
4.7 8.2
1.1 1.1 .5
4.5 6.1
1.3 1.2
2.2
3.8 5.3
1.5 1.4
3.4
3.3 5.2 1.7 1.6 3.8
1. Percent, average for the final quarter of the period.
4 In the long-run outlook, the federal funds rate (R) follows a simple policy rule of the form R = 2.5 + π - 1.1(u-u*) + 0.5(π – 2), subject to the zero lower bound constraint. In this expression, π denotes the four-quarter rate of core PCE inflation, u is the civilian unemployment rate, and u* is the staff estimate of the effective NAIRU. The same policy rule is used to set the federal funds rate in the alternative scenarios discussed later.
I-16 Class II FOMC—Restricted (FR) Part 1: Summary and Outlook, January 20, 2010
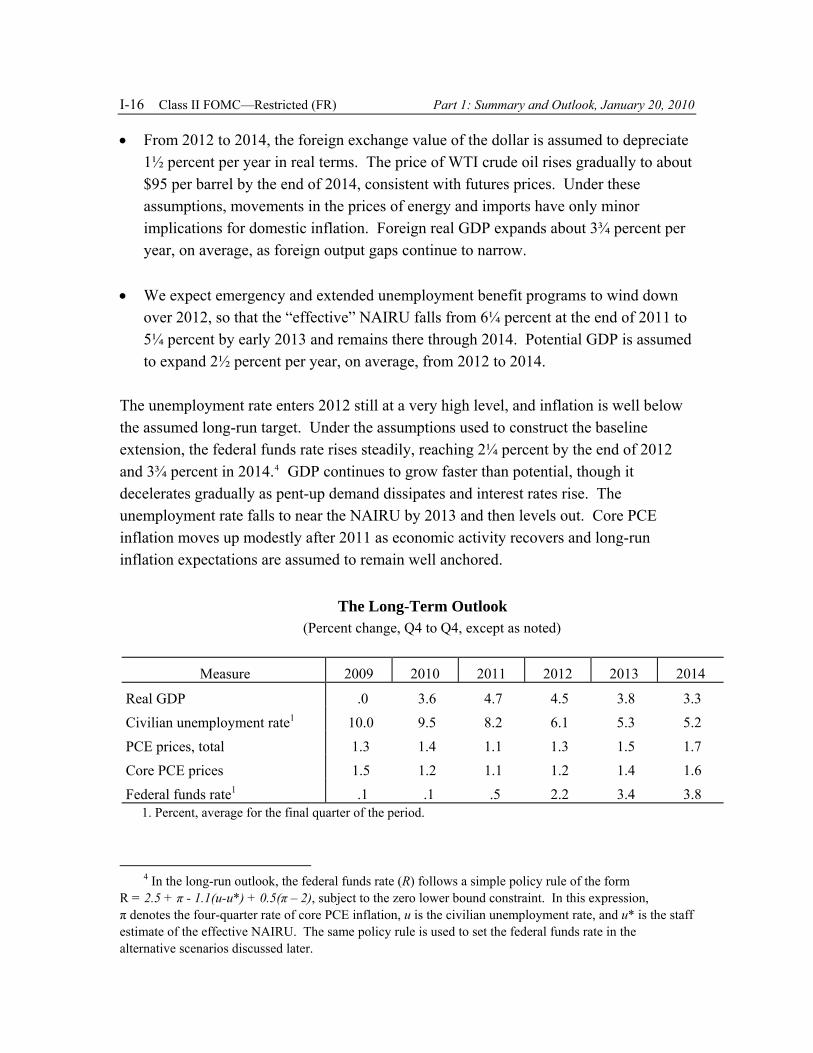
• From 2012 to 2014, the foreign exchange value of the dollar is assumed to depreciate 1½ percent per year in real terms. The price of WTI crude oil rises gradually to about $95 per barrel by the end of 2014, consistent with futures prices. Under these assumptions, movements in the prices of energy and imports have only minor implications for domestic inflation. Foreign real GDP expands about 3¾ percent per year, on average, as foreign output gaps continue to narrow.
• We expect emergency and extended unemployment benefit programs to wind down over 2012, so that the “effective” NAIRU falls from 6¼ percent at the end of 2011 to 5¼ percent by early 2013 and remains there through 2014. Potential GDP is assumed to expand 2½ percent per year, on average, from 2012 to 2014.
The unemployment rate enters 2012 still at a very high level, and inflation is well below the assumed long-run target. Under the assumptions used to construct the baseline extension, the federal funds rate rises steadily, reaching 2¼ percent by the end of 2012 and 3¾ percent in 2014.4 GDP continues to grow faster than potential, though it decelerates gradually as pent-up demand dissipates and interest rates rise. The unemployment rate falls to near the NAIRU by 2013 and then levels out. Core PCE inflation moves up modestly after 2011 as economic activity recovers and long-run inflation expectations are assumed to remain well anchored.
Domestic Developments Class II FOMC—Restricted (FR) I-17
Assessment of Forecast Uncertainty Since last October, evidence that a sustained economic recovery is under way has continued to mount; accordingly, the likelihood of adverse “tail” events has declined. Nevertheless, we continue to judge the risks associated with the staff projection to be elevated relative both to the experience of the past 20 years (the benchmark used by the Committee) and to the more volatile post-1968 sample period used by the staff for stochastic simulations. In large part, this assessment reflects the limited usefulness of our standard models and analyses in the unusual circumstances that we still confront, as evidenced by the continuing fragility of the banking system and some securitization markets, and the uncertain pace of financial improvement. As in October, we see the risks to real activity as roughly balanced.
We also continue to view the price outlook as more uncertain than usual. In particular, our standard inflation forecasting tools may be less useful than normal, with economic slack extremely elevated, monetary policy unable to provide further stimulus through conventional means, and the size of the Federal Reserve’s balance sheet having expanded by an unprecedented amount. Therefore, we suspect that our history-based confidence intervals probably understate the risks on both sides of our inflation forecast. We judge the risks to our price forecast as roughly balanced.
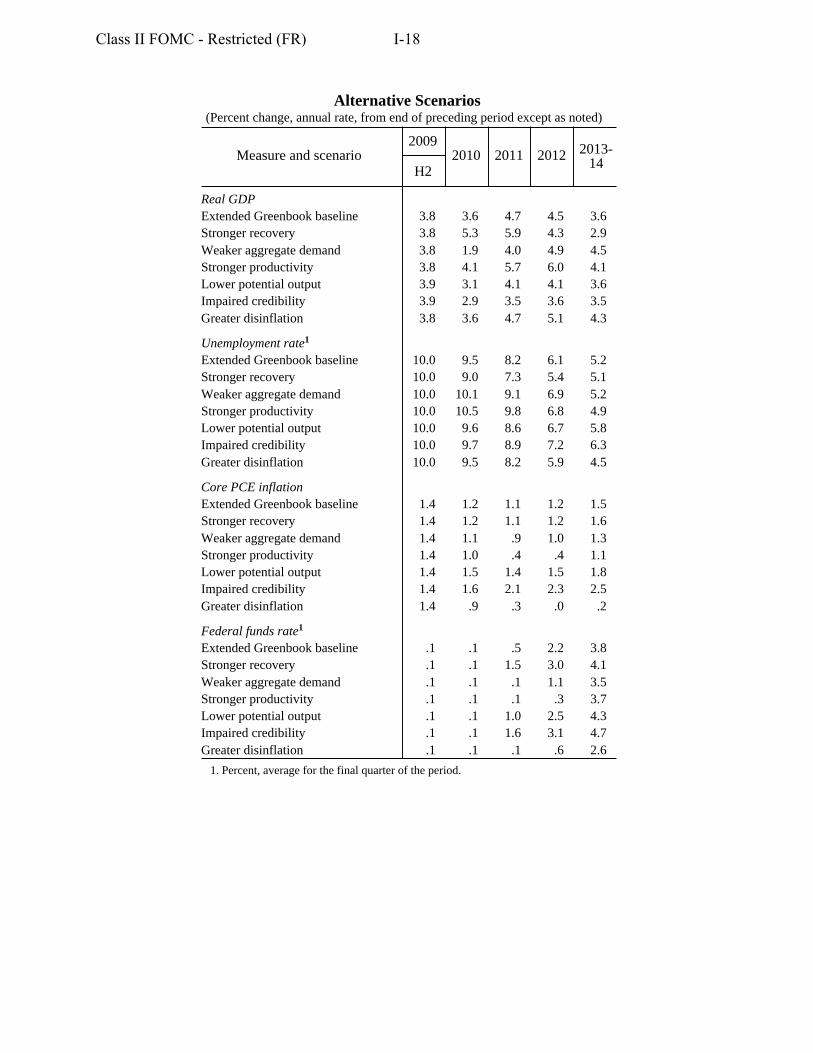
Alternative Scenarios In this section, we consider alternatives to the baseline projection using simulations of the FRB/US model. The first two scenarios feature opposing risks to aggregate demand— either that a stronger rebound in outlays on durable goods will cause real activity to recover more rapidly over the next three years than in the baseline, or that the recovery will be more anemic because credit availability will restrain household and business spending by more than we anticipate. We then turn to risks to the supply side, and in the third scenario explore the ramifications of stronger structural productivity growth. In contrast, the fourth and fifth scenarios consider how the outlook for real activity, inflation, and monetary policy might change if we are instead overestimating the amount of slack in the economy. The final scenario investigates the possibility that we have substantially underestimated disinflationary pressures. In each of these scenarios, the federal funds rate is assumed to follow the prescriptions of the simple policy rule detailed in the long-run outlook section, subject to an effective lower bound of 12½ basis points, and nontraditional policy is assumed to follow the baseline path.
Alternative Scenarios (Percent change, annual rate, from end of preceding period except as noted)
Measure and scenario 2009
2010 2011 2012 201314H2
Real GDP Extended Greenbook baseline 3.8 3.6 4.7 4.5 3.6 Stronger recovery 3.8 5.3 5.9 4.3 2.9 Weaker aggregate demand 3.8 1.9 4.0 4.9 4.5 Stronger productivity 3.8 4.1 5.7 6.0 4.1 Lower potential output 3.9 3.1 4.1 4.1 3.6 Impaired credibility 3.9 2.9 3.5 3.6 3.5 Greater disinflation 3.8 3.6 4.7 5.1 4.3
Unemployment rate1
Extended Greenbook baseline 10.0 9.5 8.2 6.1 5.2 Stronger recovery 10.0 9.0 7.3 5.4 5.1 Weaker aggregate demand 10.0 10.1 9.1 6.9 5.2 Stronger productivity 10.0 10.5 9.8 6.8 4.9 Lower potential output 10.0 9.6 8.6 6.7 5.8 Impaired credibility 10.0 9.7 8.9 7.2 6.3 Greater disinflation 10.0 9.5 8.2 5.9 4.5
Core PCE inflation Extended Greenbook baseline 1.4 1.2 1.1 1.2 1.5 Stronger recovery 1.4 1.2 1.1 1.2 1.6 Weaker aggregate demand 1.4 1.1 .9 1.0 1.3 Stronger productivity 1.4 1.0 .4 .4 1.1 Lower potential output 1.4 1.5 1.4 1.5 1.8 Impaired credibility 1.4 1.6 2.1 2.3 2.5 Greater disinflation 1.4 .9 .3 .0 .2
Federal funds rate1
Extended Greenbook baseline .1 .1 .5 2.2 3.8 Stronger recovery .1 .1 1.5 3.0 4.1 Weaker aggregate demand .1 .1 .1 1.1 3.5 Stronger productivity .1 .1 .1 .3 3.7 Lower potential output .1 .1 1.0 2.5 4.3 Impaired credibility .1 .1 1.6 3.1 4.7 Greater disinflation .1 .1 .1 .6 2.6
1. Percent, average for the final quarter of the period.
Class II FOMC - Restricted (FR) I-18
Domestic Developments Class II FOMC—Restricted (FR) I-19
Stronger recovery. In the recession, household and business spending on durable goods and structures dropped to low levels relative to our rough estimates of replacement demand. A snapback in such expenditures is a feature of many cyclical recoveries, but it occurs in only a muted fashion in the baseline projection. In this scenario, spending in these categories jumps 10 percent above baseline by the end of 2010, bringing such spending, relative to GDP, into a historically more typical range. Consequently, real GDP expands at an average annual rate of 5½ percent in 2010 and 2011. This rebound leads to a faster recovery in employment, with the result that the unemployment rate drops to 7¼ percent by the end of 2011 and continues to move down thereafter. With less slack, inflation is eventually a little higher than in the baseline, and the federal funds rate lifts off from the zero bound in early 2011.
Weaker aggregate demand. A major source of uncertainty in our projection is the extent to which spending will be restrained by continuing difficulties in obtaining credit, particularly for those borrowers dependent directly on banks and indirectly on some securitization markets. In this scenario, restrictive credit availability damps household and business spending more than assumed in the baseline. Moreover, the resulting weakness in overall output and employment in turn undercuts the confidence of consumers and businesses, slowing the pace of the recovery further. In this environment, we assume that the saving rate climbs to 5½ percent by 2011 instead of remaining close to 4 percent as in the baseline. In addition, the recoveries in residential construction and business capital spending are more moderate. In light of these stronger financial headwinds, real GDP rises about 1¼ percentage points per year more slowly than in the baseline this year and the next. As a result, the unemployment rate remains above 10 percent through 2010 and core PCE inflation falls below 1 percent in 2011. Beyond 2011, although the pace of the recovery picks up as financial conditions ease, the levels of real activity and inflation continue to run persistently below baseline, with the result that the federal funds rate does not rise appreciably above zero until mid-2012.
Stronger productivity. As the economic recovery continues this year, the baseline forecast assumes that firms will begin to boost payrolls and that output per hour—which rose rapidly in 2009—will decelerate, moving back in line with its trend level. In this scenario, we assume that actual labor productivity increases about 3¼ percent per year through 2011 because of larger gains in structural multifactor productivity. Beginning in 2012, labor productivity grows in line with its baseline rate. Although households and businesses respond to the more-favorable longer-run prospects associated with higher productivity by gradually increasing their spending, aggregate demand does not
I-20 Class II FOMC—Restricted (FR) Part 1: Summary and Outlook, January 20, 2010
immediately shift up by the full extent of the improvement in aggregate supply. As a result, labor demand is initially more subdued than in the baseline. All told, these developments cause real GDP to expand 4 percent in 2010 and 5¾ percent in 2011, even as the unemployment rate peaks at 10½ percent in late 2010. Real GDP continues to expand faster than in the baseline beyond 2011, which eventually brings the unemployment rate back to baseline. Inflation drops to ½ percent in 2011 and 2012 and remains persistently below baseline thereafter, both because higher productivity lowers unit labor costs directly and because resource utilization is lower than in the baseline. With resource utilization and inflation both below baseline, the federal funds rate remains near zero until late 2012.
Lower potential output. Potential output is difficult to measure, and we could be misjudging resource utilization—particularly in the current environment, where the shocks to financial markets and their repercussions for the broader economy have been both larger in magnitude and different in nature from what has typically occurred in previous downturns. In this scenario, we assume that the current level of potential output is lower than the staff estimates due to both a higher NAIRU and a lower level of structural productivity, so that the output gap is currently negative 5 percent instead of negative 7¼ percent as in the baseline. We also assume that monetary policymakers are slow to recognize the full extent of this error, with the result that perceived slack does not converge to its true value until the end of 2014. Because of the misperceived output gap, the federal funds rate remains at the zero bound for longer than would otherwise be called for under the simple policy rule, exacerbating the upward pressure on prices that comes from less-favorable supply-side conditions. Nevertheless, because long-run inflation expectations remain well anchored, the inflationary consequences of both less slack and the accompanying policy error are modest, and inflation is about ¼ percentage point higher than in the baseline from 2011 to 2014.
Impaired credibility. In the preceding scenario, the stability of long-run inflation expectations mutes the increase in inflation. However, inflation expectations might become unanchored if the public, who are assumed to correctly assess the output gap, interpret the FOMC’s failure to tighten more promptly under these circumstances as a sign that its inflation objective is higher than previously thought. In this scenario, we take the previous simulation as our starting point, and further assume that long-run inflation expectations increase to 3 percent by late 2010, thereby boosting actual inflation and becoming partially self-fulfilling. Core PCE inflation climbs steadily, averaging 2 percent in 2011 and 2½ percent in 2014. That development in turn brings forward the
Domestic Developments Class II FOMC—Restricted (FR) I-21
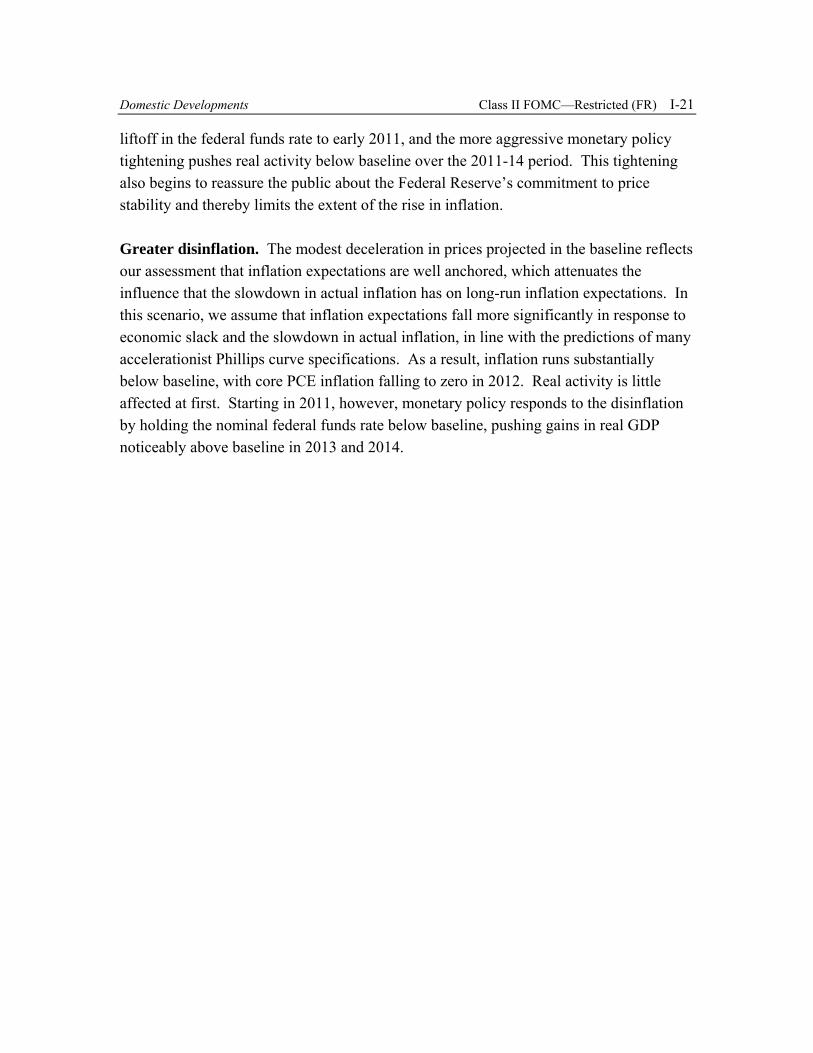
liftoff in the federal funds rate to early 2011, and the more aggressive monetary policy tightening pushes real activity below baseline over the 2011-14 period. This tightening also begins to reassure the public about the Federal Reserve’s commitment to price stability and thereby limits the extent of the rise in inflation.
Greater disinflation. The modest deceleration in prices projected in the baseline reflects our assessment that inflation expectations are well anchored, which attenuates the influence that the slowdown in actual inflation has on long-run inflation expectations. In this scenario, we assume that inflation expectations fall more significantly in response to economic slack and the slowdown in actual inflation, in line with the predictions of many accelerationist Phillips curve specifications. As a result, inflation runs substantially below baseline, with core PCE inflation falling to zero in 2012. Real activity is little affected at first. Starting in 2011, however, monetary policy responds to the disinflation by holding the nominal federal funds rate below baseline, pushing gains in real GDP noticeably above baseline in 2013 and 2014.
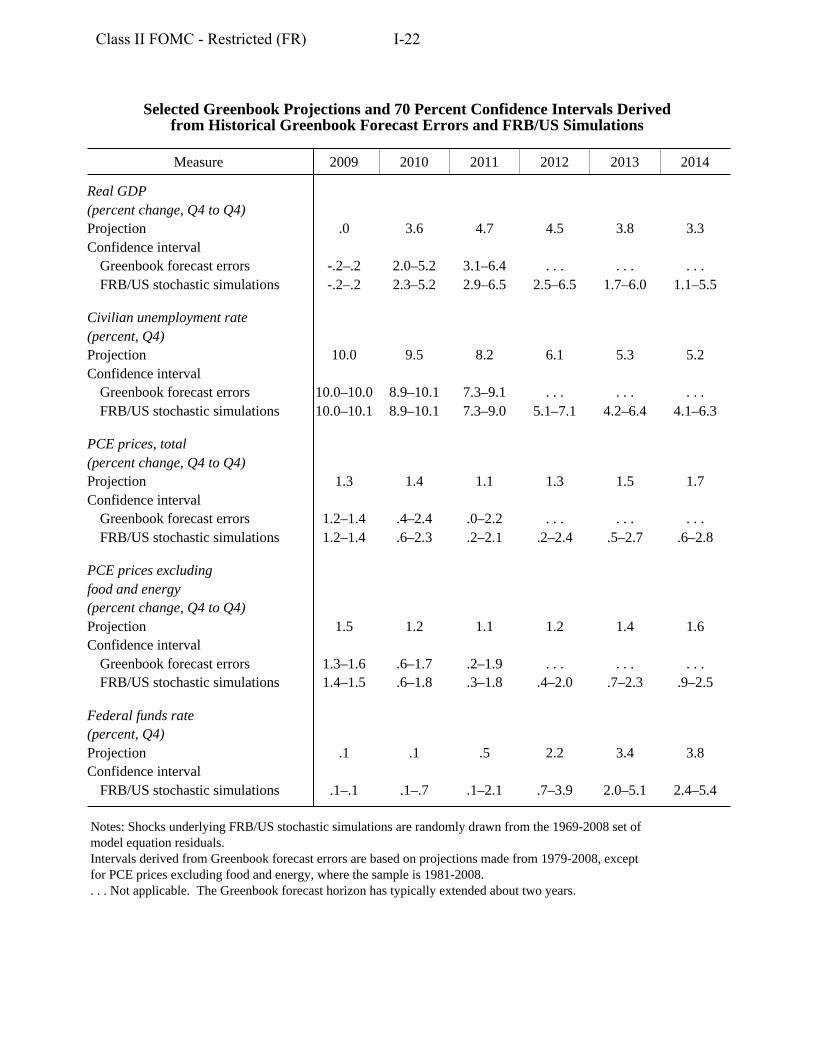
Selected Greenbook Projections and 70 Percent Confidence Intervals Derived from Historical Greenbook Forecast Errors and FRB/US Simulations
Measure 2009 2010 2011 2012 2013 2014
Real GDP (percent change, Q4 to Q4) Projection Confidence interval
.0 3.6 4.7 4.5 3.8 3.3
Greenbook forecast errors -.2–.2 2.0–5.2 3.1–6.4 . . . . . . . . . FRB/US stochastic simulations
Civilian unemployment rate (percent, Q4)
-.2–.2 2.3–5.2 2.9–6.5 2.5–6.5 1.7–6.0 1.1–5.5
Projection Confidence interval
10.0 9.5 8.2 6.1 5.3 5.2
Greenbook forecast errors 10.0–10.0 8.9–10.1 7.3–9.1 . . . . . . . . . FRB/US stochastic simulations
PCE prices, total (percent change, Q4 to Q4)
10.0–10.1 8.9–10.1 7.3–9.0 5.1–7.1 4.2–6.4 4.1–6.3
Projection Confidence interval
1.3 1.4 1.1 1.3 1.5 1.7
Greenbook forecast errors 1.2–1.4 .4–2.4 .0–2.2 . . . . . . . . . FRB/US stochastic simulations
PCE prices excluding food and energy (percent change, Q4 to Q4)
1.2–1.4 .6–2.3 .2–2.1 .2–2.4 .5–2.7 .6–2.8
Projection Confidence interval
1.5 1.2 1.1 1.2 1.4 1.6
Greenbook forecast errors 1.3–1.6 .6–1.7 .2–1.9 . . . . . . . . . FRB/US stochastic simulations
Federal funds rate (percent, Q4)
1.4–1.5 .6–1.8 .3–1.8 .4–2.0 .7–2.3 .9–2.5
Projection Confidence interval
.1 .1 .5 2.2 3.4 3.8
FRB/US stochastic simulations .1–.1 .1–.7 .1–2.1 .7–3.9 2.0–5.1 2.4–5.4
Notes: Shocks underlying FRB/US stochastic simulations are randomly drawn from the 1969-2008 set of model equation residuals. Intervals derived from Greenbook forecast errors are based on projections made from 1979-2008, except for PCE prices excluding food and energy, where the sample is 1981-2008. . . . Not applicable. The Greenbook forecast horizon has typically extended about two years.
Class II FOMC - Restricted (FR) I-22
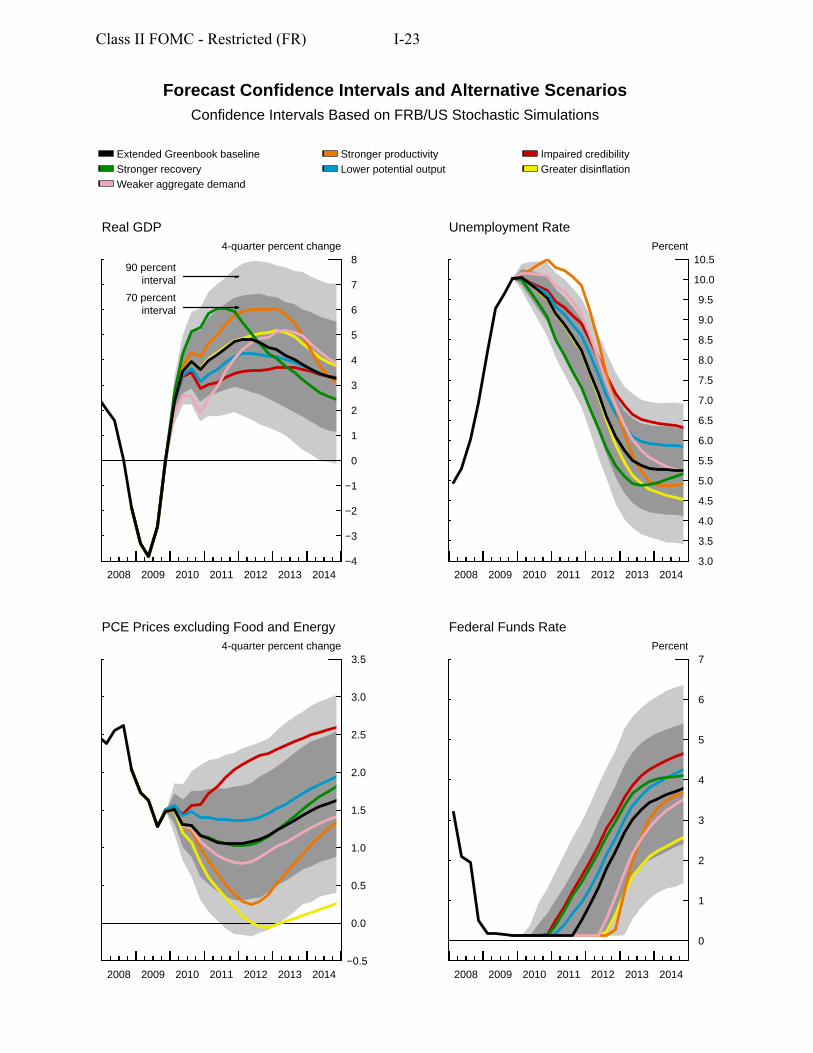
Forecast Confidence Intervals and Alternative Scenarios Confidence Intervals Based on FRB/US Stochastic Simulations
Extended Greenbook baseline Stronger productivity
Stronger recovery Lower potential output
Weaker aggregate demand
Real GDP 4quarter percent change
70 percent interval
90 percent interval
8
7
6
5
4
3
2
1
0
−1
−2
−3
−4 2008 2009 2010 2011 2012 2013 2014
PCE Prices excluding Food and Energy 4quarter percent change
3.5
3.0
2.5
2.0
1.5
1.0
0.5
0.0
−0.52008 2009 2010 2011 2012 2013 2014
Impaired credibility
Greater disinflation
Unemployment Rate Percent
2008 2009 2010 2011 2012 2013 2014
Federal Funds Rate Percent
10.5
10.0
9.5
9.0
8.5
8.0
7.5
7.0
6.5
6.0
5.5
5.0
4.5
4.0
3.5
3.0
7
6
5
4
3
2
1
0
2008 2009 2010 2011 2012 2013 2014
Class II FOMC - Restricted (FR) I-23
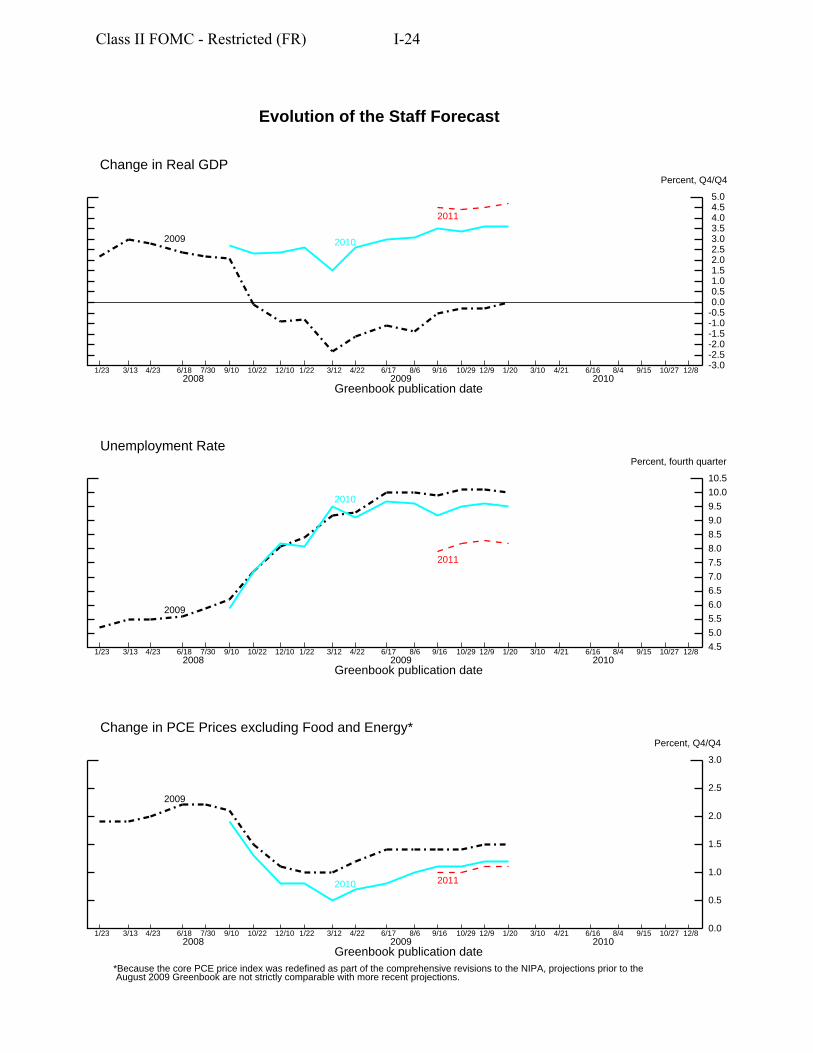
Evolution of the Staff Forecast
-3.0-2.5-2.0-1.5-1.0-0.50.00.51.01.52.02.53.03.54.04.55.0
-3.0-2.5-2.0-1.5-1.0-0.50.00.51.01.52.02.53.03.54.04.55.0
Percent, Q4/Q4
2009 2010
2011
Greenbook publication date 2008 2009 2010
1/23 3/13 4/23 6/18 7/30 9/10 10/22 12/10 1/22 3/12 4/22 6/17 8/6 9/16 10/29 12/9 1/20 3/10 4/21 6/16 8/4 9/15 10/27 12/8
Change in Real GDP
4.5
5.0
5.5
6.0
6.5
7.0
7.5
8.0
8.5
9.0
9.5
10.0
10.5
4.5
5.0
5.5
6.0
6.5
7.0
7.5
8.0
8.5
9.0
9.5
10.0
10.5
Percent, fourth quarter
Greenbook publication date 2008 2009 2010
1/23 3/13 4/23 6/18 7/30 9/10 10/22 12/10 1/22 3/12 4/22 6/17 8/6 9/16 10/29 12/9 1/20 3/10 4/21 6/16 8/4 9/15 10/27 12/8
2009
2010
2011
Unemployment Rate
0.0
0.5
1.0
1.5
2.0
2.5
3.0
0.0
0.5
1.0
1.5
2.0
2.5
3.0
Percent, Q4/Q4
Greenbook publication date 2008 2009 2010
*Because the core PCE price index was redefined as part of the comprehensive revisions to the NIPA, projections prior to the August 2009 Greenbook are not strictly comparable with more recent projections.
1/23 3/13 4/23 6/18 7/30 9/10 10/22 12/10 1/22 3/12 4/22 6/17 8/6 9/16 10/29 12/9 1/20 3/10 4/21 6/16 8/4 9/15 10/27 12/8
2009
2010 2011
Change in PCE Prices excluding Food and Energy*
Class II FOMC - Restricted (FR) I-24
Cla
ss II
FO
MC
Janu
ary
20, 2
010
Res
trict
ed (F
R)
Cha
nges
in G
DP
, Pri
ces,
and
Une
mpl
oym
ent
(Per
cent
, ann
ual r
ate
exce
pt a
s not
ed)
Nom
inal
GD
P
R
eal G
DP
PC
E pr
ice
inde
x
Cor
e PC
E pr
ice
inde
x U
nem
ploy
men
t rat
e1
Inte
rval
12/0
9/09
01/2
0/10
12/0
9/09
01/2
0/10
12/0
9/09
01/2
0/10
12/0
9/09
01/2
0/10
12/0
9/09
01/2
0/10
Qua
rter
ly20
09:Q
1-4
.6-4
.6-6
.4-6
.4-1
.5-1
.51.
11.
18.
18.
2
Q2
-.8-.8
-.7-.7
1.4
1.4
2.0
2.0
9.2
9.3
Q
33.
02.
62.
52.
22.
72.
61.
31.
29.
69.
7
Q4
4.6
6.2
3.8
5.3
2.8
2.9
1.6
1.6
10.1
10.0
2010
:Q1
5.0
4.7
3.6
2.8
1.1
2.0
1.3
1.2
10.1
10.1
Q
25.
15.
03.
53.
81.
61.
21.
21.
29.
99.
9
Q3
4.9
5.1
3.6
3.9
1.4
1.3
1.1
1.1
9.8
9.7
Q
45.
05.
13.
84.
01.
31.
31.
11.
19.
69.
520
11:Q
15.
55.
64.
24.
31.
31.
21.
11.
19.
29.
1
Q2
5.7
5.9
4.5
4.7
1.2
1.1
1.1
1.1
9.0
8.9
Q
35.
85.
94.
64.
91.
11.
11.
11.
18.
78.
6
Q4
5.8
6.0
4.7
5.0
1.1
1.1
1.1
1.0
8.3
8.2
Tw
o-qu
arte
r2
2009
:Q2
-2.7
-2.7
-3.6
-3.6
-.1-.1
1.6
1.6
2.3
2.4
Q
43.
84.
43.
13.
82.
72.
71.
41.
4.9
.720
10:Q
25.
04.
83.
53.
31.
41.
61.
21.
2-.2
-.1
Q4
5.0
5.1
3.7
3.9
1.3
1.3
1.1
1.1
-.3-.4
2011
:Q2
5.6
5.7
4.3
4.5
1.2
1.2
1.1
1.1
-.6-.6
Q
45.
86.
04.
74.
91.
11.
11.
11.
0-.7
-.7
Fou
r-qu
arte
r3
2008
:Q4
.1.1
-1.9
-1.9
1.7
1.7
2.0
2.0
2.1
2.1
2009
:Q4
.5.8
-.3.0
1.3
1.3
1.5
1.5
3.2
3.1
2010
:Q4
5.0
5.0
3.6
3.6
1.3
1.4
1.2
1.2
-.5-.5
2011
:Q4
5.7
5.8
4.5
4.7
1.2
1.1
1.1
1.1
-1.3
-1.3
Ann
ual
2008
2.6
2.6
.4.4
3.3
3.3
2.4
2.4
5.8
5.8
2009
-1.3
-1.3
-2.5
-2.5
.2.2
1.5
1.5
9.3
9.3
2010
4.3
4.5
3.2
3.4
1.8
1.9
1.3
1.3
9.8
9.8
2011
5.4
5.5
4.2
4.4
1.3
1.2
1.1
1.1
8.8
8.7
1. L
evel
, exc
ept f
or tw
o-qu
arte
r and
four
-qua
rter i
nter
vals
. 2
. Per
cent
cha
nge
from
two
quar
ters
ear
lier;
for u
nem
ploy
men
t rat
e, c
hang
e is
in p
erce
ntag
e po
ints
. 3
. Per
cent
cha
nge
from
four
qua
rters
ear
lier;
for u
nem
ploy
men
t rat
e, c
hang
e is
in p
erce
ntag
e po
ints
.
I-25
Cla
ss II
FO
MC
Janu
ary
20, 2
010
Res
trict
ed (F
R)
Cha
nges
in R
eal G
ross
Dom
esti
c P
rodu
ct a
nd R
elat
ed I
tem
s(P
erce
nt, a
nnua
l rat
e ex
cept
as n
oted
)
200
9
201
0
2011
Item
Q1
Q2
Q3
Q4
Q1
Q2
Q3
Q4
Q1
Q2
Q3
Q4
2009
1 20
101
2011
1
Rea
l GD
P
-6
.4-.7
2.2
5.3
2.
83.
83.
94.
0
4.3
4.7
4.9
5.0
.0
3.6
4.7
Pre
viou
s G
reen
book
-6.4
-.72.
53.
8
3.6
3.5
3.6
3.8
4.
24.
54.
64.
7
-.33.
64.
5
Fina
l sal
es
-4
.1.7
1.5
1.5
2.
53.
43.
13.
7
3.9
4.4
4.4
4.8
-.1
3.2
4.4
Pre
viou
s G
reen
book
-4.1
.71.
71.
5
2.6
2.9
2.9
3.3
3.
64.
14.
24.
2
-.12.
94.
0Pr
iv. d
om. f
inal
pur
ch.
-7.2
-2.7
2.2
1.9
2.
53.
73.
64.
0
4.7
5.1
5.4
5.4
-1
.63.
45.
1P
revi
ous
Gre
enbo
ok
-7.2
-2.7
2.4
1.2
2.
63.
03.
43.
7
4.3
4.8
5.0
4.9
-1
.73.
24.
8
Pers
onal
con
s. ex
pend
.
.6
-.92.
82.
1
2.7
2.7
2.9
2.9
3.
33.
63.
94.
0
1.1
2.8
3.7
Pre
viou
s G
reen
book
.6-.9
3.0
1.9
2.
72.
42.
62.
6
3.0
3.4
3.7
3.6
1.
12.
63.
4D
urab
les
3.9
-5.6
20.4
1.0
9.
49.
710
.59.
8
10.0
12.1
12.0
13.2
4.
59.
911
.8N
ondu
rabl
es
1.
9-1
.91.
54.
1
1.8
2.7
2.8
2.9
3.
13.
53.
53.
6
1.4
2.6
3.4
Serv
ices
-.3.2
.81.
6
2.1
1.7
1.8
1.8
2.
32.
42.
72.
7
.61.
82.
5
Res
iden
tial i
nves
tmen
t
-3
8.2
-23.
318
.94.
0
1.3
13.1
-4.0
12.3
19
.228
.527
.824
.1
-12.
55.
424
.8P
revi
ous
Gre
enbo
ok
-3
8.2
-23.
318
.98.
1
8.7
17.8
4.3
9.1
15
.423
.022
.020
.7
-11.
69.
920
.2
Bus
ines
s fix
ed in
vest
.
-3
9.2
-9.6
-5.9
-.5
.98.
411
.510
.7
11.5
10.4
10.3
10.0
-1
5.3
7.8
10.6
Pre
viou
s G
reen
book
-39.
2-9
.6-5
.5-5
.8
.14.
09.
710
.9
11.5
10.7
10.5
9.9
-1
6.4
6.1
10.7
Equi
pmen
t & so
ftwar
e
-3
6.4
-4.9
1.5
12.4
8.
413
.215
.714
.4
15.3
14.4
14.3
13.7
-8
.812
.914
.4P
revi
ous
Gre
enbo
ok
-36.
4-4
.92.
45.
9
5.5
8.1
14.8
14.8
15
.114
.814
.613
.8
-10.
010
.714
.6N
onre
s. st
ruct
ures
-43.
6-1
7.3
-18.
4-2
2.4
-1
3.8
-1.8
2.0
2.2
2.
6.9
.5.3
-2
6.3
-3.1
1.1
Pre
viou
s G
reen
book
-4
3.6
-17.
3-1
8.9
-25.
8
-10.
7-4
.8-1
.42.
0
3.0
1.0
.4.1
-2
7.2
-3.8
1.1
Net
exp
orts
2
-3
86-3
30-3
57-3
49
-363
-368
-374
-369
-3
75-3
78-3
85-3
81
-356
-368
-380
Pre
viou
s G
reen
book
2
-386
-330
-358
-345
-3
57-3
57-3
58-3
52
-356
-357
-360
-356
-3
55-3
56-3
57Ex
ports
-29.
9-4
.117
.817
.3
9.8
8.8
9.4
10.0
9.
79.
39.
39.
1
-1.9
9.5
9.3
Impo
rts
-3
6.4
-14.
721
.311
.8
11.0
8.2
9.0
7.0
9.
28.
29.
16.
6
-7.4
8.8
8.3
Gov
’t. c
ons.
& in
vest
.
-2
.66.
72.
6-1
.2
4.4
2.7
1.7
1.2
1.
31.
31.
21.
2
1.3
2.5
1.3
Pre
viou
s G
reen
book
-2.6
6.7
2.8
.6
4.1
2.2
.9.6
1.
01.
01.
0.5
1.
81.
9.9
Fede
ral
-4.3
11.4
8.0
-2.7
10
.65.
01.
8.1
1.
01.
01.
01.
0
2.9
4.3
1.0
Def
ense
-5.1
14.0
8.4
-7.8
10
.63.
42.
92.
0
.3.3
.3.1
1.
94.
7.2
Non
defe
nse
-2.5
6.1
7.0
9.2
10
.78.
3-.2
-3.7
2.
62.
62.
62.
6
4.8
3.6
2.6
Stat
e &
loca
l
-1
.53.
9-.6
-.2
.51.
11.
61.
9
1.5
1.5
1.3
1.4
.3
1.3
1.4
Cha
nge
in b
us. i
nven
torie
s2
-1
14-1
60-1
39-2
4
-16
-222
32
4556
7179
-1
099
63P
revi
ous
Gre
enbo
ok2
-114
-160
-137
-66
-3
4-1
57
24
4255
6985
-1
19-5
63N
onfa
rm2
-115
-163
-141
-24
-2
0-6
1929
42
5470
77
-111
561
Farm
2
0
22
0
43
33
3
33
3
13
3
1. C
hang
e fr
om fo
urth
qua
rter o
f pre
viou
s yea
r to
four
th q
uarte
r of y
ear i
ndic
ated
. 2
. Bill
ions
of c
hain
ed (2
005)
dol
lars
.
I-26
Class II FOMC
January 20, 2010
Restricted (F
R)
Cha
nges
in R
eal G
ross
Dom
esti
c P
rodu
ct a
nd R
elat
ed I
tem
s (Change from
fourth quarter of previous y
ear to fourth quarter of year indicated, unless o
therwise noted)
Item
2003
2004
2005
2006
2007
2008
2009
2010
2011
Real G
DP
Pre
viou
s G
reen
book
Final sales
Pre
viou
s G
reen
book
Priv. dom
. final purch.
Pre
viou
s G
reen
book
Personal cons. expend.
Pre
viou
s G
reen
book
Durables
Nondurables
Services
Residential investment
Pre
viou
s G
reen
book
Business fixed invest.
Pre
viou
s G
reen
book
Equipm
ent &
softw
are
Pre
viou
s G
reen
book
Nonres. structures
Pre
viou
s G
reen
book
Net exports1
Pre
viou
s G
reen
book
1
Exports
Imports
Gov’t. cons. & invest.
Pre
viou
s G
reen
book
Federal
Defense
Nondefense
State & local
Change in bus. inventories1
Pre
viou
s G
reen
book
1
Nonfarm
1
Farm
1
3.8
3.1
2.7
2.4
2.5
-1.9
.0
3.6
4.7
3.8
3.1
2.7
2.4
2.5
-1.9
-.3
3.6
4.5
3.8
2.8
2.7
2.8
2.7
-1.4
-.1
3.2
4.4
3.8
2.8
2.7
2.8
2.7
-1.4
-.1
2.9
4.0
4.2
4.2
3.1
2.5
1.4
-3.2
-1.6
3.4
5.1
4.2
4.2
3.1
2.5
1.4
-3.2
-1.7
3.2
4.8
3.4
3.5
2.7
3.3
2.0
-1.8
1.1
2.8
3.7
3.4
3.5
2.7
3.3
2.0
-1.8
1.1
2.6
3.4
8.9
5.5
2.1
6.3
4.6
-11.8
4.5
9.9
11.8
3.9
3.0
3.3
3.2
1.5
-2.9
1.4
2.6
3.4
2.2
3.4
2.6
2.8
1.7
.3
.6
1.8
2.5
11.5
6.6
5.3
-15.7
-20.5
-21.0
-12.5
5.4
24.8
11.5
6.6
5.3
-15.7
-20.5
-21.0
-11.6
9.9
20.2
5.9
7.0
4.4
7.8
7.9
-6.0
-15.3
7.8
10.6
5.9
7.0
4.4
7.8
7.9
-6.0
-16.4
6.1
10.7
7.5
8.8
6.1
6.0
3.2
-10.7
-8.8
12.9
14.4
7.5
8.8
6.1
6.0
3.2
-10.7
-10.0
10.7
14.6
1.3
1.7
-.1
13.0
18.9
3.2
-26.3
-3.1
1.1
1.3
1.7
-.1
13.0
18.9
3.2
-27.2
-3.8
1.1
-604
-688
-723
-729
-648
-494
-356
-368
-380
-604
-688
-723
-729
-648
-494
-355
-356
-357
6.2
7.1
6.7
10.2
10.2
-3.4
-1.9
9.5
9.3
5.1
10.9
5.2
4.1
.9
-6.8
-7.4
8.8
8.3
1.6
.6
.7
1.5
2.5
3.0
1.3
2.5
1.3
1.6
.6
.7
1.5
2.5
3.0
1.8
1.9
.9
5.7
2.3
1.2
2.2
3.4
8.9
2.9
4.3
1.0
8.4
2.4
.4
4.4
2.6
9.5
1.9
4.7
.2
.7
2.3
2.6
-2.3
5.2
7.5
4.8
3.6
2.6
-.5
-.4
.4
1.2
1.9
-.3
.3
1.3
1.4
17
66
50
59
19
-26
-109
9 63
17
66
50
59
19
-26
-119
-5
63
17
58
50
63
20
-20
-111
5 61
0 8
0 -4
-1
-5
1 3
3
1. B
illions of chained (2005) dollars.
I-27
Cla
ss II
FO
MC
Janu
ary
20, 2
010
Res
trict
ed (F
R)
Con
trib
utio
ns t
o C
hang
es in
Rea
l Gro
ss D
omes
tic
Pro
duct
(Per
cent
age
poin
ts, a
nnua
l rat
e ex
cept
as n
oted
)
20
09
2
010
201
1
Item
Q1
Q2
Q3
Q4
Q1
Q2
Q3
Q4
Q1
Q2
Q3
Q4
2009
1 20
101
2011
1
Rea
l GD
P
-6
.4-.7
2.2
5.3
2.
83.
83.
94.
0
4.3
4.7
4.9
5.0
.0
3.6
4.7
Pre
viou
s G
reen
book
-6.4
-.72.
53.
8
3.6
3.5
3.6
3.8
4.
24.
54.
64.
7
-.33.
64.
5
Fina
l sal
es
-4
.1.7
1.5
1.6
2.
53.
43.
13.
7
3.9
4.4
4.4
4.8
-.1
3.2
4.4
Pre
viou
s G
reen
book
-4.1
.71.
71.
5
2.6
2.9
2.9
3.3
3.
64.
14.
24.
2
-.12.
94.
0Pr
iv. d
om. f
inal
pur
ch.
-6.1
-2.3
1.8
1.6
2.
13.
03.
03.
3
3.8
4.2
4.4
4.4
-1
.32.
84.
2P
revi
ous
Gre
enbo
ok
-6.1
-2.3
2.0
1.0
2.
22.
52.
83.
1
3.5
3.9
4.1
4.0
-1
.42.
63.
9
Pers
onal
con
s. ex
pend
.
.4
-.62.
01.
6
1.9
2.0
2.1
2.0
2.
32.
62.
82.
8
.82.
02.
6P
revi
ous
Gre
enbo
ok
.4
-.62.
11.
4
1.9
1.7
1.8
1.9
2.
12.
42.
62.
5
.81.
82.
4D
urab
les
.3-.4
1.4
.1
.7.7
.8.7
.7
.9.9
1.0
.3
.7.9
Non
dura
bles
.3-.3
.2.6
.3
.4.5
.5
.5.6
.6.6
.2
.4.5
Serv
ices
-.1.1
.4.8
1.
0.8
.9.9
1.
11.
11.
31.
3
.3.9
1.2
Res
iden
tial i
nves
tmen
t
-1
.3-.7
.4.1
.0
.3-.1
.3
.5.7
.7.6
-.4
.1.6
Pre
viou
s G
reen
book
-1.3
-.7.4
.2
.2.4
.1.2
.4
.6.6
.6
-.3.2
.5
Bus
ines
s fix
ed in
vest
.
-5
.3-1
.0-.6
.0
.1.8
1.0
1.0
1.
11.
01.
01.
0
-1.7
.71.
0P
revi
ous
Gre
enbo
ok
-5
.3-1
.0-.6
-.6
.0.4
.91.
0
1.0
1.0
1.0
.9
-1.8
.61.
0Eq
uipm
ent &
softw
are
-3.0
-.3.1
.8
.5.8
1.0
.9
1.0
1.0
1.0
.9
-.6.8
1.0
Pre
viou
s G
reen
book
-3
.0-.3
.2.4
.3
.5.9
.9
1.0
1.0
1.0
.9
-.7.7
1.0
Non
res.
stru
ctur
es
-2
.3-.7
-.7-.8
-.4
.0.1
.1
.1.0
.0.0
-1
.1-.1
.0P
revi
ous
Gre
enbo
ok
-2.3
-.7-.7
-.9
-.3-.1
.0.1
.1
.0.0
.0
-1.1
-.1.0
Net
exp
orts
2.6
1.7
-.8.2
-.5
-.2-.2
.1
-.2-.1
-.3.1
1.
0-.2
-.1P
revi
ous
Gre
enbo
ok
2.
61.
7-.9
.4
-.4.0
-.1.1
-.2
.0-.1
.1
1.0
-.1-.1
Expo
rts
-4
.0-.5
1.8
1.8
1.
11.
01.
11.
2
1.2
1.1
1.1
1.1
-.2
1.1
1.1
Impo
rts
6.
62.
1-2
.6-1
.6
-1.6
-1.2
-1.3
-1.0
-1
.4-1
.2-1
.4-1
.0
1.2
-1.3
-1.3
Gov
’t. c
ons.
& in
vest
.
-.5
1.3
.6-.2
.9
.6.4
.3
.3.3
.3.3
.3
.5.3
Pre
viou
s G
reen
book
-.51.
3.6
.1
.8.5
.2.1
.2
.2.2
.1
.4.4
.2Fe
dera
l
-.3
.9.6
-.2
.8.4
.2.0
.1
.1.1
.1
.2.3
.1D
efen
se
-.3
.7.5
-.4
.6.2
.2.1
.0
.0.0
.0
.1.3
.0N
onde
fens
e
-.1
.2.2
.2
.3.2
.0-.1
.1
.1.1
.1
.1.1
.1St
ate
& lo
cal
-.2.5
-.1.0
.1
.1.2
.2
.2.2
.2.2
.0
.2.2
Cha
nge
in b
us. i
nven
torie
s
-2
.4-1
.4.7
3.7
.3
.4.8
.3
.4.4
.5.2
.1
.4.4
Pre
viou
s G
reen
book
-2.4
-1.4
.72.
3
1.0
.6.7
.5
.6.4
.4.5
-.2
.7.5
Non
farm
-2.4
-1.5
.73.
7
.1.5
.8.3
.4
.4.5
.2
.1.4
.4Fa
rm
.1
.1.0
.0
.1.0
.0.0
.0
.0.0
.0
.0.0
.0
1. C
hang
e fr
om fo
urth
qua
rter o
f pre
viou
s yea
r to
four
th q
uarte
r of y
ear i
ndic
ated
.
I-28
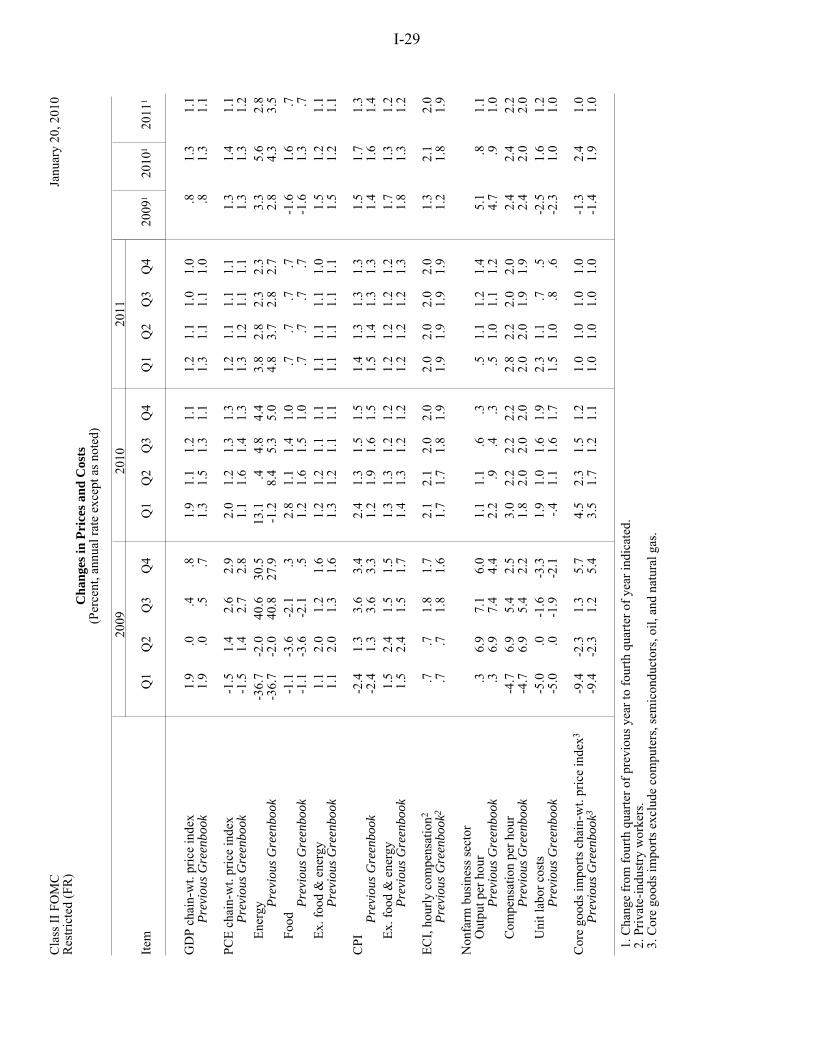
Class II FOMC
January 20, 2010
Restricted (F
R)
Cha
nges
in P
rice
s an
d C
osts
(Percent, annual rate except as n
oted)
Item
2009
2010
2011
2009
1 2010
1 2011
1Q1
Q2
Q3
Q4
Q1
Q2
Q3
Q4
Q1
Q2
Q3
Q4
GDP chain-wt. price index
Pre
viou
s G
reen
book
PCE chain-wt. price index
Pre
viou
s G
reen
book
Energy Pre
viou
s G
reen
book
Food P
revi
ous
Gre
enbo
ok
Ex. food & energy
Pre
viou
s G
reen
book
CPI
Pre
viou
s G
reen
book
Ex. food & energy
Pre
viou
s G
reen
book
ECI, hourly com
pensation2
Pre
viou
s G
reen
book
2
Nonfarm business sector
Output per hour
Pre
viou
s G
reen
book
Com
pensation per hour
Pre
viou
s G
reen
book
Unit labor costs
Pre
viou
s G
reen
book
Core goods imports chain-wt. price index3
Pre
viou
s G
reen
book
3
1.9
.0
.4
.8
1.9
.0
.5
.7
-1.5
1.4
2.6
2.9
-1.5
1.4
2.7
2.8
-36.7
-2.0
40.6
30.5
-36.7
-2.0
40.8
27.9
-1.1
-3.6
-2.1
.3
-1.1
-3.6
-2.1
.5
1.1
2.0
1.2
1.6
1.1
2.0
1.3
1.6
-2.4
1.3
3.6
3.4
-2.4
1.3
3.6
3.3
1.5
2.4
1.5
1.5
1.5
2.4
1.5
1.7
.7
.7
1.8
1.7
.7
.7
1.8
1.6
.3
6.9
7.1
6.0
.3
6.9
7.4
4.4
-4.7
6.9
5.4
2.5
-4.7
6.9
5.4
2.2
-5.0
.0
-1.6
-3.3
-5.0
.0
-1.9
-2.1
-9.4
-2.3
1.3
5.7
-9.4
-2.3
1.2
5.4
1.9
1.1
1.2
1.1
1.3
1.5
1.3
1.1
2.0
1.2
1.3
1.3
1.1
1.6
1.4
1.3
13.1
.4
4.8
4.4
-1.2
8.4
5.3
5.0
2.8
1.1
1.4
1.0
1.2
1.6
1.5
1.0
1.2
1.2
1.1
1.1
1.3
1.2
1.1
1.1
2.4
1.3
1.5
1.5
1.2
1.9
1.6
1.5
1.3
1.3
1.2
1.2
1.4
1.3
1.2
1.2
2.1
2.1
2.0
2.0
1.7
1.7
1.8
1.9
1.1
1.1
.6
.3
2.2
.9
.4
.3
3.0
2.2
2.2
2.2
1.8
2.0
2.0
2.0
1.9
1.0
1.6
1.9
-.4
1.1
1.6
1.7
4.5
2.3
1.5
1.2
3.5
1.7
1.2
1.1
1.2
1.1
1.0
1.0
1.3
1.1
1.1
1.0
1.2
1.1
1.1
1.1
1.3
1.2
1.1
1.1
3.8
2.8
2.3
2.3
4.8
3.7
2.8
2.7
.7
.7
.7
.7
.7
.7
.7
.7
1.1
1.1
1.1
1.0
1.1
1.1
1.1
1.1
1.4
1.3
1.3
1.3
1.5
1.4
1.3
1.3
1.2
1.2
1.2
1.2
1.2
1.2
1.2
1.3
2.0
2.0
2.0
2.0
1.9
1.9
1.9
1.9
.5
1.1
1.2
1.4
.5
1.0
1.1
1.2
2.8
2.2
2.0
2.0
2.0
2.0
1.9
1.9
2.3
1.1
.7
.5
1.5
1.0
.8
.6
1.0
1.0
1.0
1.0
1.0
1.0
1.0
1.0
.8
1.3
1.1
.8
1.3
1.1
1.3
1.4
1.1
1.3
1.3
1.2
3.3
5.6
2.8
2.8
4.3
3.5
-1.6
1.6
.7
-1.6
1.3
.7
1.5
1.2
1.1
1.5
1.2
1.1
1.5
1.7
1.3
1.4
1.6
1.4
1.7
1.3
1.2
1.8
1.3
1.2
1.3
2.1
2.0
1.2
1.8
1.9
5.1
.8
1.1
4.7
.9
1.0
2.4
2.4
2.2
2.4
2.0
2.0
-2.5
1.6
1.2
-2.3
1.0
1.0
-1.3
2.4
1.0
-1.4
1.9
1.0
1. C
hange from
fourth quarter of previous y
ear to fourth quarter of year indicated.
2. Private-industry workers.
3. Core goods imports exclude com
puters, sem
iconductors, oil, and natural gas.
I-29
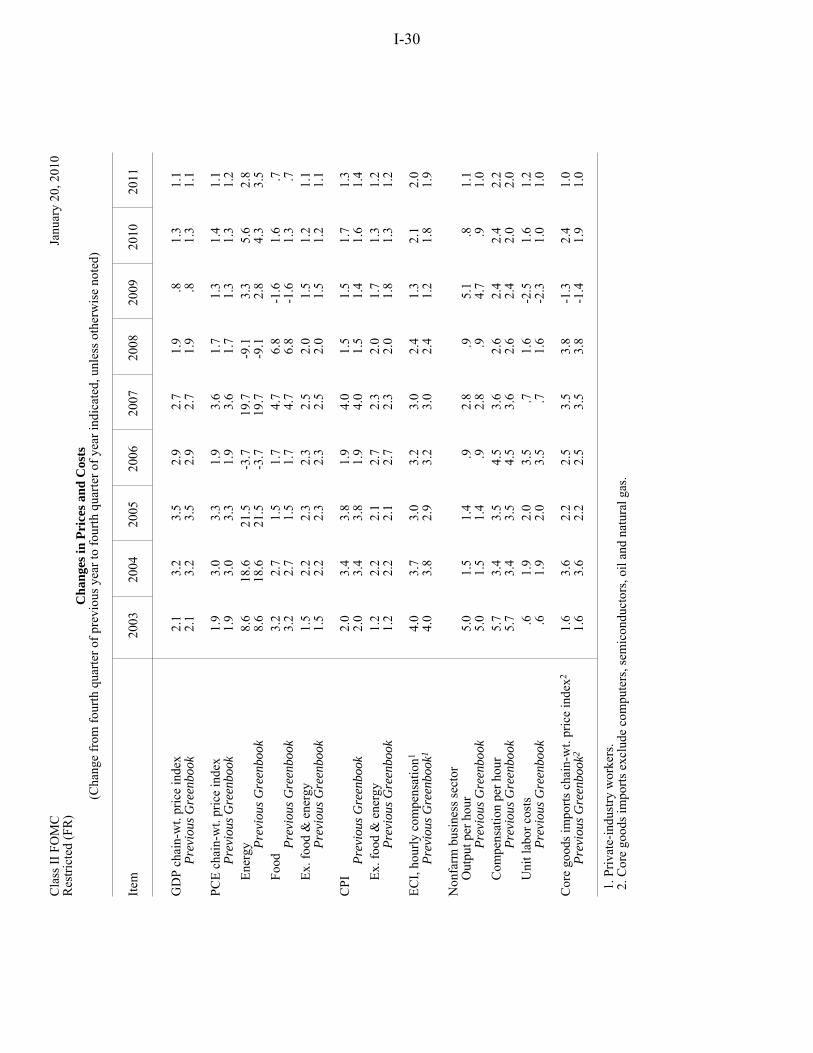
Class II FOMC
January 20, 2010
Restricted (F
R)
Cha
nges
in P
rice
s an
d C
osts
(Change from
fourth quarter of previous y
ear to fourth quarter of year indicated, unless o
therwise noted)
Item
2003
2004
2005
2006
2007
2008
2009
2010
2011
GDP chain-wt. price index
Pre
viou
s G
reen
book
PCE chain-wt. price index
Pre
viou
s G
reen
book
Energy Pre
viou
s G
reen
book
Food P
revi
ous
Gre
enbo
ok
Ex. food & energy
Pre
viou
s G
reen
book
CPI
Pre
viou
s G
reen
book
Ex. food & energy
Pre
viou
s G
reen
book
ECI, hourly com
pensation1
Pre
viou
s G
reen
book
1
Nonfarm business sector
Output per hour
Pre
viou
s G
reen
book
Com
pensation per hour
Pre
viou
s G
reen
book
Unit labor costs
Pre
viou
s G
reen
book
Core goods imports chain-wt. price index2
Pre
viou
s G
reen
book
2
2.1
3.2
3.5
2.9
2.7
1.9
.8
1.3
1.1
2.1
3.2
3.5
2.9
2.7
1.9
.8
1.3
1.1
1.9
3.0
3.3
1.9
3.6
1.7
1.3
1.4
1.1
1.9
3.0
3.3
1.9
3.6
1.7
1.3
1.3
1.2
8.6
18.6
21.5
-3.7
19.7
-9.1
3.3
5.6
2.8
8.6
18.6
21.5
-3.7
19.7
-9.1
2.8
4.3
3.5
3.2
2.7
1.5
1.7
4.7
6.8
-1.6
1.6
.7
3.2
2.7
1.5
1.7
4.7
6.8
-1.6
1.3
.7
1.5
2.2
2.3
2.3
2.5
2.0
1.5
1.2
1.1
1.5
2.2
2.3
2.3
2.5
2.0
1.5
1.2
1.1
2.0
3.4
3.8
1.9
4.0
1.5
1.5
1.7
1.3
2.0
3.4
3.8
1.9
4.0
1.5
1.4
1.6
1.4
1.2
2.2
2.1
2.7
2.3
2.0
1.7
1.3
1.2
1.2
2.2
2.1
2.7
2.3
2.0
1.8
1.3
1.2
4.0
3.7
3.0
3.2
3.0
2.4
1.3
2.1
2.0
4.0
3.8
2.9
3.2
3.0
2.4
1.2
1.8
1.9
5.0
1.5
1.4
.9
2.8
.9
5.1
.8
1.1
5.0
1.5
1.4
.9
2.8
.9
4.7
.9
1.0
5.7
3.4
3.5
4.5
3.6
2.6
2.4
2.4
2.2
5.7
3.4
3.5
4.5
3.6
2.6
2.4
2.0
2.0
.6
1.9
2.0
3.5
.7
1.6
-2.5
1.6
1.2
.6
1.9
2.0
3.5
.7
1.6
-2.3
1.0
1.0
1.6
3.6
2.2
2.5
3.5
3.8
-1.3
2.4
1.0
1.6
3.6
2.2
2.5
3.5
3.8
-1.4
1.9
1.0
1. Private-industry workers.
2. Core goods imports exclude com
puters, sem
iconductors, oil and natural gas.
I-30
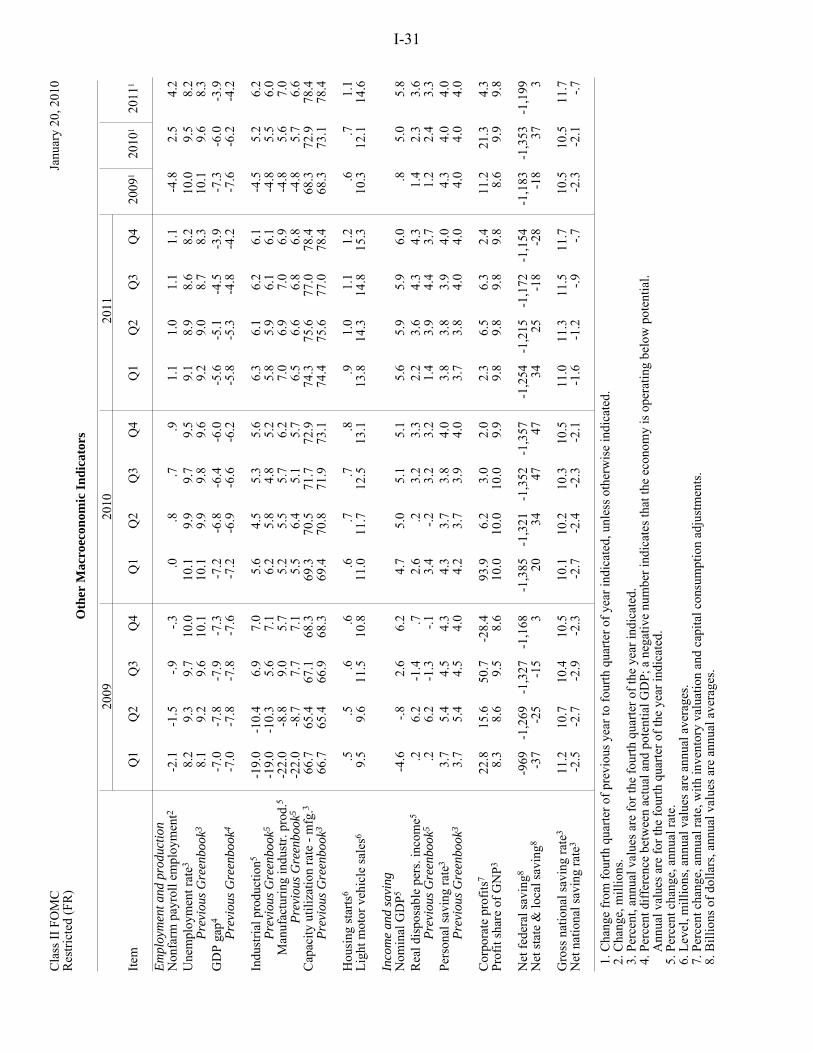
Class II FOMC
January 20, 2010
Restricted (F
R)
Oth
er M
acro
econ
omic
Ind
icat
ors
Item
2009
2010
2011
2009
1 2010
1 2011
1Q1
Q2
Q3
Q4
Q1
Q2
Q3
Q4
Q1
Q2
Q3
Q4
Em
ploy
men
t and
pro
duct
ion
Nonfarm payroll em
ployment2
Unemployment rate3
Pre
viou
s G
reen
book
3
GDP gap4
Pre
viou
s G
reen
book
4
Industrial production5
Pre
viou
s G
reen
book
5
Manufacturing industr. prod.5
Pre
viou
s G
reen
book
5
Capacity utilization rate - mfg.3
Pre
viou
s G
reen
book
3
Housing starts6
Light m
otor vehicle sales6
Inco
me
and
savi
ng
Nom
inal GDP5
Real disposable pers. incom
e5
Pre
viou
s G
reen
book
5
Personal saving rate3
Pre
viou
s G
reen
book
3
Corporate profits7
Profit share of GNP3
Net federal saving8
Net state & local saving8
Gross national saving rate3
Net national saving rate3
-2.1
-1.5
-.9
-.3
8.2
9.3
9.7
10.0
8.1
9.2
9.6
10.1
-7.0
-7.8
-7.9
-7.3
-7.0
-7.8
-7.8
-7.6
-19.0
-10.4
6.9
7.0
-19.0
-10.3
5.6
7.1
-22.0
-8.8
9.0
5.7
-22.0
-8.7
7.7
7.1
66.7
65.4
67.1
68.3
66.7
65.4
66.9
68.3
.5
.5
.6
.6
9.5
9.6
11.5
10.8
-4.6
-.8
2.6
6.2
.2
6.2
-1.4
.7
.2
6.2
-1.3
-.1
3.7
5.4
4.5
4.3
3.7
5.4
4.5
4.0
22.8
15.6
50.7
-28.4
8.3
8.6
9.5
8.6
-969 -1,269 -1,327 -1,168
-37
-25
-15
3
11.2
10.7
10.4
10.5
-2.5
-2.7
-2.9
-2.3
.0
.8
.7
.9
10.1
9.9
9.7
9.5
10.1
9.9
9.8
9.6
-7.2
-6.8
-6.4
-6.0
-7.2
-6.9
-6.6
-6.2
5.6
4.5
5.3
5.6
6.2
5.8
4.8
5.2
5.2
5.5
5.7
6.2
5.5
6.4
5.1
5.7
69.3
70.5
71.7
72.9
69.4
70.8
71.9
73.1
.6
.7
.7
.8
11.0
11.7
12.5
13.1
4.7
5.0
5.1
5.1
2.6
.2
3.2
3.3
3.4
-.2
3.2
3.2
4.3
3.7
3.8
4.0
4.2
3.7
3.9
4.0
93.9
6.2
3.0
2.0
10.0
10.0
10.0
9.9
-1,385 -1,321 -1,352 -1,357
20
34
47
47
10.1
10.2
10.3
10.5
-2.7
-2.4
-2.3
-2.1
1.1
1.0
1.1
1.1
9.1
8.9
8.6
8.2
9.2
9.0
8.7
8.3
-5.6
-5.1
-4.5
-3.9
-5.8
-5.3
-4.8
-4.2
6.3
6.1
6.2
6.1
5.8
5.9
6.1
6.1
7.0
6.9
7.0
6.9
6.5
6.6
6.8
6.8
74.3
75.6
77.0
78.4
74.4
75.6
77.0
78.4
.9
1.0
1.1
1.2
13.8
14.3
14.8
15.3
5.6
5.9
5.9
6.0
2.2
3.6
4.3
4.3
1.4
3.9
4.4
3.7
3.8
3.8
3.9
4.0
3.7
3.8
4.0
4.0
2.3
6.5
6.3
2.4
9.8
9.8
9.8
9.8
-1,254 -1,215 -1,172 -1,154
34
25
-18
-28
11.0
11.3
11.5
11.7
-1.6
-1.2
-.9
-.7
-4.8
2.5
4.2
10.0
9.5
8.2
10.1
9.6
8.3
-7.3
-6.0
-3.9
-7.6
-6.2
-4.2
-4.5
5.2
6.2
-4.8
5.5
6.0
-4.8
5.6
7.0
-4.8
5.7
6.6
68.3
72.9
78.4
68.3
73.1
78.4
.6
.7
1.1
10.3
12.1
14.6
.8
5.0
5.8
1.4
2.3
3.6
1.2
2.4
3.3
4.3
4.0
4.0
4.0
4.0
4.0
11.2
21.3
4.3
8.6
9.9
9.8
-1,183 -1,353 -1,199
-18
37
3
10.5
10.5
11.7
-2.3
-2.1
-.7
1. C
hange from
fourth quarter of previous y
ear to fourth quarter of year indicated, unless o
therwise indicated.
2. Change, millions.
3. Percent, annual values are for the fourth quarter of the year indicated.
4. Percent difference between actual and potential G
DP; a negative number indicates that the econom
y is operating below potential.
Annual values are for the fourth quarter of the year indicated.
5. Percent change, annual rate.
6. Level, m
illions, annual values are annual averages.
7. Percent change, annual rate, with inventory valuation and capital consumption adjustments.
8. Billions of dollars, annual values are annual averages.
I-31
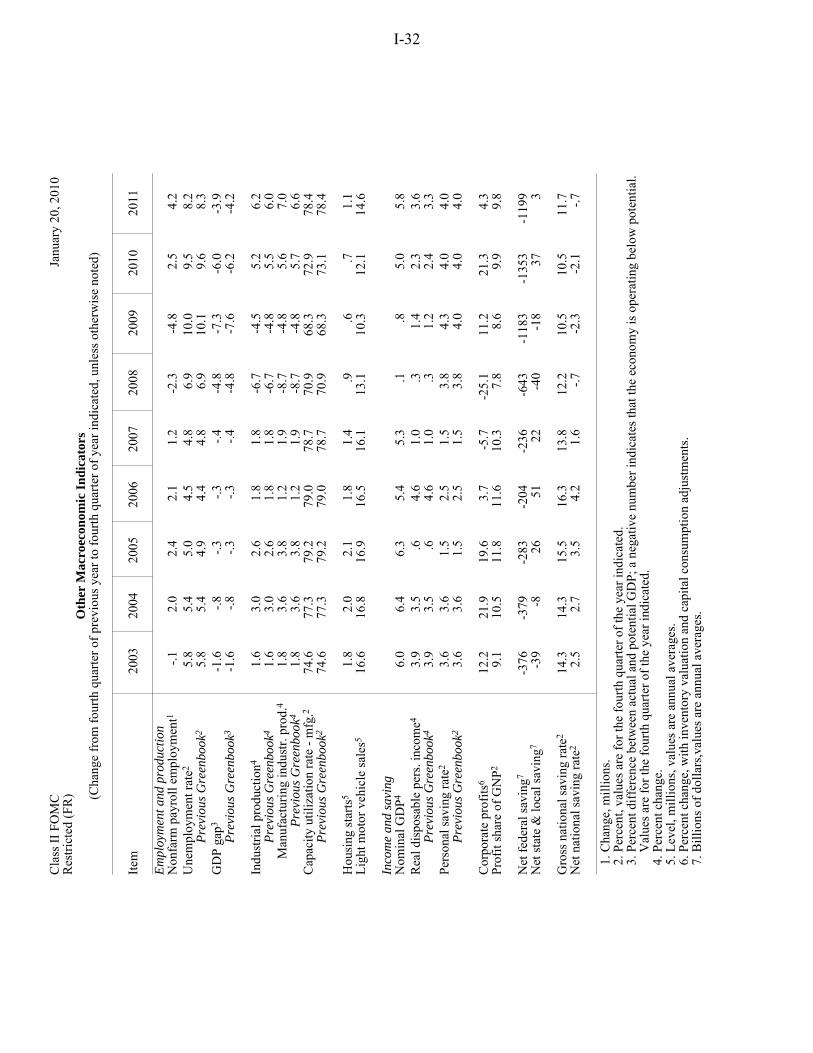
Class II FOMC
January 20, 2010
Restricted (F
R)
Oth
er M
acro
econ
omic
Ind
icat
ors
(Change from
fourth quarter of previous y
ear to fourth quarter of year indicated, unless o
therwise noted)
Item
2003
2004
2005
2006
2007
2008
2009
2010
2011
Em
ploy
men
t and
pro
duct
ion
Nonfarm payroll em
ployment1
Unemployment rate2
Pre
viou
s G
reen
book
2
GDP gap3
Pre
viou
s G
reen
book
3
Industrial production4
Pre
viou
s G
reen
book
4
Manufacturing industr. prod.4
Pre
viou
s G
reen
book
4
Capacity utilization rate - mfg.2
Pre
viou
s G
reen
book
2
Housing starts5
Light m
otor vehicle sales5
Inco
me
and
savi
ng
Nom
inal GDP4
Real disposable pers. incom
e4
Pre
viou
s G
reen
book
4
Personal saving rate2
Pre
viou
s G
reen
book
2
Corporate profits6
Profit share of GNP2
Net federal saving7
Net state & local saving7
Gross national saving rate2
Net national saving rate2
-.1
2.0
2.4
2.1
1.2
-2.3
-4.8
2.5
4.2
5.8
5.4
5.0
4.5
4.8
6.9
10.0
9.5
8.2
5.8
5.4
4.9
4.4
4.8
6.9
10.1
9.6
8.3
-1.6
-.8
-.3
-.3
-.4
-4.8
-7.3
-6.0
-3.9
-1.6
-.8
-.3
-.3
-.4
-4.8
-7.6
-6.2
-4.2
1.6
3.0
2.6
1.8
1.8
-6.7
-4.5
5.2
6.2
1.6
3.0
2.6
1.8
1.8
-6.7
-4.8
5.5
6.0
1.8
3.6
3.8
1.2
1.9
-8.7
-4.8
5.6
7.0
1.8
3.6
3.8
1.2
1.9
-8.7
-4.8
5.7
6.6
74.6
77.3
79.2
79.0
78.7
70.9
68.3
72.9
78.4
74.6
77.3
79.2
79.0
78.7
70.9
68.3
73.1
78.4
1.8
2.0
2.1
1.8
1.4
.9
.6
.7
1.1
16.6
16.8
16.9
16.5
16.1
13.1
10.3
12.1
14.6
6.0
6.4
6.3
5.4
5.3
.1
.8
5.0
5.8
3.9
3.5
.6
4.6
1.0
.3
1.4
2.3
3.6
3.9
3.5
.6
4.6
1.0
.3
1.2
2.4
3.3
3.6
3.6
1.5
2.5
1.5
3.8
4.3
4.0
4.0
3.6
3.6
1.5
2.5
1.5
3.8
4.0
4.0
4.0
12.2
21.9
19.6
3.7
-5.7
-25.1
11.2
21.3
4.3
9.1
10.5
11.8
11.6
10.3
7.8
8.6
9.9
9.8
-376
-379
-283
-204
-236
-643
-1183
-1353
-1199
-39
-8
26
51
22
-40
-18
37
3
14.3
14.3
15.5
16.3
13.8
12.2
10.5
10.5
11.7
2.5
2.7
3.5
4.2
1.6
-.7
-2.3
-2.1
-.7
1. C
hange, millions.
2. Percent, values are for the fourth quarter of the year indicated.
3. Percent difference between actual and potential G
DP; a negative number indicates that the econom
y is operating below potential.
Values are for the fourth quarter of the year indicated.
4. Percent change.
5. Level, m
illions, values are annual averages.
6. Percent change, with inventory valuation and capital consumption adjustments.
7. Billions of dollars,values are annual averages.
I-32
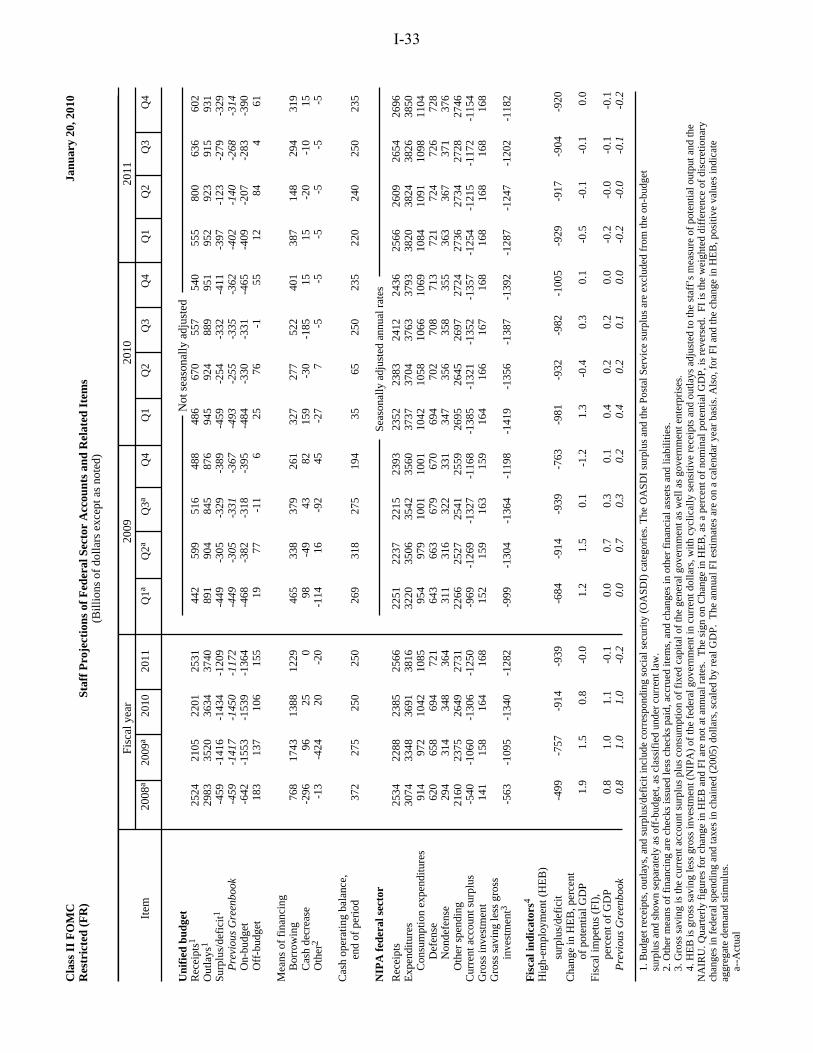
Cla
ss I
I F
OM
CJa
nuar
y 20
, 201
0R
estr
icte
d (F
R)
Staf
f P
roje
ctio
ns o
f F
eder
al S
ecto
r A
ccou
nts
and
Rel
ated
Ite
ms
(Bill
ions
of
dolla
rs e
xcep
t as
note
d)
Fisc
al y
ear
2009
2010
2011
Item
2008
a20
09a
2010
2011
Q1a
Q2a
Q3a
Q4
Q1
Q2
Q3
Q4
Q1
Q2
Q3
Q4
Uni
fied
bud
get
Not
sea
sona
lly a
djus
ted
Rec
eipt
s125
2421
0522
0125
31
442
599
516
488
486
670
557
540
555
800
636
602
Out
lays
129
8335
2036
3437
40
891
904
845
876
945
924
889
951
952
923
915
931
Surp
lus/
defi
cit1
-459
-141
6-1
434
-120
9
-449
-305
-329
-389
-459
-254
-332
-411
-397
-123
-279
-329
P
revi
ous
Gre
enbo
ok
-459
-141
7-1
450
-117
2
-449
-305
-331
-367
-493
-255
-335
-362
-402
-140
-268
-314
O
n-bu
dget
-6
42-1
553
-153
9-1
364
-4
68-3
82-3
18-3
95-4
84-3
30-3
31-4
65-4
09-2
07-2
83-3
90
Off
-bud
get
183
137
106
155
19
77-1
16
2576
-155
1284
461
Mea
ns o
f fi
nanc
ing
B
orro
win
g
768
1743
1388
1229
46
533
837
926
132
727
752
240
138
714
829
431
9
Cas
h de
crea
se
-2
9696
250
98
-49
4382
159
-30
-185
1515
-20
-10
15
Oth
er2
-13
-424
20-2
0
-114
16-9
245
-27
7-5
-5-5
-5-5
-5
Cas
h op
erat
ing
bala
nce,
end
of
peri
od
37
227
525
025
0
269
318
275
194
3565
250
235
220
240
250
235
NIP
A f
eder
al s
ecto
r
Se
ason
ally
adj
uste
d an
nual
rat
es
Rec
eipt
s
25
3422
8823
8525
66
2251
2237
2215
2393
2352
2383
2412
2436
2566
2609
2654
2696
Exp
endi
ture
s
3074
3348
3691
3816
32
2035
0635
4235
6037
3737
0437
6337
9338
2038
2438
2638
50
Con
sum
ptio
n ex
pend
iture
s
914
972
1042
1085
95
497
910
0110
0110
4210
5810
6610
6910
8410
9110
9811
04
D
efen
se
62
065
869
472
1
643
663
679
670
694
702
708
713
721
724
726
728
Non
defe
nse
29
431
434
836
4
311
316
322
331
347
356
358
355
363
367
371
376
O
ther
spe
ndin
g
2160
2375
2649
2731
22
6625
2725
4125
5926
9526
4526
9727
2427
3627
3427
2827
46C
urre
nt a
ccou
nt s
urpl
us
-5
40-1
060
-130
6-1
250
-9
69-1
269
-132
7-1
168
-138
5-1
321
-135
2-1
357
-125
4-1
215
-117
2-1
154
Gro
ss in
vest
men
t
141
158
164
168
15
215
916
315
916
416
616
716
816
816
816
816
8G
ross
sav
ing
less
gro
ss
i
nves
tmen
t3-5
63-1
095
-134
0-1
282
-9
99-1
304
-136
4-1
198
-141
9-1
356
-138
7-1
392
-128
7-1
247
-120
2-1
182
Fis
cal i
ndic
ator
s4H
igh-
empl
oym
ent (
HE
B)
sur
plus
/def
icit
-4
99-7
57-9
14-9
39
-684
-914
-939
-763
-981
-932
-982
-100
5-9
29-9
17-9
04-9
20C
hang
e in
HE
B, p
erce
nt
o
f po
tent
ial G
DP
1.9
1.5
0.8
-0.0
1.
21.
50.
1-1
.21.
3-0
.40.
30.
1-0
.5-0
.1-0
.10.
0Fi
scal
impe
tus
(FI)
,
p
erce
nt o
f G
DP
0.8
1.0
1.1
-0.1
0.
00.
70.
30.
10.
40.
20.
20.
0-0
.2-0
.0-0
.1-0
.1
Pre
viou
s G
reen
book
0.
81.
01.
0-0
.2
0.0
0.7
0.3
0.2
0.4
0.2
0.1
0.0
-0.2
-0.0
-0.1
-0.2
1
. Bud
get r
ecei
pts,
out
lays
, and
sur
plus
/def
icit
incl
ude
corr
espo
ndin
g so
cial
sec
urity
(O
ASD
I) c
ateg
orie
s. T
he O
ASD
I su
rplu
s an
d th
e Po
stal
Ser
vice
sur
plus
are
exc
lude
d fr
om th
e on
-bud
get
s
urpl
us a
nd s
how
n se
para
tely
as
off-
budg
et, a
s cl
assi
fied
und
er c
urre
nt la
w.
2
. Oth
er m
eans
of
fina
ncin
g ar
e ch
ecks
issu
ed le
ss c
heck
s pa
id, a
ccru
ed it
ems,
and
cha
nges
in o
ther
fin
anci
al a
sset
s an
d lia
bilit
ies.
3
. Gro
ss s
avin
g is
the
curr
ent a
ccou
nt s
urpl
us p
lus
cons
umpt
ion
of f
ixed
cap
ital o
f th
e ge
nera
l gov
ernm
ent a
s w
ell a
s go
vern
men
t ent
erpr
ises
.
4. H
EB
is g
ross
sav
ing
less
gro
ss in
vest
men
t (N
IPA
) of
the
fede
ral g
over
nmen
t in
curr
ent d
olla
rs, w
ith c
yclic
ally
sen
sitiv
e re
ceip
ts a
nd o
utla
ys a
djus
ted
to th
e st
aff’
s m
easu
re o
f po
tent
ial o
utpu
t and
the
NA
IRU
. Qua
rter
ly f
igur
es f
or c
hang
e in
HE
B a
nd F
I ar
e no
t at a
nnua
l rat
es.
The
sig
n on
Cha
nge
in H
EB
, as
a pe
rcen
t of
nom
inal
pot
entia
l GD
P, is
rev
erse
d. F
I is
the
wei
ghte
d di
ffer
ence
of
disc
retio
nary
chan
ges
in f
eder
al s
pend
ing
and
taxe
s in
cha
ined
(20
05)
dolla
rs, s
cale
d by
rea
l GD
P. T
he a
nnua
l FI
estim
ates
are
on
a ca
lend
ar y
ear
basi
s. A
lso,
for
FI
and
the
chan
ge in
HE
B, p
ositi
ve v
alue
s in
dica
teag
greg
ate
dem
and
stim
ulus
.
a--
Act
ual
I-33
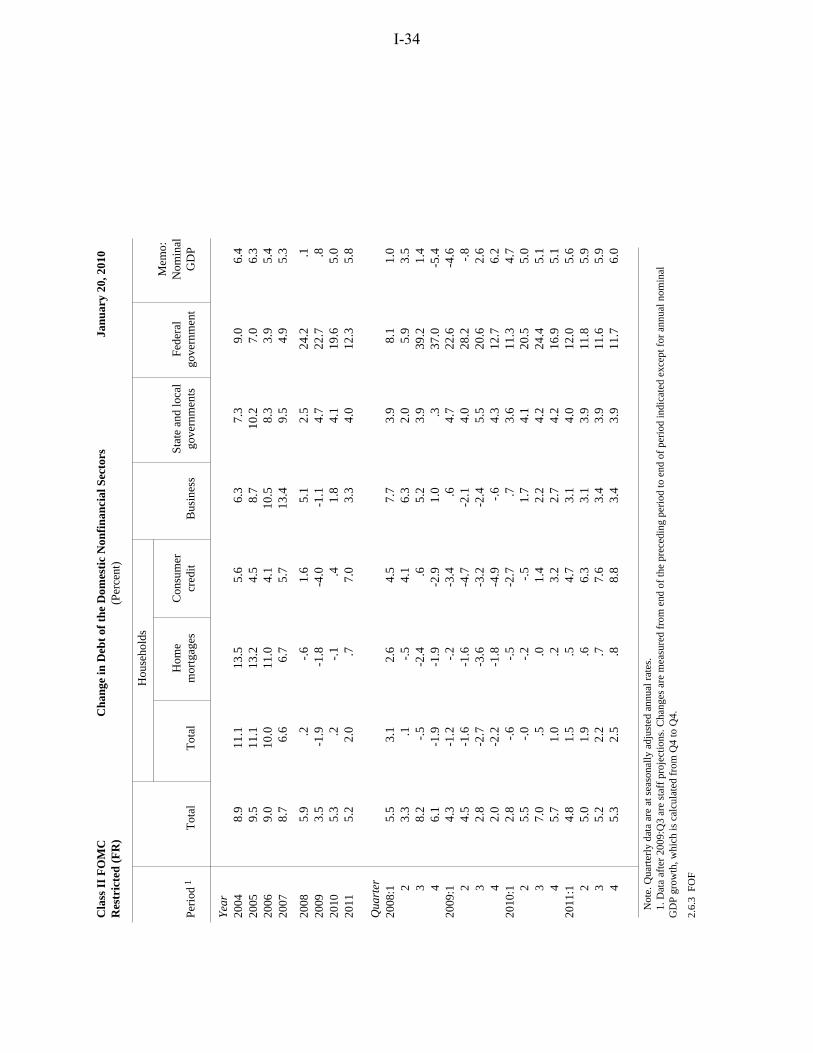
Cla
ss I
I F
OM
C
Cha
nge
in D
ebt
of t
he D
omes
tic
Non
fina
ncia
l Sec
tors
Ja
nuar
y 20
, 201
0 R
estr
icte
d (F
R)
(Per
cent
)
Peri
od 1
T
otal
Hou
seho
lds
Bus
ines
s St
ate
and
loca
l go
vern
men
ts
Fede
ral
gove
rnm
ent
Mem
o:
Nom
inal
G
DP
Tot
al
Hom
e m
ortg
ages
C
onsu
mer
cr
edit
Yea
r 20
04
2005
20
06
2007
2008
20
09
2010
20
11
Qua
rter
20
08:1
2 3 4 20
09:1
2 3 4 20
10:1
2 3 4 20
11:1
2 3 4
8.9
11.1
13
.5
5.6
6.3
7.3
9.0
6.4
9.5
11.1
13
.2
4.5
8.7
10.2
7.
0 6.
3 9.
0 10
.0
11.0
4.
1 10
.5
8.3
3.9
5.4
8.7
6.6
6.7
5.7
13.4
9.
5 4.
9 5.
3
5.9
.2
-.6
1.6
5.1
2.5
24.2
.1
3.
5 -1
.9
-1.8
-4
.0
-1.1
4.
7 22
.7
.8
5.3
.2
-.1
.4
1.8
4.1
19.6
5.
0 5.
2 2.
0 .7
7.
0 3.
3 4.
0 12
.3
5.8
5.5
3.1
2.6
4.5
7.7
3.9
8.1
1.0
3.3
.1
-.5
4.1
6.3
2.0
5.9
3.5
8.2
-.5
-2.4
.6
5.
2 3.
9 39
.2
1.4
6.1
-1.9
-1
.9
-2.9
1.
0 .3
37
.0
-5.4
4.
3 -1
.2
-.2
-3.4
.6
4.
7 22
.6
-4.6
4.
5 -1
.6
-1.6
-4
.7
-2.1
4.
0 28
.2
-.8
2.8
-2.7
-3
.6
-3.2
-2
.4
5.5
20.6
2.
6 2.
0 -2
.2
-1.8
-4
.9
-.6
4.3
12.7
6.
2 2.
8 -.
6 -.
5 -2
.7
.7
3.6
11.3
4.
7 5.
5 -.
0 -.
2 -.
5 1.
7 4.
1 20
.5
5.0
7.0
.5
.0
1.4
2.2
4.2
24.4
5.
1 5.
7 1.
0 .2
3.
2 2.
7 4.
2 16
.9
5.1
4.8
1.5
.5
4.7
3.1
4.0
12.0
5.
6 5.
0 1.
9 .6
6.
3 3.
1 3.
9 11
.8
5.9
5.2
2.2
.7
7.6
3.4
3.9
11.6
5.
9 5.
3 2.
5 .8
8.
8 3.
4 3.
9 11
.7
6.0
Not
e. Q
uart
erly
dat
a ar
e at
sea
sona
lly a
djus
ted
annu
al r
ates
. 1
. Dat
a af
ter
2009
:Q3
are
staf
f pr
ojec
tions
. Cha
nges
are
mea
sure
d fr
om e
nd o
f th
e pr
eced
ing
peri
od to
end
of
peri
od in
dica
ted
exce
pt f
or a
nnua
l nom
inal
G
DP
grow
th, w
hich
is c
alcu
late
d fr
om Q
4 to
Q4.
2.6.
3 FO
F
I-34
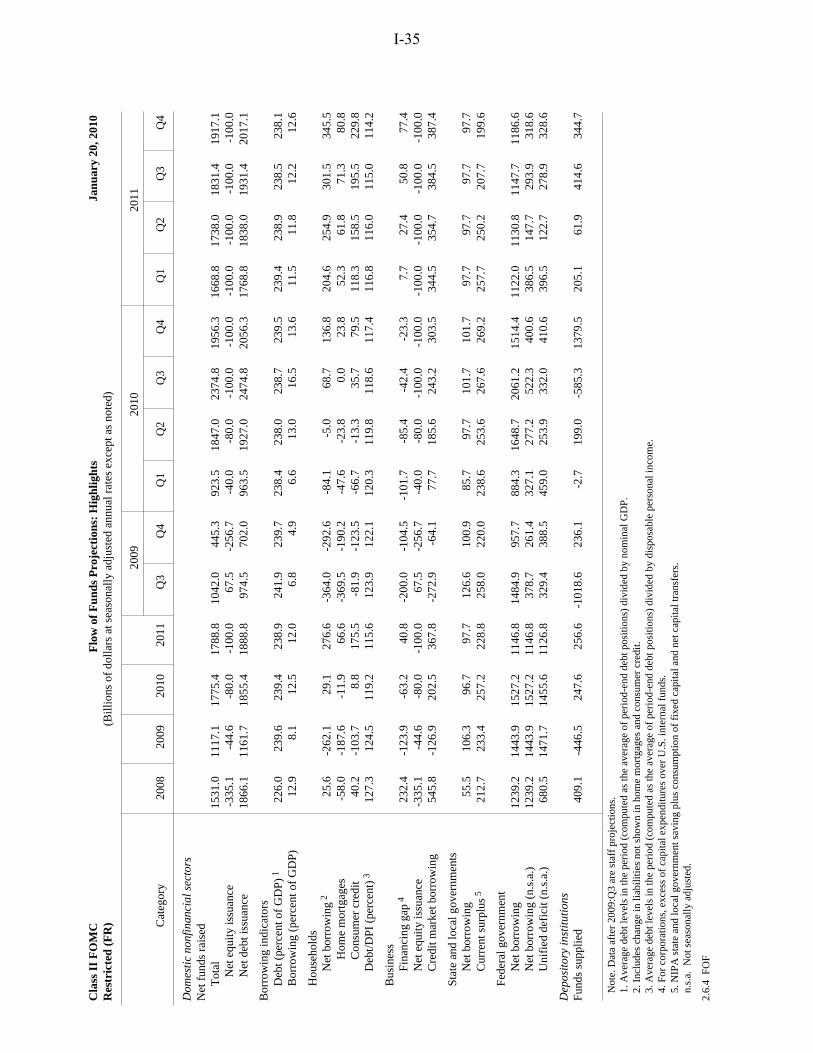
Cla
ss I
I F
OM
CF
low
of
Fun
ds P
roje
ctio
ns:
Hig
hlig
hts
Janu
ary
20, 2
010
Res
tric
ted
(FR
)(B
illio
ns o
f do
llars
at s
easo
nally
adj
uste
d an
nual
rat
es e
xcep
t as
note
d)
2009
2010
2011
Cat
egor
y20
0820
0920
1020
11Q
3 Q
4 Q
1 Q
2 Q
3 Q
4 Q
1 Q
2 Q
3 Q
4
Dom
esti
c no
nfin
anci
al s
ecto
rsN
et f
unds
rai
sed
T
otal
1531
.011
17.1
1775
.417
88.8
1042
.044
5.3
923.
518
47.0
2374
.819
56.3
1668
.817
38.0
1831
.419
17.1
Net
equ
ity is
suan
ce-3
35.1
-44.
6-8
0.0
-100
.067
.5-2
56.7
-40.
0-8
0.0
-100
.0-1
00.0
-100
.0-1
00.0
-100
.0-1
00.0
Net
deb
t iss
uanc
e18
66.1
1161
.718
55.4
1888
.897
4.5
702.
096
3.5
1927
.024
74.8
2056
.317
68.8
1838
.019
31.4
2017
.1
Bor
row
ing
indi
cato
rs
Deb
t (pe
rcen
t of
GD
P) 1
226.
023
9.6
239.
423
8.9
241.
923
9.7
238.
423
8.0
238.
723
9.5
239.
423
8.9
238.
523
8.1
B
orro
win
g (p
erce
nt o
f G
DP)
12.9
8.1
12.5
12.0
6.8
4.9
6.6
13.0
16.5
13.6
11.5
11.8
12.2
12.6
H
ouse
hold
s
Net
bor
row
ing
225
.6-2
62.1
29.1
276.
6-3
64.0
-292
.6-8
4.1
-5.0
68.7
136.
820
4.6
254.
930
1.5
345.
5
H
ome
mor
tgag
es-5
8.0
-187
.6-1
1.9
66.6
-369
.5-1
90.2
-47.
6-2
3.8
0.0
23.8
52.3
61.8
71.3
80.8
Con
sum
er c
redi
t40
.2-1
03.7
8.8
175.
5-8
1.9
-123
.5-6
6.7
-13.
335
.779
.511
8.3
158.
519
5.5
229.
8
Deb
t/DPI
(pe
rcen
t) 3
127.
312
4.5
119.
211
5.6
123.
912
2.1
120.
311
9.8
118.
611
7.4
116.
811
6.0
115.
011
4.2
B
usin
ess
F
inan
cing
gap
423
2.4
-123
.9-6
3.2
40.8
-200
.0-1
04.5
-101
.7-8
5.4
-42.
4-2
3.3
7.7
27.4
50.8
77.4
N
et e
quity
issu
ance
-335
.1-4
4.6
-80.
0-1
00.0
67.5
-256
.7-4
0.0
-80.
0-1
00.0
-100
.0-1
00.0
-100
.0-1
00.0
-100
.0
Cre
dit m
arke
t bor
row
ing
545.
8-1
26.9
202.
536
7.8
-272
.9-6
4.1
77.7
185.
624
3.2
303.
534
4.5
354.
738
4.5
387.
4
S
tate
and
loca
l gov
ernm
ents
N
et b
orro
win
g55
.510
6.3
96.7
97.7
126.
610
0.9
85.7
97.7
101.
710
1.7
97.7
97.7
97.7
97.7
C
urre
nt s
urpl
us 5
212.
723
3.4
257.
222
8.8
258.
022
0.0
238.
625
3.6
267.
626
9.2
257.
725
0.2
207.
719
9.6
F
eder
al g
over
nmen
t
Net
bor
row
ing
1239
.214
43.9
1527
.211
46.8
1484
.995
7.7
884.
316
48.7
2061
.215
14.4
1122
.011
30.8
1147
.711
86.6
N
et b
orro
win
g (n
.s.a
.)12
39.2
1443
.915
27.2
1146
.837
8.7
261.
432
7.1
277.
252
2.3
400.
638
6.5
147.
729
3.9
318.
6
Uni
fied
def
icit
(n.s
.a.)
680.
514
71.7
1455
.611
26.8
329.
438
8.5
459.
025
3.9
332.
041
0.6
396.
512
2.7
278.
932
8.6
Dep
osit
ory
inst
itut
ions
Fund
s su
pplie
d40
9.1
-446
.524
7.6
256.
6-1
018.
623
6.1
-2.7
199.
0-5
85.3
1379
.520
5.1
61.9
414.
634
4.7
N
ote.
Dat
a af
ter
2009
:Q3
are
staf
f pr
ojec
tions
.
1. A
vera
ge d
ebt l
evel
s in
the
peri
od (
com
pute
d as
the
aver
age
of p
erio
d-en
d de
bt p
ositi
ons)
div
ided
by
nom
inal
GD
P.
2. I
nclu
des
chan
ge in
liab
ilitie
s no
t sho
wn
in h
ome
mor
tgag
es a
nd c
onsu
mer
cre
dit.
3.
Ave
rage
deb
t lev
els
in th
e pe
riod
(co
mpu
ted
as th
e av
erag
e of
per
iod-
end
debt
pos
ition
s) d
ivid
ed b
y di
spos
able
per
sona
l inc
ome.
4.
For
cor
pora
tions
, exc
ess
of c
apita
l exp
endi
ture
s ov
er U
.S. i
nter
nal f
unds
.
5. N
IPA
sta
te a
nd lo
cal g
over
nmen
t sav
ing
plus
con
sum
ptio
n of
fix
ed c
apita
l and
net
cap
ital t
rans
fers
.
n.s.
a. N
ot s
easo
nally
adj
uste
d.
2.6.
4 F
OF
I-35

(Page I-36 is intentionally blank.)
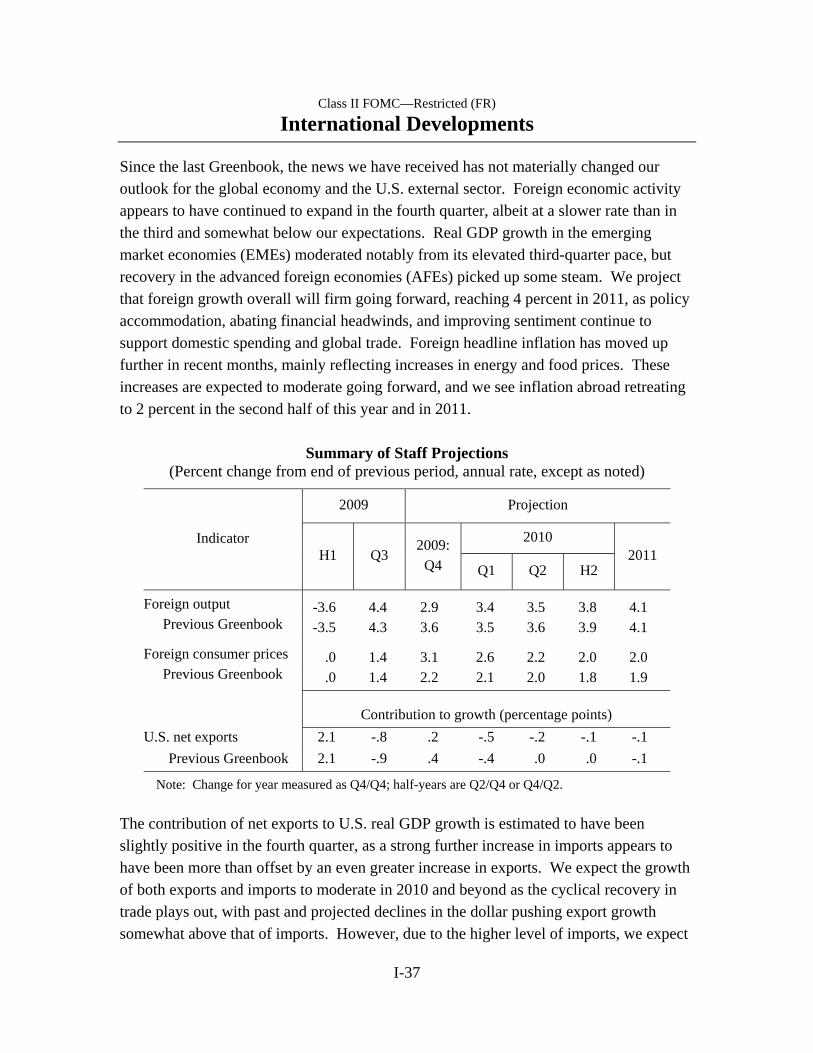
Summary of Staff Projections (Percent change from end of previous period, annual rate, except as noted)
Indicator
2009 Projection
2009: 2010 2011H1 Q3
Q4 Q1 Q2 H2
Foreign output Previous Greenbook
Foreign consumer prices Previous Greenbook
-3.6-3.5
.0
.0
4.4 2.9 3.4 3.5 3.8 4.3 3.6 3.5 3.6 3.9
1.4 3.1 2.6 2.2 2.0 1.4 2.2 2.1 2.0 1.8
4.14.1
2.01.9
Contribution to growth (percentage points) U.S. net exports Previous Greenbook
2.12.1
-.8 .2 -.5 -.2 -.1 -.9 .4 -.4 .0 .0
-.1 -.1
Note: Change for year measured as Q4/Q4; half-years are Q2/Q4 or Q4/Q2.
Class II FOMC—Restricted (FR)
International Developments
Since the last Greenbook, the news we have received has not materially changed our outlook for the global economy and the U.S. external sector. Foreign economic activity appears to have continued to expand in the fourth quarter, albeit at a slower rate than in the third and somewhat below our expectations. Real GDP growth in the emerging market economies (EMEs) moderated notably from its elevated third-quarter pace, but recovery in the advanced foreign economies (AFEs) picked up some steam. We project that foreign growth overall will firm going forward, reaching 4 percent in 2011, as policy accommodation, abating financial headwinds, and improving sentiment continue to support domestic spending and global trade. Foreign headline inflation has moved up further in recent months, mainly reflecting increases in energy and food prices. These increases are expected to moderate going forward, and we see inflation abroad retreating to 2 percent in the second half of this year and in 2011.
The contribution of net exports to U.S. real GDP growth is estimated to have been slightly positive in the fourth quarter, as a strong further increase in imports appears to have been more than offset by an even greater increase in exports. We expect the growth of both exports and imports to moderate in 2010 and beyond as the cyclical recovery in trade plays out, with past and projected declines in the dollar pushing export growth somewhat above that of imports. However, due to the higher level of imports, we expect
I-37
I-38 Class II FOMC—Restricted (FR) Part 1: Summary and Outlook, January 20, 2010
the contribution of net exports to U.S. GDP growth to be roughly neutral over the remainder of the forecast period.
International Financial Markets The trade-weighted value of the broad nominal dollar is slightly higher than at the time of the December Greenbook, while equity prices and sovereign yields have risen, as markets seem to have become more confident about the prospects for global growth.
Benchmark sovereign yields have increased about 30 basis points in the United Kingdom, comparable to the increase in the United States, while yields in Germany and Japan have moved up 15 and 5 basis points, respectively. Much of the rise in nominal foreign yields reflects a pickup in short-term inflation compensation, and may reflect, among other factors, an increase in near-term inflation expectations associated with the recent increase in commodity prices. Consistent with the rise in yields in the United Kingdom, expectations for the policy rate set by the Bank of England (BOE) as of the end of 2012 have increased as inflation has come in higher than had been expected. In contrast, expectations for the policy rates set by the European Central Bank (ECB) and Bank of Japan (BOJ) are little changed over the forecast horizon.
Although the rise in nominal sovereign yields is consistent with greater confidence in the growth outlook and with rising commodity prices, it may also have been affected by expectations of greater government and corporate borrowing in the coming year. Sovereign issuance is likely to be at record levels this year for many countries, and corporate issuance should also be high. In 2009, for the first time on record, global corporate investment grade bond issuance surpassed syndicated bank lending to investment grade corporations. So far this year, public bond offerings have met with strong demand. In contrast, the Greek government has avoided any long-term public debt offerings in January, and has said it may instead place its debt privately with Greek banks. Spreads on Greek debt over German bunds rose about 60 basis points, to 265 basis points, as Greece was downgraded from A1 to A2 by Moody’s and the country continued intense negotiations over its fiscal situation with the European Union. Spreads on Spanish and Portuguese debt over German bunds have also increased.
European and Japanese equity prices rose about 5½ percent over the period. Prices of financial stocks increased by less, as early profit reports for the fourth quarter from a few foreign banks rekindled some concern about the health of foreign banking systems. Although the Chinese stock market declined slightly, on net, most other emerging market
International Developments Class II FOMC—Restricted (FR) I-39
equity indexes rose moderately. Earlier in the period, they had risen by more; however, news that the People’s Bank of China had raised reserve requirements caused a modest retreat in many emerging stock markets.
The dollar appreciated ¾ percent on a trade-weighted basis against the major foreign currencies but depreciated slightly against the currencies of our other important trading partners. The dollar gained against the yen and euro amid a building perception that U.S. growth prospects are considerably better than those in Europe and Japan, despite the soft U.S. December employment report. By contrast, rising commodity prices and a strong outlook for China led the dollar to decline against the currencies of commodity producers, notably Canada and Mexico, and against most emerging Asian currencies. All told, the projected path of the broad real dollar, which depreciates roughly 2 percent this year and 3 percent in 2011, is about the same as in the December Greenbook.
Advanced Foreign Economies We estimate that economic growth in the advanced foreign economies picked up to 2¼ percent at an annual rate in the fourth quarter, a little weaker than we had expected. Fourth-quarter indicators on domestic private spending were mixed, with retail sales strengthening in Canada but showing renewed weakness elsewhere. However, growth was supported by government stimulus, boosts from inventories, and the rebound in global trade. Continued improvements in PMIs, industrial production, and credit conditions are all pointing to a gradual recovery in private spending across the AFEs. As such, we expect AFE growth to rise to 3¼ percent by the end of 2011. Outside of the somewhat weaker fourth quarter, the forecast is little changed relative to the December Greenbook.
Higher energy prices led to a marked increase in headline inflation. For the fourth quarter, we estimate that consumer prices in the AFEs rose at an annual rate of 2 percent, 1 percentage point faster than we foresaw in the previous Greenbook. Core prices remained generally subdued. In Japan, a declining trend in core inflation, significant wage cuts, and very low inflation expectations, as well as generally anemic labor market conditions associated with a yawning output gap, indicate that deflationary pressures are likely to persist for some time. These considerations, together with downside surprises to headline inflation despite the higher energy prices, have led us to lower the projected path for Japanese consumer prices over this year and next. Elsewhere, although economic slack is also projected to remain substantial over the forecast period, we are not anticipating a sizable deceleration in prices, as core inflation and measures of inflation
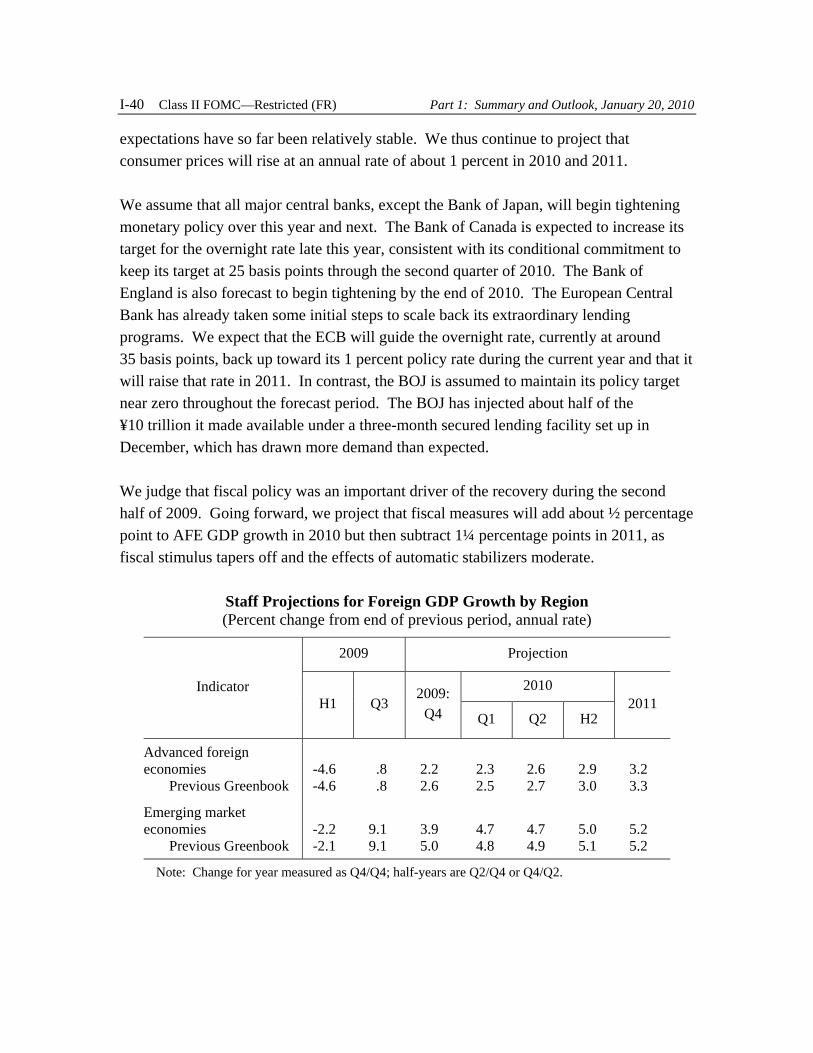
Staff Projections for Foreign GDP Growth by Region (Percent change from end of previous period, annual rate)
Indicator
2009 Projection
2009: 2010 2011H1 Q3
Q4 Q1 Q2 H2
Advanced foreign economies -4.6 .8 2.2 2.3 2.6 2.9 3.2 Previous Greenbook -4.6 .8 2.6 2.5 2.7 3.0 3.3
Emerging market economies -2.2 9.1 3.9 4.7 4.7 5.0 5.2 Previous Greenbook -2.1 9.1 5.0 4.8 4.9 5.1 5.2
Note: Change for year measured as Q4/Q4; half-years are Q2/Q4 or Q4/Q2.
I-40 Class II FOMC—Restricted (FR) Part 1: Summary and Outlook, January 20, 2010
expectations have so far been relatively stable. We thus continue to project that consumer prices will rise at an annual rate of about 1 percent in 2010 and 2011.
We assume that all major central banks, except the Bank of Japan, will begin tightening monetary policy over this year and next. The Bank of Canada is expected to increase its target for the overnight rate late this year, consistent with its conditional commitment to keep its target at 25 basis points through the second quarter of 2010. The Bank of England is also forecast to begin tightening by the end of 2010. The European Central Bank has already taken some initial steps to scale back its extraordinary lending programs. We expect that the ECB will guide the overnight rate, currently at around 35 basis points, back up toward its 1 percent policy rate during the current year and that it will raise that rate in 2011. In contrast, the BOJ is assumed to maintain its policy target near zero throughout the forecast period. The BOJ has injected about half of the ¥10 trillion it made available under a three-month secured lending facility set up in December, which has drawn more demand than expected.
We judge that fiscal policy was an important driver of the recovery during the second half of 2009. Going forward, we project that fiscal measures will add about ½ percentage point to AFE GDP growth in 2010 but then subtract 1¼ percentage points in 2011, as fiscal stimulus tapers off and the effects of automatic stabilizers moderate.
International Developments Class II FOMC—Restricted (FR) I-41
Emerging Market Economies We estimate that GDP growth in the emerging market economies slowed to an annual rate of nearly 4 percent in the fourth quarter, about 1 percentage point lower than projected in the December Greenbook. This downward revision primarily reflects slower growth in Mexico and a contraction in Singapore, following their double-digit expansions in the third quarter. However, we have not changed our view of the general contour of the recovery in the EMEs, with growth picking up to average about 5 percent over the remainder of the forecast period.
Incoming data generally confirm that emerging Asian economies expanded solidly in the fourth quarter. Singapore is an exception, with the advance estimate pointing to a sharp contraction in GDP, reflecting a downward swing in the volatile biomedical manufacturing sector; other sectors, including services and construction, registered robust growth, and we project a strong rebound in Singapore in the current quarter. In China, we estimate real GDP expanded at a 10½ percent pace in the fourth quarter, with continued strong domestic demand and a boost from the external sector. We project that output in emerging Asia will grow about 6 percent in the current quarter and continue to expand at that pace through the end of the forecast period, with the withdrawal of stimulus measures roughly offset by improving external demand from the advanced economies.
In Latin America, we project a somewhat slower recovery during 2010 than in the previous Greenbook, although we continue to expect growth in the region to exceed 4 percent by 2011. Mexican GDP has been marked down for 2010 in line with the softer outlook for U.S. industrial production over the next few quarters, but we still project growth of about 4½ percent in 2011. Our forecast for Brazilian growth remains close to 5 percent in 2010 and 4 percent in 2011. Venezuela devalued its currency in mid-January and established a formal dual exchange rate regime. However, we have lowered our near-term outlook for the country’s growth, as disruptions from structural problems more than offset any impetus from the devaluation. The earthquake in Haiti, costly as it has been in terms of human life and material infrastructure, will have no discernible impact on the regional economic outlook.
Consumer price inflation has continued to increase in emerging Asia, especially in India and China, although generally from low rates. The trajectory for CPI inflation has been revised up 1½ percentage points in the near term, mainly reflecting temporary, weather-related increases in food prices. However, in China, strong domestic demand also
I-42 Class II FOMC—Restricted (FR) Part 1: Summary and Outlook, January 20, 2010
appears to be putting upward pressure on nonfood prices, and we have raised somewhat our outlook for inflation there over the next two years. Still, we expect Chinese inflation to remain moderate, and we assume that authorities will tighten monetary policy only gradually over the forecast period. In the second half of 2010 and in 2011, we project inflation to average about 2½ percent in emerging Asia, up a bit from the December Greenbook, and 3½ percent in Latin America.
Commodity Prices Since the December Greenbook, the spot price of West Texas Intermediate (WTI) crude oil has increased $6 per barrel, closing at $79 on January 19. Prices for other types of crude oil have risen by less, however, implying a smaller increase in our near-term projection for the average price of imported oil. Consistent with futures prices, we project that the spot price of WTI will rise to $87 per barrel by the end of 2011. Beyond the current quarter, our projections for both the spot price of WTI and the oil import price are nearly $2 higher than in the December Greenbook.
The recent increase in oil prices appears to partly reflect the strength of oil demand from China, where crude oil imports surged to record levels in December. Additionally, a spell of unusually cold weather in the northern hemisphere seems to have provided a temporary boost to demand. With global oil supply little changed, the stronger demand through December has helped push petroleum inventories in OECD countries, including the United States, back to within typical ranges for the first time since late 2008.
Driven by the ongoing global recovery, and particularly by strong demand in China, nonfuel commodity prices have also increased further since the time of the December Greenbook. They registered a rise of 30 percent (annual rate) in the fourth quarter and have shown robust gains into the start of the year, mainly reflecting rising prices for industrial materials. Prices for many commodities are now moving back toward their mid-2008 peaks; for example, a broad index of prices of raw industrial commodities is currently only about 9 percent below its mid-2008 level. We now project that nonfuel commodity prices will rise at an annual rate of 24 percent in the current quarter, well up from our previous forecast, primarily on account of price increases that have already occurred both early this year and late last year. Beyond the near term, we expect nonfuel commodity prices to flatten out, consistent with readings from futures markets.
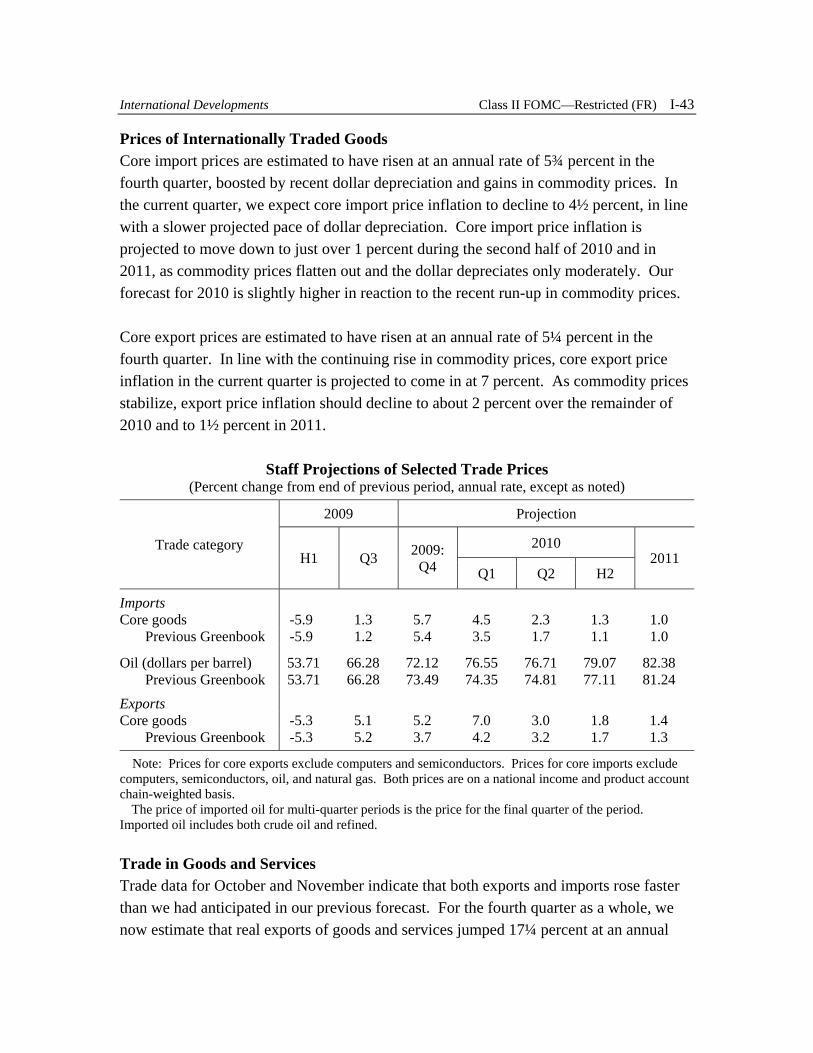
Staff Projections of Selected Trade Prices (Percent change from end of previous period, annual rate, except as noted)
Trade category
2009 Projection
H1 Q3 2009: 2010 2011Q4 Q1 Q2 H2
Imports Core goods -5.9 1.3 5.7 4.5 2.3 1.3 1.0
Previous Greenbook -5.9 1.2 5.4 3.5 1.7 1.1 1.0
Oil (dollars per barrel) 53.71 66.28 72.12 76.55 76.71 79.07 82.38 Previous Greenbook 53.71 66.28 73.49 74.35 74.81 77.11 81.24
Exports Core goods -5.3 5.1 5.2 7.0 3.0 1.8 1.4
Previous Greenbook -5.3 5.2 3.7 4.2 3.2 1.7 1.3
Note: Prices for core exports exclude computers and semiconductors. Prices for core imports exclude computers, semiconductors, oil, and natural gas. Both prices are on a national income and product account chain-weighted basis.
The price of imported oil for multi-quarter periods is the price for the final quarter of the period. Imported oil includes both crude oil and refined.
International Developments Class II FOMC—Restricted (FR) I-43
Prices of Internationally Traded Goods Core import prices are estimated to have risen at an annual rate of 5¾ percent in the fourth quarter, boosted by recent dollar depreciation and gains in commodity prices. In the current quarter, we expect core import price inflation to decline to 4½ percent, in line with a slower projected pace of dollar depreciation. Core import price inflation is projected to move down to just over 1 percent during the second half of 2010 and in 2011, as commodity prices flatten out and the dollar depreciates only moderately. Our forecast for 2010 is slightly higher in reaction to the recent run-up in commodity prices.
Core export prices are estimated to have risen at an annual rate of 5¼ percent in the fourth quarter. In line with the continuing rise in commodity prices, core export price inflation in the current quarter is projected to come in at 7 percent. As commodity prices stabilize, export price inflation should decline to about 2 percent over the remainder of 2010 and to 1½ percent in 2011.
Trade in Goods and Services Trade data for October and November indicate that both exports and imports rose faster than we had anticipated in our previous forecast. For the fourth quarter as a whole, we now estimate that real exports of goods and services jumped 17¼ percent at an annual
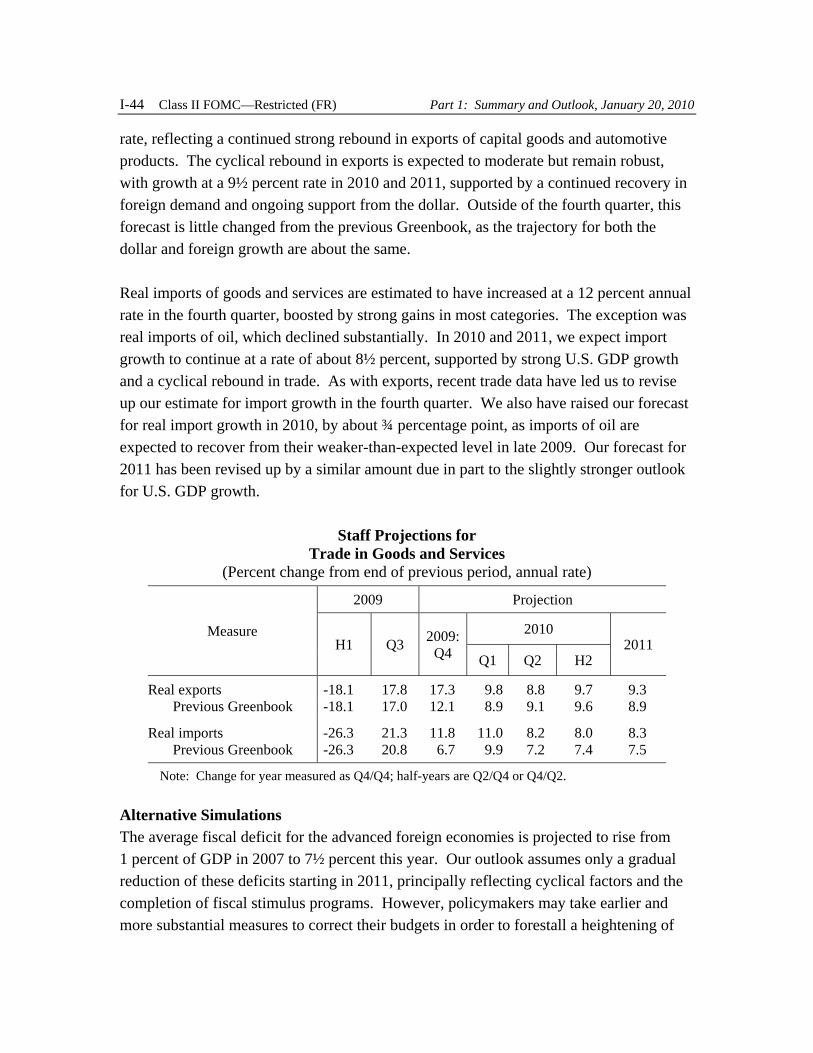
Staff Projections for Trade in Goods and Services
(Percent change from end of previous period, annual rate)
Measure
2009 Projection
H1 Q3 2009: 2010 2011Q4 Q1 Q2 H2
Real exports -18.1 17.8 17.3 9.8 8.8 9.7 9.3 Previous Greenbook -18.1 17.0 12.1 8.9 9.1 9.6 8.9
Real imports -26.3 21.3 11.8 11.0 8.2 8.0 8.3 Previous Greenbook -26.3 20.8 6.7 9.9 7.2 7.4 7.5
Note: Change for year measured as Q4/Q4; half-years are Q2/Q4 or Q4/Q2.
I-44 Class II FOMC—Restricted (FR) Part 1: Summary and Outlook, January 20, 2010
rate, reflecting a continued strong rebound in exports of capital goods and automotive products. The cyclical rebound in exports is expected to moderate but remain robust, with growth at a 9½ percent rate in 2010 and 2011, supported by a continued recovery in foreign demand and ongoing support from the dollar. Outside of the fourth quarter, this forecast is little changed from the previous Greenbook, as the trajectory for both the dollar and foreign growth are about the same.
Real imports of goods and services are estimated to have increased at a 12 percent annual rate in the fourth quarter, boosted by strong gains in most categories. The exception was real imports of oil, which declined substantially. In 2010 and 2011, we expect import growth to continue at a rate of about 8½ percent, supported by strong U.S. GDP growth and a cyclical rebound in trade. As with exports, recent trade data have led us to revise up our estimate for import growth in the fourth quarter. We also have raised our forecast for real import growth in 2010, by about ¾ percentage point, as imports of oil are expected to recover from their weaker-than-expected level in late 2009. Our forecast for 2011 has been revised up by a similar amount due in part to the slightly stronger outlook for U.S. GDP growth.
Alternative Simulations The average fiscal deficit for the advanced foreign economies is projected to rise from 1 percent of GDP in 2007 to 7½ percent this year. Our outlook assumes only a gradual reduction of these deficits starting in 2011, principally reflecting cyclical factors and the completion of fiscal stimulus programs. However, policymakers may take earlier and more substantial measures to correct their budgets in order to forestall a heightening of
1 We use the SIGMA model with three country blocs: the United States, the AFEs, and the EMEs. The United States and the AFEs have a zero lower bound constraint, but the EMEs do not.
International Developments Class II FOMC—Restricted (FR) I-45
concerns about fiscal sustainability in the major AFEs that substantially boosts government yields, as has already occurred in Greece and some other countries.
We use the SIGMA model to examine the effects of more rapid fiscal consolidation in the AFEs than assumed in our baseline forecast.1 In this scenario, discretionary government spending is reduced 2 percent of baseline GDP by the end of 2012, with most of that contraction front-loaded into the first year. These austerity measures are sufficient to put the debt-to-GDP ratio on a declining path within a couple of years, but at considerable cost. The economic recovery nearly stalls as AFE GDP growth is pushed down to 1 percent in 2010, well below its baseline pace of 2¾ percent. Growth recovers in 2011, but the level of GDP remains well below baseline through 2014.
In response to the faster fiscal consolidation abroad, U.S. real GDP growth falls relative to baseline by 0.5 percentage point in 2010 and 0.1 percentage point in 2011. The reduction in U.S. GDP growth is mainly due to a fall in U.S. exports, which decline in response to both weaker foreign activity and an appreciation of the dollar. The dollar appreciates because monetary authorities in the AFEs are expected to reduce interest rates relative to their baseline path once the zero bound constraint no longer binds. U.S. core PCE price inflation falls ¼ percentage point below baseline in 2010 and 0.1 percentage point in 2011, reflecting reduced resource utilization and the lower import prices that result from dollar appreciation. A similar-sized fiscal consolidation in the AFEs occurring through higher income taxes rather than lower spending would have smaller effects, because the tax multiplier is smaller than the spending multiplier.
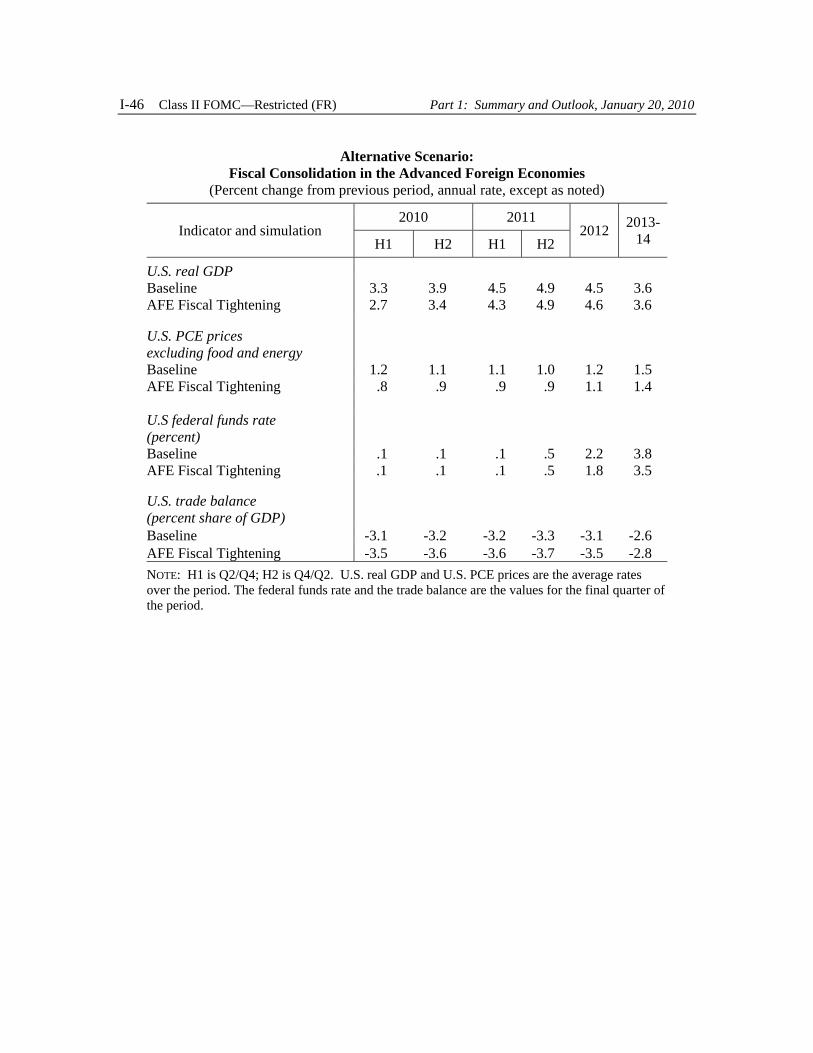
Alternative Scenario: Fiscal Consolidation in the Advanced Foreign Economies
(Percent change from previous period, annual rate, except as noted)
Indicator and simulation 2010 2011
2012 201314H1 H2 H1 H2
U.S. real GDP Baseline 3.3 3.9 4.5 4.9 4.5 3.6 AFE Fiscal Tightening
U.S. PCE prices excluding food and energy
2.7 3.4 4.3 4.9 4.6 3.6
Baseline 1.2 1.1 1.1 1.0 1.2 1.5 AFE Fiscal Tightening
U.S federal funds rate (percent)
.8 .9 .9 .9 1.1 1.4
Baseline .1 .1 .1 .5 2.2 3.8 AFE Fiscal Tightening
U.S. trade balance (percent share of GDP)
.1 .1 .1 .5 1.8 3.5
Baseline -3.1 -3.2 -3.2 -3.3 -3.1 -2.6 AFE Fiscal Tightening -3.5 -3.6 -3.6 -3.7 -3.5 -2.8 NOTE: H1 is Q2/Q4; H2 is Q4/Q2. U.S. real GDP and U.S. PCE prices are the average rates over the period. The federal funds rate and the trade balance are the values for the final quarter of the period.
I-46 Class II FOMC—Restricted (FR) Part 1: Summary and Outlook, January 20, 2010
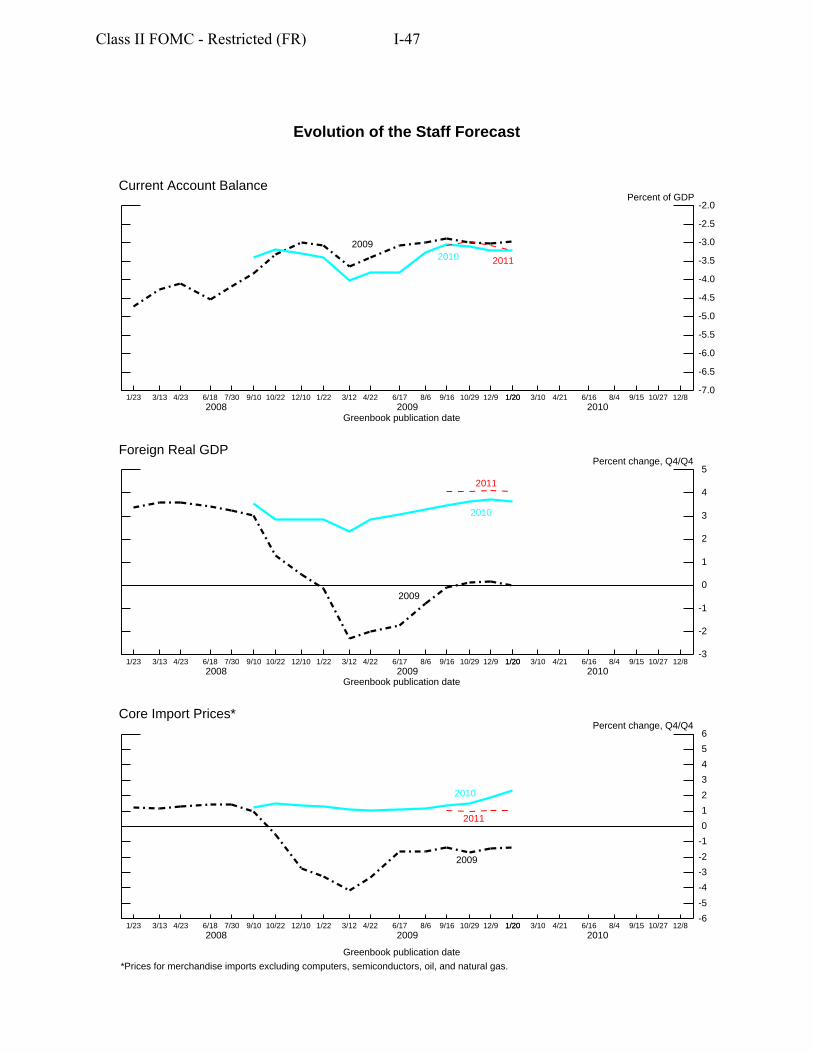
Class II FOMC - Restricted (FR) I-47
Evolution of the Staff Forecast
-7.0
-6.5
-6.0
-5.5
-5.0
-4.5
-4.0
-3.5
-3.0
-2.5
-2.0
2009 2010 2011
Current Account Balance Percent of GDP
1/23 3/13 4/23 6/18 7/30 9/10 10/22 12/10 1/22 3/12 4/22 6/17 8/6 9/16 10/29 12/9 1/20 3/10 4/21 6/16 8/4 9/15 10/27 12/81/20 2008 2009 2010
Greenbook publication date
Foreign Real GDP Percent change, Q4/Q4
-3
-2
-1
0
1
2
3
4
5
2009
2010
2011
1/23 3/13 4/23 6/18 7/30 9/10 10/22 12/10 1/22 3/12 4/22 6/17 8/6 9/16 10/29 12/9 1/20 3/10 4/21 6/16 8/4 9/15 10/27 12/81/20 2008 2009 2010
Greenbook publication date
Core Import Prices* Percent change, Q4/Q4
-6
-5
-4
-3
-2
-1
0
1
2
3
4
5
6
2009
2010
2011
1/23 3/13 4/23 6/18 7/30 9/10 10/22 12/10 1/22 3/12 4/22 6/17 8/6 9/16 10/29 12/9 1/20 3/10 4/21 6/16 8/4 9/15 10/27 12/81/20 2008 2009 2010
Greenbook publication date
*Prices for merchandise imports excluding computers, semiconductors, oil, and natural gas.
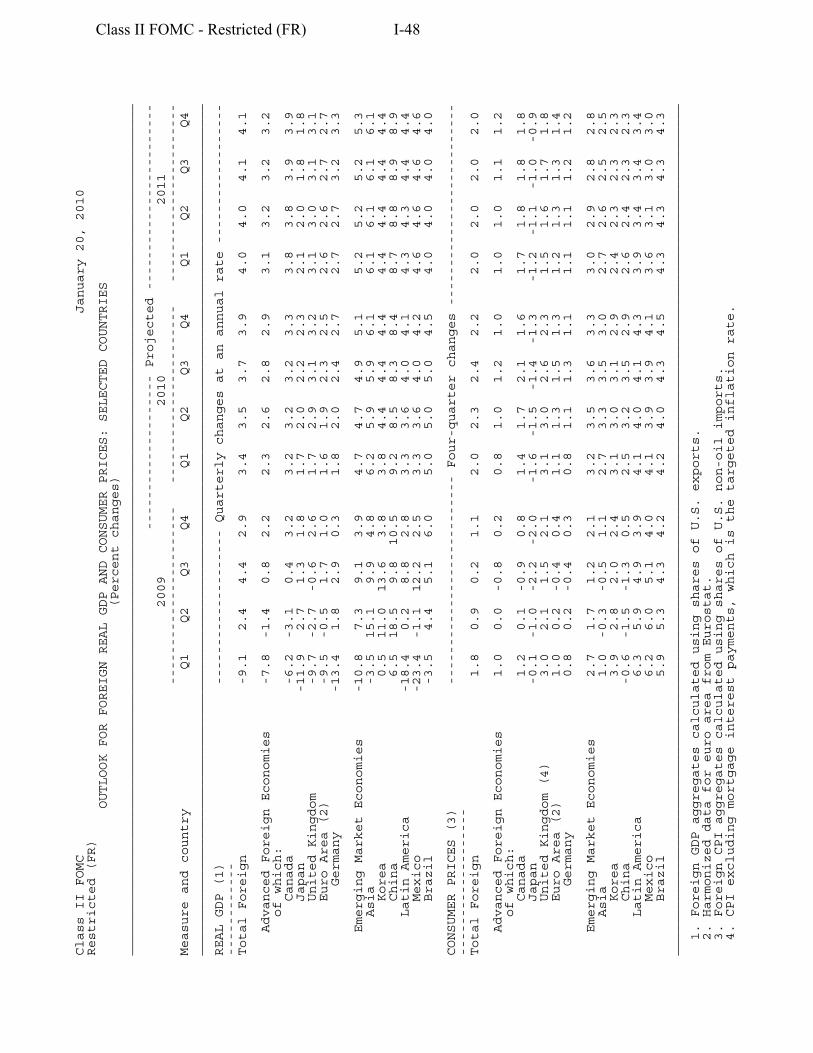
Class II FOMC January 20, 2010
Restricted (FR)
OUTLOOK FOR FOREIGN REAL GDP AND CONSUMER PRICES: SELECTED COUNTRIES
(Percent changes)
______________________________________________________________________________________________________________
-------------------- Projected ------------------------
2009 2010 2011
----------------------- ----------------------- -----------------------
Measure and country Q1 Q2 Q3 Q4 Q1 Q2 Q3 Q4 Q1 Q2 Q3 Q4
______________________________________________________________________________________________________________
REAL GDP (1) -------------------- Quarterly changes at an annual rate ------------------
------------
Total Foreign -9.1 2.4 4.4 2.9 3.4 3.5 3.7 3.9 4.0 4.0 4.1 4.1
Advanced Foreign Economies -7.8 -1.4 0.8 2.2 2.3 2.6 2.8 2.9 3.1 3.2 3.2 3.2
of which:
Canada -6.2 -3.1 0.4 3.2 3.2 3.2 3.2 3.3 3.8 3.8 3.9 3.9
Japan -11.9 2.7 1.3 1.8 1.7 2.0 2.2 2.3 2.1 2.0 1.8 1.8
United Kingdom -9.7 -2.7 -0.6 2.6 1.7 2.9 3.1 3.2 3.1 3.0 3.1 3.1
Euro Area (2) -9.5 -0.5 1.7 1.0 1.6 1.9 2.3 2.5 2.6 2.6 2.7 2.7
Germany -13.4 1.8 2.9 0.3 1.8 2.0 2.4 2.7 2.7 2.7 3.2 3.3
Emerging Market Economies -10.8 7.3 9.1 3.9 4.7 4.7 4.9 5.1 5.2 5.2 5.2 5.3
Asia -3.5 15.1 9.9 4.8 6.2 5.9 5.9 6.1 6.1 6.1 6.1 6.1
Korea 0.5 11.0 13.6 3.8 3.8 4.4 4.4 4.4 4.4 4.4 4.4 4.4
China 6.5 18.5 9.8 10.5 9.2 8.5 8.3 8.4 8.7 8.8 8.9 8.9
Latin America -18.4 0.2 8.8 2.8 3.3 3.6 4.0 4.1 4.3 4.3 4.4 4.4
Mexico -23.4 -1.1 12.2 2.5 3.3 3.6 4.0 4.2 4.6 4.6 4.6 4.6
Brazil -3.5 4.4 5.1 6.0 5.0 5.0 5.0 4.5 4.0 4.0 4.0 4.0
CONSUMER PRICES (3) --------------------------- Four-quarter changes --------------------------
-------------------
Total Foreign 1.8 0.9 0.2 1.1 2.0 2.3 2.4 2.2 2.0 2.0 2.0 2.0
Advanced Foreign Economies 1.0 0.0 -0.8 0.2 0.8 1.0 1.2 1.0 1.0 1.0 1.1 1.2
of which:
Canada 1.2 0.1 -0.9 0.8 1.4 1.7 2.1 1.6 1.7 1.8 1.8 1.8
Japan -0.1 -1.0 -2.2 -2.0 -1.6 -1.5 -1.4 -1.3 -1.2 -1.1 -1.0 -0.9
United Kingdom (4) 3.0 2.1 1.5 2.1 3.1 3.0 2.6 2.3 1.5 1.6 1.7 1.8
Euro Area (2) 1.0 0.2 -0.4 0.4 1.1 1.3 1.5 1.3 1.2 1.3 1.3 1.4
Germany 0.8 0.2 -0.4 0.3 0.8 1.1 1.3 1.1 1.1 1.1 1.2 1.2
Emerging Market Economies 2.7 1.7 1.2 2.1 3.2 3.5 3.6 3.3 3.0 2.9 2.8 2.8
Asia 1.0 -0.3 -0.5 1.1 2.7 3.3 3.5 3.0 2.7 2.6 2.5 2.5
Korea 3.9 2.8 2.0 2.4 3.1 3.0 3.1 2.9 2.4 2.3 2.3 2.3
China -0.6 -1.5 -1.3 0.5 2.5 3.2 3.5 2.9 2.6 2.4 2.3 2.3
Latin America 6.3 5.9 4.9 3.9 4.1 4.0 4.1 4.3 3.9 3.4 3.4 3.4
Mexico 6.2 6.0 5.1 4.0 4.1 3.9 3.9 4.1 3.6 3.1 3.0 3.0
Brazil 5.9 5.3 4.3 4.2 4.2 4.0 4.3 4.5 4.3 4.3 4.3 4.3
______________________________________________________________________________________________________________
1. Foreign GDP aggregates calculated using shares of U.S. exports.
2. Harmonized data for euro area from Eurostat.
3. Foreign CPI aggregates calculated using shares of U.S. non-oil imports.
4. CPI excluding mortgage interest payments, which is the targeted inflation rate.
Class II FOMC - Restricted (FR) I-48
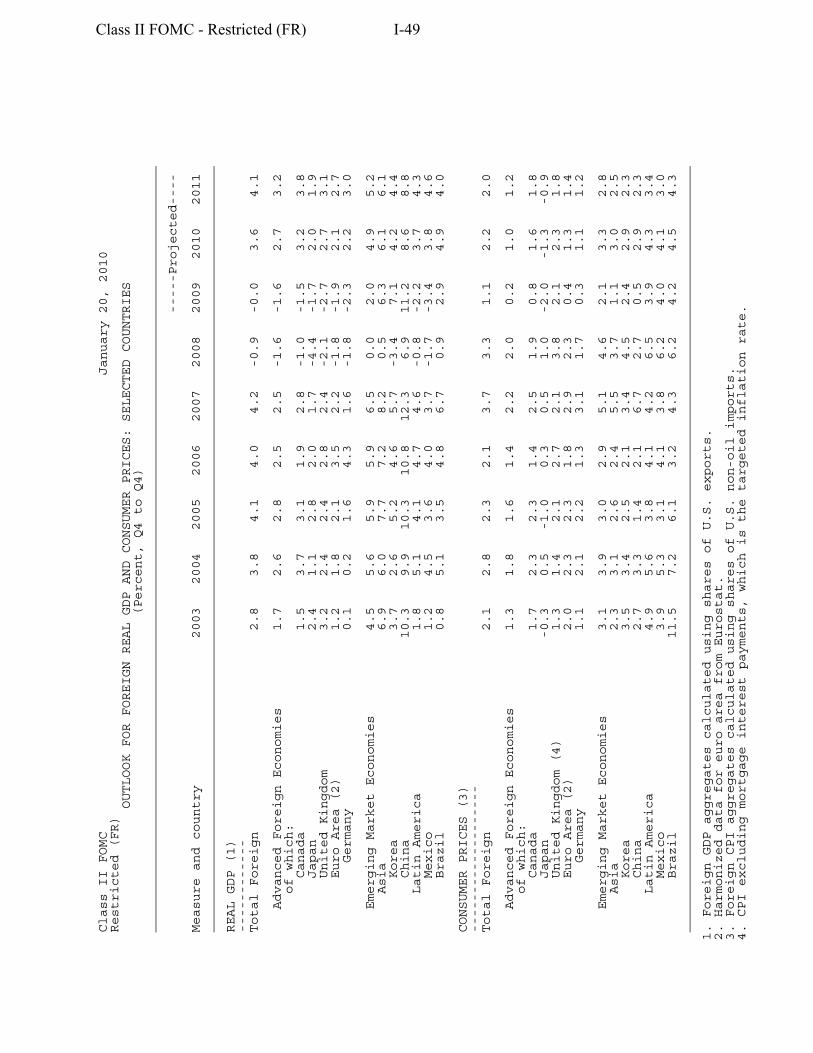
Class II FOMC January 20, 2010
Restricted (FR)
OUTLOOK FOR FOREIGN REAL GDP AND CONSUMER PRICES: SELECTED COUNTRIES
(Percent, Q4 to Q4)
___________________________________________________________________________________________________
-----Projected----
Measure and country 2003 2004 2005 2006 2007 2008 2009 2010 2011
___________________________________________________________________________________________________
REAL GDP (1)
------------
Total Foreign 2.8 3.8 4.1 4.0 4.2 -0.9 -0.0 3.6 4.1
Advanced Foreign Economies 1.7 2.6 2.8 2.5 2.5 -1.6 -1.6 2.7 3.2
of which:
Canada 1.5 3.7 3.1 1.9 2.8 -1.0 -1.5 3.2 3.8
Japan 2.4 1.1 2.8 2.0 1.7 -4.4 -1.7 2.0 1.9
United Kingdom 3.2 2.4 2.4 2.8 2.4 -2.1 -2.7 2.7 3.1
Euro Area (2) 1.2 1.8 2.1 3.5 2.2 -1.8 -1.9 2.1 2.7
Germany 0.1 0.2 1.6 4.3 1.6 -1.8 -2.3 2.2 3.0
Emerging Market Economies 4.5 5.6 5.9 5.9 6.5 0.0 2.0 4.9 5.2
Asia 6.9 6.0 7.7 7.2 8.2 0.5 6.3 6.1 6.1
Korea 3.7 2.6 5.2 4.6 5.7 -3.4 7.1 4.2 4.4
China 10.3 9.9 10.3 10.8 12.3 6.9 11.2 8.6 8.8
Latin America 1.8 5.1 4.1 4.7 4.6 -0.8 -2.2 3.7 4.3
Mexico 1.2 4.5 3.6 4.0 3.7 -1.7 -3.4 3.8 4.6
Brazil 0.8 5.1 3.5 4.8 6.7 0.9 2.9 4.9 4.0
CONSUMER PRICES (3)
-------------------
Total Foreign 2.1 2.8 2.3 2.1 3.7 3.3 1.1 2.2 2.0
Advanced Foreign Economies 1.3 1.8 1.6 1.4 2.2 2.0 0.2 1.0 1.2
of which:
Canada 1.7 2.3 2.3 1.4 2.5 1.9 0.8 1.6 1.8
Japan -0.3 0.5 -1.0 0.3 0.5 1.0 -2.0 -1.3 -0.9
United Kingdom (4) 1.3 1.4 2.1 2.7 2.1 3.8 2.1 2.3 1.8
Euro Area (2) 2.0 2.3 2.3 1.8 2.9 2.3 0.4 1.3 1.4
Germany 1.1 2.1 2.2 1.3 3.1 1.7 0.3 1.1 1.2
Emerging Market Economies 3.1 3.9 3.0 2.9 5.1 4.6 2.1 3.3 2.8
Asia 2.3 3.1 2.6 2.4 5.5 3.7 1.1 3.0 2.5
Korea 3.5 3.4 2.5 2.1 3.4 4.5 2.4 2.9 2.3
China 2.7 3.3 1.4 2.1 6.7 2.7 0.5 2.9 2.3
Latin America 4.9 5.6 3.8 4.1 4.2 6.5 3.9 4.3 3.4
Mexico 3.9 5.3 3.1 4.1 3.8 6.2 4.0 4.1 3.0
Brazil 11.5 7.2 6.1 3.2 4.3 6.2 4.2 4.5 4.3
___________________________________________________________________________________________________
1. Foreign GDP aggregates calculated using shares of U.S. exports.
2. Harmonized data for euro area from Eurostat.
3. Foreign CPI aggregates calculated using shares of U.S. non-oil imports.
4. CPI excluding mortgage interest payments, which is the targeted inflation rate.
Class II FOMC - Restricted (FR) I-49
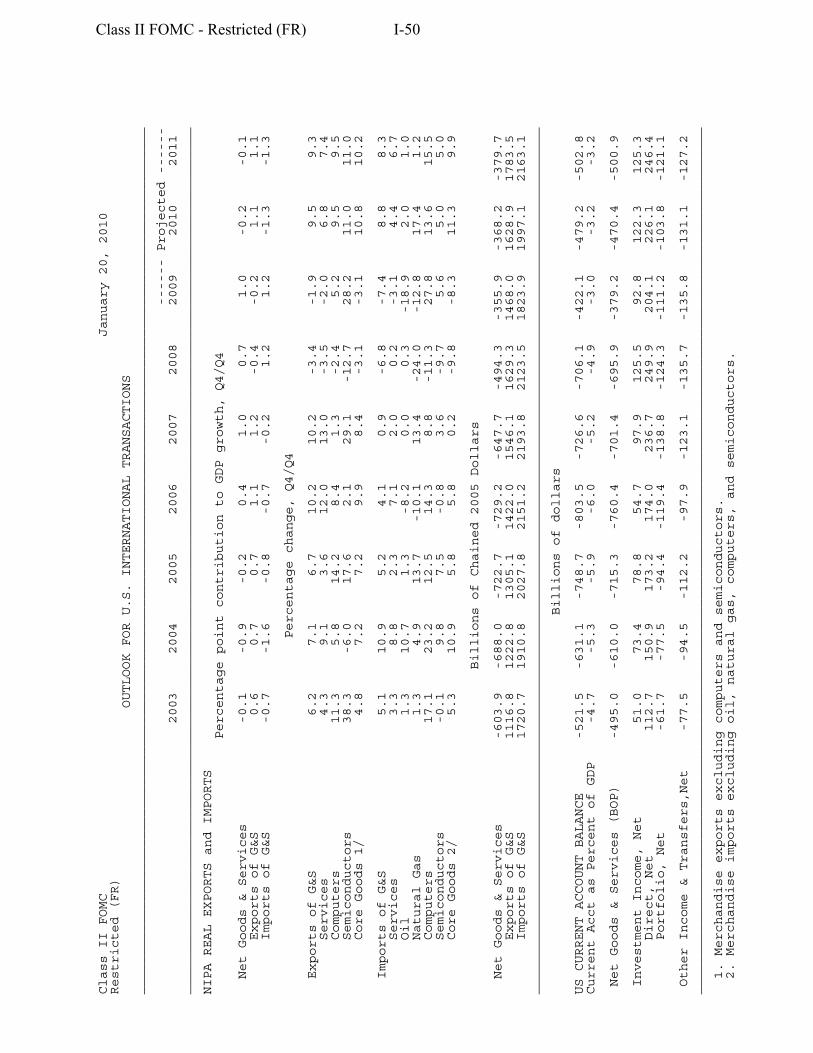
Class II FOMC January 20, 2010
Restricted (FR)
OUTLOOK FOR U.S. INTERNATIONAL TRANSACTIONS
________________________________________________________________________________________________________________
------ Projected ------
2003 2004 2005 2006 2007 2008 2009 2010 2011
________________________________________________________________________________________________________________
NIPA REAL EXPORTS and IMPORTS
Percentage point contribution to GDP growth, Q4/Q4
Net Goods & Services -0.1 -0.9 -0.2 0.4 1.0 0.7 1.0 -0.2 -0.1
Exports of G&S 0.6 0.7 0.7 1.1 1.2 -0.4 -0.2 1.1 1.1
Imports of G&S -0.7 -1.6 -0.8 -0.7 -0.2 1.2 1.2 -1.3 -1.3
Percentage change, Q4/Q4
Exports of G&S 6.2 7.1 6.7 10.2 10.2 -3.4 -1.9 9.5 9.3
Services 4.3 9.1 3.6 12.0 13.0 -3.5 -2.0 6.8 7.4
Computers 11.3 5.8 14.2 8.4 1.3 -2.4 5.2 9.5 9.5
Semiconductors 38.3 -6.0 17.6 2.1 29.1 -12.7 28.2 11.0 11.0
Core Goods 1/ 4.8 7.2 7.2 9.9 8.4 -3.1 -3.1 10.8 10.2
Imports of G&S 5.1 10.9 5.2 4.1 0.9 -6.8 -7.4 8.8 8.3
Services 3.3 8.8 2.3 7.1 2.0 0.2 -3.1 4.4 6.7
Oil 1.3 10.7 1.3 -8.2 0.0 0.3 -18.9 2.0 1.0
Natural Gas 1.3 4.9 13.7 -10.1 13.4 -24.0 -12.8 17.4 1.2
Computers 17.1 23.2 12.5 14.3 8.8 -11.3 27.8 13.6 15.5
Semiconductors -0.1 9.8 7.5 -0.8 3.6 -9.7 5.6 5.0 5.0
Core Goods 2/ 5.3 10.9 5.8 5.8 0.2 -9.8 -8.3 11.3 9.9
Billions of Chained 2005 Dollars
Net Goods & Services -603.9 -688.0 -722.7 -729.2 -647.7 -494.3 -355.9 -368.2 -379.7
Exports of G&S 1116.8 1222.8 1305.1 1422.0 1546.1 1629.3 1468.0 1628.9 1783.5
Imports of G&S 1720.7 1910.8 2027.8 2151.2 2193.8 2123.5 1823.9 1997.1 2163.1
________________________________________________________________________________________________________________
Billions of dollars
US CURRENT ACCOUNT BALANCE -521.5 -631.1 -748.7 -803.5 -726.6 -706.1 -422.1 -479.2 -502.8
Current Acct as Percent of GDP -4.7 -5.3 -5.9 -6.0 -5.2 -4.9 -3.0 -3.2 -3.2
Net Goods & Services (BOP) -495.0 -610.0 -715.3 -760.4 -701.4 -695.9 -379.2 -470.4 -500.9
Investment Income, Net 51.0 73.4 78.8 54.7 97.9 125.5 92.8 122.3 125.3
Direct, Net 112.7 150.9 173.2 174.0 236.7 249.9 204.1 226.1 246.4
Portfolio, Net -61.7 -77.5 -94.4 -119.4 -138.8 -124.3 -111.2 -103.8 -121.1
Other Income & Transfers,Net -77.5 -94.5 -112.2 -97.9 -123.1 -135.7 -135.8 -131.1 -127.2
________________________________________________________________________________________________________________
1. Merchandise exports excluding computers and semiconductors.
2. Merchandise imports excluding oil, natural gas, computers, and semiconductors.
Class II FOMC - Restricted (FR) I-50
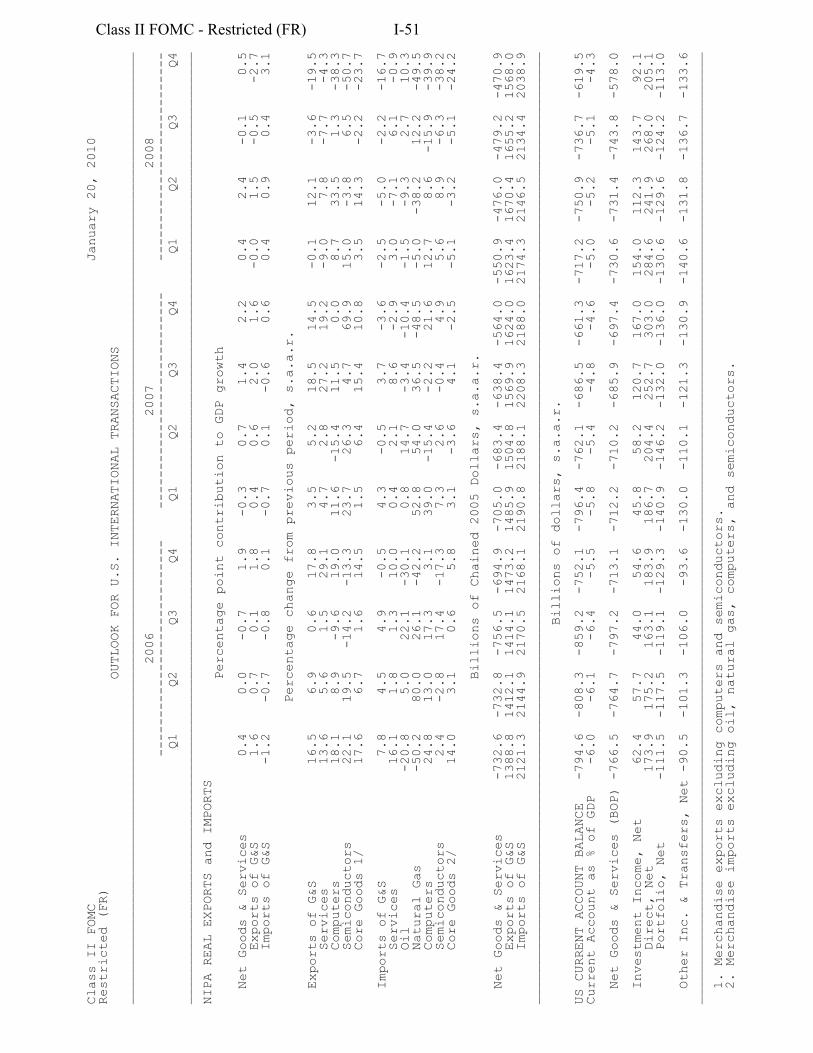
Class II FOMC January 20, 2010
Restricted (FR)
OUTLOOK FOR U.S. INTERNATIONAL TRANSACTIONS
___________________________________________________________________________________________________________________________
2006 2007 2008
---------------------------- ---------------------------- ---------------------------
Q1 Q2 Q3 Q4 Q1 Q2 Q3 Q4 Q1 Q2 Q3 Q4
___________________________________________________________________________________________________________________________
NIPA REAL EXPORTS and IMPORTS
Percentage point contribution to GDP growth
Net Goods & Services 0.4 0.0 -0.7 1.9 -0.3 0.7 1.4 2.2 0.4 2.4 -0.1 0.5
Exports of G&S 1.6 0.7 0.1 1.8 0.4 0.6 2.0 1.6 -0.0 1.5 -0.5 -2.7
Imports of G&S -1.2 -0.7 -0.8 0.1 -0.7 0.1 -0.6 0.6 0.4 0.9 0.4 3.1
Percentage change from previous period, s.a.a.r.
Exports of G&S 16.5 6.9 0.6 17.8 3.5 5.2 18.5 14.5 -0.1 12.1 -3.6 -19.5
Services 13.6 5.6 1.5 29.1 4.7 2.8 27.2 19.2 -9.0 7.8 -7.7 -4.3
Computers 18.1 8.9 -9.6 19.0 11.6 -15.4 11.5 0.0 8.7 33.5 1.3 -38.3
Semiconductors 22.1 19.5 -14.2 -13.3 23.7 26.3 4.7 69.9 15.0 -3.8 6.5 -50.7
Core Goods 1/ 17.6 6.7 1.6 14.5 1.5 6.4 15.4 10.8 3.5 14.3 -2.2 -23.7
Imports of G&S 7.8 4.5 4.9 -0.5 4.3 -0.5 3.7 -3.6 -2.5 -5.0 -2.2 -16.7
Services 16.1 1.8 1.3 10.0 0.4 2.1 8.6 -2.9 3.0 -7.1 6.1 -0.9
Oil -20.8 5.0 22.1 -30.1 0.8 14.7 -3.4 -10.4 -1.5 -9.3 2.7 10.3
Natural Gas -50.2 80.0 26.1 -42.2 52.8 54.0 36.5 -48.5 -5.0 -38.2 12.2 -49.5
Computers 24.8 13.0 17.3 3.1 39.0 -15.4 -2.2 21.6 12.7 8.6 -15.9 -39.9
Semiconductors 2.4 -2.8 17.4 -17.3 7.3 2.6 -0.4 4.9 5.6 8.9 -6.3 -38.2
Core Goods 2/ 14.0 3.1 0.6 5.8 3.1 -3.6 4.1 -2.5 -5.1 -3.2 -5.1 -24.2
Billions of Chained 2005 Dollars, s.a.a.r.
Net Goods & Services -732.6 -732.8 -756.5 -694.9 -705.0 -683.4 -638.4 -564.0 -550.9 -476.0 -479.2 -470.9
Exports of G&S 1388.8 1412.1 1414.1 1473.2 1485.9 1504.8 1569.9 1624.0 1623.4 1670.4 1655.2 1568.0
Imports of G&S 2121.3 2144.9 2170.5 2168.1 2190.8 2188.1 2208.3 2188.0 2174.3 2146.5 2134.4 2038.9
___________________________________________________________________________________________________________________________
Billions of dollars, s.a.a.r.
US CURRENT ACCOUNT BALANCE -794.6 -808.3 -859.2 -752.1 -796.4 -762.1 -686.5 -661.3 -717.2 -750.9 -736.7 -619.5
Current Account as % of GDP -6.0 -6.1 -6.4 -5.5 -5.8 -5.4 -4.8 -4.6 -5.0 -5.2 -5.1 -4.3
Net Goods & Services (BOP) -766.5 -764.7 -797.2 -713.1 -712.2 -710.2 -685.9 -697.4 -730.6 -731.4 -743.8 -578.0
Investment Income, Net 62.4 57.7 44.0 54.6 45.8 58.2 120.7 167.0 154.0 112.3 143.7 92.1
Direct, Net 173.9 175.2 163.1 183.9 186.7 204.4 252.7 303.0 284.6 241.9 268.0 205.1
Portfolio, Net -111.5 -117.5 -119.1 -129.3 -140.9 -146.2 -132.0 -136.0 -130.6 -129.6 -124.2 -113.0
Other Inc. & Transfers, Net -90.5 -101.3 -106.0 -93.6 -130.0 -110.1 -121.3 -130.9 -140.6 -131.8 -136.7 -133.6
___________________________________________________________________________________________________________________________
1. Merchandise exports excluding computers and semiconductors.
2. Merchandise imports excluding oil, natural gas, computers, and semiconductors.
Class II FOMC - Restricted (FR) I-51
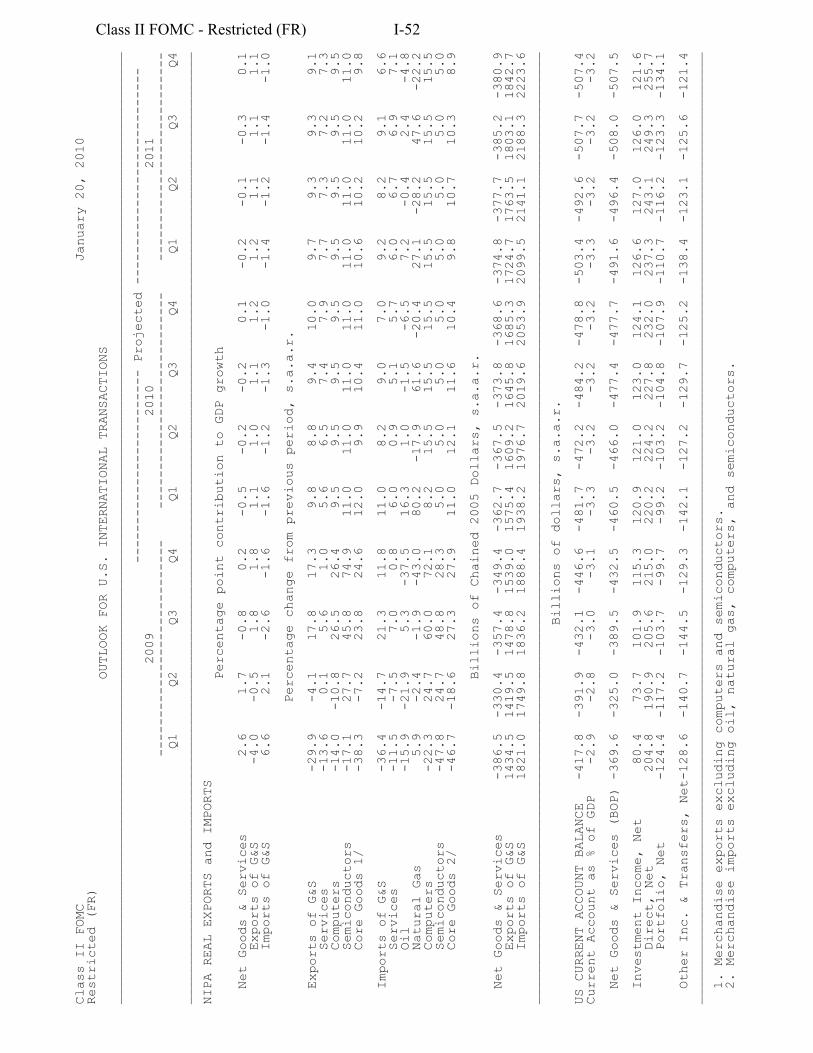
Class II FOMC January 20, 2010
Restricted (FR)
OUTLOOK FOR U.S. INTERNATIONAL TRANSACTIONS
___________________________________________________________________________________________________________________________
------------------------- Projected ----------------------------
2009 2010 2011
---------------------------- ---------------------------- ---------------------------
Q1 Q2 Q3 Q4 Q1 Q2 Q3 Q4 Q1 Q2 Q3 Q4
___________________________________________________________________________________________________________________________
NIPA REAL EXPORTS and IMPORTS
Percentage point contribution to GDP growth
Net Goods & Services 2.6 1.7 -0.8 0.2 -0.5 -0.2 -0.2 0.1 -0.2 -0.1 -0.3 0.1
Exports of G&S -4.0 -0.5 1.8 1.8 1.1 1.0 1.1 1.2 1.2 1.1 1.1 1.1
Imports of G&S 6.6 2.1 -2.6 -1.6 -1.6 -1.2 -1.3 -1.0 -1.4 -1.2 -1.4 -1.0
Percentage change from previous period, s.a.a.r.
Exports of G&S -29.9 -4.1 17.8 17.3 9.8 8.8 9.4 10.0 9.7 9.3 9.3 9.1
Services -13.6 0.1 5.6 1.0 5.6 6.5 7.4 7.9 7.7 7.3 7.2 7.3
Computers -14.0 -10.8 26.5 26.4 9.5 9.5 9.5 9.5 9.5 9.5 9.5 9.5
Semiconductors -17.1 27.7 45.8 74.9 11.0 11.0 11.0 11.0 11.0 11.0 11.0 11.0
Core Goods 1/ -38.3 -7.2 23.8 24.6 12.0 9.9 10.4 11.0 10.6 10.2 10.2 9.8
Imports of G&S -36.4 -14.7 21.3 11.8 11.0 8.2 9.0 7.0 9.2 8.2 9.1 6.6
Services -11.5 -7.5 7.0 0.8 6.0 0.9 5.1 5.7 6.0 6.7 6.9 7.1
Oil -15.9 -21.9 5.3 -37.5 16.3 1.0 -1.5 -6.5 7.2 -0.4 2.4 -4.8
Natural Gas 5.9 -2.4 -1.9 -43.0 80.2 -17.9 61.6 -20.4 27.1 -28.2 47.6 -22.2
Computers -22.3 24.7 60.0 72.1 8.2 15.5 15.5 15.5 15.5 15.5 15.5 15.5
Semiconductors -47.8 24.7 48.8 28.3 5.0 5.0 5.0 5.0 5.0 5.0 5.0 5.0
Core Goods 2/ -46.7 -18.6 27.3 27.9 11.0 12.1 11.6 10.4 9.8 10.7 10.3 8.9
Billions of Chained 2005 Dollars, s.a.a.r.
Net Goods & Services -386.5 -330.4 -357.4 -349.4 -362.7 -367.5 -373.8 -368.6 -374.8 -377.7 -385.2 -380.9
Exports of G&S 1434.5 1419.5 1478.8 1539.0 1575.4 1609.2 1645.8 1685.3 1724.7 1763.5 1803.1 1842.7
Imports of G&S 1821.0 1749.8 1836.2 1888.4 1938.2 1976.7 2019.6 2053.9 2099.5 2141.1 2188.3 2223.6
___________________________________________________________________________________________________________________________
Billions of dollars, s.a.a.r.
US CURRENT ACCOUNT BALANCE -417.8 -391.9 -432.1 -446.6 -481.7 -472.2 -484.2 -478.8 -503.4 -492.6 -507.7 -507.4
Current Account as % of GDP -2.9 -2.8 -3.0 -3.1 -3.3 -3.2 -3.2 -3.2 -3.3 -3.2 -3.2 -3.2
Net Goods & Services (BOP) -369.6 -325.0 -389.5 -432.5 -460.5 -466.0 -477.4 -477.7 -491.6 -496.4 -508.0 -507.5
Investment Income, Net 80.4 73.7 101.9 115.3 120.9 121.0 123.0 124.1 126.6 127.0 126.0 121.6
Direct, Net 204.8 190.9 205.6 215.0 220.2 224.2 227.8 232.0 237.3 243.1 249.3 255.7
Portfolio, Net -124.4 -117.2 -103.7 -99.7 -99.2 -103.2 -104.8 -107.9 -110.7 -116.2 -123.3 -134.1
Other Inc. & Transfers, Net-128.6 -140.7 -144.5 -129.3 -142.1 -127.2 -129.7 -125.2 -138.4 -123.1 -125.6 -121.4
___________________________________________________________________________________________________________________________
1. Merchandise exports excluding computers and semiconductors.
2. Merchandise imports excluding oil, natural gas, computers, and semiconductors.
Class II FOMC - Restricted (FR) I-52
Class II FOMC—Restricted (FR)
Abbreviations
AFE advanced foreign economy
BOE Bank of England
BOJ Bank of Japan
C&I commercial and industrial
CPI consumer price index
E&S equipment and software
ECB European Central Bank
EEB extended and emergency unemployment benefits
EME emerging market economy
FOMC Federal Open Market Committee; also, the Committee
GDP gross domestic product
IP industrial production
LP LoanPerformance
MBS mortgage-backed securities
NAIRU non-accelerating inflation rate of unemployment
OECD Organisation for Economic Co-operation and Development
PCE personal consumption expenditures
PMI purchasing managers index
WTI West Texas Intermediate
I-53 Last page of Part 1