Embed Size (px)
Citation preview
Publications of the Astronomical Society of Australia (PASA)doi: 10.1017/pas.2019.xxx.
GREENBURST: a commensal fast radio burst searchback-end for the Green Bank Telescope
Mayuresh P. Surnis1,2∗, D. Agarwal1,2, D. R. Lorimer1,2, X. Pei3, G. Foster4, A. Karastergiou4,5,6,G. Golpayegani1,2, R. J. Maddalena7, S. White7, W. Armour8, J. Cobb9, M.A. McLaughlin1,2,D.H.E. MacMahon9, A.P.V. Siemion9,10,11, D. Werthimer9 and C.J. Williams4
1West Virginia University, Department of Physics and Astronomy, P. O. Box 6315, Morgantown, WV, USA2Center for Gravitational Waves and Cosmology, West Virginia University, Chestnut Ridge Research Building,Morgantown, WV, USA3Xinjiang Astronomical Observatory, Chinese Academy of Sciences, Urumqi, Xinjiang 830011, China4University of Oxford, Sub-Department of Astrophysics, Denys Wilkinson Building, Keble Road, Oxford, OX1 3RH,United Kingdom5Physics Department, University of the Western Cape, Cape Town 7535, South Africa6Department of Physics and Electronics, Rhodes University, PO Box 94, Grahamstown 6140, South Africa7Green Bank Observatory, P.O. Box 2, Green Bank, WV 24944, USA8OeRC, Department of Engineering Science, University of Oxford, Keble Road, Oxford OX1 3QG, UK9Department of Astronomy, University of California, Berkeley, 501 Campbell Hall #3411, Berkeley, CA 94720, USA10Radboud University, Nijmegen, 6525 HP, the Netherlands11SETI Institute, Mountain View, CA 94043, USA
AbstractWe describe the design and deployment of GREENBURST, a commensal Fast Radio Burst (FRB)search system at the Green Bank Telescope. GREENBURST uses the dedicated L-band receiver tap tosearch over the 960–1920 MHz frequency range for pulses with dispersion measures out to 104 pc cm−3.Due to its unique design, GREENBURST will obtain data even when the L-band receiver is notbeing used for scheduled observing. This makes it a sensitive single pixel detector capable of reachingdeeper in the radio sky. While single pulses from Galactic pulsars and rotating radio transients will bedetectable in our observations, and will form part of the database we archive, the primary goal is todetect and study FRBs. Based on recent determinations of the all-sky rate, we predict that the systemwill detect approximately one FRB for every 2−3 months of continuous operation. The high sensitivityof GREENBURST means that it will also be able to probe the slope of the FRB source function, whichis currently uncertain in this observing band.
Keywords: instrumentation: miscellaneous – radio continuum: transients
1 INTRODUCTION
Fast Radio Bursts (FRBs) are characterized by theirmillisecond duration and radio-frequency dispersion thatfar exceeds that predicted to result from interactionswith free electrons in the Milky Way (Lorimer et al., 2007;Thornton et al., 2013). Over the past decade, a numberof significant observations have been made, includingdetections from 400 MHz (CHIME/FRB Collaborationet al., 2019a) to 8 GHz (Gajjar et al., 2018; Zhang et al.,2018), FRBs with extreme implied distances (Bhandariet al., 2018), and the repeating sources FRB 121102(Spitler et al., 2016) and FRB 180814 (CHIME/FRB
∗E-mail: [email protected]
Collaboration et al., 2019b). The source FRB 121102has been associated with a dwarf galaxy at redshiftz = 0.19 (Marcote et al., 2017) and shows extremeFaraday rotation (Michilli et al., 2018), demonstratingthat it is situated in a dense region in its host galaxy.
FRBCAT1 (Petroff et al., 2016) provides an up-to-datecatalog of reported FRB detections with 65 reportedFRBs at the time of writing this paper. Recently, therehas been a significant increase in the number of reportedFRBs as new wide field of view (FoV) arrays have be-gan operating. The Australian Square Kilometre ArrayPathfinder (ASKAP), when observing in ‘fly’s eye’ mode
1http://frbcat.org
1
arX
iv:1
903.
0557
3v1
[as
tro-
ph.I
M]
13
Mar
201
9

2 Surnis et al.
to maximize sky coverage, has detected 20 FRBs (Shan-non et al., 2018). Initial observations with Canadian Hy-drogen Intensity Mapping Experiment (CHIME) havealso resulted in 13 FRB detections (CHIME/FRB Col-laboration et al., 2019a) including the repeating sourceFRB 180814 (CHIME/FRB Collaboration et al., 2019b).
Prior to ASKAP and CHIME, most of the FRBs weredetected with the 64-m Parkes radio telescope. Onlytwo FRBs have been detected with the Robert C. ByrdGreen Bank Telescope (GBT). The first, FRB 110523(Masui et al., 2015), was detected in archival GBT dataacquired with the the prime focus 800-MHz receiver(700–900 MHz). This detection – with a telescope otherthan Parkes – provided strong evidence that FRBs werein fact astrophysical. Recently, multiple bursts fromthe repeating source FRB121102 were detected (Gajjaret al., 2018; Zhang et al., 2018) using the GBT C-Band(4−8 GHz) receiver, while the Green Bank NorthernCelestial Cap (GBNCC) Pulsar Survey at 350 MHz re-ported a non-detection of FRBs (Chawla et al., 2017).Recently, Golpayegani & Lorimer (2019) also reportednon-detection of FRBs at L-band using the 20 m tele-scope on the GBT site.
Wide FoV arrays have been very successful in detect-ing FRBs, but there still exists a strong motivation forusing high-gain, single-element telescopes for FRB sur-veys. Though the GBT has a narrow FoV compared tothat of ASKAP or Parkes, the GBT provides a signifi-cant increase in sensitivity, allowing for the detection oflow-fluence FRBs that would otherwise be missed. Thesedetections would provide an important contribution tofuture population studies.
Based on previous detections, FRBs show no preferredsky direction. As such, commensal data acquisition sys-tems provide augmented science output from an observa-tion at the additional cost of running dedicated hardware(Foster et al., 2018). For a fixed FoV, maximizing thetotal observing time also maximizes the event detec-tion rate. A dedicated splitter for the L-band receiverwas recently installed on the GBT. This allows for full-time observations using this receiver even when otherreceivers are at the Gregorian focus. These observationsat lower, but stil reasonable, sensitivity still provide vitaltime on the sky, hence maximizing the possibility of anFRB detection.In this work we discuss the design and implementa-
tion of the commensal FRB search back-end using thededicated L-band tap. We discuss the signal path andprocessing pipeline in §2. Initial test observations toverify the pipeline are covered in §3. We also discuss thesurvey sensitivity and expected detection rates in §4.
2 SYSTEM DESCRIPTION
GREENBURST is inspired from its predecessor atthe Arecibo Telescope, SETIBURST (Chennamangalam
et al., 2017), and works in parallel with a duplicateSERENDIP VI system at the GBT. Although the con-cept for GREENBURST is derived from SETIBURST,it differs in implementation significantly. The back-endconsists of three sub-systems, the commensal modifica-tions at the front-end, the ROACH2 Field ProgrammableGate Array (FPGA) board2 for signal processing, andan FRB search system. We describe each of these in thesubsections below.
2.1 L-band Receiver CommensalModifications
The GBT has an unblocked aperture with an off-axisarm containing an eight-position feed turret. The front-end analogue electronics are situated below a secondaryreflector, 8 m in diameter. A circular turret with eightpositions is used to select the primary observing receiver.In an earlier test, Maddalena (2013) found that apartfrom the focus position, the L-band (1–2 GHz) feed canbe used for commensal observing in four more positionswith decreasing sensitivity relative to the focus position.We have added a directional coupler to the L-band feedto allow commensal mode observations even when thefeed is not being used as the primary observing feed.
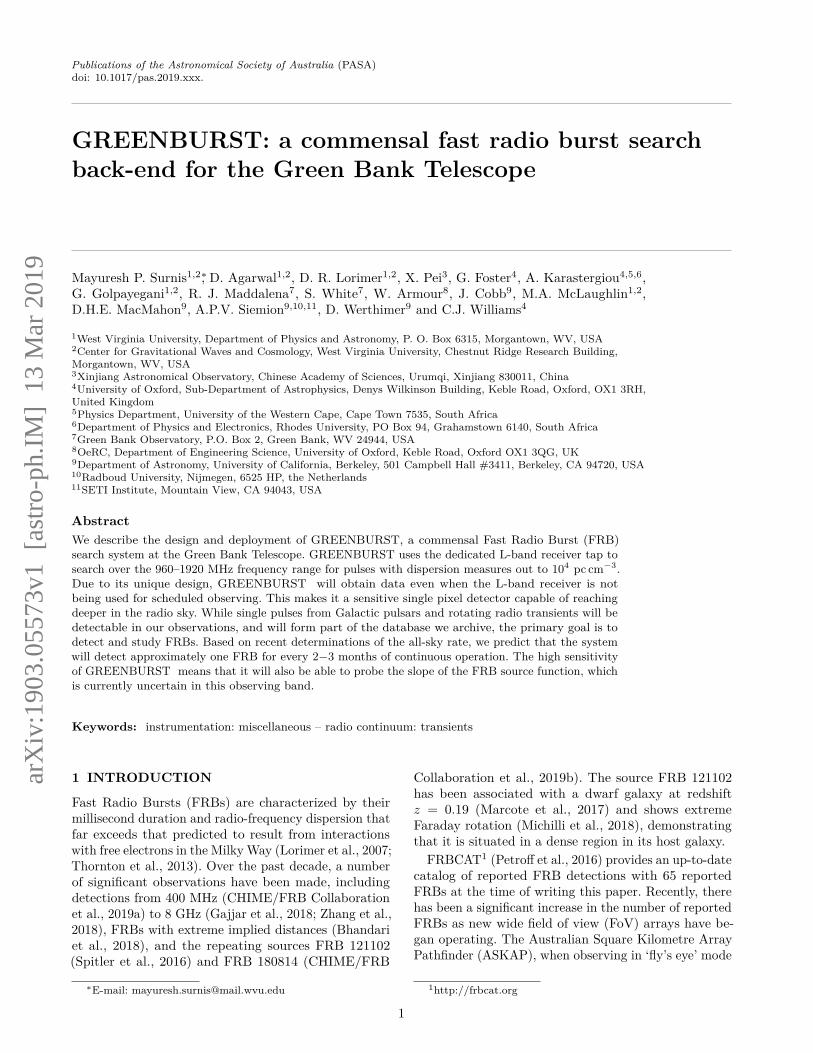
The dual-polarization L-band Radio Frequency (RF)signal received from the feed (denoted as X and Y inFig. 1) travels through the front-end electronics whichconsists of an optional circular polarization synthesizer,Low-Noise Amplifier (LNA), noise calibrator, and a user-selectable notch filter.3 We installed two directional cou-plers (one for each of the polarizations) with 20 dBgain in the L-band signal chain between the notch filterand the intermediate frequency (IF) system (see Fig. 1).The output from the coupler is then transmitted to theequipment room through an optical fibre and digitized.We added isolators before the couplers to minimize re-flections which were inducing ripples across the receiverbandpass.
We then conducted tests to ensure that the additionalcomponents do not affect regular observations. In thesetests, we observed in the direction of the North celestialpole at night, under good weather. This reduced the pos-sibility of introducing changes in spillover from ground,elevation/atmosphere, the sky, and baseline shapes fromstanding waves in the optics due to solar illumination.We conducted an 11-minute observation using the digitalcontinuum receiver (DCR) to cover the entire L-bandfrequency range of 1150–1730 MHz. The addition of thecoupler resulted in a negligible change in system tem-perature. We also conducted 40-minute observations inthe single window spectral mode at centre frequenciesof 1365, 1400, 1420 and 1665 MHz with a bandwidth
2https://casper.berkeley.edu/wiki/ROACH23The notch filter is a user-selectable filter to suppress a known
radar signal in the frequency band between 1200–1310 MHz
GREENBURST commensal fast radio burst search 3
XY
Front End Electronics
Notch Filter
Notch Filter
DirectionalCoupler
DirectionalCoupler
GBT IFSystem
ValonSynthesizer
Equipment RoomReceiver Room
AD
CA
DC
4K Channel
PFB
8 x 10GbE
Correlator
SERENDIPVI
Accumulator&
Packetizer
1 x 1GbE
FRB SearchMachine
Figure 1. Block diagram showing the signal chain for the regular (blue components) and commensal mode (green components) forthe L-band receiver. The signal chain on the left of the dashed red line is located in the receiver room, while the chain on the right islocated in the equipment room. The signal travels on an optical fiber from the receiver room to the equipment room.
of 20 MHz to ensure that the spectral-line data qualitydid not suffer due to the insertion of the couplers. Weconcluded that the insertion of the couplers in the signalchain did not degrade the data quality.
2.2 Modified SERENDIP VI FPGA Design
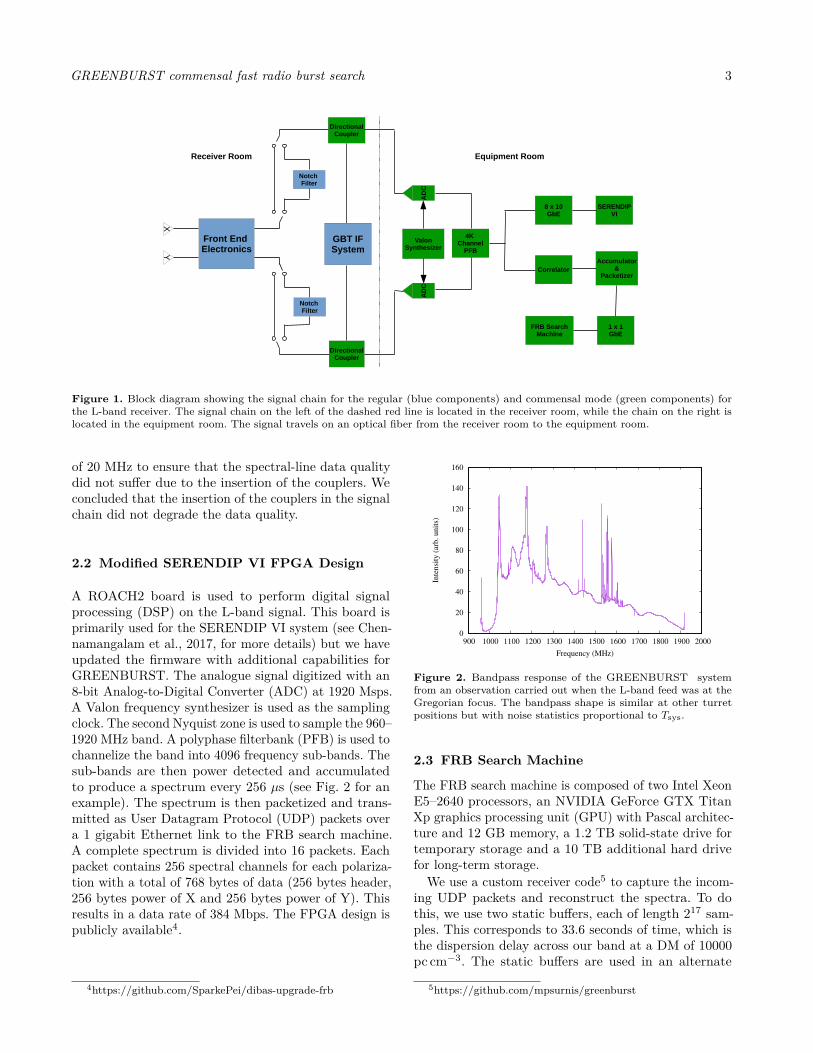
A ROACH2 board is used to perform digital signalprocessing (DSP) on the L-band signal. This board isprimarily used for the SERENDIP VI system (see Chen-namangalam et al., 2017, for more details) but we haveupdated the firmware with additional capabilities forGREENBURST. The analogue signal digitized with an8-bit Analog-to-Digital Converter (ADC) at 1920 Msps.A Valon frequency synthesizer is used as the samplingclock. The second Nyquist zone is used to sample the 960–1920 MHz band. A polyphase filterbank (PFB) is used tochannelize the band into 4096 frequency sub-bands. Thesub-bands are then power detected and accumulatedto produce a spectrum every 256 µs (see Fig. 2 for anexample). The spectrum is then packetized and trans-mitted as User Datagram Protocol (UDP) packets overa 1 gigabit Ethernet link to the FRB search machine.A complete spectrum is divided into 16 packets. Eachpacket contains 256 spectral channels for each polariza-tion with a total of 768 bytes of data (256 bytes header,256 bytes power of X and 256 bytes power of Y). Thisresults in a data rate of 384 Mbps. The FPGA design ispublicly available4.
4https://github.com/SparkePei/dibas-upgrade-frb
0
20
40
60
80
100
120
140
160
900 1000 1100 1200 1300 1400 1500 1600 1700 1800 1900 2000
Inte
nsi
ty (
arb. unit
s)
Frequency (MHz)
Figure 2. Bandpass response of the GREENBURST systemfrom an observation carried out when the L-band feed was at theGregorian focus. The bandpass shape is similar at other turretpositions but with noise statistics proportional to Tsys.
2.3 FRB Search Machine
The FRB search machine is composed of two Intel XeonE5–2640 processors, an NVIDIA GeForce GTX TitanXp graphics processing unit (GPU) with Pascal architec-ture and 12 GB memory, a 1.2 TB solid-state drive fortemporary storage and a 10 TB additional hard drivefor long-term storage.
We use a custom receiver code5 to capture the incom-ing UDP packets and reconstruct the spectra. To dothis, we use two static buffers, each of length 217 sam-ples. This corresponds to 33.6 seconds of time, which isthe dispersion delay across our band at a DM of 10000pc cm−3. The static buffers are used in an alternate
5https://github.com/mpsurnis/greenburst
4 Surnis et al.
fashion, i.e. at a given time, one buffer is used to save acopy of the incoming spectra while the other is used towrite the previous data block to disk. The code writes221 spectra (corresponding to an integration time of∼537 s) to a single filterbank file. In order to avoidlosing candidate information in the last data block, wehave implemented an overlap of 33.6 seconds betweentwo consecutive filterbank files. Once a filterbank fileis created, the search pipeline carries out a single-pulsesearch covering a Dispersion Measure (DM) range of10−10000 pc cm−3. This search is performed using theGPU-accelerated heimdall program. The pipelinethen sifts through potential candidates and producesplots for most likely FRB candidates. Further detailsof the completed pipeline will be discussed in a futurepaper.
3 INITIAL OBSERVATIONS ANDSENSITIVITY TESTS
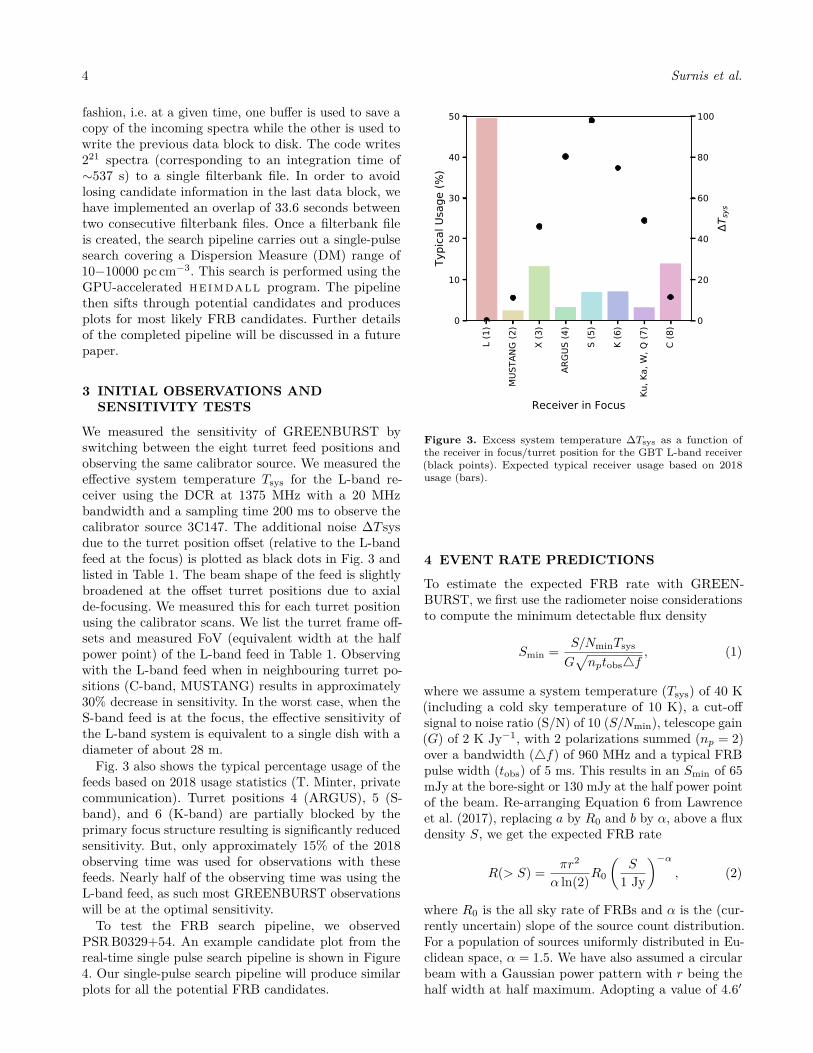
We measured the sensitivity of GREENBURST byswitching between the eight turret feed positions andobserving the same calibrator source. We measured theeffective system temperature Tsys for the L-band re-ceiver using the DCR at 1375 MHz with a 20 MHzbandwidth and a sampling time 200 ms to observe thecalibrator source 3C147. The additional noise ∆T sysdue to the turret position offset (relative to the L-bandfeed at the focus) is plotted as black dots in Fig. 3 andlisted in Table 1. The beam shape of the feed is slightlybroadened at the offset turret positions due to axialde-focusing. We measured this for each turret positionusing the calibrator scans. We list the turret frame off-sets and measured FoV (equivalent width at the halfpower point) of the L-band feed in Table 1. Observingwith the L-band feed when in neighbouring turret po-sitions (C-band, MUSTANG) results in approximately30% decrease in sensitivity. In the worst case, when theS-band feed is at the focus, the effective sensitivity ofthe L-band system is equivalent to a single dish with adiameter of about 28 m.
Fig. 3 also shows the typical percentage usage of thefeeds based on 2018 usage statistics (T. Minter, privatecommunication). Turret positions 4 (ARGUS), 5 (S-band), and 6 (K-band) are partially blocked by theprimary focus structure resulting is significantly reducedsensitivity. But, only approximately 15% of the 2018observing time was used for observations with thesefeeds. Nearly half of the observing time was using theL-band feed, as such most GREENBURST observationswill be at the optimal sensitivity.
To test the FRB search pipeline, we observedPSRB0329+54. An example candidate plot from thereal-time single pulse search pipeline is shown in Figure4. Our single-pulse search pipeline will produce similarplots for all the potential FRB candidates.
L (1
)
MUS
TANG
(2)
X (3
)
ARGU
S (4
)
S (5
)
K (6
)
Ku, K
a, W
, Q (7
)
C (8
)
Receiver in Focus
0
10
20
30
40
50
Typi
cal U
sage
(%)
0
20
40
60
80
100
T sys
Figure 3. Excess system temperature ∆Tsys as a function ofthe receiver in focus/turret position for the GBT L-band receiver(black points). Expected typical receiver usage based on 2018usage (bars).
4 EVENT RATE PREDICTIONS
To estimate the expected FRB rate with GREEN-BURST, we first use the radiometer noise considerationsto compute the minimum detectable flux density
Smin = S/NminTsys
G√nptobs4f
, (1)
where we assume a system temperature (Tsys) of 40 K(including a cold sky temperature of 10 K), a cut-offsignal to noise ratio (S/N) of 10 (S/Nmin), telescope gain(G) of 2 K Jy−1, with 2 polarizations summed (np = 2)over a bandwidth (4f) of 960 MHz and a typical FRBpulse width (tobs) of 5 ms. This results in an Smin of 65mJy at the bore-sight or 130 mJy at the half power pointof the beam. Re-arranging Equation 6 from Lawrenceet al. (2017), replacing a by R0 and b by α, above a fluxdensity S, we get the expected FRB rate
R(> S) = πr2
α ln(2)R0
(S
1 Jy
)−α, (2)
where R0 is the all sky rate of FRBs and α is the (cur-rently uncertain) slope of the source count distribution.For a population of sources uniformly distributed in Eu-clidean space, α = 1.5. We have also assumed a circularbeam with a Gaussian power pattern with r being thehalf width at half maximum. Adopting a value of 4.6′

GREENBURST commensal fast radio burst search 5
Table 1 A summary of the relevant parameters for all GBT turret positions. From left to right, the columns list turretposition, feeds currently in position, approximate turret rotation angle corresponding to the position offset from the L-bandposition, the offsets in azimuth and elevation, the excess system temperature for the L-band receiver as compared to the focusposition, the measured FoV of the telescope beam, the antenna temperature, aperture efficiency, telescope gain, estimatedsensitivity at the half-power point, usage based on total on-sky time in 2018 and our estimated FRB rate (see text).
Turret Receiver Rotation ∆ Az ∆ El ∆Tsys FoV TA η G Smin Usage FRB rateposition angle (◦) (’) (’) (K) (’) (K) (K/Jy) (Jy) (%) (yr−1)
1 L-band 0 0.0 0.0 0.0 9.2 37.45 0.70 2.0 0.130 41.7 2−62 MUSTANG 300 22.5 −13.2 11.1 9.4 28.06 0.52 1.4 0.236 2.1 0.05−0.23 X-band 260 25.3 −30.2 46.1 9.5 14.01 0.26 0.7 0.794 11.2 0.1−0.34 ARGUS 220 16.2 −45.7 80.3 10.8 8.26 0.15 0.4 1.936 2.8 0.01−0.045 S-band 180 0.0 −51.5 98.0 10.8 4.28 0.08 0.2 4.454 5.9 0.01−0.046 K-band 140 −16.9 −45.2 74.7 10.3 6.97 0.13 0.4 1.856 6.0 0.02−0.087 Ku-band† 100 −25.4 −29.8 49.0 9.6 14.94 0.28 0.8 0.718 2.7 0.02−0.088 C-band 60 −22.1 −12.5 11.5 9.3 28.84 0.54 1.5 0.224 11.8 0.3−1.0
† Turret position 7 also houses Ka-band, W-band and Q-band feeds in rotation.
0.0
0.2
0.4
0.6
0.8
1.0
Flux
(Arb
. Uni
ts)
1000
1200
1400
1600
1800
Freq
uenc
uy (M
Hz)
200 100 0 100 200Time (ms)
0
10
20
30
40
50
DM (p
c/cc
)
Figure 4. Candidate plot showing a single pulse detected fromPSRB0329+54 with the GREENBURST pipeline. Top panelshows the pulse in time, middle panel shows the de-dispersedpulse as a function of frequency, and the bottom panel shows thepulse in DM-time plane.
0
20
40
60
80
100
120
140
0.6 0.7 0.8 0.9 1 1.1 1.2
Day
s to
Det
ecti
on
α
Figure 5. Predicted number of days to the first FRB detectionwith GREENBURST as a function of α. The dotted line in themiddle denotes the mean while the dot-dashed lines denote the95% confidence intervals
for r (see Table 1), 0.91 for α and a maximum sky rateR0 of 924 FRB events per sky per day (Lawrence et al.,2017) results in a maximum rate of 5 × 10⁻² FRB eventsper day for GREENBURST. Inverting the rate gives usthe minimum wait time of 20 days before the first FRBdetection. Figure 5 shows the ranges of the wait timesbased on the 95% confidence intervals on α and R0 asreported by Lawrence et al. (2017). For a mean value of0.91 for α and 587 FRB events per sky per day for R0 (asreported by Lawrence et al., 2017), we get a mean waittime of 32 days of continuous operation at the Gregorianfocus (turret position 1) for GREENBURST. Using themethod described above, we have estimated Smin andthe projected FRB rates for other turret positions inTable 1. We expect a combined expected FRB rate of2–7 per year of operation.
6 Surnis et al.
5 DISCUSSION
We have estimated the wait time for the first FRB de-tection adopting the all-sky rate from Lawrence et al.(2017). Based on the usage statistics for the GBT in year2018, the L-band feed was used for scientific observationsfor approximately 2970 hours out of a total of about 7125hours of on-sky time (T. Minter, private communication).For the 95% confidence interval range of the all-sky FRBrates (Lawrence et al., 2017), we project that GREEN-BURST would detect between 2−6 FRBs per year. Thisrate estimate includes the time L-band was used at theGregorian focus. The adjacent turret positions (position2 and 8) constitute an additional 1000 hours of observingtime. With an 11 K excess ∆Tsys, this would result in oneadditional FRB per year. The remaining time at otherturret positions may result in more serendipitous detec-tions, especially of low-DM and high-brightness eventssuch as the recently discovered ASKAP (Shannon et al.,2018) and CHIME (CHIME/FRB Collaboration et al.,2019a) FRBs. Given this rate, even a non-detectionwould be useful in constraining the value of α towardsthe higher end in Figure 5. Assuming that 2018 usageindicates typical GBT usage, we get about 123 days ofobservations at the maximum sensitivity. Even if halfof these data are corrupted by Radio-frequency Interfer-ence (RFI), a non-detection would exclude all values ofα > 1. A limited number of detections in the first yearwould also help putting useful constraints on the val-ues of R0, which is the instrument-independent all-skyFRB rate. Thus, GREENBURST is a promising FRBinstrument regardless of the outcome.
Most current FRB back-ends search multiple beams(e.g. ASKAP, CHIME, Parkes, ALFABURST etc.), whileGREENBURST is a single-beam survey. Although thisreduces sky coverage, the high sensitivity of the GBT stillmeans it has the potential to detect FRBs. This increasesthe search volume in redshift and thus compensatesfor the lack of sky coverage. If a repeating FRB weredetected with GREENBURST, the narrow telescopebeam would reduce the prospective sky area for follow-up observations. This would speed-up the identificationof the host galaxy associated with the FRB.
The GREENBURST pipeline will carry out a blindsearch for single-pulses over a large DM range. Thisrange includes Galactic DMs as well. Thus, in additionto FRBs, our pipeline may also discover radio tran-sients in our Galaxy. The distinct advantage providedby the commensal mode observing is that GREEN-BURST would be recording data all the time, enablingit to make serendipitous discovery of a Galactic radiotransient. We have already made such a discovery withthe ALFABURST while the telescope was slewing be-tween targets (Foster et al., 2018). In addition, GREEN-BURST may detect more radio pulses from known
rotating radio transients (RRATs)6.We have a working pipeline, and at the time of writing,
have acquired data for a week. We are currently carryingout data quality checks and tuning our search pipeline tothe observed RFI in the data. We are also ascertainingwhether all the metadata are properly logged by cross-referencing them with the GBT logs. GREENBURST isexiting its commissioning phase and would soon startsearching for FRBs in real-time.
6 ACKNOWLEDGEMENTS
We thank West Virginia University for its financial support ofGBT operations, which enabled some of the observations forthis project. M.P.S., M.A.M. and D.R.L. acknowledge supportfrom NSF RII Track I award number OIA−1458952. M.P.S.,M.A.M., G.G. and D.R.L. are members of the NANOGravPhysics Frontiers Center which is supported by NSF award1430284. Berkeley efforts were supported by NSF grants1407804 and 1711254, as well as the Marilyn and WatsonAlberts SETI Chair funds. The Green Bank Observatory isa facility of the National Science Foundation operated undercooperative agreement by Associated Universities, Inc.
REFERENCES
Bhandari S., et al., 2018, MNRAS, 475, 1427CHIME/FRB Collaboration et al., 2019a, Nature, 566,230
CHIME/FRB Collaboration et al., 2019b, Nature, 566,235
Chawla P., et al., 2017, ApJ, 844, 140Chennamangalam J., et al., 2017, ApJS, 228, 21Foster G., et al., 2018, MNRAS, 474, 3847Gajjar V., et al., 2018, ApJ, 863, 2Golpayegani G., Lorimer D., 2019, in American Astro-nomical Society Meeting Abstracts #233. p. 110.01
Lawrence E., Vander Wiel S., Law C., Burke Spolaor S.,Bower G. C., 2017, AJ, 154, 117
Lorimer D. R., Bailes M., McLaughlin M. A., NarkevicD. J., Crawford F., 2007, Science, 318, 777
Maddalena R. J., 2013, Technical Report 285, Prop-erties of the GBT at L-band for CommensalObserving, https://library.nrao.edu/public/memos/gbt/GBT_285.pdf. NRAO, Green Bank, WV,https://library.nrao.edu/public/memos/gbt/GBT_285.pdf
Marcote B., et al., 2017, ApJ, 834, L8Masui K., et al., 2015, Nature, 528, 523Michilli D., et al., 2018, Nature, 553, 182Petroff E., et al., 2016, PASA, 33, e045Shannon R. M., et al., 2018, Nature, 562, 386Spitler L. G., et al., 2016, Nature, 531, 202
6http://astro.phys.wvu.edu/rratalog
GREENBURST commensal fast radio burst search 7
Thornton D., et al., 2013, Science, 341, 53Zhang Y. G., Gajjar V., Foster G., Siemion A., CordesJ., Law C., Wang Y., 2018, ApJ, 866, 149