Embed Size (px)
Citation preview
Greenhouse Gas Emissions in WalesFebruary 2013
This research paper replaces the previous Greenhouse Gas Emissions in Wales research paper to include the latest data up to 2010. It provides a short synopsis of the policy framework guiding action on greenhouse gas emissions. The paper examines total greenhouse gas emissions, carbon dioxide and methane emissions at a national and UK level using the ‘production’ and ‘end-user’ approaches. Also included is information on the per capita emissions and carbon dioxide emissions for each local authority in Wales. Comparisons cannot be made with data in previous versions of this paper, due to changes in the sources and methodologies used.
The National Assembly for Wales is the democratically elected body that represents the interests of Wales and its people, makes laws for Wales and holds the Welsh Government to account.
The Research Service provides expert and impartial research and information to support Assembly Members and committees in fulfilling the scrutiny, legislative and representative functions of the National Assembly for Wales.
Research Service briefings are compiled for the benefit of Assembly Members and their support staff. Authors are available to discuss the contents of these papers with Members and their staff but cannot advise members of the general public. We welcome comments on our briefings; please post or email to the addresses below.
An electronic version of this paper can be found on the National Assembly’s website at: www.assemblywales.org/research
Further hard copies of this paper can be obtained from: Research ServiceNational Assembly for WalesCardiff BayCF99 1NA
Email: [email protected]: @NAWResearch
© National Assembly for Wales Commission Copyright 2012The text of this document may be reproduced free of charge in any format or medium providing that it is reproduced accurately and not used in a misleading or derogatory context. The material must be acknowledged as copyright of the National Assembly for Wales Commission and the title of the document specified.
Enquiry no: 12/2185
Greenhouse Gas Emissions in WalesFebruary 2013
Gareth Thomas and Georgette Kluiters
Paper number: 13 / 006 The Research Service gratefully acknowledges the science policy fellowship provided to Ms Kluiters by the Biotechnology and Biological Sciences Research Council, who contributed to the completion of this paper.

Summary
This paper replaces a research paper titled Greenhouse Gas Emissions in Wales,
published in January 2012, to include data up to 2010. Comparisons with
previous publications cannot be made due to changes in the sources and
methodologies used.
In 2010, Wales emitted 46.6 Mega tonnes (Mt) of greenhouse gases using the
„production‟ approach; a 15 per cent reduction in emissions from the base year.
To reach the Welsh Government’s 2020 target of reducing net greenhouse
gas emissions by 40 per cent below the base year, emissions will need to be
reduced by a further 25 percentage points from base year emissions in ten
years.
In 2010, carbon dioxide comprised approximately 84 per cent of Wales‟ total
greenhouse gas emissions. In 2010 Wales emitted 39.1 Mt of carbon dioxide
using the ‘production’ approach; a 9.5 per cent reduction in emissions from
the 1990 base year.
Greenhouse gas emissions within the Welsh Government’s devolved
competence in 2010 were 31.8Mt. This was an increase of 6 per cent from
2009. However the Committee on Climate Change expect that emissions will
have decreased again in Wales in 2011. Over the baseline period of 2006-10,
average annual emissions within devolved competence were 32.9Mt. This means
that to meet the Welsh Government‟s target will require an annual reduction of
just under 1Mt from 2011.
On the basis of „end-user‟ emissions, Wales has achieved much higher emissions
reductions since the base year than if the „production‟ approach is used. In 2010
Wales emitted 41.4 Mt of ‘end-user’ greenhouse gases (excluding exports), a
reduction of 23.8 per cent from 1990.
Neath Port Talbot had the highest „end-user‟ carbon dioxide emissions of local
authorities in Wales in 2010, while Merthyr Tydfil had the lowest. Carbon
dioxide emissions per capita were lowest in the South Wales Valleys, Cardiff and
some parts of North Wales. When only carbon dioxide emissions within the
scope of local authorities‟ influence are considered, Cardiff had the highest „end-
user‟ carbon dioxide emissions in 2010, while Merthyr Tydfil had the lowest.

Contents
1. Introduction ..................................................................................................................................... 1
2. Policies and Targets ................................................................................................................... 2
2.1. International policy 3
2.2. European policy 4
2.3. UK policy 5
2.4. Wales policy 6
3. Measuring Greenhouse Gas Emissions............................................................................ 9
3.1. National Emissions calculations using the production approach 10
3.1.1. Total net greenhouse gas emissions 10
3.1.2. Carbon dioxide emissions 13
3.1.3. Methane emissions 17
3.2. National Emissions calculated using the „end-user‟ approach 18
3.2.1. „End-user‟ greenhouse gas emissions 19
3.2.2. „End-user‟ carbon dioxide emissions 20
3.2.3. „End-user‟ methane emissions 21
3.3. Greenhouse gas emissions within devolved competence 22
3.4. Comparison of changes in production and „end-user‟ emissions 25
3.5. Local authority carbon dioxide emissions 29
3.5.1. Total carbon dioxide emissions within local authorities 29
3.5.2. Carbon dioxide emissions that local authorities can influence 37
4. Useful links and further information............................................................................. 45
Annex A: Total net greenhouse gas and carbon dioxide emissions in Wales in
2010, by sector 46
1
Greenhouse Gas Emissions in Wales
1. Introduction
The earth‟s climate has been varying for millions of years, with some variation
being natural and expected. However, recent, rapid increases in pollution are
thought to have changed the composition of both the atmosphere and the oceans,
leading to an increase in the amount of heat retained within the planetary
circulation systems.
The United Nations Intergovernmental Panel on Climate Change (IPCC) Working
Group I concluded in their Fourth Assessment Report that there is compelling
scientific evidence that the activities of humankind are responsible for changing
the climate of the planet; stating that:
…most of the observed increase in global average temperature since the mid-20th
century is
very likely (>90 per cent probability of occurrence) to result from the observed increase in
anthropogenic GHG concentrations.1
This anthropogenic, or human-induced, change is what is usually referred to as
„climate change‟.2
The IPCC Fourth Assessment also stated in 2007 that there was:
High agreement and much evidence that with current climate change mitigation policies and
related sustainable development practices, global greenhouse gas emissions will continue to
grow over the next few decades.3
This paper concentrates on human-induced greenhouse gas emissions, providing
analysis of the recent changes in emissions in Wales and makes comparisons with
other UK countries.
Emissions of carbon dioxide are the most significant human-induced greenhouse
gas. In addition to total greenhouse gas emissions, this paper therefore looks at
carbon dioxide emissions, and also considers recent changes in methane
emissions.
1
United Nations Intergovernmental Panel on Climate Change, Climate Change 2007 : Synthesis Report, page39 [accessed
24 October 2012] THE IPCC Fifth Assessment Report is scheduled for completion in 2013-14.
2
It should be noted that a small minority of scientists claim that recent climate change is due to factors other than human-
induced greenhouse gas emissions or that climate change models are not reliable enough to predict the future climate
accurately.
3
United Nations Intergovernmental Panel on Climate Change, Climate Change 2007 : Synthesis Report, page44 [accessed
24 October 2012]
2
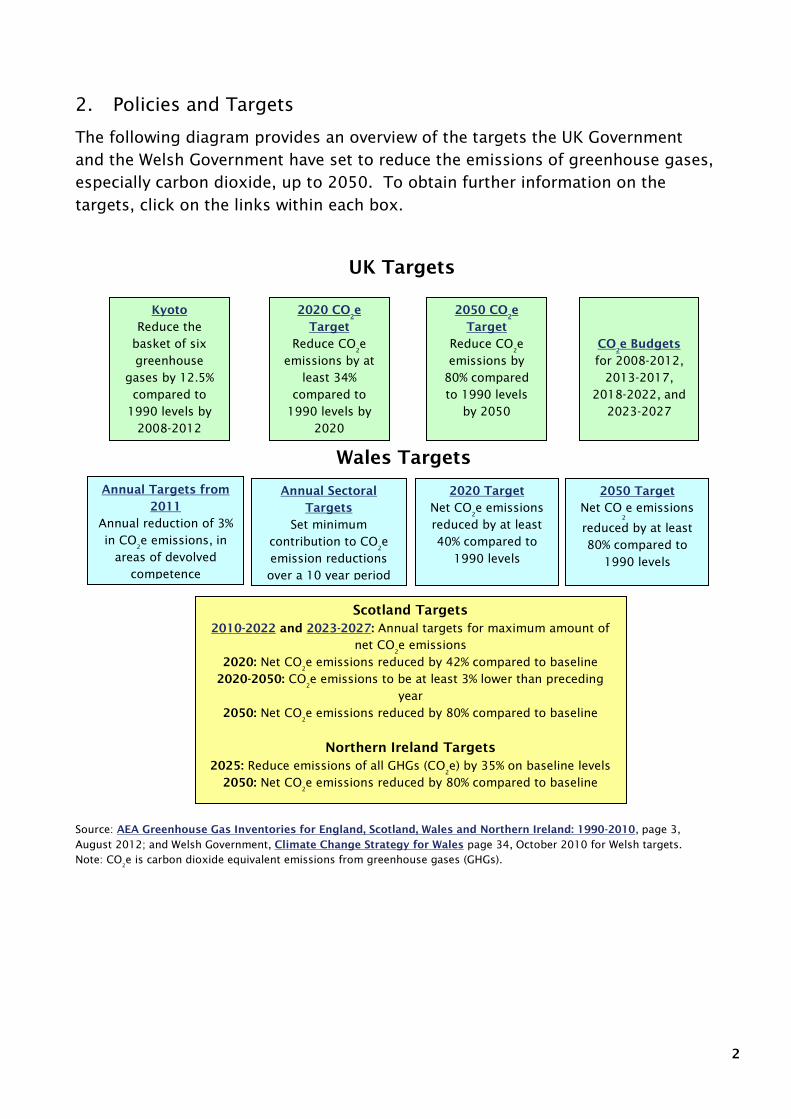
2. Policies and Targets
The following diagram provides an overview of the targets the UK Government
and the Welsh Government have set to reduce the emissions of greenhouse gases,
especially carbon dioxide, up to 2050. To obtain further information on the
targets, click on the links within each box.
Source: AEA Greenhouse Gas Inventories for England, Scotland, Wales and Northern Ireland: 1990-2010, page 3,
August 2012; and Welsh Government, Climate Change Strategy for Wales page 34, October 2010 for Welsh targets.
Note: CO2
e is carbon dioxide equivalent emissions from greenhouse gases (GHGs).
Wales Targets
Kyoto
Reduce the
basket of six
greenhouse
gases by 12.5%
compared to
1990 levels by
2008-2012
2050 CO2
e
Target
Reduce CO2
e
emissions by
80% compared
to 1990 levels
by 2050
CO2
e Budgets
for 2008-2012,
2013-2017,
2018-2022, and
2023-2027
Annual Targets from
2011
Annual reduction of 3%
in CO2
e emissions, in
areas of devolved
competence
Annual Sectoral
Targets
Set minimum
contribution to CO2
e
emission reductions
over a 10 year period
2020 Target
Net CO2
e emissions
reduced by at least
40% compared to
1990 levels
Scotland Targets
2010-2022 and 2023-2027: Annual targets for maximum amount of
net CO2
e emissions
2020: Net CO2
e emissions reduced by 42% compared to baseline
2020-2050: CO2
e emissions to be at least 3% lower than preceding
year
2050: Net CO2
e emissions reduced by 80% compared to baseline
Northern Ireland Targets
2025: Reduce emissions of all GHGs (CO2
e) by 35% on baseline levels
2050: Net CO2
e emissions reduced by 80% compared to baseline
2020 CO2
e
Target
Reduce CO2
e
emissions by at
least 34%
compared to
1990 levels by
2020
2050 Target Net CO
2
e emissions
reduced by at least
80% compared to
1990 levels
UK Targets
3
2.1. International policy
The UN Framework Convention on Climate Change (UNFCCC)4
sets an overall
framework for intergovernmental efforts to tackle climate change, with the
objective of stabilising greenhouse gas emissions in the atmosphere and reducing
the human impact on the climate system.5
It recognises that the climate system is
a shared resource whose stability can be affected by emissions of carbon dioxide
and other greenhouse gases. The Convention has been ratified by 195 parties
(194 states6
, and one regional economic integration organisation (the EU)), and
entered into force on 21 March 1994.
The Kyoto Protocol7
is the protocol to the UNFCCC which entered into force on 16
February 2005; 192 Parties8
(191 States and one regional organisation - the EU)
have ratified the Protocol to date.9
The Protocol‟s major feature is mandatory
targets on greenhouse gas emissions, whereas the UNFCCC encouraged countries
to stabilise greenhouse gas emissions. These targets range from -8 per cent to
+10 per cent of 1990 (base year) emissions levels, „with the view to reducing their
overall emissions of such gases by at least 5 per cent below 1990 levels in the
commitment period 2008 to 2012‟. The European Union participated in both the
UNFCCC and the Kyoto Protocol on behalf of its Member States. The EU countries
have a target to reduce emissions by 8 per cent, and the UK has agreed to reduce
its emissions to at least 12.5 per cent lower than the base year levels.10
The Kyoto agreement runs until 2012, and negotiations on a follow-up agreement
have been taking place at UNFCCC conferences over previous years.
At the seventeenth UNFCCC conference, which was held in Durban, South Africa
between 28 November and 9 December 2011,11
following negotiations it was
agreed by world governments that a process would be launched to develop a
protocol, another legal instrument or a legal outcome applicable to all Parties,
through the Ad Hoc Working Group on the Durban Platform for Enhanced
Action. The eighteenth annual conference was held in Doha, Qatar between 26
November and 7 December 2012.
4
United Nations: United Nations Framework Convention on Climate Change [accessed 3 October 2012]
5
AEA Greenhouse Gas Inventories for England, Scotland, Wales and Northern Ireland: 1990-2010, page
1, August 2012 [accessed 3 October 2012]
6
The number of countries that have ratified the convention [accessed 3 October 2012]
7
United Nations: Kyoto Protocol to the United Nations Framework Convention on Climate Change, 1998
[accessed 3 October 2012]
8
Countries are divided into three main Parties according to their differing commitments from the Kyoto
Protocol.
9
The number of Parties to have ratified the protocol [accessed 3 October 2012]
10
DECC, The UK Climate Change Programme Annual Report to Parliament , page 9, July 2008 [accessed 3
October 2012]
11
United Nations, United Nations Framework Convention on Climate Change Calendar 2011 [accessed 3
October 2012]
4
The new framework is to be finalised by 2015 and implemented from 2020. 12
The EU is pressing for an agreement that is „ambitious, comprehensive and legally
binding‟. Pending the new framework‟s entry into force, the EU will take part in a
second phase of the Kyoto Protocol starting on 1 January 2013.13
The UK
Government would like to see agreement on a comprehensive legal treaty now,
but states that a number of major developed and developing countries are not
ready yet.14
The Doha conference was also the first time the Welsh Government
was invited to contribute directly to the UN negotiations as part of the UK
delegation, and it was involved in discussions in relation to the second
commitment period for the Kyoto Protocol.15
2.2. European policy
The European Climate Change Programme was launched in June 2000, with the
goal of identifying and developing all the necessary elements of an EU strategy to
implement the Kyoto Protocol. The second phase of the programme commenced
in October 2005. The EU has wide jurisdiction over environmental matters to
influence climate change, the most relevant of which are:
The EU has an objective of limiting global temperature increase to less than
2ºC compared to pre-industrial levels, and has offered to increase its
emissions reduction to 30 per cent by 2020, should other major emitting
nations agree to take further action in a global agreement. Until an
agreement is concluded, the EU‟s target is a 20 per cent reduction from 1990
emissions levels, including targets to improve energy efficiency by 20 per
cent by 202016
, and to increase the share of renewable energy to 20 per cent
by 2020. The EU is also aiming to reduce domestic emissions by 80-95 per
cent by 2050, as agreed at its Environment Council in November 2009.17
Aviation was included in the EU Emissions Trading Scheme from January
2012. The petrochemicals, ammonia and aluminium industries will be
included from 2013, when the third trading period starts.18
12
United Nations Framework Convention on Climate Change, Establishment of an Ad Hoc Working Group
on the Durban Platform for Enhanced Action. Proposal by the President. 10 December 2011 [accessed 3
October 2012]
13
European Union, What is the EU doing on climate change, [accessed 3 October 2012]
14
Department of Energy and Climate Change, Demystifying….. the Kyoto Protocol, [accessed 22 October
2012]
15
Welsh Government, John Griffiths (Minister for Environment and Sustainable Development), United Nations Framework
Convention On Climate Change – Doha, Cabinet Oral Statement, 15 January 2013 [accessed 15 January 2013]
16
Department of Energy and Climate Change, Demystifying….. the Kyoto Protocol, [accessed 22 October
2012]
17
European Union, Roadmap for moving to a low-carbon economy in 2050 [accessed 3 October 2012]
18
European union, Emissions Trading System (EU ETS), [accessed 3 October 2012]
5
2.3. UK policy
In March 2006 the then UK Government published its new Climate Change
Programme19
which set out its policies and priorities for action on climate change,
both across the UK and internationally.
The Climate Change Act 200820
provides a legal framework to reduce future
greenhouse gas emissions by 80 per cent compared to 1990 levels by 2050, with
a reduction in emissions of at least 34 per cent compared to 1990 levels by
2020.21
It established a system of ‘carbon budgeting’ every five years, during
which time greenhouse gas emissions must be within predetermined limits. In
addition, the Act also established the Committee on Climate Change, an
independent body which advises the UK and Welsh Governments and reports to
Parliament annually on progress towards targets and budgets.
In May 2011 it was announced that the UK Government is proposing a 50 per cent
cut in greenhouse gas emissions for the carbon budget for 2023 to 2027, in line
with advice it received from the Committee on Climate Change. This budget was
set in law in June 2011.22
In October 2011 the UK Government published its
Carbon Plan, a Government-wide plan of action on domestic and international
climate change. The Plan sets out the UK Government‟s actions and deadlines for
its departments over the next five years.23
The UK Government published the UK Climate Change Risk Assessment (CCRA)
on 25 January 2012. This is the first assessment of its kind for the UK and the first
in a five year cycle. The outputs provide an evidence base that can be used by
central government and devolved administrations in identifying priorities for
action and appropriate adaptation measures.24
The CCRA UK Government Report
sets out the main priorities for adaptation in the UK under five key themes
(Agriculture and Forestry; Business, industries and Services; Health and Wellbeing;
Natural Environment; and Buildings and Infrastructure) identified in the CCRA
2012 Evidence Report.
On Thursday, November 29th 2012, the Secretary of State for Energy and Climate
Change introduced the Energy Bill to the House of Commons. According to the
UK Government the reforms will ensure that low-carbon electricity generation is
sufficiently incentivised to ensure that new plants are built, which will be crucial if
19
Department of Energy and Climate Change, UK Climate Change Programme, March 2006 [accessed 4
October 2012]
20
Climate Change Act 2008 (chapter 27) [accessed 12 October 2012]
21
Department of Energy and Climate Change webpage, Climate Change Act 2008 [accessed 12 October
2012]
22
Department of Energy and Climate Change, Carbon Budgets [accessed 12 October 2012]
23
Department of Energy and Climate Change, Carbon Plan [accessed 12 October 2012]
24
Department for Environment, Food and Rural Affairs, UK Climate Change Risk Assessment, 11 September
2012 [accessed 12 October 2012]
6
the UK is to meet its obligations to reduce carbon emissions and increase the use
of renewables.
The House of Commons‟ Energy and Climate Change Committee conducted an
inquiry to scrutinise the draft Energy Bill that was published on 22 May 2012.
Its report was published on 23 July 2012.
2.4. Wales policy
The previous Welsh Government‟s Climate Change Strategy for Wales,
published in October 2010, provided details of how Wales will aim to meet its
target for 3 per cent annual reductions in carbon equivalent emissions from 2011
„in areas of devolved competence‟,25
in effect excluding the power sector and
energy intensive industries, and to achieve at least a 40 per cent reduction in all
greenhouse gas emissions by 2020. The Committee on Climate Change states
that the two targets are compatible; and that if the Welsh Government delivers the
3 per cent target then this could allow it to meet the economy-wide target as long
as the power sector in Wales reduces emissions at the same rate as the sector in
the rest of the UK and energy-intensive industries do not increase emissions.26
The Climate Change Commission for Wales first met in December 2007, and is an
independent advisory body which helps to develop policy, and works towards
creating a consensus on climate change.27
The Commission is made up of
stakeholders from businesses, the public sector, environmental organisations, the
voluntary sector and representatives of the four major Welsh political parties.28
The Commission worked alongside the Welsh Government to develop and approve
the Climate Change Strategy for Wales.29
The strategy sets out how and where
the Welsh Government will act to reduce greenhouse emissions, and how they
intend to work with partners such as the UK Government, businesses,
organisations and communities. Targets are also set out for specific sectors such
as transport, business, agriculture and land use, waste, residents and the public
sector.30
The Climate Change Strategy is supplemented by two delivery plans; the
Emissions Reduction Delivery Plan31
, which provides information on the policies
25
Welsh Government: Climate Change Strategy for Wales page 34, October 2010 [accessed 12 October
2012]
26
Committee on Climate Change, Reducing emissions and preparing for climate change in Wales, page 9,
October 2011 [accessed 12 October 2012]
27
Welsh Government, Climate Change Commission Background and History [accessed 12 October 2012]
28
Welsh Government, Climate Change Commission Membership [accessed 12 October 2012]
29
Welsh Government, Climate Change Strategy for Wales page 5, (October 2010) [accessed 12 October
2012]
30
Welsh Government, Climate Change Strategy for Wales page 38, (October 2010) [accessed 12 October
2012]
31
Welsh Government, Delivery plan for Emission reduction, October 2010 [accessed 12 October 2012]
7
and programmes that the Welsh Government believes will enable it to meet its
annual 3 per cent reduction in carbon emissions in devolved areas, and the
Adaptation Delivery Plan32
which gives details of actions aimed at increasing
Wales‟ resilience to climate change.
Under the Climate Change Act 2008, the Welsh Government is required to report
to the National Assembly for Wales on its climate change objectives, policies and
priorities. The Climate Change Strategy and the two delivery plans were
submitted by the Welsh Government to the Assembly as the first report under
these requirements. In March 2012, the first annual progress report was
released in relation to the Climate Change Strategy. The report considers the
progress made in implementing the Emission Reduction and Adaptation Delivery
Plans since publication of the strategy in October 2010, and includes a qualitative
assessment of the progress made in delivering the sector actions. The report does
not detail Wales‟ performance in 2011 for the 3% annual emission reduction
target, because the relevant UK emission statistics will not be available until July
2013.33
Consequently, the next Welsh Government report will be published in the
autumn of 201334
.
The Welsh Government has also published Preparing for a changing climate,35
a
policy statement which sets out its response to the challenges facing Wales in
relation to climate change, and provides information on how it will implement
relevant provisions of the Climate Change Act 2008. At the same time, it released
its Climate Change Engagement Strategy,36
aimed at helping people, communities
and organisations to relate to and understand climate change. As a result, they
will then be able to make a difference to climate change and make more climate
aware choices.
The Climate Change Risk Assessment for Wales report was produced as part of
the UK CCRA. The report presents a national assessment of potential risks and
opportunities from climate change facing Wales for the period to 2100. Its
findings will inform the development of adaptation in Wales. The findings are
presented in the same five key themes as the UK report, for different possible
future scenarios and include an indication of confidence in the results and areas
where there are evidence gaps.
32
Welsh Government, Adaptation Delivery Plan, October 2010 [accessed 12 October 2012]
33
Welsh Government, Climate Change Strategy for Wales, 29 March 2012 [accessed 12 October 2012]
34
Welsh Government, Climate Change Strategy for Wales; First Annual Progress Report, March 2012
[accessed 12 October 2012]
35
Welsh Government, Preparing for a changing climate, October 2011 [accessed 12 October 2012]
36
Welsh Government, Climate Change Engagement Strategy, October 2011 [accessed 12 October 2012]
8
In March 2012 the Welsh Government issued the Energy Wales: A Low Carbon
Transition document which sets out what they intend to do to move towards a
sustainable, low carbon economy in Wales.
In January 2013, the Committee on Climate Change published its second annual
report on the Welsh Government‟s progress on reducing emissions and preparing
for climate change. Now that data for 2010 is available, the Committee has
calculated the baseline figures upon which the Welsh Government‟s target to
reduce emissions in areas of devolved competence will be assessed. Further
detail on these is available in section 3.3 of this paper.
9
3. Measuring Greenhouse Gas Emissions
There are two main approaches to calculating greenhouse gas emissions:
Production or ‘source’ approach: calculating emissions according to where
emissions are produced. This is relatively easy to calculate and allocate to
national accounts, however, it does not account for products that are made
elsewhere and imported. This methodology is used by the AEA;37
and has
been used to enable comparisons between the devolved nations regarding
total greenhouse gas emissions, carbon dioxide emissions and methane
emissions. Progress against the targets outlined in section 2 is measured
using the production approach.
Consumption or ‘end-user’ approach: calculating emissions according to
where the product of those emissions is consumed. This accounts for all the
emissions associated with the consumption of energy, rather than those
associated with the geographical location of where energy production takes
place. Non-energy production emissions are still counted at the place of
production. The AEA publishes „end-user‟ statistics for total greenhouse gas
emissions, carbon dioxide emissions and methane emissions for each of the
devolved nations, and comparisons have been made in section 3.5 of the
paper. „End-user‟ data for carbon dioxide emissions by local authority have
also been published by AEA38
and figures for the Welsh local authorities are
included in section 3.5.
In this paper, the statistics in section 3.1 use the ‘production’ approach and
those in sections 3.2 and 3.5 use the ‘end-user’ methodology.
37
AEA are a global sustainability consultancy who produce annual reports on greenhouse gas emissions in England,
Scotland, Wales and Northern Ireland for the UK Government and devolved administrations.
38
AEA, 2010 UK Carbon dioxide emissions for Local Authority and Government Office region level , 23 August 2012
[accessed 24 October 2012]
10
3.1. National Emissions calculations using the production approach
3.1.1. Total net greenhouse gas emissions
Total greenhouse gas emissions are made up of six gases; carbon dioxide,
methane, nitrous oxide, hydrofluorocarbons, perfluorocarbons and sulphur
hexafluoride.39
There has been a general downward trend in greenhouse gas emissions in Wales
over the past 20 years, although there have been rises in emissions in some years.
In 2010, total net emissions of greenhouse gases in Wales were 46.6 Mega
tonnes (Mt), 15 per cent lower than the base year (1990 or 1995)40,41
, however
there was an increase of 3.5Mt between 2009 and 2010. In comparison with
the other UK countries in 2010, Wales has reduced its emissions (below the 1990
or 1995 base year) by 15 per cent, which is 8.9 percentage points less than the
UK average, as shown in table 1. England has had the largest reduction in
emissions, of 26 per cent.
In a written statement in October 2012, John Griffiths AM, the Minister for
Environment and Sustainable Development stated that:
There was an increase of around 8 per cent in greenhouse gas emissions in 2010 compared
with 2009. This was due to increases in the residential, business and industrial process
sectors, which may have been affected by the cold winters, at the start and end of 2010, and
an increase in the production of iron and steel.42
In a preliminary assessment, the Committee on Climate Change consider that
emissions are likely to have fallen in 2011 due to temperatures being relatively
39
AEA, Greenhouse Gas Inventories for England, Scotland, Wales and Northern Ireland: 1990-2009, page v, September
2011 [accessed 20 January 2012]
40
AEA, Greenhouse Gas Inventories for England, Scotland, Wales and Northern Ireland: 1990-2009:
Devolved Administration GHG Inventory Pivot Tables (by source basis), September 2011 [accessed 20 January 2012]
41
Under the Kyoto Protocol, Annex 1 parties are able to use 1990 or 1995 as the base year for emissions of
hydrofluorocarbons, perfluorocarbons and sulphur hexafluoride, and a number of parties, including the United Kingdom
and devolved nations, use 1995.
42
Welsh Government, John Griffiths (Minister for Environment and Sustainable Development, Greenhouse Gas Emissions in
Wales in 2010, Cabinet Written Statement, 15 October 2012 [accessed 24 October 2012]
This section uses the production approach to compare total net greenhouse
gas emissions in Wales, and other UK countries, with the targets outlined in
the previous chapter. It then goes on to look at data using the production
approach for carbon dioxide emissions and methane emissions in Wales and
the other UK countries.
Throughout this Section due to updated emissions data and changes to
methodologies, it is not possible to compare the figures published here
with previous Research Service papers or previous AEA inventory
publications.
11
mild, falling EU Emissions Trading Scheme (EUETS) emissions and the economic
situation.43
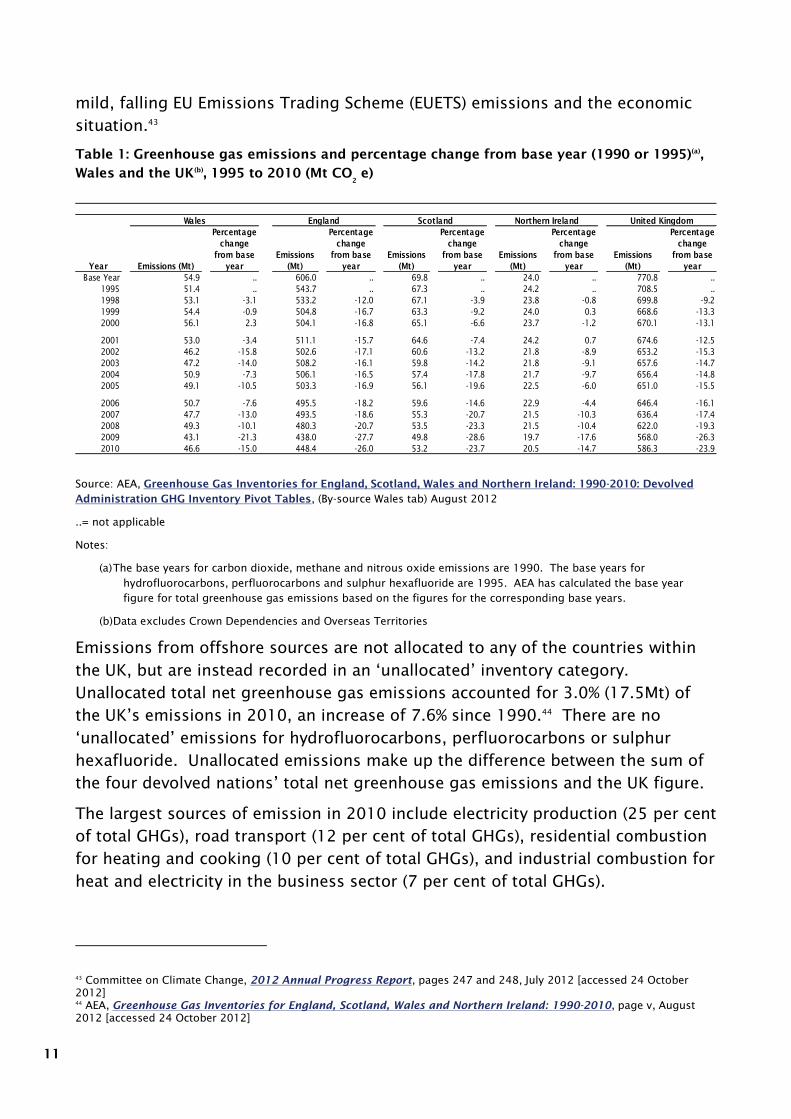
Table 1: Greenhouse gas emissions and percentage change from base year (1990 or 1995)(a)
,
Wales and the UK(b)
, 1995 to 2010 (Mt CO2
e)
Source: AEA, Greenhouse Gas Inventories for England, Scotland, Wales and Northern Ireland: 1990-2010: Devolved
Administration GHG Inventory Pivot Tables, (By-source Wales tab) August 2012
..= not applicable
Notes:
(a) The base years for carbon dioxide, methane and nitrous oxide emissions are 1990. The base years for
hydrofluorocarbons, perfluorocarbons and sulphur hexafluoride are 1995. AEA has calculated the base year
figure for total greenhouse gas emissions based on the figures for the corresponding base years.
(b) Data excludes Crown Dependencies and Overseas Territories
Emissions from offshore sources are not allocated to any of the countries within
the UK, but are instead recorded in an „unallocated‟ inventory category.
Unallocated total net greenhouse gas emissions accounted for 3.0% (17.5Mt) of
the UK‟s emissions in 2010, an increase of 7.6% since 1990.44
There are no
„unallocated‟ emissions for hydrofluorocarbons, perfluorocarbons or sulphur
hexafluoride. Unallocated emissions make up the difference between the sum of
the four devolved nations‟ total net greenhouse gas emissions and the UK figure.
The largest sources of emission in 2010 include electricity production (25 per cent
of total GHGs), road transport (12 per cent of total GHGs), residential combustion
for heating and cooking (10 per cent of total GHGs), and industrial combustion for
heat and electricity in the business sector (7 per cent of total GHGs).
43
Committee on Climate Change, 2012 Annual Progress Report, pages 247 and 248, July 2012 [accessed 24 October
2012]
44
AEA, Greenhouse Gas Inventories for England, Scotland, Wales and Northern Ireland: 1990-2010, page v, August
2012 [accessed 24 October 2012]
Year Emissions (Mt)
Percentage
change
from base
year
Emissions
(Mt)
Percentage
change
from base
year
Emissions
(Mt)
Percentage
change
from base
year
Emissions
(Mt)
Percentage
change
from base
year
Emissions
(Mt)
Percentage
change
from base
year
Base Year 54.9 .. 606.0 .. 69.8 .. 24.0 .. 770.8 ..
1995 51.4 .. 543.7 .. 67.3 .. 24.2 .. 708.5 ..
1998 53.1 -3.1 533.2 -12.0 67.1 -3.9 23.8 -0.8 699.8 -9.2
1999 54.4 -0.9 504.8 -16.7 63.3 -9.2 24.0 0.3 668.6 -13.3
2000 56.1 2.3 504.1 -16.8 65.1 -6.6 23.7 -1.2 670.1 -13.1
2001 53.0 -3.4 511.1 -15.7 64.6 -7.4 24.2 0.7 674.6 -12.5
2002 46.2 -15.8 502.6 -17.1 60.6 -13.2 21.8 -8.9 653.2 -15.3
2003 47.2 -14.0 508.2 -16.1 59.8 -14.2 21.8 -9.1 657.6 -14.7
2004 50.9 -7.3 506.1 -16.5 57.4 -17.8 21.7 -9.7 656.4 -14.8
2005 49.1 -10.5 503.3 -16.9 56.1 -19.6 22.5 -6.0 651.0 -15.5
2006 50.7 -7.6 495.5 -18.2 59.6 -14.6 22.9 -4.4 646.4 -16.1
2007 47.7 -13.0 493.5 -18.6 55.3 -20.7 21.5 -10.3 636.4 -17.4
2008 49.3 -10.1 480.3 -20.7 53.5 -23.3 21.5 -10.4 622.0 -19.3
2009 43.1 -21.3 438.0 -27.7 49.8 -28.6 19.7 -17.6 568.0 -26.3
2010 46.6 -15.0 448.4 -26.0 53.2 -23.7 20.5 -14.7 586.3 -23.9
Wales England Scotland Northern Ireland United Kingdom
12
Wales is a net exporter of electricity i.e. it exports more than it uses. Wales
exported the equivalent of 24.5% of its generation to consumers in England in
2010, falling to 13.4% in 2011.45
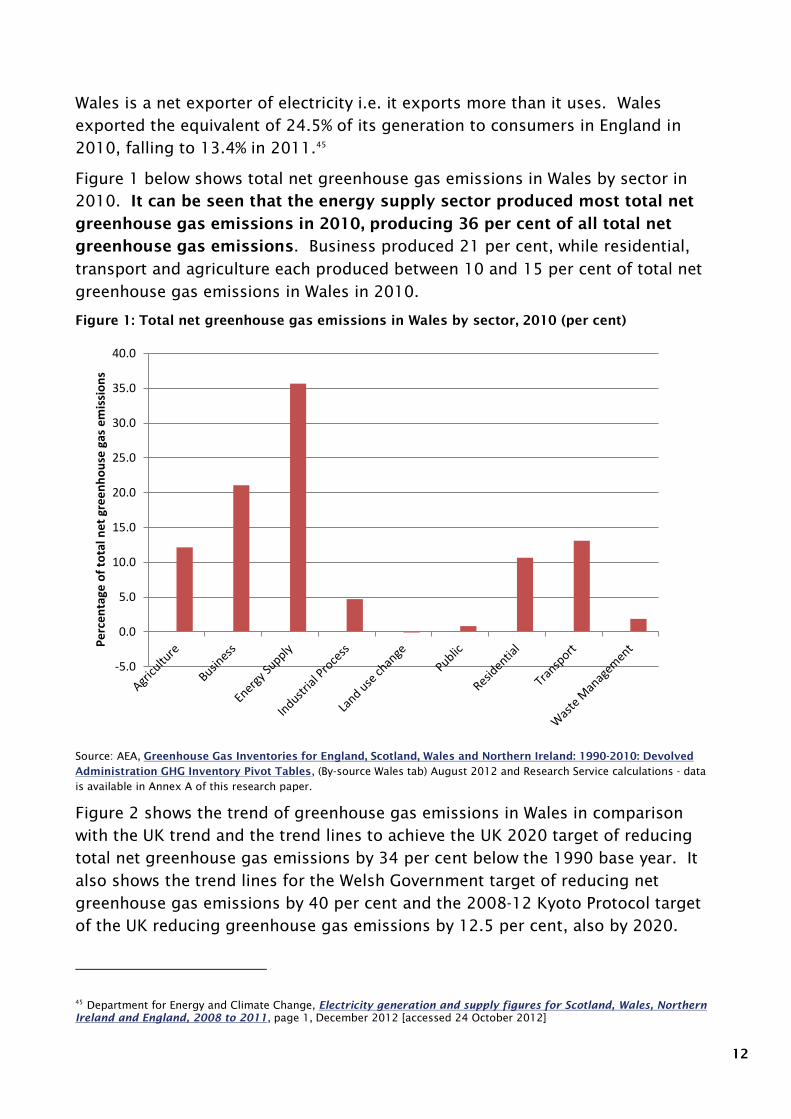
Figure 1 below shows total net greenhouse gas emissions in Wales by sector in
2010. It can be seen that the energy supply sector produced most total net
greenhouse gas emissions in 2010, producing 36 per cent of all total net
greenhouse gas emissions. Business produced 21 per cent, while residential,
transport and agriculture each produced between 10 and 15 per cent of total net
greenhouse gas emissions in Wales in 2010.
Figure 1: Total net greenhouse gas emissions in Wales by sector, 2010 (per cent)
Source: AEA, Greenhouse Gas Inventories for England, Scotland, Wales and Northern Ireland: 1990-2010: Devolved
Administration GHG Inventory Pivot Tables, (By-source Wales tab) August 2012 and Research Service calculations - data
is available in Annex A of this research paper.
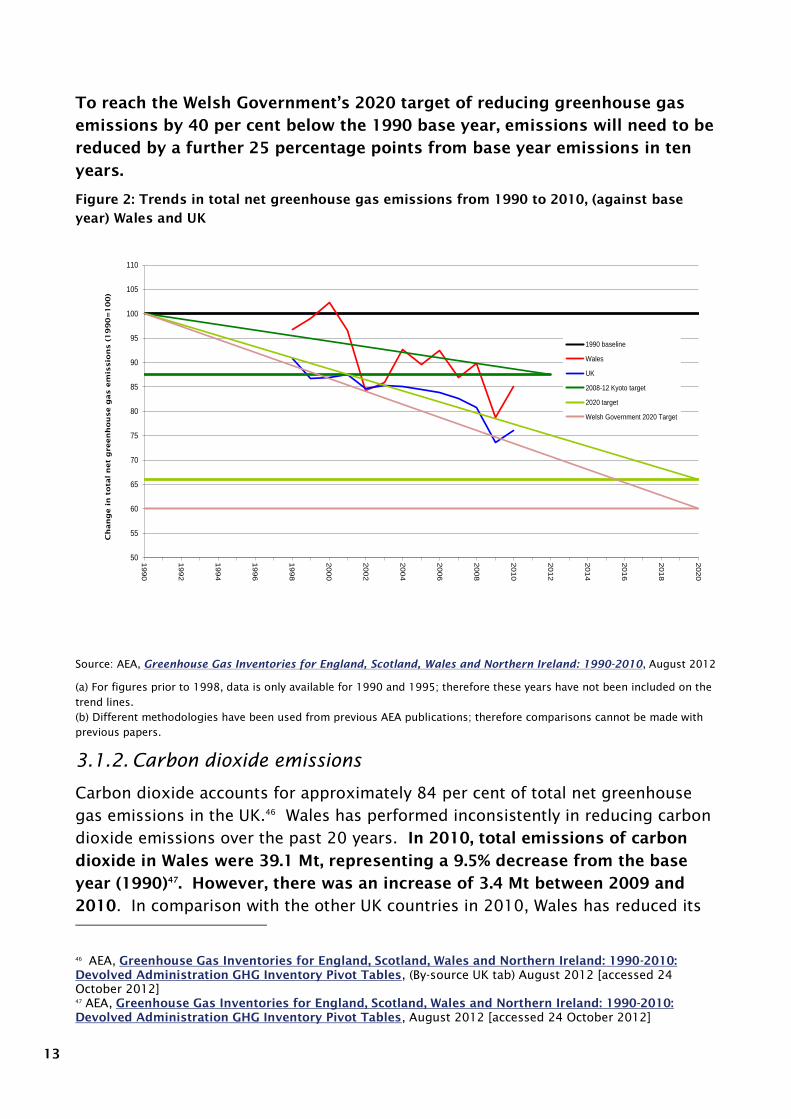
Figure 2 shows the trend of greenhouse gas emissions in Wales in comparison
with the UK trend and the trend lines to achieve the UK 2020 target of reducing
total net greenhouse gas emissions by 34 per cent below the 1990 base year. It
also shows the trend lines for the Welsh Government target of reducing net
greenhouse gas emissions by 40 per cent and the 2008-12 Kyoto Protocol target
of the UK reducing greenhouse gas emissions by 12.5 per cent, also by 2020.
45
Department for Energy and Climate Change, Electricity generation and supply figures for Scotland, Wales, Northern
Ireland and England, 2008 to 2011, page 1, December 2012 [accessed 24 October 2012]
-5.0
0.0
5.0
10.0
15.0
20.0
25.0
30.0
35.0
40.0
Pe
rce
nta
ge o
f to
tal n
et
gre
en
ho
use
gas
em
issi
on
s
13
To reach the Welsh Government’s 2020 target of reducing greenhouse gas
emissions by 40 per cent below the 1990 base year, emissions will need to be
reduced by a further 25 percentage points from base year emissions in ten
years.
Figure 2: Trends in total net greenhouse gas emissions from 1990 to 2010, (against base
year) Wales and UK
Source: AEA, Greenhouse Gas Inventories for England, Scotland, Wales and Northern Ireland: 1990-2010, August 2012
(a) For figures prior to 1998, data is only available for 1990 and 1995; therefore these years have not been included on the
trend lines.
(b) Different methodologies have been used from previous AEA publications; therefore comparisons cannot be made with
previous papers.
3.1.2. Carbon dioxide emissions
Carbon dioxide accounts for approximately 84 per cent of total net greenhouse
gas emissions in the UK.46
Wales has performed inconsistently in reducing carbon
dioxide emissions over the past 20 years. In 2010, total emissions of carbon
dioxide in Wales were 39.1 Mt, representing a 9.5% decrease from the base
year (1990)47
. However, there was an increase of 3.4 Mt between 2009 and
2010. In comparison with the other UK countries in 2010, Wales has reduced its
46
AEA, Greenhouse Gas Inventories for England, Scotland, Wales and Northern Ireland: 1990-2010:
Devolved Administration GHG Inventory Pivot Tables, (By-source UK tab) August 2012 [accessed 24
October 2012]
47
AEA, Greenhouse Gas Inventories for England, Scotland, Wales and Northern Ireland: 1990-2010:
Devolved Administration GHG Inventory Pivot Tables, August 2012 [accessed 24 October 2012]
50
55
60
65
70
75
80
85
90
95
100
105
110
1990
1992
1994
1996
1998
2000
2002
2004
2006
2008
2010
2012
2014
2016
2018
2020
Ch
an
ge in
to
tal n
et g
reen
ho
use g
as em
issio
ns (1
99
0=
10
0)
1990 baseline
Wales
UK
2008-12 Kyoto target
2020 target
Welsh Government 2020 Target
14
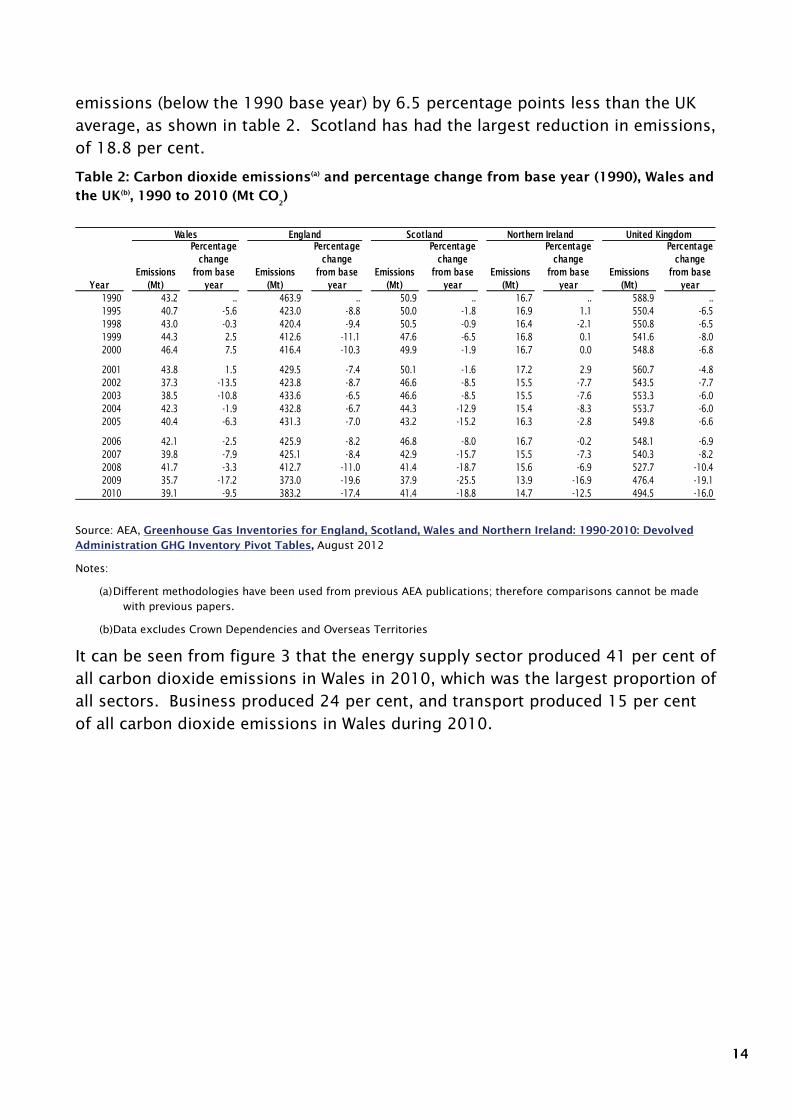
emissions (below the 1990 base year) by 6.5 percentage points less than the UK
average, as shown in table 2. Scotland has had the largest reduction in emissions,
of 18.8 per cent.
Table 2: Carbon dioxide emissions(a)
and percentage change from base year (1990), Wales and
the UK(b)
, 1990 to 2010 (Mt CO2
)
Source: AEA, Greenhouse Gas Inventories for England, Scotland, Wales and Northern Ireland: 1990-2010: Devolved
Administration GHG Inventory Pivot Tables, August 2012
Notes:
(a) Different methodologies have been used from previous AEA publications; therefore comparisons cannot be made
with previous papers.
(b) Data excludes Crown Dependencies and Overseas Territories
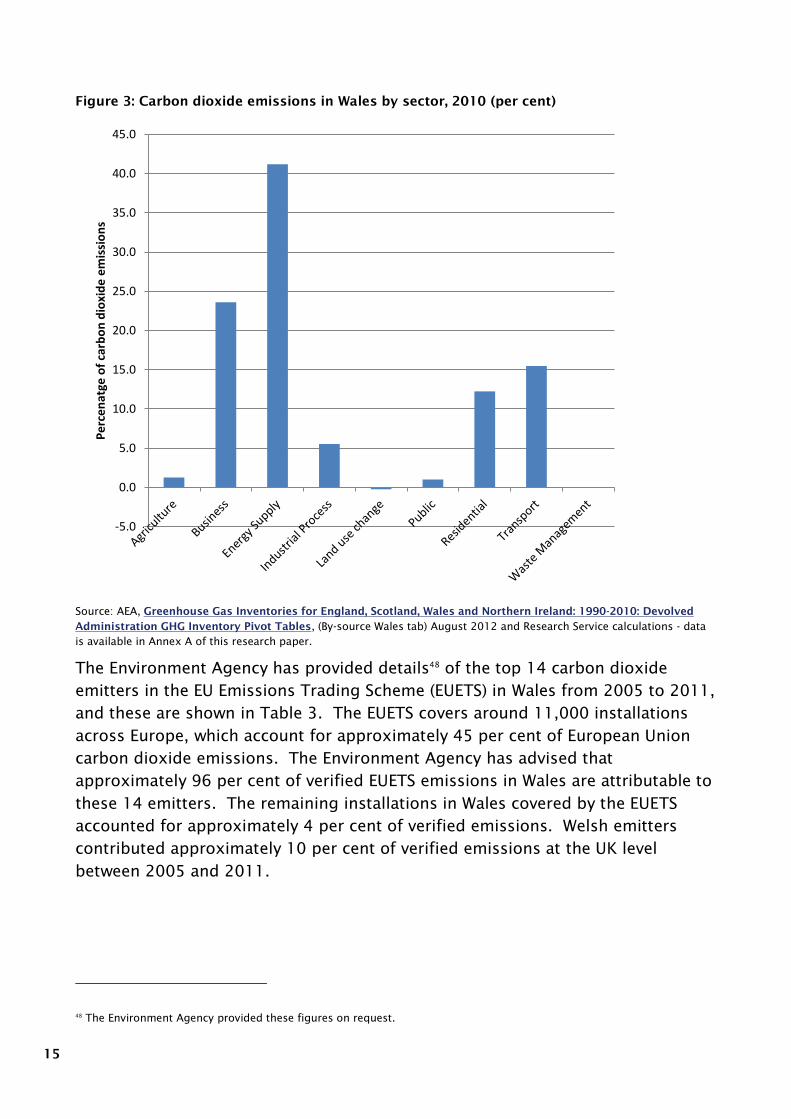
It can be seen from figure 3 that the energy supply sector produced 41 per cent of
all carbon dioxide emissions in Wales in 2010, which was the largest proportion of
all sectors. Business produced 24 per cent, and transport produced 15 per cent
of all carbon dioxide emissions in Wales during 2010.
Year
Emissions
(Mt)
Percentage
change
from base
year
Emissions
(Mt)
Percentage
change
from base
year
Emissions
(Mt)
Percentage
change
from base
year
Emissions
(Mt)
Percentage
change
from base
year
Emissions
(Mt)
Percentage
change
from base
year
1990 43.2 .. 463.9 .. 50.9 .. 16.7 .. 588.9 ..
1995 40.7 -5.6 423.0 -8.8 50.0 -1.8 16.9 1.1 550.4 -6.5
1998 43.0 -0.3 420.4 -9.4 50.5 -0.9 16.4 -2.1 550.8 -6.5
1999 44.3 2.5 412.6 -11.1 47.6 -6.5 16.8 0.1 541.6 -8.0
2000 46.4 7.5 416.4 -10.3 49.9 -1.9 16.7 0.0 548.8 -6.8
2001 43.8 1.5 429.5 -7.4 50.1 -1.6 17.2 2.9 560.7 -4.8
2002 37.3 -13.5 423.8 -8.7 46.6 -8.5 15.5 -7.7 543.5 -7.7
2003 38.5 -10.8 433.6 -6.5 46.6 -8.5 15.5 -7.6 553.3 -6.0
2004 42.3 -1.9 432.8 -6.7 44.3 -12.9 15.4 -8.3 553.7 -6.0
2005 40.4 -6.3 431.3 -7.0 43.2 -15.2 16.3 -2.8 549.8 -6.6
2006 42.1 -2.5 425.9 -8.2 46.8 -8.0 16.7 -0.2 548.1 -6.9
2007 39.8 -7.9 425.1 -8.4 42.9 -15.7 15.5 -7.3 540.3 -8.2
2008 41.7 -3.3 412.7 -11.0 41.4 -18.7 15.6 -6.9 527.7 -10.4
2009 35.7 -17.2 373.0 -19.6 37.9 -25.5 13.9 -16.9 476.4 -19.1
2010 39.1 -9.5 383.2 -17.4 41.4 -18.8 14.7 -12.5 494.5 -16.0
United KingdomWales England Scotland Northern Ireland
15
Figure 3: Carbon dioxide emissions in Wales by sector, 2010 (per cent)
Source: AEA, Greenhouse Gas Inventories for England, Scotland, Wales and Northern Ireland: 1990-2010: Devolved
Administration GHG Inventory Pivot Tables, (By-source Wales tab) August 2012 and Research Service calculations - data
is available in Annex A of this research paper.
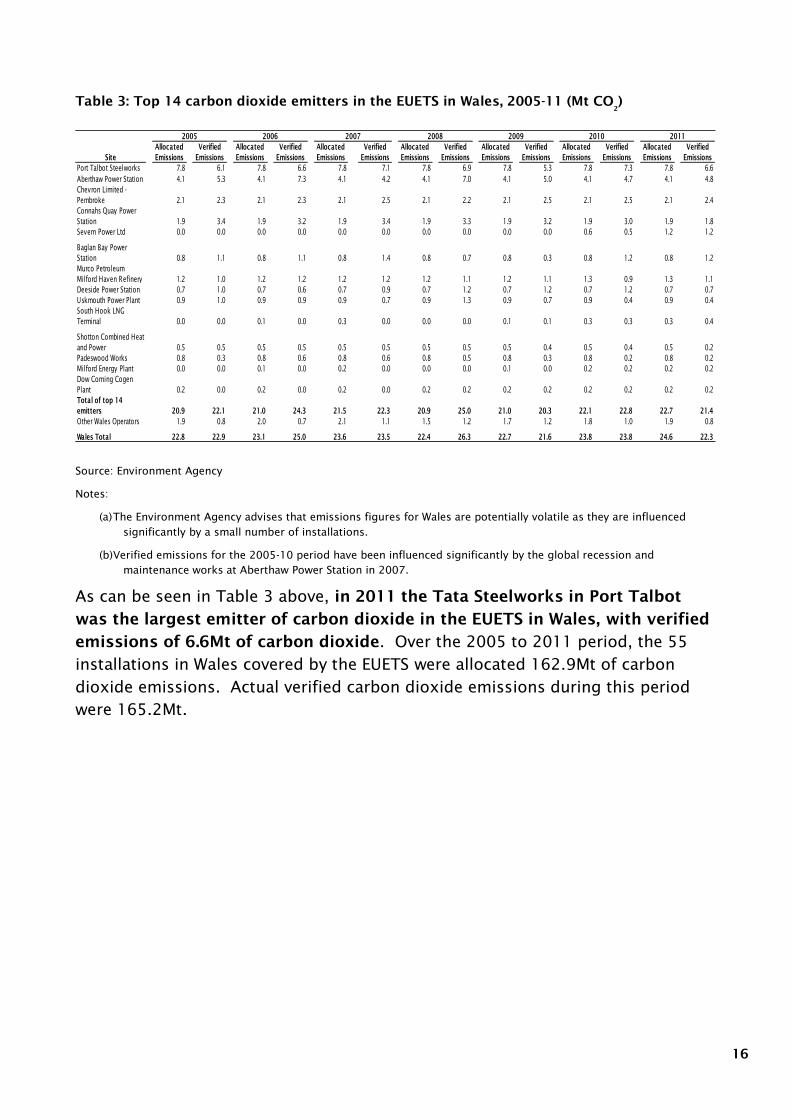
The Environment Agency has provided details48
of the top 14 carbon dioxide
emitters in the EU Emissions Trading Scheme (EUETS) in Wales from 2005 to 2011,
and these are shown in Table 3. The EUETS covers around 11,000 installations
across Europe, which account for approximately 45 per cent of European Union
carbon dioxide emissions. The Environment Agency has advised that
approximately 96 per cent of verified EUETS emissions in Wales are attributable to
these 14 emitters. The remaining installations in Wales covered by the EUETS
accounted for approximately 4 per cent of verified emissions. Welsh emitters
contributed approximately 10 per cent of verified emissions at the UK level
between 2005 and 2011.
48
The Environment Agency provided these figures on request.
-5.0
0.0
5.0
10.0
15.0
20.0
25.0
30.0
35.0
40.0
45.0
Pe
rce
nat
ge o
f ca
rbo
n d
ioxi
de
em
issi
on
s
16
Table 3: Top 14 carbon dioxide emitters in the EUETS in Wales, 2005-11 (Mt CO2
)
Source: Environment Agency
Notes:
(a) The Environment Agency advises that emissions figures for Wales are potentially volatile as they are influenced
significantly by a small number of installations.
(b) Verified emissions for the 2005-10 period have been influenced significantly by the global recession and
maintenance works at Aberthaw Power Station in 2007.
As can be seen in Table 3 above, in 2011 the Tata Steelworks in Port Talbot
was the largest emitter of carbon dioxide in the EUETS in Wales, with verified
emissions of 6.6Mt of carbon dioxide. Over the 2005 to 2011 period, the 55
installations in Wales covered by the EUETS were allocated 162.9Mt of carbon
dioxide emissions. Actual verified carbon dioxide emissions during this period
were 165.2Mt.
Site
Allocated
Emissions
Verified
Emissions
Allocated
Emissions
Verified
Emissions
Allocated
Emissions
Verified
Emissions
Allocated
Emissions
Verified
Emissions
Allocated
Emissions
Verified
Emissions
Allocated
Emissions
Verified
Emissions
Allocated
Emissions
Verified
Emissions
Port Talbot Steelworks 7.8 6.1 7.8 6.6 7.8 7.1 7.8 6.9 7.8 5.3 7.8 7.3 7.8 6.6
Aberthaw Power Station 4.1 5.3 4.1 7.3 4.1 4.2 4.1 7.0 4.1 5.0 4.1 4.7 4.1 4.8
Chevron Limited -
Pembroke 2.1 2.3 2.1 2.3 2.1 2.5 2.1 2.2 2.1 2.5 2.1 2.5 2.1 2.4
Connahs Quay Power
Station 1.9 3.4 1.9 3.2 1.9 3.4 1.9 3.3 1.9 3.2 1.9 3.0 1.9 1.8
Severn Power Ltd 0.0 0.0 0.0 0.0 0.0 0.0 0.0 0.0 0.0 0.0 0.6 0.5 1.2 1.2
Baglan Bay Power
Station 0.8 1.1 0.8 1.1 0.8 1.4 0.8 0.7 0.8 0.3 0.8 1.2 0.8 1.2
Murco Petroleum
Milford Haven Refinery 1.2 1.0 1.2 1.2 1.2 1.2 1.2 1.1 1.2 1.1 1.3 0.9 1.3 1.1
Deeside Power Station 0.7 1.0 0.7 0.6 0.7 0.9 0.7 1.2 0.7 1.2 0.7 1.2 0.7 0.7
Uskmouth Power Plant 0.9 1.0 0.9 0.9 0.9 0.7 0.9 1.3 0.9 0.7 0.9 0.4 0.9 0.4
South Hook LNG
Terminal 0.0 0.0 0.1 0.0 0.3 0.0 0.0 0.0 0.1 0.1 0.3 0.3 0.3 0.4
Shotton Combined Heat
and Power 0.5 0.5 0.5 0.5 0.5 0.5 0.5 0.5 0.5 0.4 0.5 0.4 0.5 0.2
Padeswood Works 0.8 0.3 0.8 0.6 0.8 0.6 0.8 0.5 0.8 0.3 0.8 0.2 0.8 0.2
Milford Energy Plant 0.0 0.0 0.1 0.0 0.2 0.0 0.0 0.0 0.1 0.0 0.2 0.2 0.2 0.2
Dow Corning Cogen
Plant 0.2 0.0 0.2 0.0 0.2 0.0 0.2 0.2 0.2 0.2 0.2 0.2 0.2 0.2
Total of top 14
emitters 20.9 22.1 21.0 24.3 21.5 22.3 20.9 25.0 21.0 20.3 22.1 22.8 22.7 21.4
Other Wales Operators 1.9 0.8 2.0 0.7 2.1 1.1 1.5 1.2 1.7 1.2 1.8 1.0 1.9 0.8
Wales Total 22.8 22.9 23.1 25.0 23.6 23.5 22.4 26.3 22.7 21.6 23.8 23.8 24.6 22.3
201120102005 2006 2007 2008 2009
17
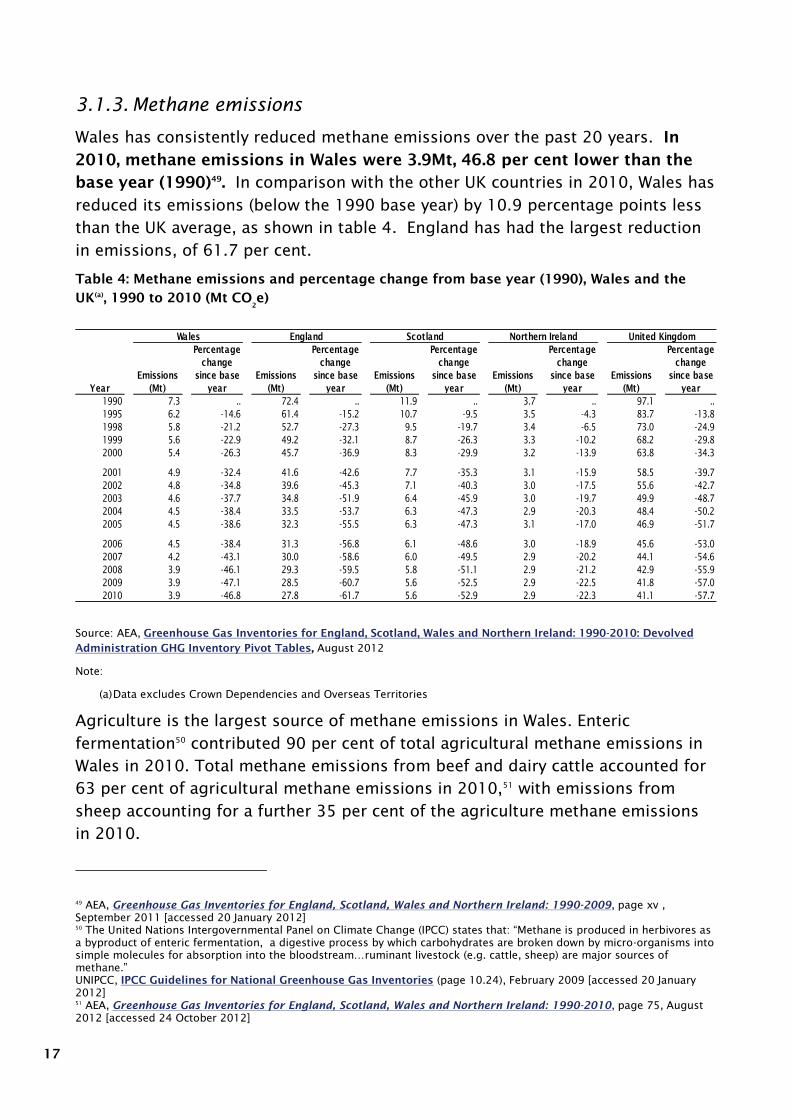
3.1.3. Methane emissions
Wales has consistently reduced methane emissions over the past 20 years. In
2010, methane emissions in Wales were 3.9Mt, 46.8 per cent lower than the
base year (1990)49
. In comparison with the other UK countries in 2010, Wales has
reduced its emissions (below the 1990 base year) by 10.9 percentage points less
than the UK average, as shown in table 4. England has had the largest reduction
in emissions, of 61.7 per cent.
Table 4: Methane emissions and percentage change from base year (1990), Wales and the
UK(a)
, 1990 to 2010 (Mt CO2
e)
Source: AEA, Greenhouse Gas Inventories for England, Scotland, Wales and Northern Ireland: 1990-2010: Devolved
Administration GHG Inventory Pivot Tables, August 2012
Note:
(a) Data excludes Crown Dependencies and Overseas Territories
Agriculture is the largest source of methane emissions in Wales. Enteric
fermentation50
contributed 90 per cent of total agricultural methane emissions in
Wales in 2010. Total methane emissions from beef and dairy cattle accounted for
63 per cent of agricultural methane emissions in 2010,51
with emissions from
sheep accounting for a further 35 per cent of the agriculture methane emissions
in 2010.
49
AEA, Greenhouse Gas Inventories for England, Scotland, Wales and Northern Ireland: 1990-2009, page xv ,
September 2011 [accessed 20 January 2012]
50
The United Nations Intergovernmental Panel on Climate Change (IPCC) states that: “Methane is produced in herbivores as
a byproduct of enteric fermentation, a digestive process by which carbohydrates are broken down by micro-organisms into
simple molecules for absorption into the bloodstream…ruminant livestock (e.g. cattle, sheep) are major sources of
methane.”
UNIPCC, IPCC Guidelines for National Greenhouse Gas Inventories (page 10.24), February 2009 [accessed 20 January
2012]
51
AEA, Greenhouse Gas Inventories for England, Scotland, Wales and Northern Ireland: 1990-2010, page 75, August
2012 [accessed 24 October 2012]
Year
Emissions
(Mt)
Percentage
change
since base
year
Emissions
(Mt)
Percentage
change
since base
year
Emissions
(Mt)
Percentage
change
since base
year
Emissions
(Mt)
Percentage
change
since base
year
Emissions
(Mt)
Percentage
change
since base
year
1990 7.3 .. 72.4 .. 11.9 .. 3.7 .. 97.1 ..
1995 6.2 -14.6 61.4 -15.2 10.7 -9.5 3.5 -4.3 83.7 -13.8
1998 5.8 -21.2 52.7 -27.3 9.5 -19.7 3.4 -6.5 73.0 -24.9
1999 5.6 -22.9 49.2 -32.1 8.7 -26.3 3.3 -10.2 68.2 -29.8
2000 5.4 -26.3 45.7 -36.9 8.3 -29.9 3.2 -13.9 63.8 -34.3
2001 4.9 -32.4 41.6 -42.6 7.7 -35.3 3.1 -15.9 58.5 -39.7
2002 4.8 -34.8 39.6 -45.3 7.1 -40.3 3.0 -17.5 55.6 -42.7
2003 4.6 -37.7 34.8 -51.9 6.4 -45.9 3.0 -19.7 49.9 -48.7
2004 4.5 -38.4 33.5 -53.7 6.3 -47.3 2.9 -20.3 48.4 -50.2
2005 4.5 -38.6 32.3 -55.5 6.3 -47.3 3.1 -17.0 46.9 -51.7
2006 4.5 -38.4 31.3 -56.8 6.1 -48.6 3.0 -18.9 45.6 -53.0
2007 4.2 -43.1 30.0 -58.6 6.0 -49.5 2.9 -20.2 44.1 -54.6
2008 3.9 -46.1 29.3 -59.5 5.8 -51.1 2.9 -21.2 42.9 -55.9
2009 3.9 -47.1 28.5 -60.7 5.6 -52.5 2.9 -22.5 41.8 -57.0
2010 3.9 -46.8 27.8 -61.7 5.6 -52.9 2.9 -22.3 41.1 -57.7
Wales England Scotland Northern Ireland United Kingdom
18
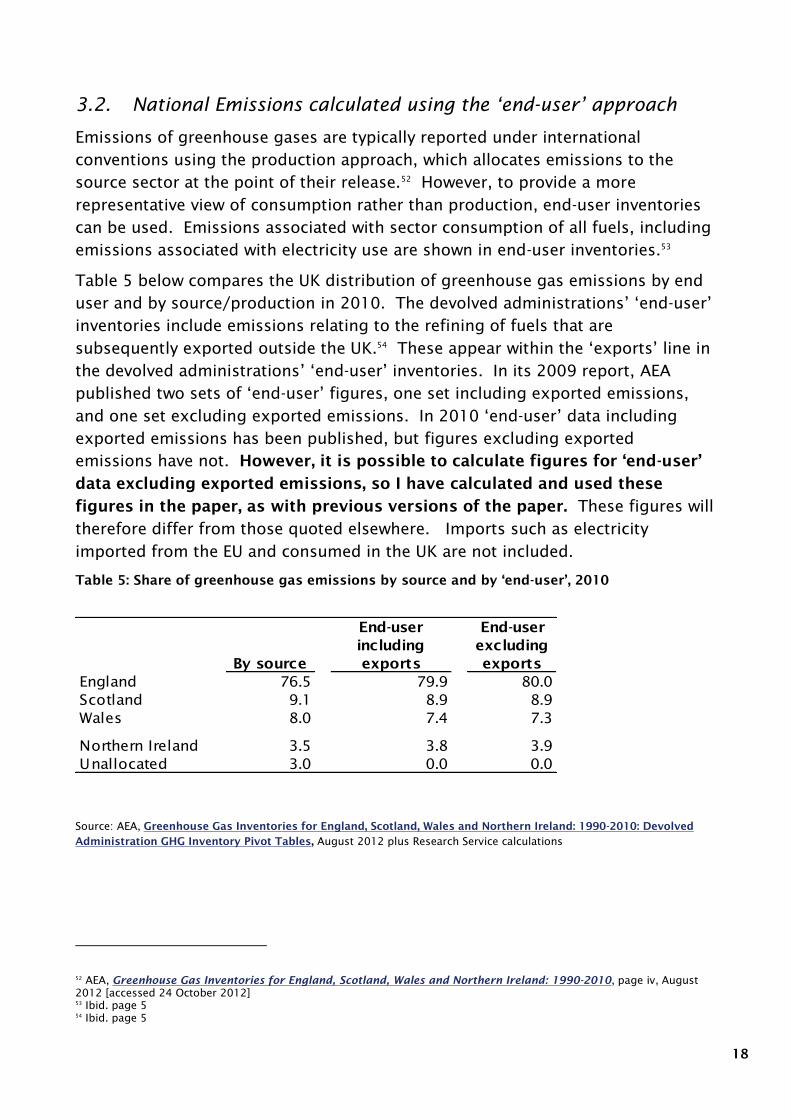
3.2. National Emissions calculated using the ‘end-user’ approach
Emissions of greenhouse gases are typically reported under international
conventions using the production approach, which allocates emissions to the
source sector at the point of their release.52
However, to provide a more
representative view of consumption rather than production, end-user inventories
can be used. Emissions associated with sector consumption of all fuels, including
emissions associated with electricity use are shown in end-user inventories.53
Table 5 below compares the UK distribution of greenhouse gas emissions by end
user and by source/production in 2010. The devolved administrations‟ „end-user‟
inventories include emissions relating to the refining of fuels that are
subsequently exported outside the UK.54
These appear within the „exports‟ line in
the devolved administrations‟ „end-user‟ inventories. In its 2009 report, AEA
published two sets of „end-user‟ figures, one set including exported emissions,
and one set excluding exported emissions. In 2010 „end-user‟ data including
exported emissions has been published, but figures excluding exported
emissions have not. However, it is possible to calculate figures for ‘end-user’
data excluding exported emissions, so I have calculated and used these
figures in the paper, as with previous versions of the paper. These figures will
therefore differ from those quoted elsewhere. Imports such as electricity
imported from the EU and consumed in the UK are not included.
Table 5: Share of greenhouse gas emissions by source and by ‘end-user’, 2010
Source: AEA, Greenhouse Gas Inventories for England, Scotland, Wales and Northern Ireland: 1990-2010: Devolved
Administration GHG Inventory Pivot Tables, August 2012 plus Research Service calculations
52
AEA, Greenhouse Gas Inventories for England, Scotland, Wales and Northern Ireland: 1990-2010, page iv, August
2012 [accessed 24 October 2012]
53
Ibid. page 5
54
Ibid. page 5
By source
End-user
including
exports
End-user
excluding
exports
England 76.5 79.9 80.0
Scotland 9.1 8.9 8.9
Wales 8.0 7.4 7.3
Northern Ireland 3.5 3.8 3.9
Unallocated 3.0 0.0 0.0
19
It can be seen that Wales has a smaller share of ‘end-user’ emissions, 7.3 per
cent of UK emissions when exports are excluded, in comparison to its share
of 8.0 per cent of ‘by source’ UK emissions.
3.2.1. ‘End-user’ greenhouse gas emissions
As stated above, it is possible to measure „end-user‟ emissions either including or
excluding exports; figures excluding exports are set out below.
Overall there has been a general downward trend in „end-user‟ greenhouse gas
emissions (excluding exports) in Wales over the past 20 years, although there
have been rises in some years. In 2010, total ‘end-user’ emissions of
greenhouse gases in Wales were 41.4 Mega tonnes (Mt), 23.8% lower than the
base year (1990 or 1995)55
, and there was an increase of 4.0 Mt between 2009
and 2010. Of the other UK countries, Scotland has had the largest reduction in
emissions, of 31.8%. As can be seen in table 6, Wales has had a greater reduction
in „end-user‟ greenhouse gas emissions excluding exports than Northern Ireland
over the past 20 years.
55
Under the Kyoto Protocol, Annex 1 parties are able to use 1990 or 1995 as the base year for emissions of
hydrofluorocarbons, perfluorocarbons and sulphur hexafluoride, and a number of parties, including the United Kingdom
and devolved nations, use 1995.
This section uses the „end-user‟ approach to compare total net greenhouse
gas emissions in Wales and other UK countries. It then goes on to look at
data using the „end-user‟ approach for carbon dioxide emissions and
methane emissions in Wales and the other UK countries.
Throughout this section due to updated emissions data and changes to
methodologies, it is not possible to compare the figures published here
with previous Research Service papers or previous AEA inventory
publications.
20
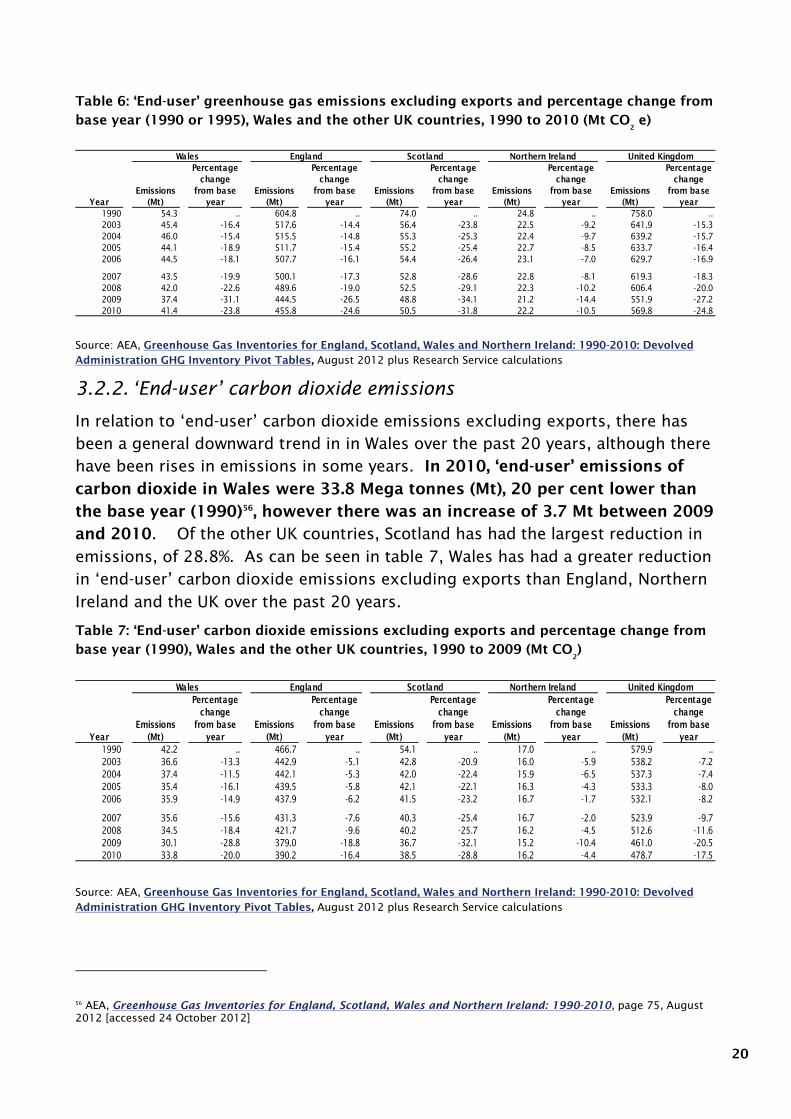
Table 6: ‘End-user’ greenhouse gas emissions excluding exports and percentage change from
base year (1990 or 1995), Wales and the other UK countries, 1990 to 2010 (Mt CO2
e)
Source: AEA, Greenhouse Gas Inventories for England, Scotland, Wales and Northern Ireland: 1990-2010: Devolved
Administration GHG Inventory Pivot Tables, August 2012 plus Research Service calculations
3.2.2. ‘End-user’ carbon dioxide emissions
In relation to „end-user‟ carbon dioxide emissions excluding exports, there has
been a general downward trend in in Wales over the past 20 years, although there
have been rises in emissions in some years. In 2010, ‘end-user’ emissions of
carbon dioxide in Wales were 33.8 Mega tonnes (Mt), 20 per cent lower than
the base year (1990)56
, however there was an increase of 3.7 Mt between 2009
and 2010. Of the other UK countries, Scotland has had the largest reduction in
emissions, of 28.8%. As can be seen in table 7, Wales has had a greater reduction
in „end-user‟ carbon dioxide emissions excluding exports than England, Northern
Ireland and the UK over the past 20 years.
Table 7: ‘End-user’ carbon dioxide emissions excluding exports and percentage change from
base year (1990), Wales and the other UK countries, 1990 to 2009 (Mt CO2
)
Source: AEA, Greenhouse Gas Inventories for England, Scotland, Wales and Northern Ireland: 1990-2010: Devolved
Administration GHG Inventory Pivot Tables, August 2012 plus Research Service calculations
56
AEA, Greenhouse Gas Inventories for England, Scotland, Wales and Northern Ireland: 1990-2010, page 75, August
2012 [accessed 24 October 2012]
Year
Emissions
(Mt)
Percentage
change
from base
year
Emissions
(Mt)
Percentage
change
from base
year
Emissions
(Mt)
Percentage
change
from base
year
Emissions
(Mt)
Percentage
change
from base
year
Emissions
(Mt)
Percentage
change
from base
year
1990 54.3 .. 604.8 .. 74.0 .. 24.8 .. 758.0 ..
2003 45.4 -16.4 517.6 -14.4 56.4 -23.8 22.5 -9.2 641.9 -15.3
2004 46.0 -15.4 515.5 -14.8 55.3 -25.3 22.4 -9.7 639.2 -15.7
2005 44.1 -18.9 511.7 -15.4 55.2 -25.4 22.7 -8.5 633.7 -16.4
2006 44.5 -18.1 507.7 -16.1 54.4 -26.4 23.1 -7.0 629.7 -16.9
2007 43.5 -19.9 500.1 -17.3 52.8 -28.6 22.8 -8.1 619.3 -18.3
2008 42.0 -22.6 489.6 -19.0 52.5 -29.1 22.3 -10.2 606.4 -20.0
2009 37.4 -31.1 444.5 -26.5 48.8 -34.1 21.2 -14.4 551.9 -27.2
2010 41.4 -23.8 455.8 -24.6 50.5 -31.8 22.2 -10.5 569.8 -24.8
Wales England Scotland Northern Ireland United Kingdom
Year
Emissions
(Mt)
Percentage
change
from base
year
Emissions
(Mt)
Percentage
change
from base
year
Emissions
(Mt)
Percentage
change
from base
year
Emissions
(Mt)
Percentage
change
from base
year
Emissions
(Mt)
Percentage
change
from base
year
1990 42.2 .. 466.7 .. 54.1 .. 17.0 .. 579.9 ..
2003 36.6 -13.3 442.9 -5.1 42.8 -20.9 16.0 -5.9 538.2 -7.2
2004 37.4 -11.5 442.1 -5.3 42.0 -22.4 15.9 -6.5 537.3 -7.4
2005 35.4 -16.1 439.5 -5.8 42.1 -22.1 16.3 -4.3 533.3 -8.0
2006 35.9 -14.9 437.9 -6.2 41.5 -23.2 16.7 -1.7 532.1 -8.2
2007 35.6 -15.6 431.3 -7.6 40.3 -25.4 16.7 -2.0 523.9 -9.7
2008 34.5 -18.4 421.7 -9.6 40.2 -25.7 16.2 -4.5 512.6 -11.6
2009 30.1 -28.8 379.0 -18.8 36.7 -32.1 15.2 -10.4 461.0 -20.5
2010 33.8 -20.0 390.2 -16.4 38.5 -28.8 16.2 -4.4 478.7 -17.5
Wales England Scotland Northern Ireland United Kingdom
21
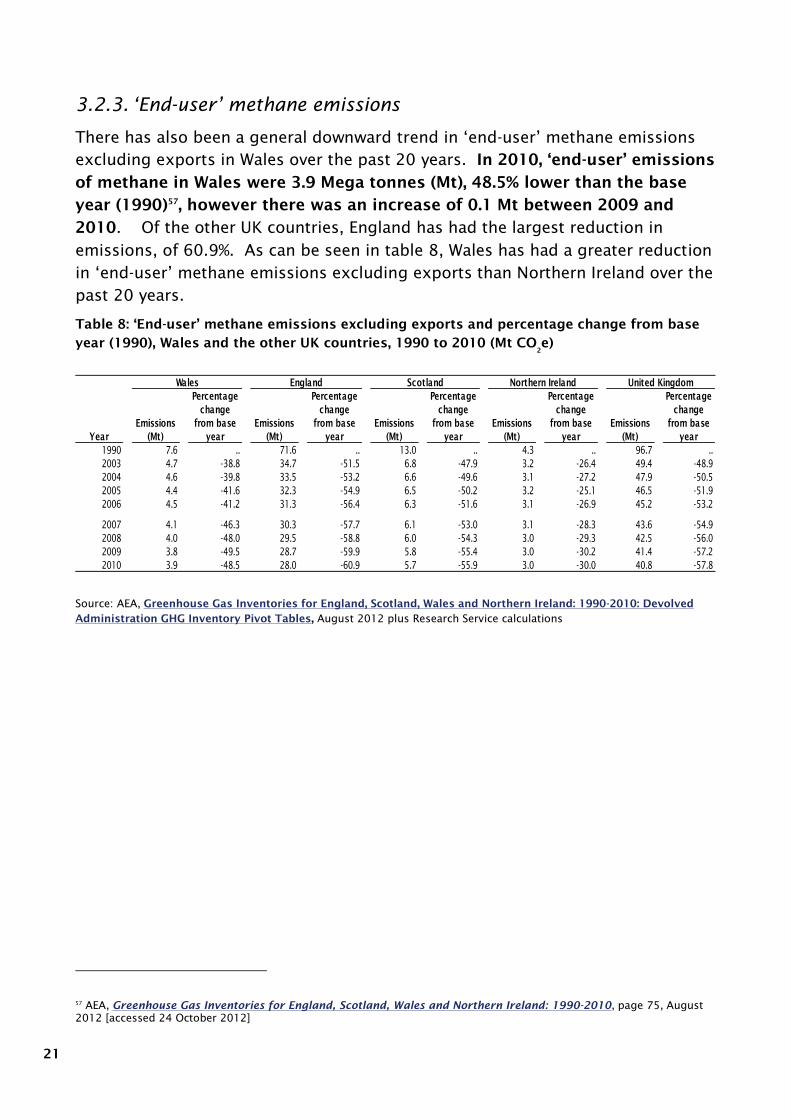
3.2.3. ‘End-user’ methane emissions
There has also been a general downward trend in „end-user‟ methane emissions
excluding exports in Wales over the past 20 years. In 2010, ‘end-user’ emissions
of methane in Wales were 3.9 Mega tonnes (Mt), 48.5% lower than the base
year (1990)57
, however there was an increase of 0.1 Mt between 2009 and
2010. Of the other UK countries, England has had the largest reduction in
emissions, of 60.9%. As can be seen in table 8, Wales has had a greater reduction
in „end-user‟ methane emissions excluding exports than Northern Ireland over the
past 20 years.
Table 8: ‘End-user’ methane emissions excluding exports and percentage change from base
year (1990), Wales and the other UK countries, 1990 to 2010 (Mt CO2
e)
Source: AEA, Greenhouse Gas Inventories for England, Scotland, Wales and Northern Ireland: 1990-2010: Devolved
Administration GHG Inventory Pivot Tables, August 2012 plus Research Service calculations
57
AEA, Greenhouse Gas Inventories for England, Scotland, Wales and Northern Ireland: 1990-2010, page 75, August
2012 [accessed 24 October 2012]
Year
Emissions
(Mt)
Percentage
change
from base
year
Emissions
(Mt)
Percentage
change
from base
year
Emissions
(Mt)
Percentage
change
from base
year
Emissions
(Mt)
Percentage
change
from base
year
Emissions
(Mt)
Percentage
change
from base
year
1990 7.6 .. 71.6 .. 13.0 .. 4.3 .. 96.7 ..
2003 4.7 -38.8 34.7 -51.5 6.8 -47.9 3.2 -26.4 49.4 -48.9
2004 4.6 -39.8 33.5 -53.2 6.6 -49.6 3.1 -27.2 47.9 -50.5
2005 4.4 -41.6 32.3 -54.9 6.5 -50.2 3.2 -25.1 46.5 -51.9
2006 4.5 -41.2 31.3 -56.4 6.3 -51.6 3.1 -26.9 45.2 -53.2
2007 4.1 -46.3 30.3 -57.7 6.1 -53.0 3.1 -28.3 43.6 -54.9
2008 4.0 -48.0 29.5 -58.8 6.0 -54.3 3.0 -29.3 42.5 -56.0
2009 3.8 -49.5 28.7 -59.9 5.8 -55.4 3.0 -30.2 41.4 -57.2
2010 3.9 -48.5 28.0 -60.9 5.7 -55.9 3.0 -30.0 40.8 -57.8
Wales England Scotland Northern Ireland United Kingdom
22
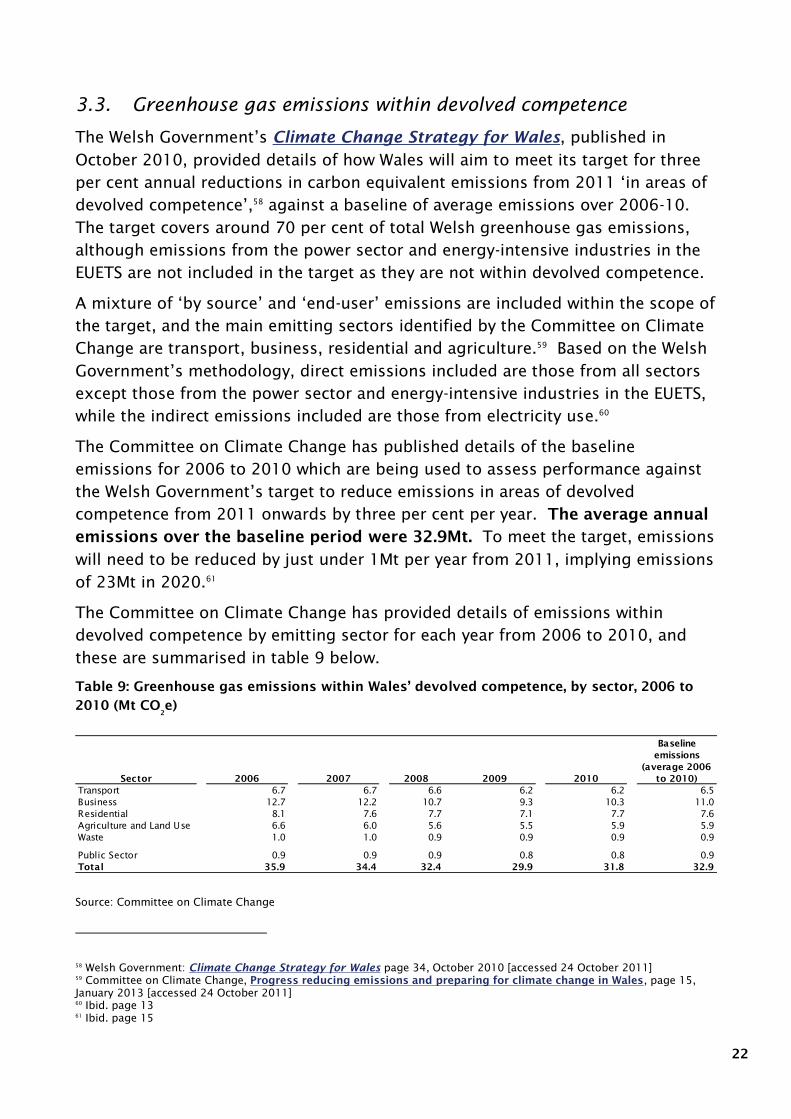
3.3. Greenhouse gas emissions within devolved competence
The Welsh Government‟s Climate Change Strategy for Wales, published in
October 2010, provided details of how Wales will aim to meet its target for three
per cent annual reductions in carbon equivalent emissions from 2011 „in areas of
devolved competence‟,58
against a baseline of average emissions over 2006-10.
The target covers around 70 per cent of total Welsh greenhouse gas emissions,
although emissions from the power sector and energy-intensive industries in the
EUETS are not included in the target as they are not within devolved competence.
A mixture of „by source‟ and „end-user‟ emissions are included within the scope of
the target, and the main emitting sectors identified by the Committee on Climate
Change are transport, business, residential and agriculture.59
Based on the Welsh
Government‟s methodology, direct emissions included are those from all sectors
except those from the power sector and energy-intensive industries in the EUETS,
while the indirect emissions included are those from electricity use.60
The Committee on Climate Change has published details of the baseline
emissions for 2006 to 2010 which are being used to assess performance against
the Welsh Government‟s target to reduce emissions in areas of devolved
competence from 2011 onwards by three per cent per year. The average annual
emissions over the baseline period were 32.9Mt. To meet the target, emissions
will need to be reduced by just under 1Mt per year from 2011, implying emissions
of 23Mt in 2020.61
The Committee on Climate Change has provided details of emissions within
devolved competence by emitting sector for each year from 2006 to 2010, and
these are summarised in table 9 below.
Table 9: Greenhouse gas emissions within Wales’ devolved competence, by sector, 2006 to
2010 (Mt CO2
e)
Source: Committee on Climate Change
58
Welsh Government: Climate Change Strategy for Wales page 34, October 2010 [accessed 24 October 2011]
59
Committee on Climate Change, Progress reducing emissions and preparing for climate change in Wales, page 15,
January 2013 [accessed 24 October 2011]
60
Ibid. page 13
61
Ibid. page 15
Sector 2006 2007 2008 2009 2010
Baseline
emissions
(average 2006
to 2010)
Transport 6.7 6.7 6.6 6.2 6.2 6.5
Business 12.7 12.2 10.7 9.3 10.3 11.0
Residential 8.1 7.6 7.7 7.1 7.7 7.6
Agriculture and Land Use 6.6 6.0 5.6 5.5 5.9 5.9
Waste 1.0 1.0 0.9 0.9 0.9 0.9
Public Sector 0.9 0.9 0.9 0.8 0.8 0.9
Total 35.9 34.4 32.4 29.9 31.8 32.9
23
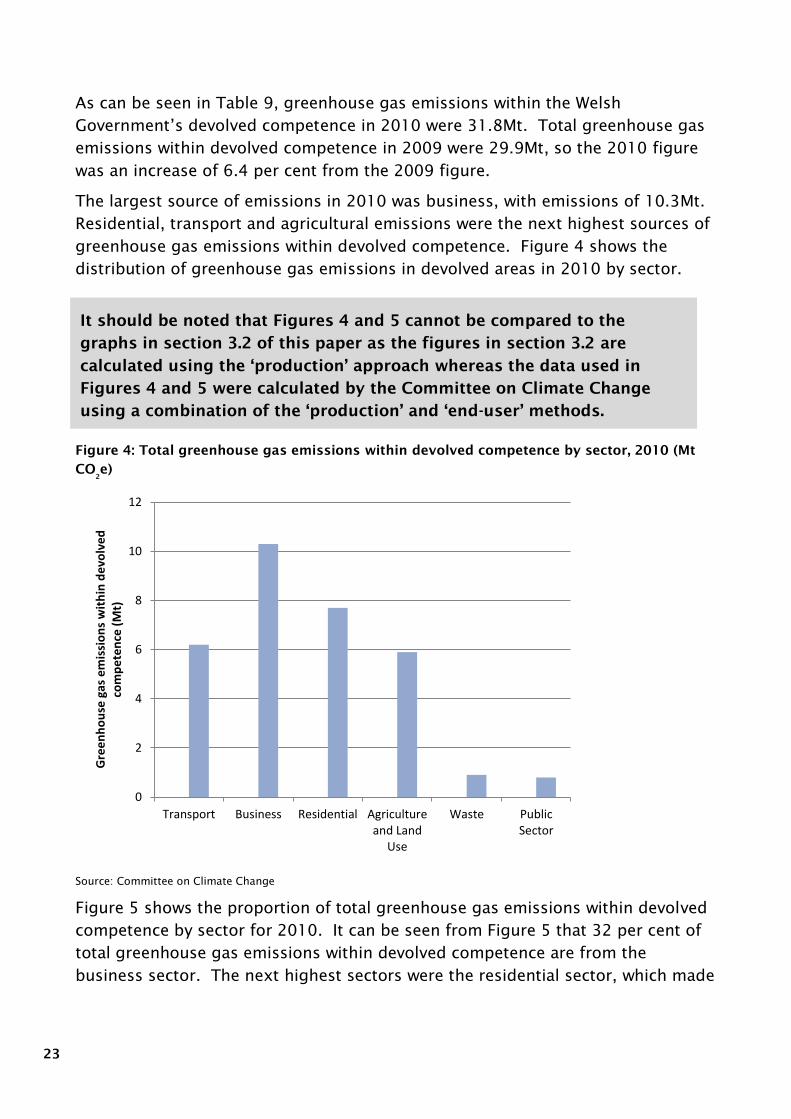
As can be seen in Table 9, greenhouse gas emissions within the Welsh
Government‟s devolved competence in 2010 were 31.8Mt. Total greenhouse gas
emissions within devolved competence in 2009 were 29.9Mt, so the 2010 figure
was an increase of 6.4 per cent from the 2009 figure.
The largest source of emissions in 2010 was business, with emissions of 10.3Mt.
Residential, transport and agricultural emissions were the next highest sources of
greenhouse gas emissions within devolved competence. Figure 4 shows the
distribution of greenhouse gas emissions in devolved areas in 2010 by sector.
Figure 4: Total greenhouse gas emissions within devolved competence by sector, 2010 (Mt
CO2
e)
Source: Committee on Climate Change
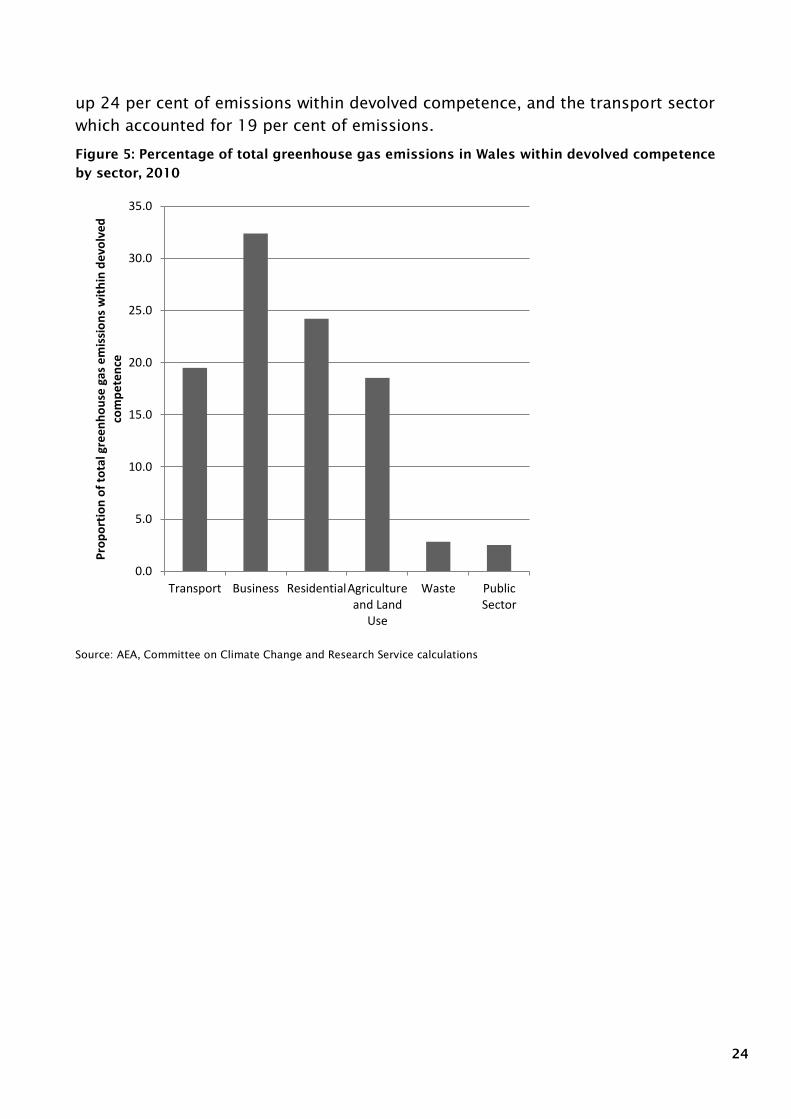
Figure 5 shows the proportion of total greenhouse gas emissions within devolved
competence by sector for 2010. It can be seen from Figure 5 that 32 per cent of
total greenhouse gas emissions within devolved competence are from the
business sector. The next highest sectors were the residential sector, which made
0
2
4
6
8
10
12
Transport Business Residential Agricultureand Land
Use
Waste PublicSector
Gre
en
ho
use
gas
em
issi
on
s w
ith
in d
evo
lve
d
com
pe
ten
ce (
Mt)
It should be noted that Figures 4 and 5 cannot be compared to the
graphs in section 3.2 of this paper as the figures in section 3.2 are
calculated using the ‘production’ approach whereas the data used in
Figures 4 and 5 were calculated by the Committee on Climate Change
using a combination of the ‘production’ and ‘end-user’ methods.
24
up 24 per cent of emissions within devolved competence, and the transport sector
which accounted for 19 per cent of emissions.
Figure 5: Percentage of total greenhouse gas emissions in Wales within devolved competence
by sector, 2010
Source: AEA, Committee on Climate Change and Research Service calculations
0.0
5.0
10.0
15.0
20.0
25.0
30.0
35.0
Transport Business ResidentialAgricultureand Land
Use
Waste PublicSector
Pro
po
rtio
n o
f to
tal g
ree
nh
ou
se g
as e
mis
sio
ns
wit
hin
de
volv
ed
co
mp
ete
nce
25
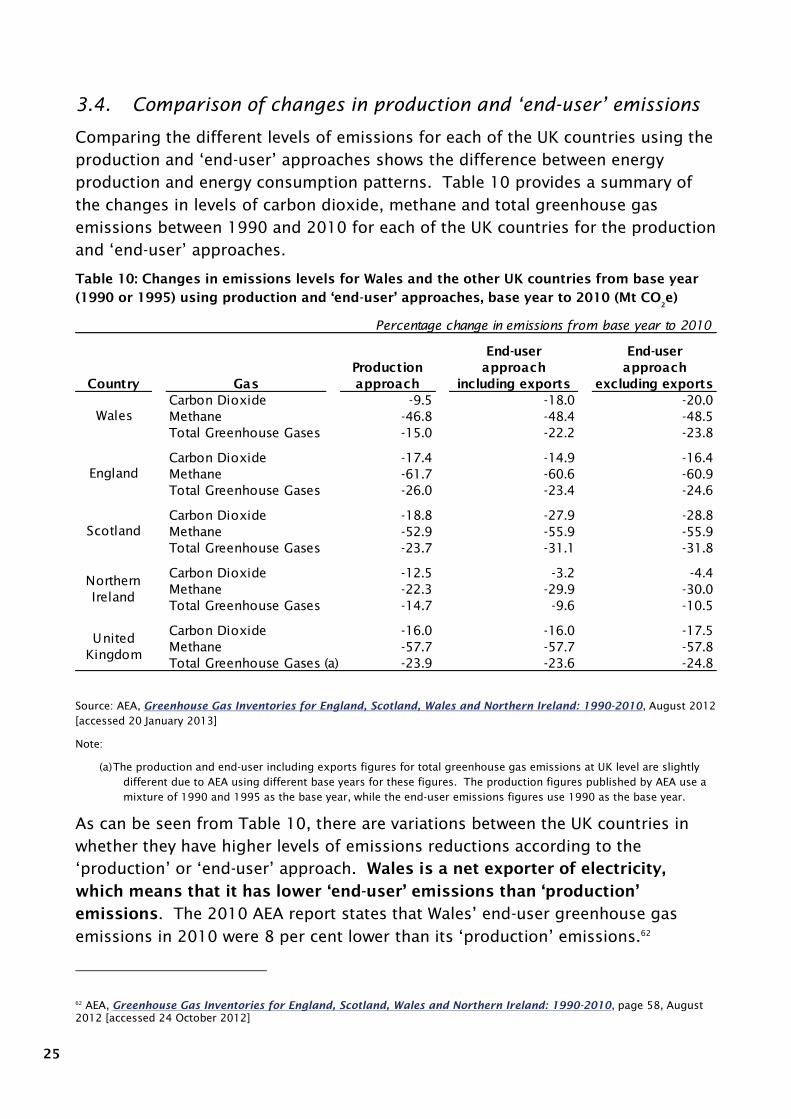
3.4. Comparison of changes in production and ‘end-user’ emissions
Comparing the different levels of emissions for each of the UK countries using the
production and „end-user‟ approaches shows the difference between energy
production and energy consumption patterns. Table 10 provides a summary of
the changes in levels of carbon dioxide, methane and total greenhouse gas
emissions between 1990 and 2010 for each of the UK countries for the production
and „end-user‟ approaches.
Table 10: Changes in emissions levels for Wales and the other UK countries from base year
(1990 or 1995) using production and ‘end-user’ approaches, base year to 2010 (Mt CO2
e)
Source: AEA, Greenhouse Gas Inventories for England, Scotland, Wales and Northern Ireland: 1990-2010, August 2012
[accessed 20 January 2013]
Note:
(a) The production and end-user including exports figures for total greenhouse gas emissions at UK level are slightly
different due to AEA using different base years for these figures. The production figures published by AEA use a
mixture of 1990 and 1995 as the base year, while the end-user emissions figures use 1990 as the base year.
As can be seen from Table 10, there are variations between the UK countries in
whether they have higher levels of emissions reductions according to the
„production‟ or „end-user‟ approach. Wales is a net exporter of electricity,
which means that it has lower ‘end-user’ emissions than ‘production’
emissions. The 2010 AEA report states that Wales‟ end-user greenhouse gas
emissions in 2010 were 8 per cent lower than its „production‟ emissions.62
62
AEA, Greenhouse Gas Inventories for England, Scotland, Wales and Northern Ireland: 1990-2010, page 58, August
2012 [accessed 24 October 2012]
Percentage change in emissions from base year to 2010
Country Gas
Production
approach
End-user
approach
including exports
End-user
approach
excluding exports
Carbon Dioxide -9.5 -18.0 -20.0
Methane -46.8 -48.4 -48.5
Total Greenhouse Gases -15.0 -22.2 -23.8
Carbon Dioxide -17.4 -14.9 -16.4
Methane -61.7 -60.6 -60.9
Total Greenhouse Gases -26.0 -23.4 -24.6
Carbon Dioxide -18.8 -27.9 -28.8
Methane -52.9 -55.9 -55.9
Total Greenhouse Gases -23.7 -31.1 -31.8
Carbon Dioxide -12.5 -3.2 -4.4
Methane -22.3 -29.9 -30.0
Total Greenhouse Gases -14.7 -9.6 -10.5
Carbon Dioxide -16.0 -16.0 -17.5
Methane -57.7 -57.7 -57.8
Total Greenhouse Gases (a) -23.9 -23.6 -24.8
England
Scotland
Northern
Ireland
Wales
United
Kingdom
26
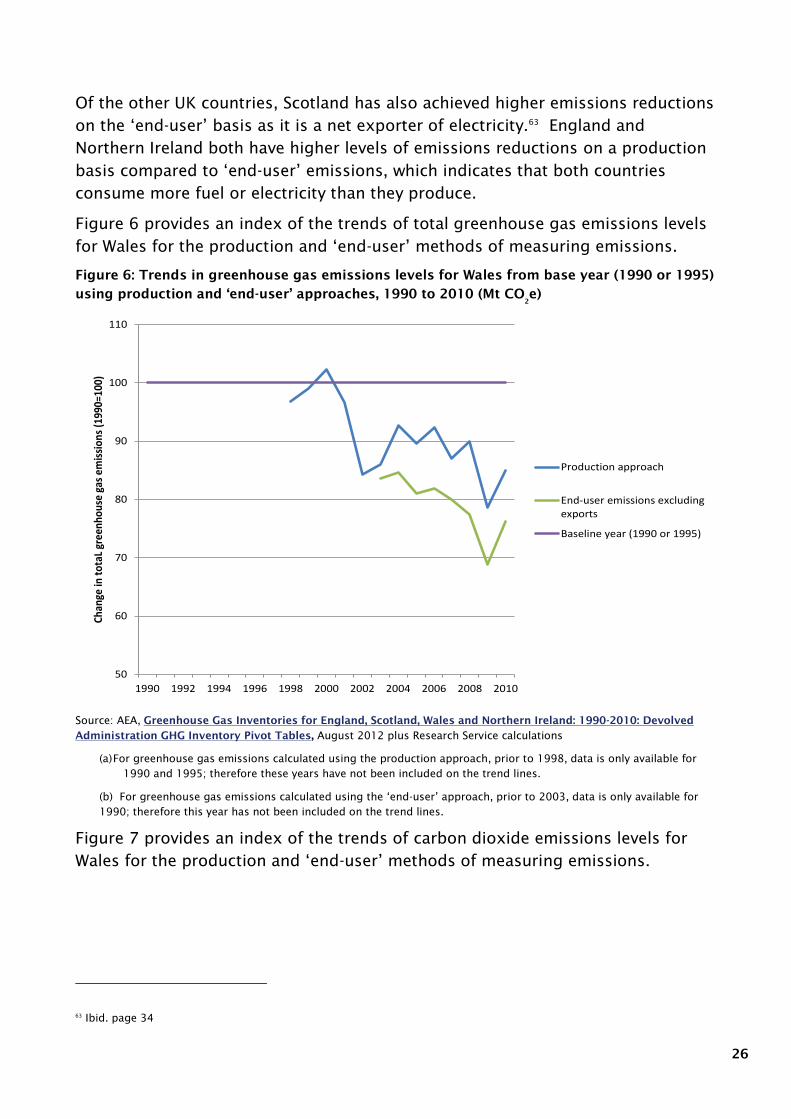
Of the other UK countries, Scotland has also achieved higher emissions reductions
on the „end-user‟ basis as it is a net exporter of electricity.63
England and
Northern Ireland both have higher levels of emissions reductions on a production
basis compared to „end-user‟ emissions, which indicates that both countries
consume more fuel or electricity than they produce.
Figure 6 provides an index of the trends of total greenhouse gas emissions levels
for Wales for the production and „end-user‟ methods of measuring emissions.
Figure 6: Trends in greenhouse gas emissions levels for Wales from base year (1990 or 1995)
using production and ‘end-user’ approaches, 1990 to 2010 (Mt CO2
e)
Source: AEA, Greenhouse Gas Inventories for England, Scotland, Wales and Northern Ireland: 1990-2010: Devolved
Administration GHG Inventory Pivot Tables, August 2012 plus Research Service calculations
(a) For greenhouse gas emissions calculated using the production approach, prior to 1998, data is only available for
1990 and 1995; therefore these years have not been included on the trend lines.
(b) For greenhouse gas emissions calculated using the „end-user‟ approach, prior to 2003, data is only available for
1990; therefore this year has not been included on the trend lines.
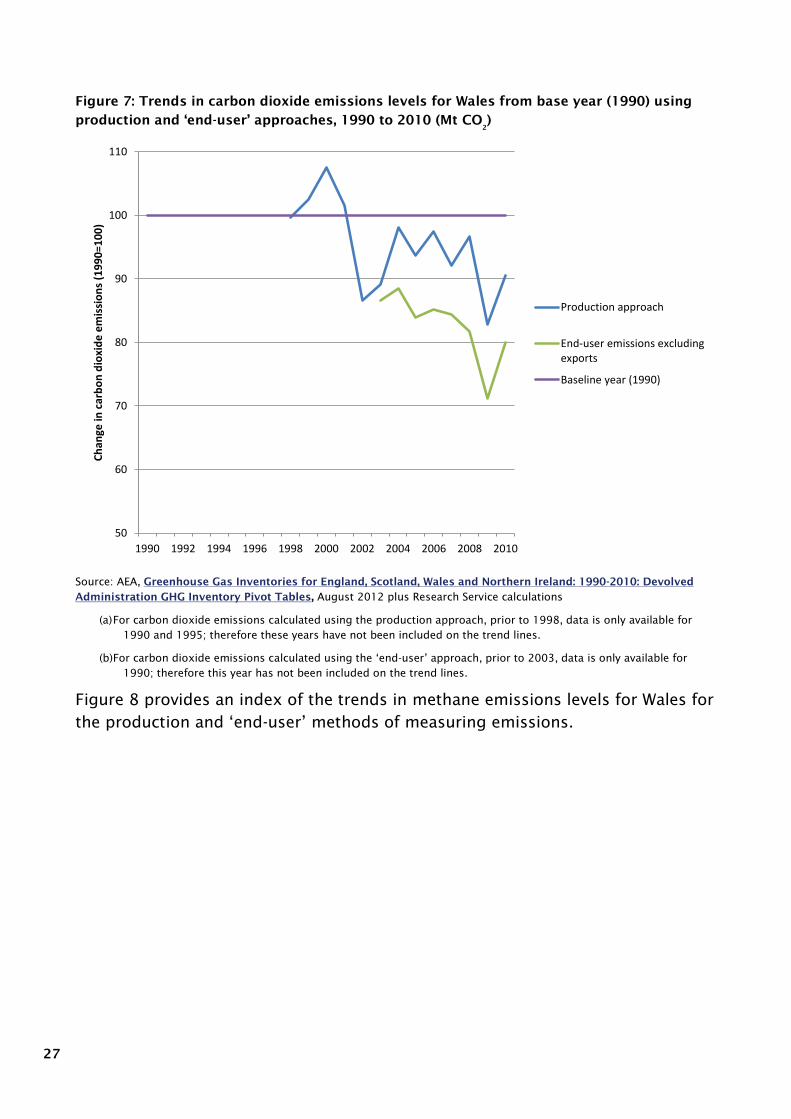
Figure 7 provides an index of the trends of carbon dioxide emissions levels for
Wales for the production and „end-user‟ methods of measuring emissions.
63
Ibid. page 34
50
60
70
80
90
100
110
1990 1992 1994 1996 1998 2000 2002 2004 2006 2008 2010
Chan
ge in
tot
aL g
reen
hous
e ga
s em
issi
ons
(199
0=10
0)
Production approach
End-user emissions excludingexports
Baseline year (1990 or 1995)
27
Figure 7: Trends in carbon dioxide emissions levels for Wales from base year (1990) using
production and ‘end-user’ approaches, 1990 to 2010 (Mt CO2
)
Source: AEA, Greenhouse Gas Inventories for England, Scotland, Wales and Northern Ireland: 1990-2010: Devolved
Administration GHG Inventory Pivot Tables, August 2012 plus Research Service calculations
(a) For carbon dioxide emissions calculated using the production approach, prior to 1998, data is only available for
1990 and 1995; therefore these years have not been included on the trend lines.
(b) For carbon dioxide emissions calculated using the „end-user‟ approach, prior to 2003, data is only available for
1990; therefore this year has not been included on the trend lines.
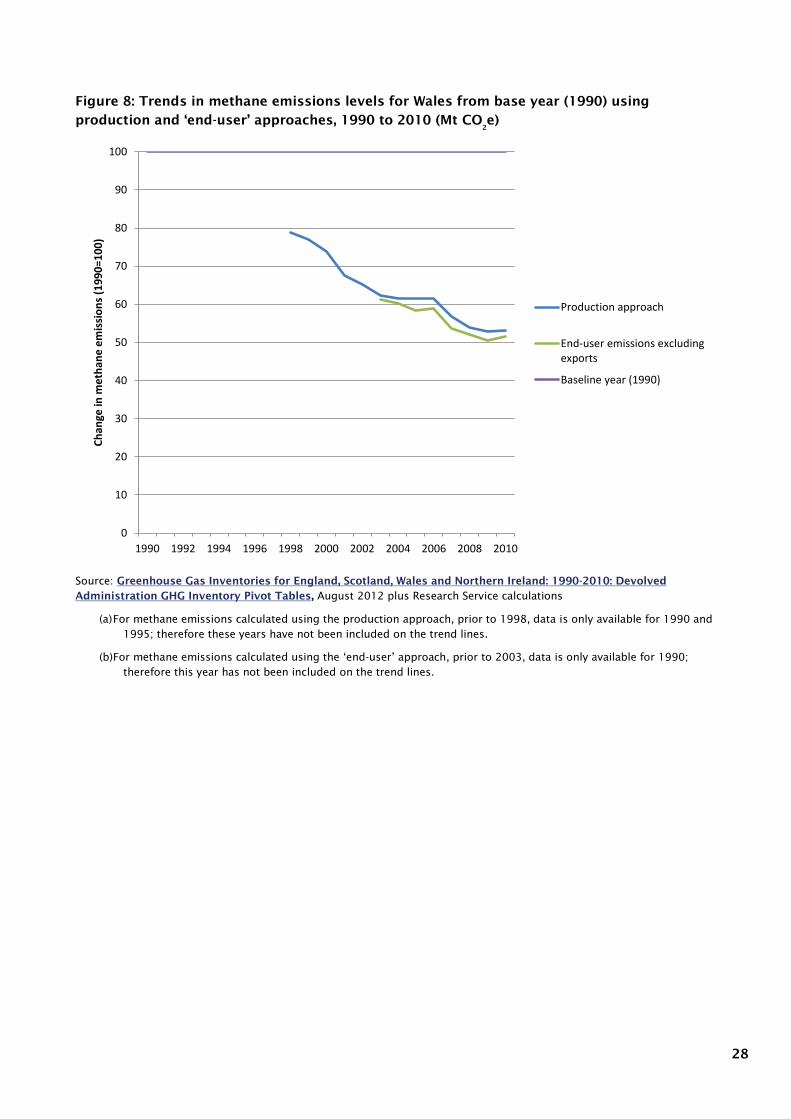
Figure 8 provides an index of the trends in methane emissions levels for Wales for
the production and „end-user‟ methods of measuring emissions.
50
60
70
80
90
100
110
1990 1992 1994 1996 1998 2000 2002 2004 2006 2008 2010
Ch
ange
in c
arb
on
dio
xid
e e
mis
sio
ns
(19
90
=10
0)
Production approach
End-user emissions excludingexports
Baseline year (1990)
28
Figure 8: Trends in methane emissions levels for Wales from base year (1990) using
production and ‘end-user’ approaches, 1990 to 2010 (Mt CO2
e)
Source: Greenhouse Gas Inventories for England, Scotland, Wales and Northern Ireland: 1990-2010: Devolved
Administration GHG Inventory Pivot Tables, August 2012 plus Research Service calculations
(a) For methane emissions calculated using the production approach, prior to 1998, data is only available for 1990 and
1995; therefore these years have not been included on the trend lines.
(b) For methane emissions calculated using the „end-user‟ approach, prior to 2003, data is only available for 1990;
therefore this year has not been included on the trend lines.
0
10
20
30
40
50
60
70
80
90
100
1990 1992 1994 1996 1998 2000 2002 2004 2006 2008 2010
Ch
ange
in m
eth
ane
em
issi
on
s (1
99
0=1
00
)
Production approach
End-user emissions excludingexports
Baseline year (1990)
29
3.5. Local authority carbon dioxide emissions
Figures at a local authority level are available for carbon dioxide emissions, both
for all emissions within local authorities and for emissions that are within the
scope of local authorities‟ influence. This paper includes both sets of figures to
provide further detail on carbon dioxide emissions within local authorities.
3.5.1. Total carbon dioxide emissions within local authorities
The principal methodology for allocating emissions to local authorities allocates
emissions on an „end user‟ basis. As explained at the start of Section 3 in this
paper, this means that emissions are distributed according to the point of energy
consumption or the point of emission if non-energy related. Emissions from the
production of goods are assigned to where the production takes place.
The values arising from this methodology give an idea of geographical use, rather
than production, so it is useful in informing about emissions from use of energy
in local authority areas. Detailed carbon dioxide emissions for 2010 by sector,
and local authority are shown in table 11. Figures were first collected by the UK
Government‟s Department for Energy and Climate Change (DECC) in 2005. Figure
9 shows the percentage change in total carbon dioxide emissions between 2005
and 2010, by local authority, while figure 10 shows the shows the percentage
change in total carbon dioxide emissions between 2009 and 2010.
The Wales figure for total „end-user‟ carbon dioxide emissions in table 11 (32.2Mt)
differs from the figure in table 7 (33.8Mt) as there are a number of
methodological differences in how the two datasets are assembled. Additionally,
some sectors are excluded from the figures in table 11, including domestic
shipping, domestic aviation, military transport and international shipping and
aviation.64
64
DECC, Local and regional CO2 emissions for 2005-2010 - Full dataset – Wales Reconciliation, 23 August 2012
[accessed 25 October 2012]
30
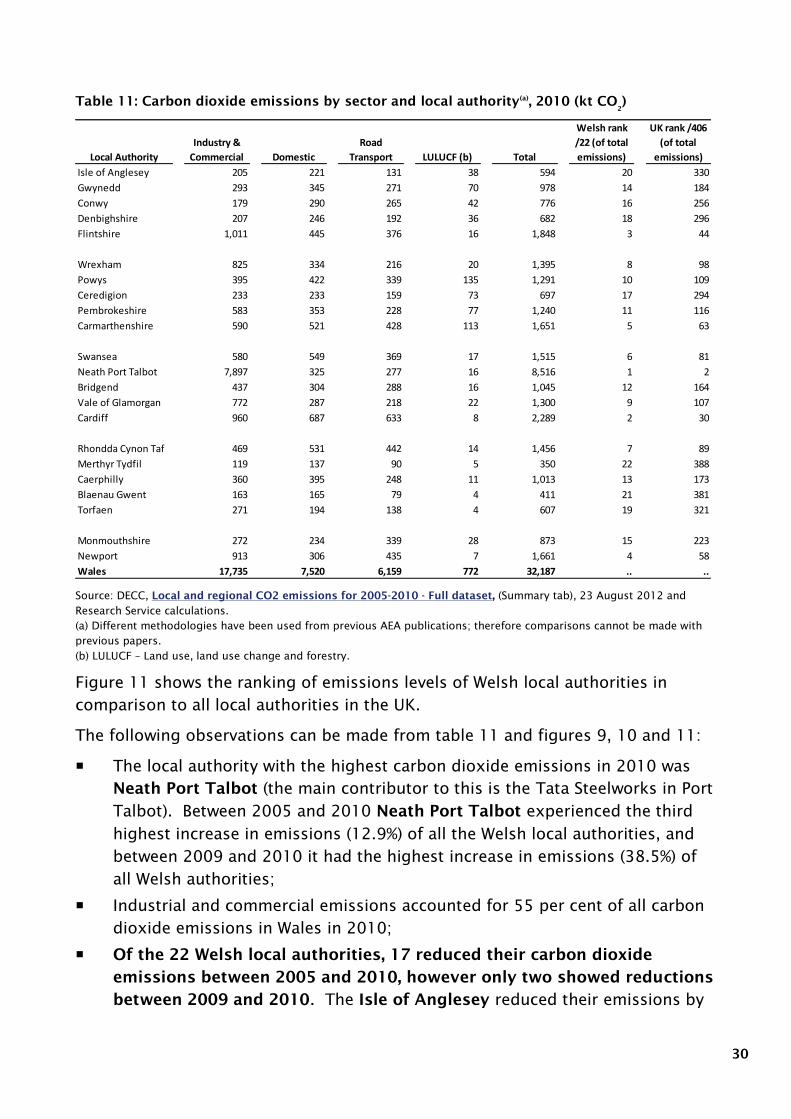
Table 11: Carbon dioxide emissions by sector and local authority(a)
, 2010 (kt CO2
)
Source: DECC, Local and regional CO2 emissions for 2005-2010 - Full dataset, (Summary tab), 23 August 2012 and
Research Service calculations.
(a) Different methodologies have been used from previous AEA publications; therefore comparisons cannot be made with
previous papers.
(b) LULUCF – Land use, land use change and forestry.
Figure 11 shows the ranking of emissions levels of Welsh local authorities in
comparison to all local authorities in the UK.
The following observations can be made from table 11 and figures 9, 10 and 11:
The local authority with the highest carbon dioxide emissions in 2010 was
Neath Port Talbot (the main contributor to this is the Tata Steelworks in Port
Talbot). Between 2005 and 2010 Neath Port Talbot experienced the third
highest increase in emissions (12.9%) of all the Welsh local authorities, and
between 2009 and 2010 it had the highest increase in emissions (38.5%) of
all Welsh authorities;
Industrial and commercial emissions accounted for 55 per cent of all carbon
dioxide emissions in Wales in 2010;
Of the 22 Welsh local authorities, 17 reduced their carbon dioxide
emissions between 2005 and 2010, however only two showed reductions
between 2009 and 2010. The Isle of Anglesey reduced their emissions by
Local Authority
Industry &
Commercial Domestic
Road
Transport LULUCF (b) Total
Welsh rank
/22 (of total
emissions)
UK rank /406
(of total
emissions)
Isle of Anglesey 205 221 131 38 594 20 330
Gwynedd 293 345 271 70 978 14 184
Conwy 179 290 265 42 776 16 256
Denbighshire 207 246 192 36 682 18 296
Flintshire 1,011 445 376 16 1,848 3 44
Wrexham 825 334 216 20 1,395 8 98
Powys 395 422 339 135 1,291 10 109
Ceredigion 233 233 159 73 697 17 294
Pembrokeshire 583 353 228 77 1,240 11 116
Carmarthenshire 590 521 428 113 1,651 5 63
Swansea 580 549 369 17 1,515 6 81
Neath Port Talbot 7,897 325 277 16 8,516 1 2
Bridgend 437 304 288 16 1,045 12 164
Vale of Glamorgan 772 287 218 22 1,300 9 107
Cardiff 960 687 633 8 2,289 2 30
Rhondda Cynon Taf 469 531 442 14 1,456 7 89
Merthyr Tydfil 119 137 90 5 350 22 388
Caerphilly 360 395 248 11 1,013 13 173
Blaenau Gwent 163 165 79 4 411 21 381
Torfaen 271 194 138 4 607 19 321
Monmouthshire 272 234 339 28 873 15 223
Newport 913 306 435 7 1,661 4 58
Wales 17,735 7,520 6,159 772 32,187 .. ..
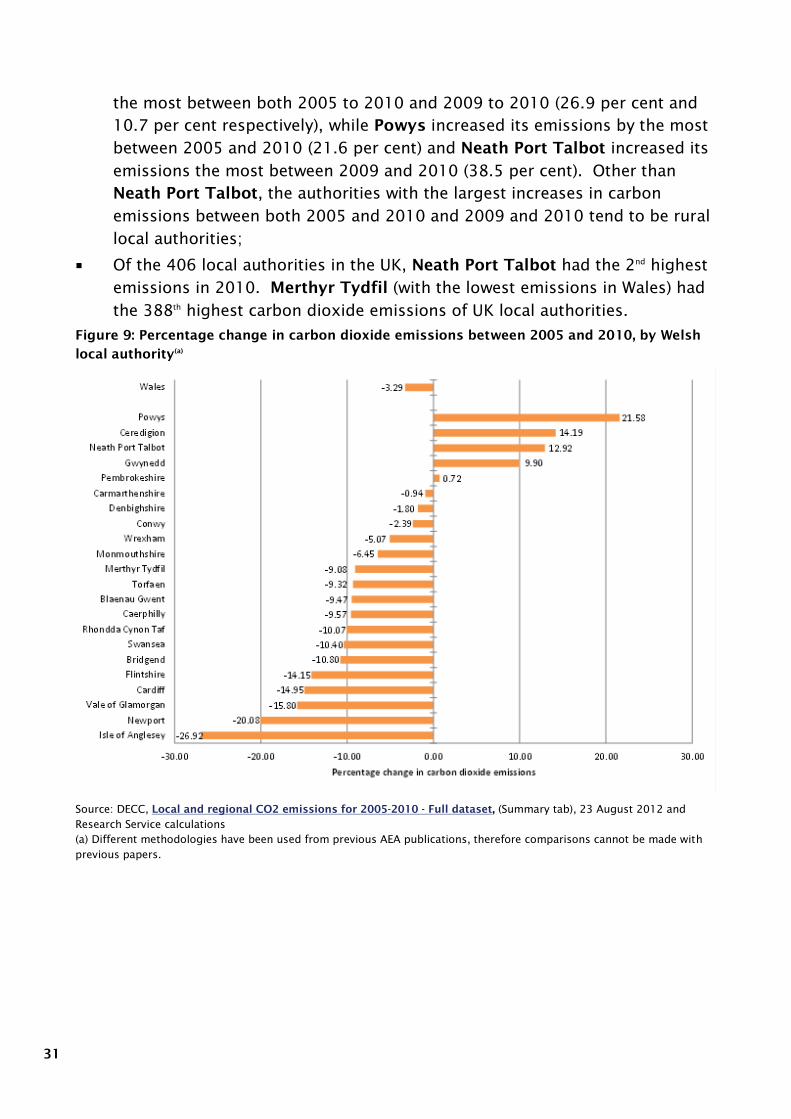
31
the most between both 2005 to 2010 and 2009 to 2010 (26.9 per cent and
10.7 per cent respectively), while Powys increased its emissions by the most
between 2005 and 2010 (21.6 per cent) and Neath Port Talbot increased its
emissions the most between 2009 and 2010 (38.5 per cent). Other than
Neath Port Talbot, the authorities with the largest increases in carbon
emissions between both 2005 and 2010 and 2009 and 2010 tend to be rural
local authorities;
Of the 406 local authorities in the UK, Neath Port Talbot had the 2nd
highest
emissions in 2010. Merthyr Tydfil (with the lowest emissions in Wales) had
the 388th
highest carbon dioxide emissions of UK local authorities.
Figure 9: Percentage change in carbon dioxide emissions between 2005 and 2010, by Welsh
local authority(a)
Source: DECC, Local and regional CO2 emissions for 2005-2010 - Full dataset, (Summary tab), 23 August 2012 and
Research Service calculations
(a) Different methodologies have been used from previous AEA publications, therefore comparisons cannot be made with
previous papers.

32
Figure 10: Percentage change in carbon dioxide emissions between 2009 and 2010, by Welsh
local authority(a)
Source: DECC, Local and regional CO2 emissions for 2005-2010 - Full dataset, (Summary tab), 23 August 2012 and
Research Service calculations
(a) Different methodologies have been used from previous AEA publications, therefore comparisons cannot be made with
previous papers.
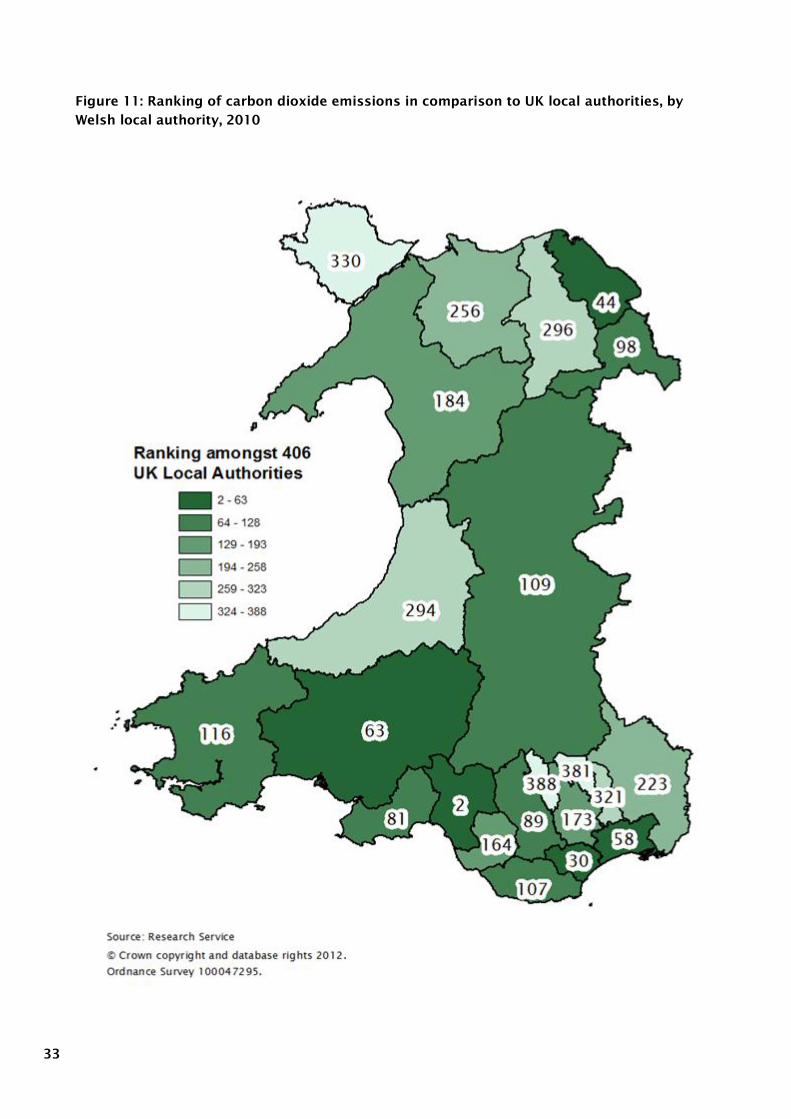
33
Figure 11: Ranking of carbon dioxide emissions in comparison to UK local authorities, by
Welsh local authority, 2010
34
Per capita emissions provide an indication of the level of emissions in comparison
with the population size of a local authority. Table 12 provides carbon dioxide
emissions per capita in 2010 by sector, while figure 12 highlights the
geographical differences of the total emissions per capita.
The following observations can be made from table 12 and figure 12:
The highest emissions per capita were in Neath Port Talbot (62 tonnes per
capita), while Caerphilly had the lowest (5.9 tonnes per capita). (The main
contributor to the high Neath Port Talbot figure is the Tata steelworks in Port
Talbot);
The contribution of the Tata steelworks to the Neath Port Talbot figure is
also reflected in its industry and commercial carbon dioxide emissions, which
at 57.5 tonnes per capita are the highest in Wales. Conwy had the lowest
industrial and commercial emissions, 1.6 tonnes per capita;
There is little difference between domestic carbon dioxide emissions across
Wales, ranging from 2.0 to 3.2 tonnes per capita. Cardiff had the lowest
domestic emissions, while the Isle of Anglesey and Powys had the highest;
Monmouthshire had the highest road transport emissions per capita, at 3.8
tonnes per capita, while Blaenau Gwent had the lowest, 1.2 tonnes per
capita.
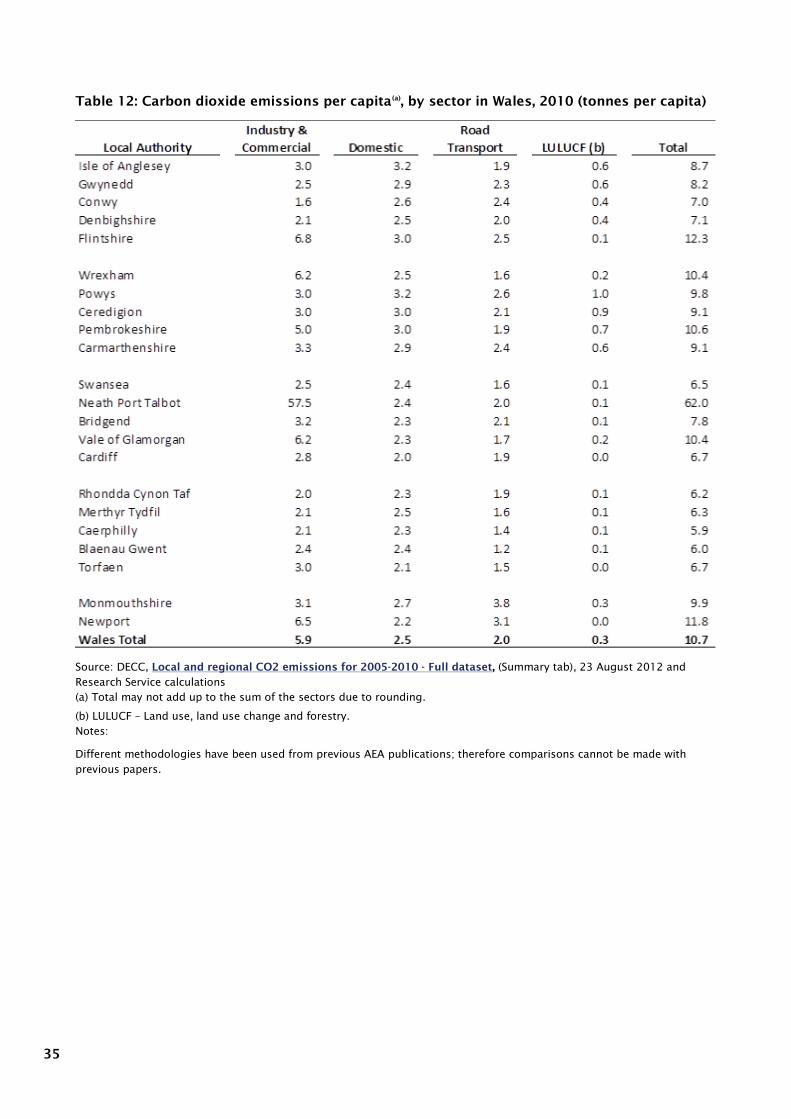
35
Table 12: Carbon dioxide emissions per capita(a)
, by sector in Wales, 2010 (tonnes per capita)
Source: DECC, Local and regional CO2 emissions for 2005-2010 - Full dataset, (Summary tab), 23 August 2012 and
Research Service calculations
(a) Total may not add up to the sum of the sectors due to rounding.
(b) LULUCF – Land use, land use change and forestry.
Notes:
Different methodologies have been used from previous AEA publications; therefore comparisons cannot be made with
previous papers.
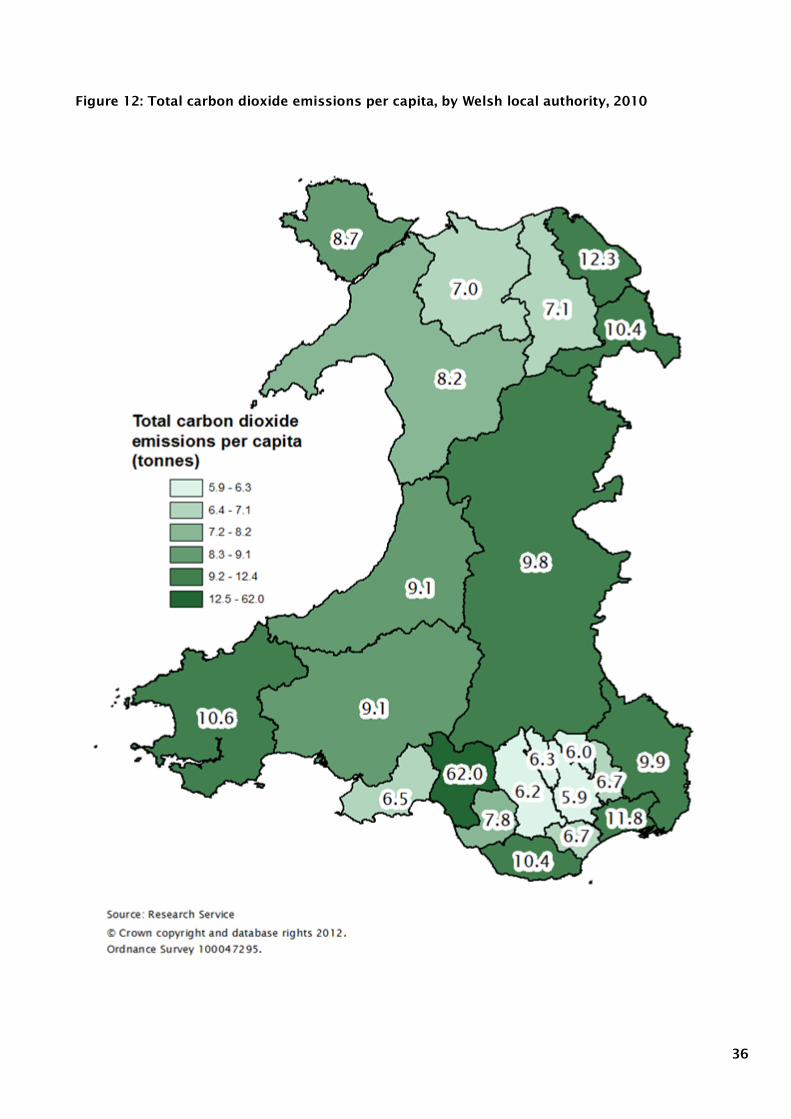
36
Figure 12: Total carbon dioxide emissions per capita, by Welsh local authority, 2010
37
3.5.2. Carbon dioxide emissions that local authorities can influence
DECC also collates a dataset which represents the level of carbon dioxide
emissions that local authorities are directly able to influence. This excludes a
number of types of emissions that it deems are not within the scope local
authorities‟ influence. These are:
Motorways – all emissions from the “Road transport (motorways)” sector have been
removed;
EU Emissions trading schemes sites – these emissions have been removed from the
“Large industrial installations” sector, with the exception of energy suppliers (e.g.
power stations), whose emissions are indirectly included via the end-user estimates
for electricity use. Note that not all the emissions from the “Large industrial
installations” sector are produced by EU ETS installations, hence the fact that there
are emissions remaining in this sector in the subset;
Diesel railways – all emissions from the “Diesel Railways” sector have been excluded;
Land Use, Land Use Change, and Forestry – all emissions belonging to the “LULUCF
Net emissions” sector have been excluded from the main dataset.65
Figures for carbon dioxide emissions within the scope of local authorities for
2010 by sector, and local authority are shown in table 13. Figures were first
collected by DECC in 2005. Figure 13 shows the percentage change in carbon
dioxide emissions within the scope of local authorities between 2005 and 2010,
by local authority. Figure 14 shows the percentage change in carbon dioxide
emissions within the scope of local authorities between 2009 and 2010.
65
DECC, 2010 Local Authority CO2 emissions estimates: Statistical summary, pages 18-19, 20 September 2012
[accessed 26 September 2012]
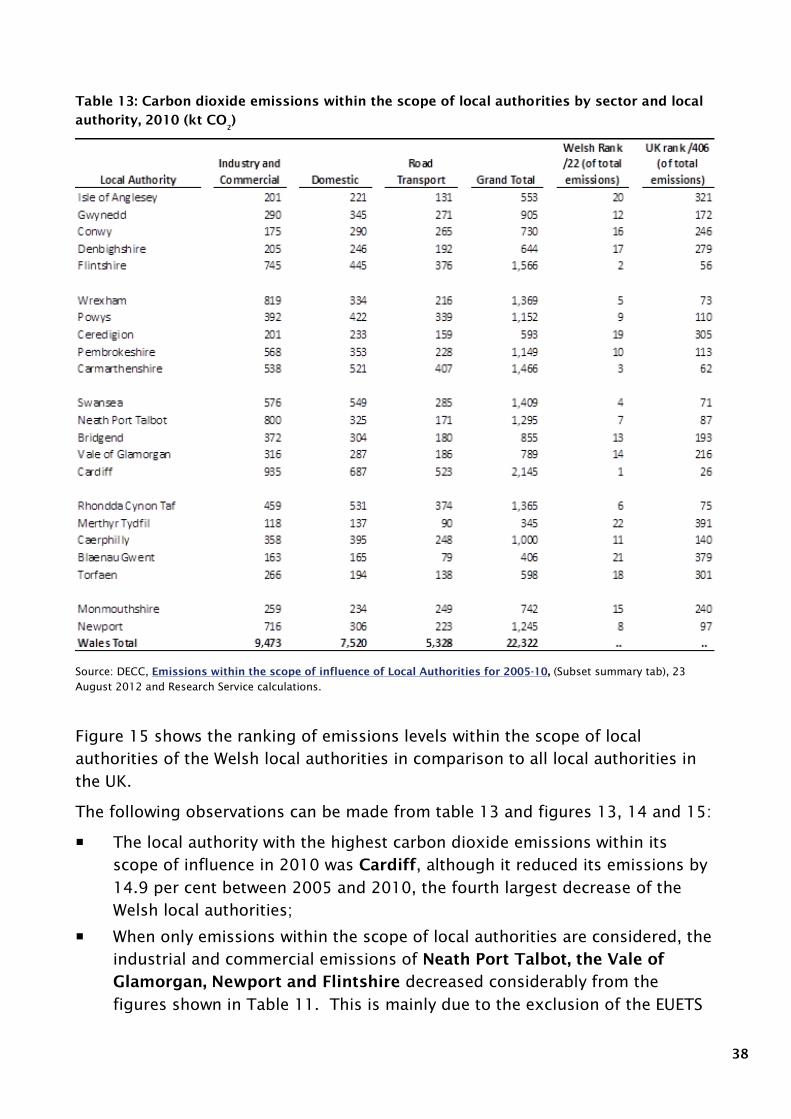
38
Table 13: Carbon dioxide emissions within the scope of local authorities by sector and local
authority, 2010 (kt CO2
)
Source: DECC, Emissions within the scope of influence of Local Authorities for 2005-10, (Subset summary tab), 23
August 2012 and Research Service calculations.
Figure 15 shows the ranking of emissions levels within the scope of local
authorities of the Welsh local authorities in comparison to all local authorities in
the UK.
The following observations can be made from table 13 and figures 13, 14 and 15:
The local authority with the highest carbon dioxide emissions within its
scope of influence in 2010 was Cardiff, although it reduced its emissions by
14.9 per cent between 2005 and 2010, the fourth largest decrease of the
Welsh local authorities;
When only emissions within the scope of local authorities are considered, the
industrial and commercial emissions of Neath Port Talbot, the Vale of
Glamorgan, Newport and Flintshire decreased considerably from the
figures shown in Table 11. This is mainly due to the exclusion of the EUETS
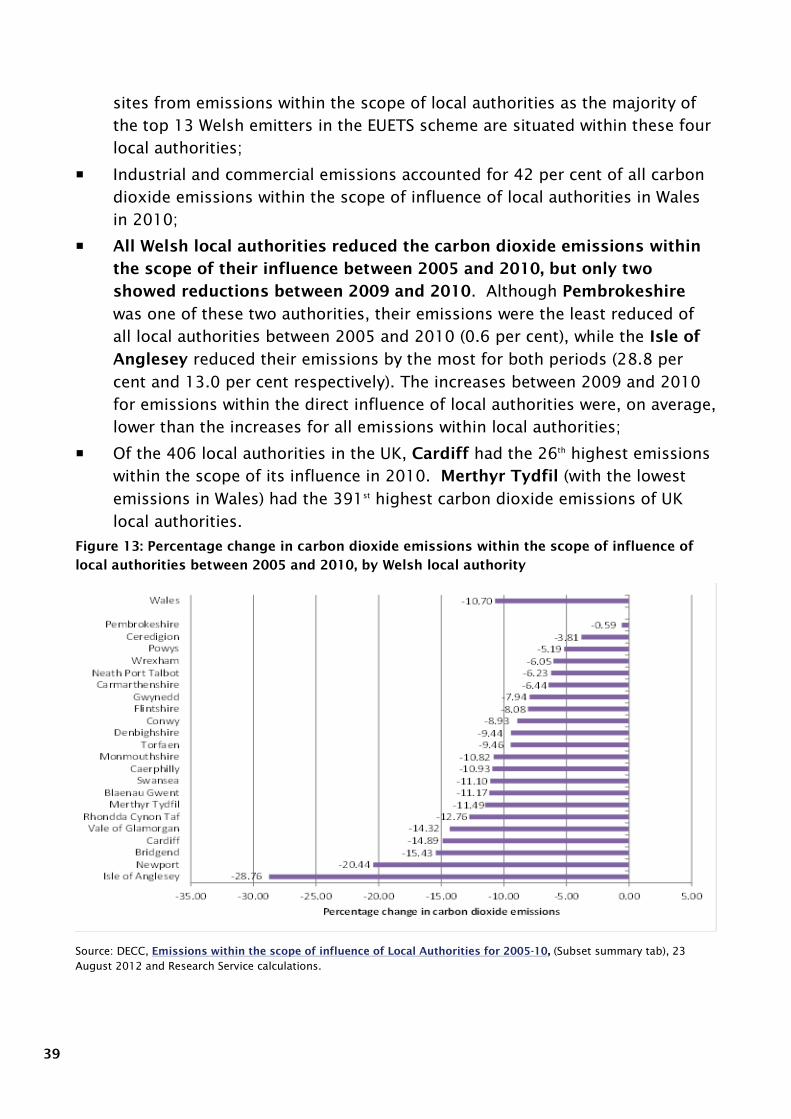
39
sites from emissions within the scope of local authorities as the majority of
the top 13 Welsh emitters in the EUETS scheme are situated within these four
local authorities;
Industrial and commercial emissions accounted for 42 per cent of all carbon
dioxide emissions within the scope of influence of local authorities in Wales
in 2010;
All Welsh local authorities reduced the carbon dioxide emissions within
the scope of their influence between 2005 and 2010, but only two
showed reductions between 2009 and 2010. Although Pembrokeshire
was one of these two authorities, their emissions were the least reduced of
all local authorities between 2005 and 2010 (0.6 per cent), while the Isle of
Anglesey reduced their emissions by the most for both periods (28.8 per
cent and 13.0 per cent respectively). The increases between 2009 and 2010
for emissions within the direct influence of local authorities were, on average,
lower than the increases for all emissions within local authorities;
Of the 406 local authorities in the UK, Cardiff had the 26th
highest emissions
within the scope of its influence in 2010. Merthyr Tydfil (with the lowest
emissions in Wales) had the 391st
highest carbon dioxide emissions of UK
local authorities.
Figure 13: Percentage change in carbon dioxide emissions within the scope of influence of
local authorities between 2005 and 2010, by Welsh local authority
Source: DECC, Emissions within the scope of influence of Local Authorities for 2005-10, (Subset summary tab), 23
August 2012 and Research Service calculations.
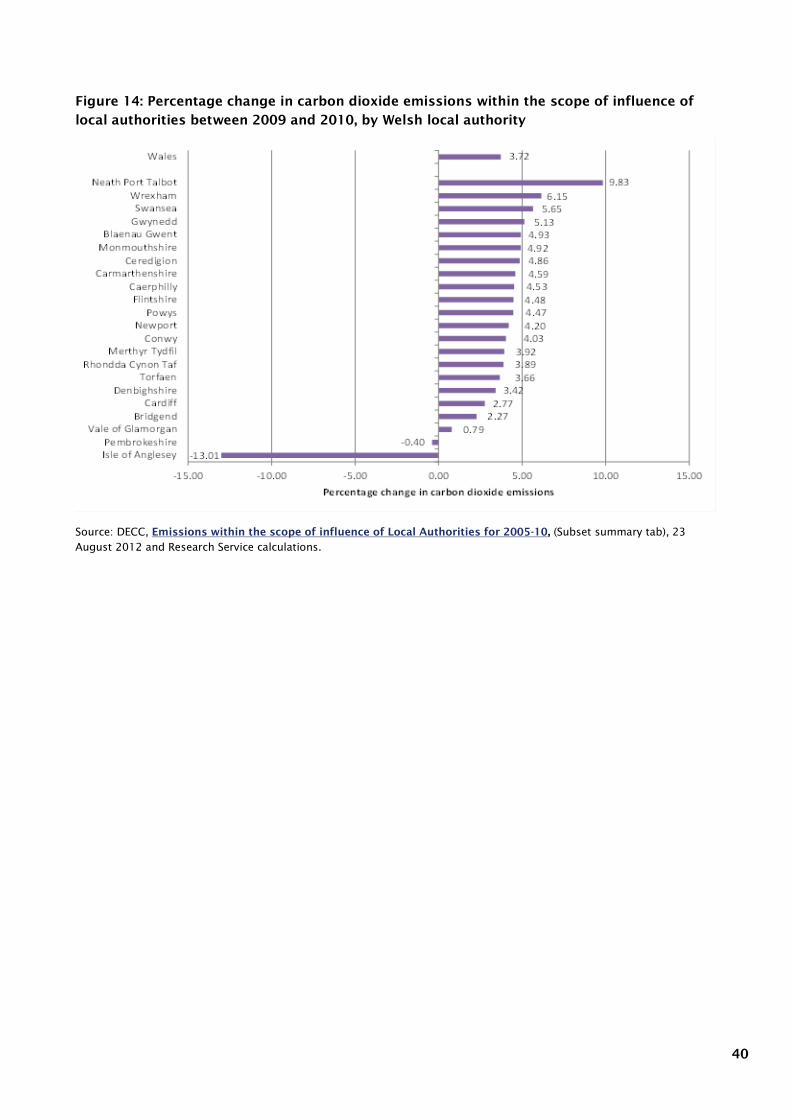
40
Figure 14: Percentage change in carbon dioxide emissions within the scope of influence of
local authorities between 2009 and 2010, by Welsh local authority
Source: DECC, Emissions within the scope of influence of Local Authorities for 2005-10, (Subset summary tab), 23
August 2012 and Research Service calculations.
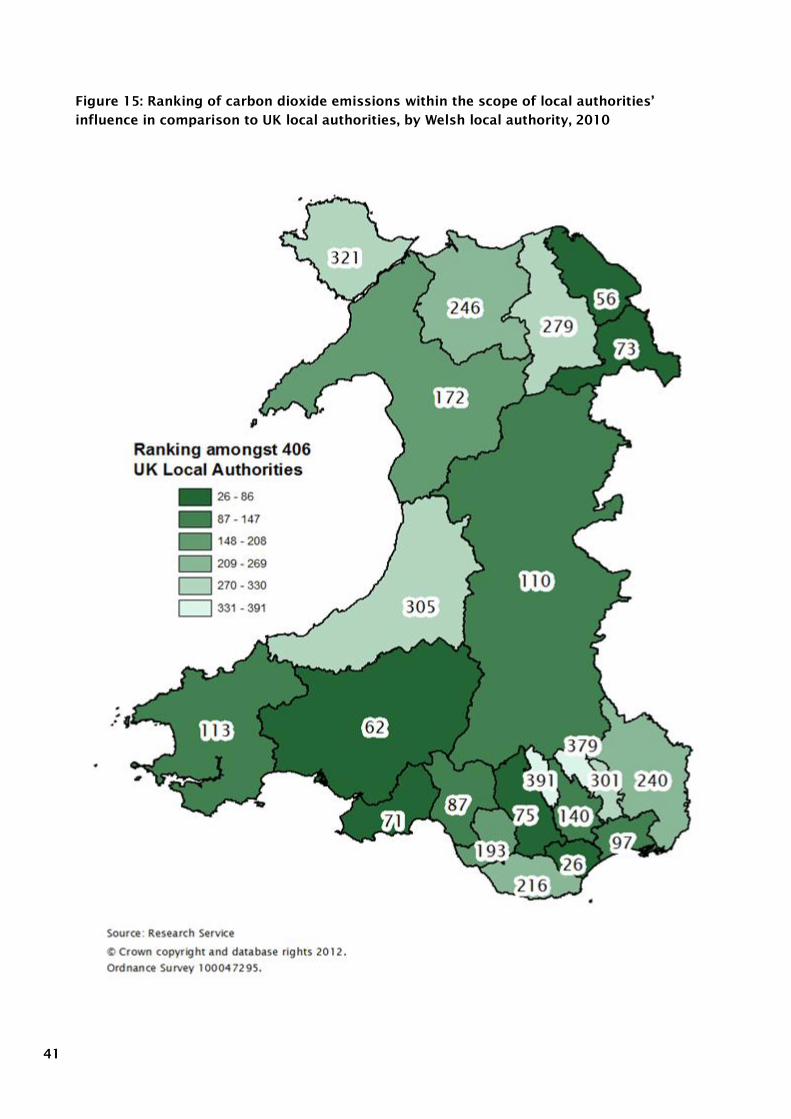
41
Figure 15: Ranking of carbon dioxide emissions within the scope of local authorities’
influence in comparison to UK local authorities, by Welsh local authority, 2010
42
Per capita emissions provide an indication of the level of emissions in comparison
with the population size of a local authority. Table 14 provides carbon dioxide
emissions per capita within the scope of local authorities in 2010 by sector, while
figure 16 highlights the geographical differences of emissions per capita.
The following observations can be made from table 14 and figure 16:
The highest emissions per capita were in Flintshire (10.5 tonnes per capita),
while Rhondda Cynon Taf and Caerphilly had the joint lowest (5.8 tonnes
per capita);
At 6.1 tonnes per capita, Wrexham’s industrial and commercial emissions
are the highest in Wales. Conwy had the lowest industrial and commercial
emissions, 1.6 tonnes per capita;
There is little difference between domestic carbon dioxide emissions across
Wales, ranging from 2.0 to 3.2 tonnes per capita. Cardiff had the lowest
domestic emissions, while the Isle of Anglesey and Powys had the joint
highest; and
Monmouthshire had the highest road transport emissions per capita, at 2.8
tonnes per capita, while Blaenau Gwent, Swansea and Neath Port Talbot
had the lowest, at 1.2 tonnes per capita.
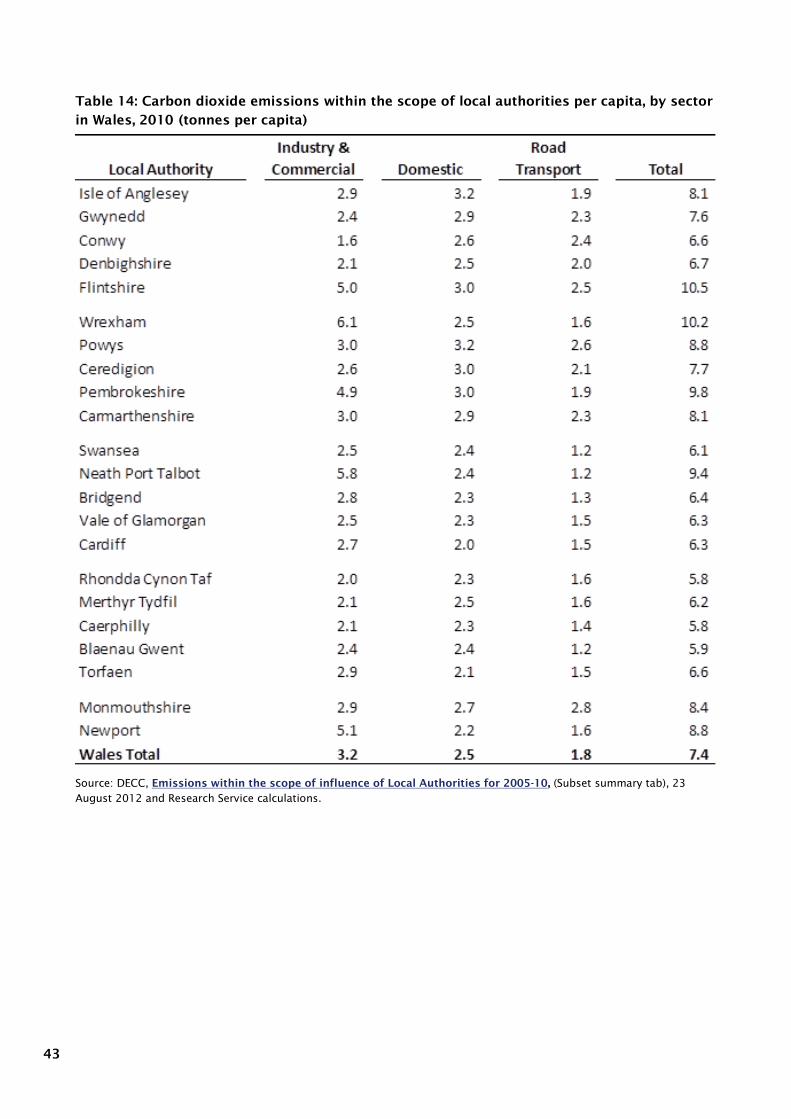
43
Table 14: Carbon dioxide emissions within the scope of local authorities per capita, by sector
in Wales, 2010 (tonnes per capita)
Source: DECC, Emissions within the scope of influence of Local Authorities for 2005-10, (Subset summary tab), 23
August 2012 and Research Service calculations.
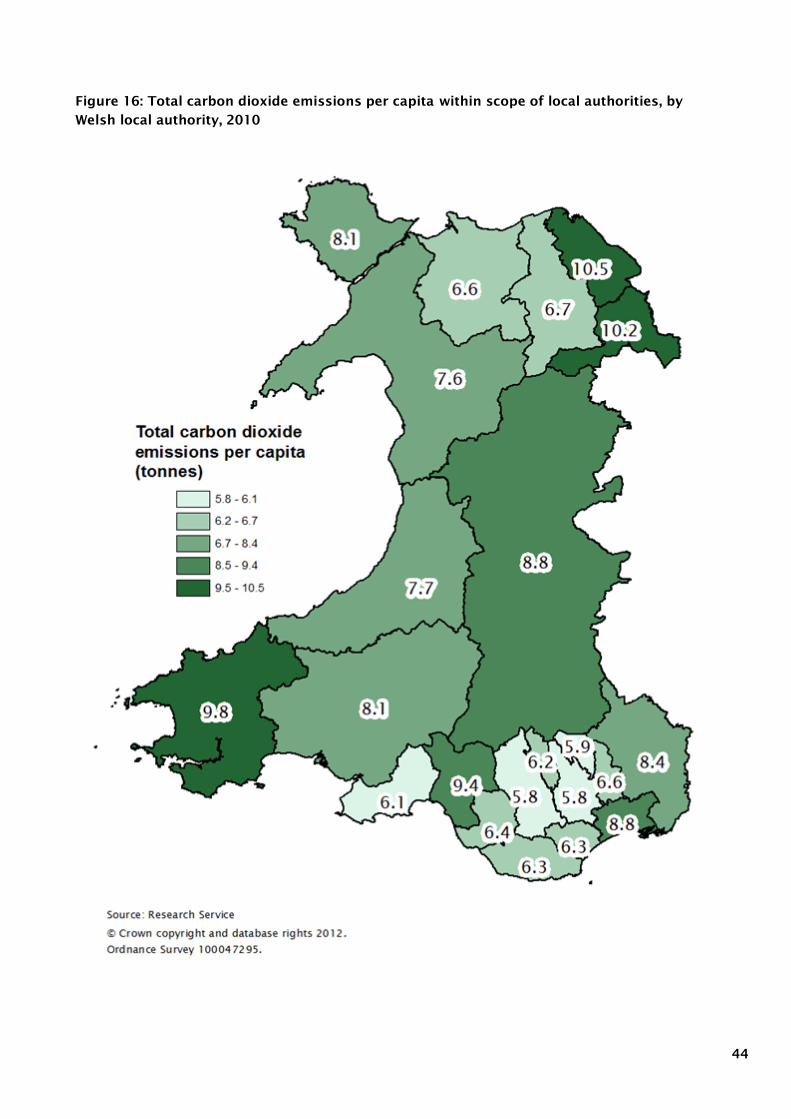
44
Figure 16: Total carbon dioxide emissions per capita within scope of local authorities, by
Welsh local authority, 2010
45
4. Useful links and further information
The links below provide further information about the data sources in this paper
and also contain links to further information about greenhouse gas emissions at
an international, European, UK and Welsh level.
Climate Change Commission for Wales
Welsh Government website on Climate Change
The Welsh Government‟s Wales Carbon Footprint website
The Department of Energy and Climate Change (DECC)
Greenhouse Gas Inventories for England, Scotland, Wales and Northern
Ireland: 1990 to 2010, published by AEA
2010 Local Authority Carbon Dioxide figures, published by DECC
Emissions within the scope of influence of Local Authorities for 2005-10,
published by DECC
Reducing emissions and preparing for climate change in Wales: 2011
Progress Report, published by the Climate Change Commission
The UK Government‟s Carbon Plan
The UK Government‟s Committee on Climate Change
The Met Office Hadley Centre
Tyndall Centre for Climate Change Research
European Climate Change Programme
UN Framework Convention on Climate Change
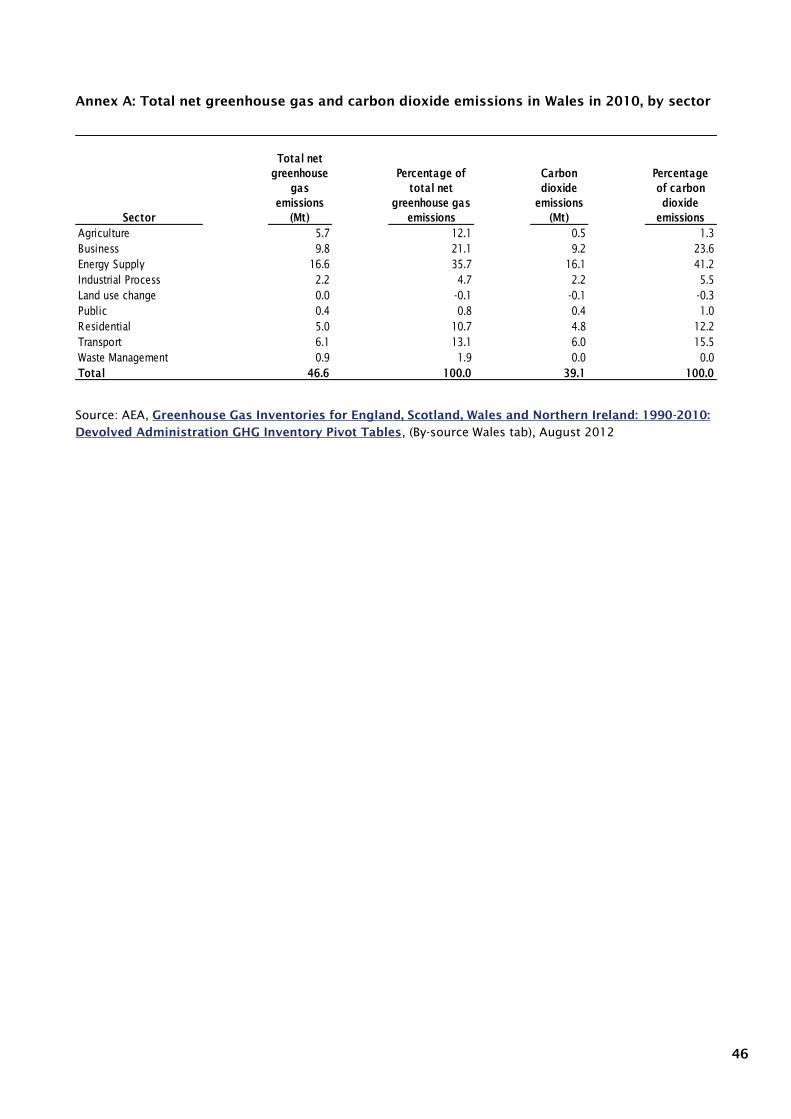
46
Annex A: Total net greenhouse gas and carbon dioxide emissions in Wales in 2010, by sector
Source: AEA, Greenhouse Gas Inventories for England, Scotland, Wales and Northern Ireland: 1990-2010:
Devolved Administration GHG Inventory Pivot Tables, (By-source Wales tab), August 2012
Sector
Total net
greenhouse
gas
emissions
(Mt)
Percentage of
total net
greenhouse gas
emissions
Carbon
dioxide
emissions
(Mt)
Percentage
of carbon
dioxide
emissions
Agriculture 5.7 12.1 0.5 1.3
Business 9.8 21.1 9.2 23.6
Energy Supply 16.6 35.7 16.1 41.2
Industrial Process 2.2 4.7 2.2 5.5
Land use change 0.0 -0.1 -0.1 -0.3
Public 0.4 0.8 0.4 1.0
Residential 5.0 10.7 4.8 12.2
Transport 6.1 13.1 6.0 15.5
Waste Management 0.9 1.9 0.0 0.0
Total 46.6 100.0 39.1 100.0


![Greenhouse Gas Emissions and Emissions Trading in North … · 2020. 2. 23. · 2002] Stephenson-Greenhouse Gas Emissions, Kyoto and U.S. Response 45 greenhouse gas molecules. This](https://img.pdfslide.net/doc/110x75/60facf56e286b02f9b10de99/greenhouse-gas-emissions-and-emissions-trading-in-north-2020-2-23-2002-stephenson-greenhouse.jpg)