Embed Size (px)
Citation preview
Greenhouse gas emissions report Centre of Expertise for the Environment in France Page 1
www.renault-trucks.com 16 December 2015
GREENHOUSE GAS EMISSIONS
REPORT
RENAULT TRUCKS SAS
Reporting year: 2014 Reference year: 2011
Greenhouse gas emissions report Centre of Expertise for the Environment in France Page 2
16 December 2015
Table of contents:
1 Legal context ................................................................................................................................................. 3
2 Identification of the legal entity .................................................................................................................... 3
3 Changes in the company between 2011 and 2014 ......................................................................................... 6
4 Key stages ..................................................................................................................................................... 6
5 Definition of selected GHG emissions headings ........................................................................................... 7
6 Consolidated results of the GHG report for Renault Trucks SAS ............................................................... 11
6.1. Recalculation for Renault Trucks SAS reference year 2011 ....................................................................... 11
6.2. Details of greenhouse gas emissions 2014 for Renault Trucks SAS ........................................................... 13
6.3. Comparison and analysis of GHG emissions for Renault Trucks SAS between 2011 and 2014 ................ 15
6.4. Regulatory table .......................................................................................................................................... 18
7 Action plan .................................................................................................................................................. 19
Greenhouse gas emissions report Centre of Expertise for the Environment in France Page 3
16 December 2015
GREENHOUSE GAS EMISSIONS REPORT In accordance with article 75 of law No. 2010-788 of 12 July 2010 on the national commitment to the
environment (ENE)
1 Legal context
Article 75 of Law No. 2010-788 of 12 July 2010 on the national commitment to the environment (ENE)
creates a new section in Chapter IX of Title II of Part II of the Environmental code under the title
"Greenhouse gas emissions report and territorial climate-energy plan" (Bilan des émissions de gaz à
effet de serre et plan climat-énergie territorial).
Article 75 is a reflection of the two commitments based on the Grenelle Law on the environment:
Firstly, Commitment No. 51 lays down the principle of the widespread use of greenhouse
gas emission audits. Greenhouse gas emissions reports are intended to diagnose the
greenhouse gas emissions of public and private parties, with the aim of identifying and
deploying means of reducing these emissions.
Secondly, Commitment No. 50 lays down the principle of the widespread use of territorial
climate-energy plans. The widespread use of these plans is implemented in parallel with the
creation of the regional climate, air and energy schemes defined in Article 68 of the law of
12 July 2010, and which will serve as a strategic framework and assistance tool for the
preparation of territorial climate-energy plans.
The greenhouse gas emissions report is made public and updated every 3 years. This report is
mandatory for legal entities operating under private law and employing over 500 people in mainland
France or over 250 people in overseas regions and departments.
The report must be transmitted electronically to the prefect for the region within whose scope the legal
entity has its registered office or its main site before this date. The report focuses on the activities of
the legal entity subject to tax on French territory.
A first report was transmitted in 2012; this document is the update required before 31 December 2015.
2 Identification of the legal entity
The legal entity is RENAULT TRUCKS SAS.
Company name: RENAULT TRUCKS SAS
NAF code: 2910Z
SIREN code: 954 506 077
Address: 99 route de Lyon, 69806 Saint-Priest Cedex
Workforce: 7696 employees
President: Olivier VIDAL de la BLACHE
Person responsible for follow-up: Sandrine THOMAS, Centre of Expertise for the Environment
France
Greenhouse gas emissions report Centre of Expertise for the Environment in France Page 4
16 December 2015
Consolidation mode: operational control
The following SIRET numbers are associated with the legal entity:
BOURG-EN-BRESSE: SIRET 954 506 077 00377
BLAINVILLE-SUR-ORNE: SIRET 954 506 077 00559
LIMOGES Remanufacturing: SIRET 954 506.077.01201
SAINT-PRIEST: SIRET 954 506 077 00120
Saint-Priest AXLE plant: SIRET 954 506 077 01029
Address of website where the greenhouse gas emissions report can be accessed:
http://corporate.renault-trucks.com/en/environnement/
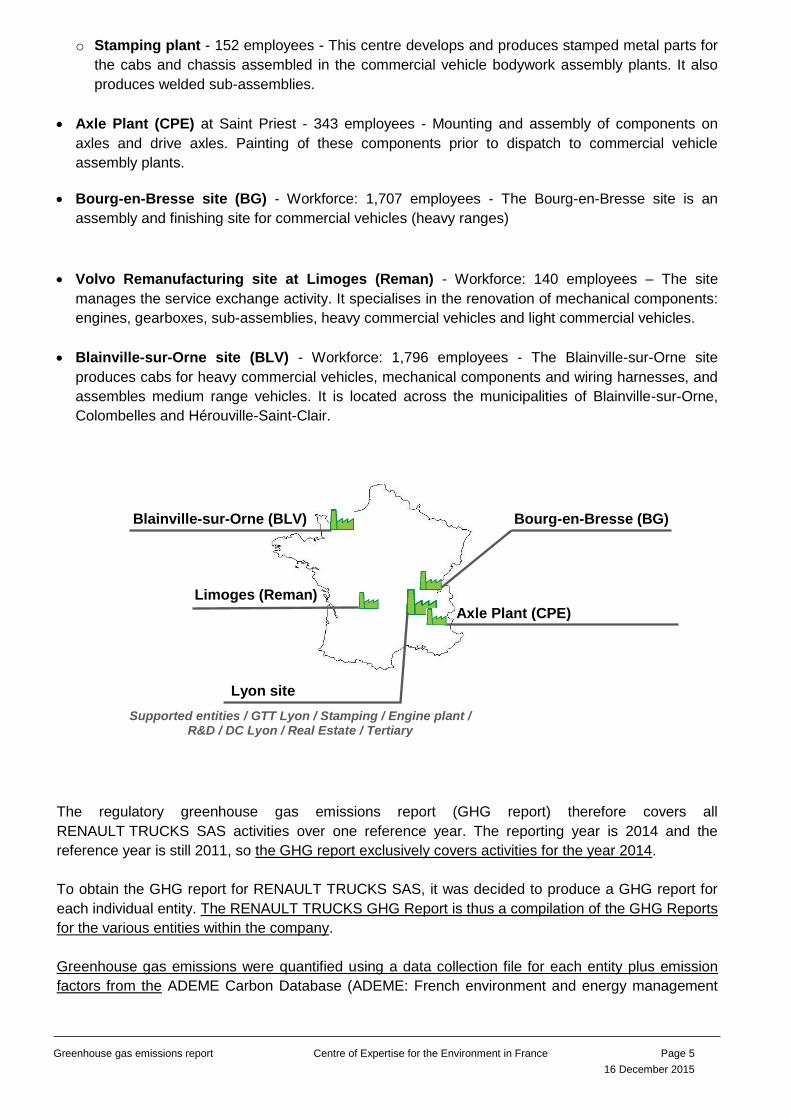
RENAULT TRUCKS is a French company which develops, assembles and sells heavy and light
commercial vehicles. The company also provides services relating to vehicles and transport
(assistance, maintenance, fleet management tools, etc.). It has been part of the Volvo group since
2001. The company operates five sites located in France:
Lyon site – 5,2381 employees - It is based:
- partly at Vénissieux, an industrial assembly site for two families of engines, 5- and 8-litre engines
and 9- and 11-litre engines, a stamping plant and a spare parts store, and support services such as
computer support, purchasing and real estate management;
- partly at Saint-Priest, an administrative site with sales divisions, R&D and support functions such
as finance, human resources, etc. The Vénissieux factory was constructed in 1915 and the
Saint-Priest site dates back to the 1970s. The total surface area of the site is about 140 hectares,
with approximately 100 buildings. Detailed breakdown:
o Entities supported – 2,169 employees - The supported Entities consist of tertiary premises
distributed across Saint-Priest and Vénissieux, in other words all the divisions and departments
required for the operation of the site (technical, catering, medical, human resources, accounting,
computing, maintenance, purchasing, etc.). They also include the offices in Paris XVI
(commercial)
o Distribution Center Lyon (DC Lyon) - Workforce: 560 employees - Receiving, storage, order
preparation and dispatch of spare parts and consumables for the maintenance of commercial
vehicles: stores and offices.
o Engine plant (UM) - 607 employees - Machining and assembly of engines for commercial
vehicles, industrial applications, marine applications, public construction works and the
preparation of gearboxes (hub).
o Group Trucks Technology GTT – 1,750 employees - Research and development for the
group: Test workshops and Offices with departments, after-sales support. This entity also
includes the Valbonne site in Ain (vehicle test tracks)
1 Personnel numbers include workers on permanent, fixed-term and temporary contracts.
Greenhouse gas emissions report Centre of Expertise for the Environment in France Page 5
16 December 2015
o Stamping plant - 152 employees - This centre develops and produces stamped metal parts for
the cabs and chassis assembled in the commercial vehicle bodywork assembly plants. It also
produces welded sub-assemblies.
Axle Plant (CPE) at Saint Priest - 343 employees - Mounting and assembly of components on
axles and drive axles. Painting of these components prior to dispatch to commercial vehicle
assembly plants.
Bourg-en-Bresse site (BG) - Workforce: 1,707 employees - The Bourg-en-Bresse site is an
assembly and finishing site for commercial vehicles (heavy ranges)
Volvo Remanufacturing site at Limoges (Reman) - Workforce: 140 employees – The site
manages the service exchange activity. It specialises in the renovation of mechanical components:
engines, gearboxes, sub-assemblies, heavy commercial vehicles and light commercial vehicles.
Blainville-sur-Orne site (BLV) - Workforce: 1,796 employees - The Blainville-sur-Orne site
produces cabs for heavy commercial vehicles, mechanical components and wiring harnesses, and
assembles medium range vehicles. It is located across the municipalities of Blainville-sur-Orne,
Colombelles and Hérouville-Saint-Clair.
The regulatory greenhouse gas emissions report (GHG report) therefore covers all
RENAULT TRUCKS SAS activities over one reference year. The reporting year is 2014 and the
reference year is still 2011, so the GHG report exclusively covers activities for the year 2014.
To obtain the GHG report for RENAULT TRUCKS SAS, it was decided to produce a GHG report for
each individual entity. The RENAULT TRUCKS GHG Report is thus a compilation of the GHG Reports
for the various entities within the company.
Greenhouse gas emissions were quantified using a data collection file for each entity plus emission
factors from the ADEME Carbon Database (ADEME: French environment and energy management
Axle Plant (CPE)
Bourg-en-Bresse (BG)
Lyon site
Supported entities / GTT Lyon / Stamping / Engine plant / R&D / DC Lyon / Real Estate / Tertiary
Blainville-sur-Orne (BLV)
Limoges (Reman)
Greenhouse gas emissions report Centre of Expertise for the Environment in France Page 6
16 December 2015
agency), using version 3d of the Method for compiling greenhouse gas emission reports (September
2015) issued by the Ministry of Ecology, Sustainable Development, and Energy.
The Renault Trucks SAS Centre of Expertise for the Environment in France organised and approved
the different phases of the project for this purpose. When launching the project, the individuals
assigned to the greenhouse gas emissions report for each entity were appointed.
In addition to the GHG report for each of the entities, compilations were produced for the Lyon site
and for the Blainville site comprising seven centres.
To ensure the continuing availability of the GHG report, a collaborative space has been reserved in a
Team Place2. This space contains a set of documents such as the various CO2 reports or regulations
and access to the various spreadsheets used to calculate greenhouse gas emissions and action
plans.
3 Changes in the company between 2011 and 2014
Between 2011 and 2014, the scope of the study has not changed (no new sites and no sites
removed). The nature of the activities and operations has not changed. Notable changes affecting the
results of the GHG report relate to the downward trend in the number of employees and production.
4 Key stages
The regulatory environment prompted RENAULT TRUCKS SAS to produce a Greenhouse Gas
Emissions Report (GHG report). To produce the GHG report and the associated action plan, the
following main principles are described below:
1. Site management awareness defined the context of the study, targets and the role of each
player.
2. Data collection led to the finalisation of the scope of the study; i.e. all the flows taken into
account to produce a GHG report meeting the regulatory requirements.
3. The Use and assessment phase is the stage where activity data are converted into CO2
equivalents (referred to below as CO2e).
4. After GHG diagnostics, working sessions were organised in order to identify the Potential
action to reduce the CO2 footprint of activities per topic. Priorities were decided and actions
were costed.
2 https://teamplace.volvo.com/sites/rt-Environment/GHGassessment (internal tool with access authorisation)
Greenhouse gas emissions report Centre of Expertise for the Environment in France Page 7
16 December 2015
5. Finally, in the last stage, the action plan was presented to and approved by the Executive or
Works Committee. The Reporting phase led to the drafting of the action plan to be submitted
to the Prefecture and an internal action plan based on the proposals made in the previous
phase.
5 Definition of selected GHG emissions headings
As highlighted in the method description, the legal entity must specify whether the selected auditing
method is "financial3" or "operational4". Renault Trucks decided to opt for an operational auditing
method since the company prefers to use all means of reducing CO2 in line with current
environmental management systems on sites with ISO 14001 certification.
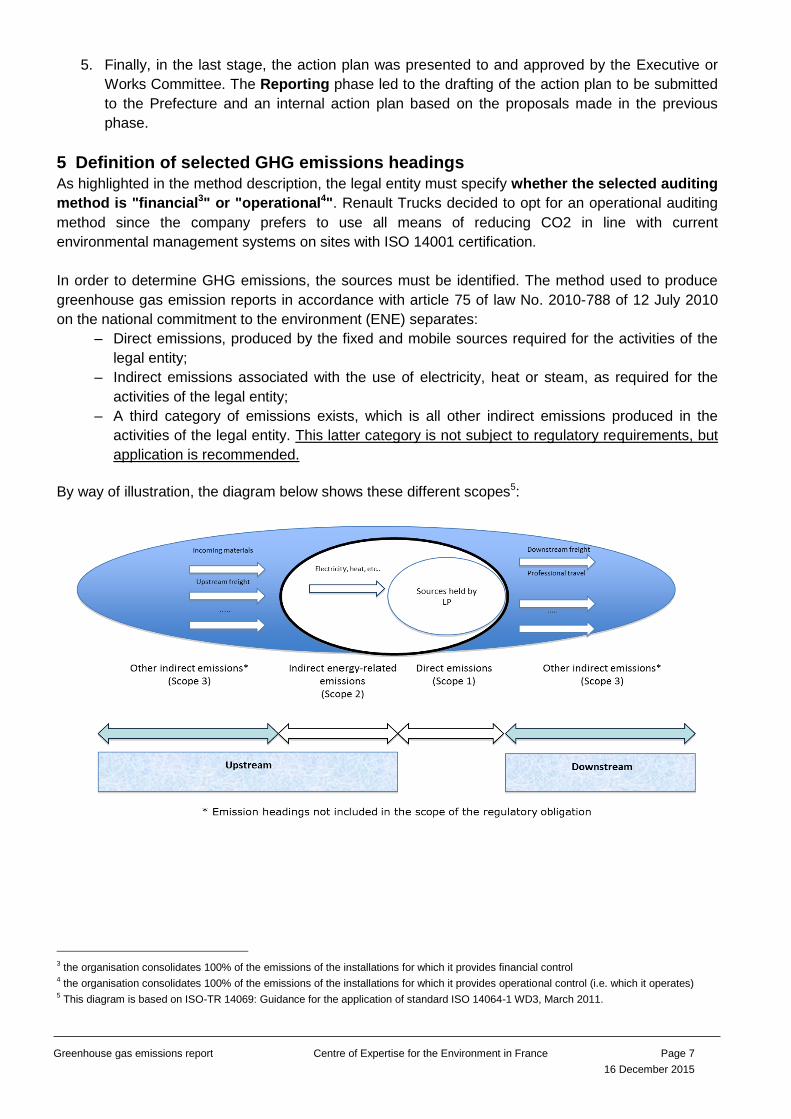
In order to determine GHG emissions, the sources must be identified. The method used to produce
greenhouse gas emission reports in accordance with article 75 of law No. 2010-788 of 12 July 2010
on the national commitment to the environment (ENE) separates:
– Direct emissions, produced by the fixed and mobile sources required for the activities of the
legal entity;
– Indirect emissions associated with the use of electricity, heat or steam, as required for the
activities of the legal entity;
– A third category of emissions exists, which is all other indirect emissions produced in the
activities of the legal entity. This latter category is not subject to regulatory requirements, but
application is recommended.
By way of illustration, the diagram below shows these different scopes5:
3 the organisation consolidates 100% of the emissions of the installations for which it provides financial control
4 the organisation consolidates 100% of the emissions of the installations for which it provides operational control (i.e. which it operates)
5 This diagram is based on ISO-TR 14069: Guidance for the application of standard ISO 14064-1 WD3, March 2011.
Greenhouse gas emissions report Centre of Expertise for the Environment in France Page 8
16 December 2015
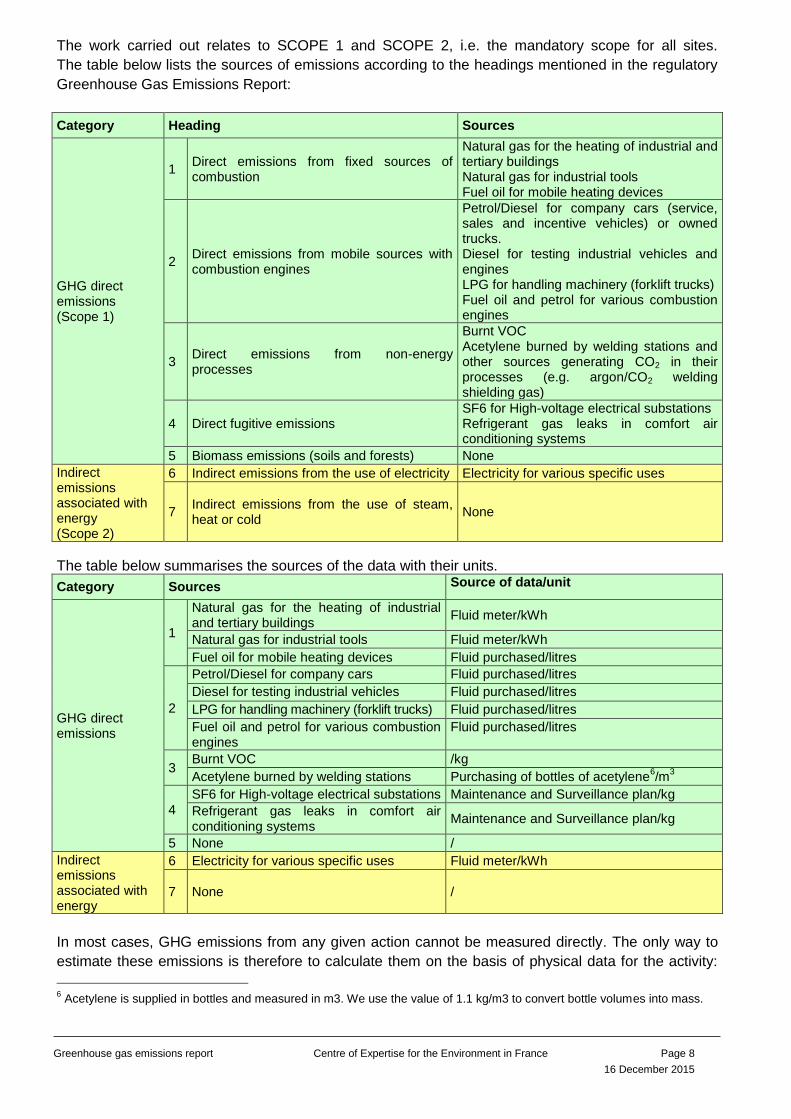
The work carried out relates to SCOPE 1 and SCOPE 2, i.e. the mandatory scope for all sites.
The table below lists the sources of emissions according to the headings mentioned in the regulatory
Greenhouse Gas Emissions Report:
Category Heading Sources
GHG direct emissions (Scope 1)
1 Direct emissions from fixed sources of combustion
Natural gas for the heating of industrial and tertiary buildings Natural gas for industrial tools Fuel oil for mobile heating devices
2 Direct emissions from mobile sources with combustion engines
Petrol/Diesel for company cars (service, sales and incentive vehicles) or owned trucks. Diesel for testing industrial vehicles and engines LPG for handling machinery (forklift trucks) Fuel oil and petrol for various combustion engines
3 Direct emissions from non-energy processes
Burnt VOC Acetylene burned by welding stations and other sources generating CO2 in their processes (e.g. argon/CO2 welding shielding gas)
4 Direct fugitive emissions SF6 for High-voltage electrical substations Refrigerant gas leaks in comfort air conditioning systems
5 Biomass emissions (soils and forests) None
Indirect emissions associated with energy (Scope 2)
6 Indirect emissions from the use of electricity Electricity for various specific uses
7 Indirect emissions from the use of steam, heat or cold
None
The table below summarises the sources of the data with their units.
Category Sources Source of data/unit
GHG direct emissions
1
Natural gas for the heating of industrial and tertiary buildings
Fluid meter/kWh
Natural gas for industrial tools Fluid meter/kWh
Fuel oil for mobile heating devices Fluid purchased/litres
2
Petrol/Diesel for company cars Fluid purchased/litres
Diesel for testing industrial vehicles Fluid purchased/litres
LPG for handling machinery (forklift trucks) Fluid purchased/litres
Fuel oil and petrol for various combustion engines
Fluid purchased/litres
3 Burnt VOC /kg
Acetylene burned by welding stations Purchasing of bottles of acetylene6/m
3
4
SF6 for High-voltage electrical substations Maintenance and Surveillance plan/kg
Refrigerant gas leaks in comfort air conditioning systems
Maintenance and Surveillance plan/kg
5 None /
Indirect emissions associated with energy
6 Electricity for various specific uses Fluid meter/kWh
7 None /
In most cases, GHG emissions from any given action cannot be measured directly. The only way to
estimate these emissions is therefore to calculate them on the basis of physical data for the activity:
6 Acetylene is supplied in bottles and measured in m3. We use the value of 1.1 kg/m3 to convert bottle volumes into mass.
Greenhouse gas emissions report Centre of Expertise for the Environment in France Page 9
16 December 2015
energy consumption in kWh, road traffic data with number of vehicles and distances driven, number of
tons of materials purchased, etc.
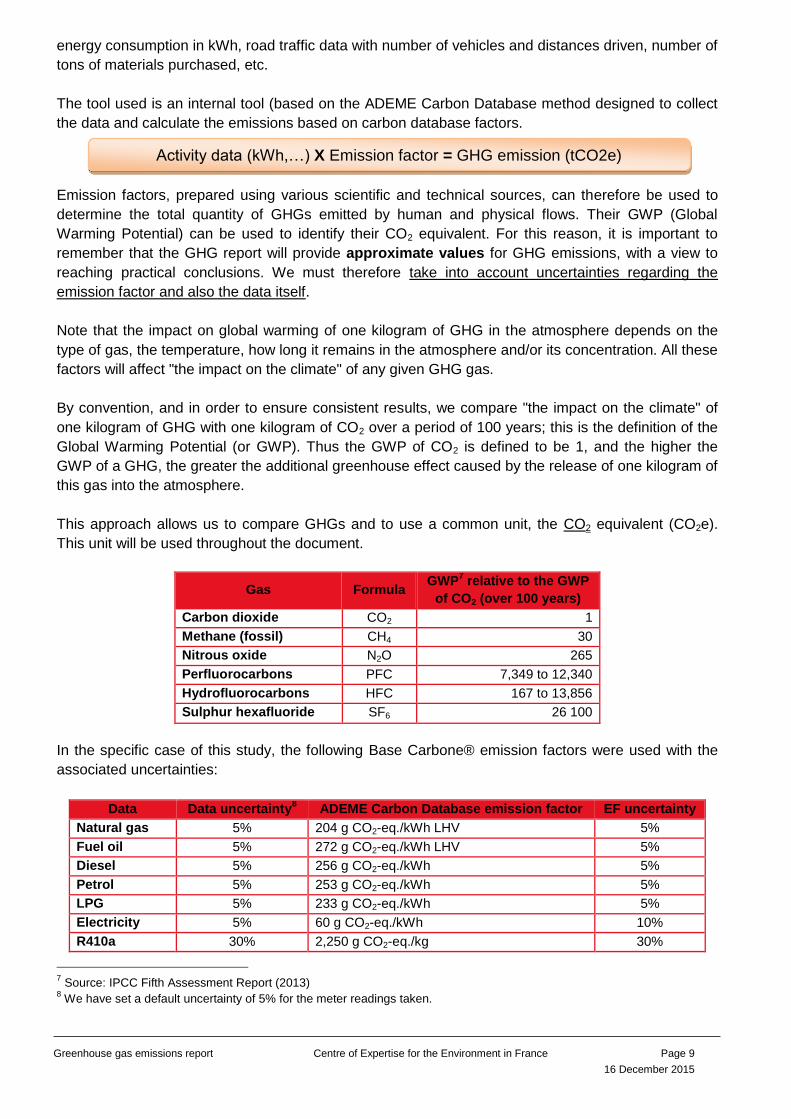
The tool used is an internal tool (based on the ADEME Carbon Database method designed to collect
the data and calculate the emissions based on carbon database factors.
Emission factors, prepared using various scientific and technical sources, can therefore be used to
determine the total quantity of GHGs emitted by human and physical flows. Their GWP (Global
Warming Potential) can be used to identify their CO2 equivalent. For this reason, it is important to
remember that the GHG report will provide approximate values for GHG emissions, with a view to
reaching practical conclusions. We must therefore take into account uncertainties regarding the
emission factor and also the data itself.
Note that the impact on global warming of one kilogram of GHG in the atmosphere depends on the
type of gas, the temperature, how long it remains in the atmosphere and/or its concentration. All these
factors will affect "the impact on the climate" of any given GHG gas.
By convention, and in order to ensure consistent results, we compare "the impact on the climate" of
one kilogram of GHG with one kilogram of CO2 over a period of 100 years; this is the definition of the
Global Warming Potential (or GWP). Thus the GWP of CO2 is defined to be 1, and the higher the
GWP of a GHG, the greater the additional greenhouse effect caused by the release of one kilogram of
this gas into the atmosphere.
This approach allows us to compare GHGs and to use a common unit, the CO2 equivalent (CO2e).
This unit will be used throughout the document.
Gas Formula GWP
7 relative to the GWP
of CO2 (over 100 years)
Carbon dioxide CO2 1
Methane (fossil) CH4 30
Nitrous oxide N2O 265
Perfluorocarbons PFC 7,349 to 12,340
Hydrofluorocarbons HFC 167 to 13,856
Sulphur hexafluoride SF6 26 100
In the specific case of this study, the following Base Carbone® emission factors were used with the
associated uncertainties:
Data Data uncertainty8 ADEME Carbon Database emission factor EF uncertainty
Natural gas 5% 204 g CO2-eq./kWh LHV 5%
Fuel oil 5% 272 g CO2-eq./kWh LHV 5%
Diesel 5% 256 g CO2-eq./kWh 5%
Petrol 5% 253 g CO2-eq./kWh 5%
LPG 5% 233 g CO2-eq./kWh 5%
Electricity 5% 60 g CO2-eq./kWh 10%
R410a 30% 2,250 g CO2-eq./kg 30%
7 Source: IPCC Fifth Assessment Report (2013)
8 We have set a default uncertainty of 5% for the meter readings taken.
Activity data (kWh,…) X Emission factor = GHG emission (tCO2e)
Greenhouse gas emissions report Centre of Expertise for the Environment in France Page 10
16 December 2015
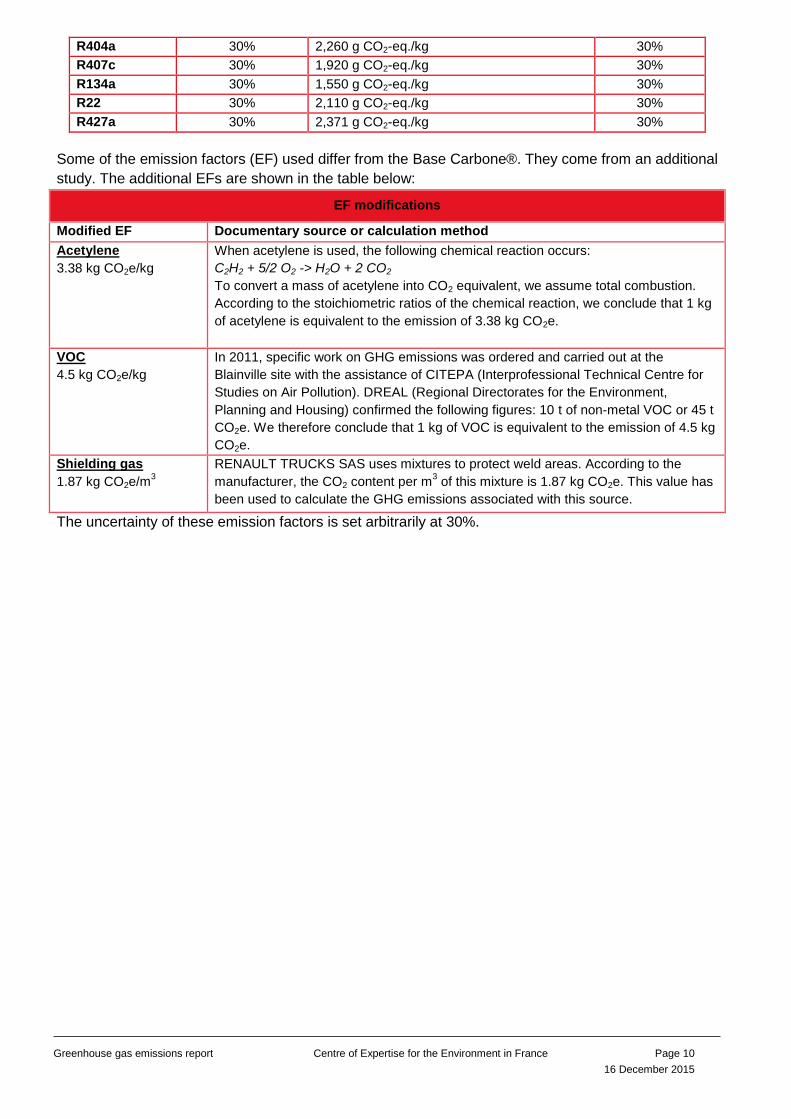
R404a 30% 2,260 g CO2-eq./kg 30%
R407c 30% 1,920 g CO2-eq./kg 30%
R134a 30% 1,550 g CO2-eq./kg 30%
R22 30% 2,110 g CO2-eq./kg 30%
R427a 30% 2,371 g CO2-eq./kg 30%
Some of the emission factors (EF) used differ from the Base Carbone®. They come from an additional
study. The additional EFs are shown in the table below:
EF modifications
Modified EF Documentary source or calculation method
Acetylene
3.38 kg CO2e/kg
When acetylene is used, the following chemical reaction occurs:
C2H2 + 5/2 O2 -> H2O + 2 CO2
To convert a mass of acetylene into CO2 equivalent, we assume total combustion.
According to the stoichiometric ratios of the chemical reaction, we conclude that 1 kg
of acetylene is equivalent to the emission of 3.38 kg CO2e.
VOC
4.5 kg CO2e/kg
In 2011, specific work on GHG emissions was ordered and carried out at the
Blainville site with the assistance of CITEPA (Interprofessional Technical Centre for
Studies on Air Pollution). DREAL (Regional Directorates for the Environment,
Planning and Housing) confirmed the following figures: 10 t of non-metal VOC or 45 t
CO2e. We therefore conclude that 1 kg of VOC is equivalent to the emission of 4.5 kg
CO2e.
Shielding gas
1.87 kg CO2e/m3
RENAULT TRUCKS SAS uses mixtures to protect weld areas. According to the
manufacturer, the CO2 content per m3 of this mixture is 1.87 kg CO2e. This value has
been used to calculate the GHG emissions associated with this source.
The uncertainty of these emission factors is set arbitrarily at 30%.
Greenhouse gas emissions report Centre of Expertise for the Environment in France Page 11
16 December 2015
6 Consolidated results of the GHG report for Renault Trucks SAS
We recall that in 2011 the emissions produced by Renault Trucks SAS (Blainville, Bourg-en-Bresse,
Limoges and Lyon) accounted for 56,690 tonnes of CO2 equivalent (or 56,690 tCO2e). For this new
GHG emissions updating exercise, we have had to recalculate the reference year (2011) to take into
account significant changes in the data.
6.1. Recalculation for Renault Trucks SAS reference year 2011 After checking the data for 2011, it became apparent that some modifications were required. These
modifications related firstly to errors (problems with conversions, units, data omission or optimisation
of our internal data collection system) and secondly to the updating of the emission factors
(modification of carbon database, modification of methodology relating to change in scope of the
electricity emission factor, etc.).
Error detection:
In total, a further 1,248 tCO2e were detected (table 1).
Table 1: Change in emissions for 2011 after error detection
Emissions 2011 (tCO2e) Emissions 2011 after error detection (tCO2e)
56,690 57,938
+ 1,248 tCO2e
Change in emission factors
The updating of the emission factors (table 2) accounts for a reduction in emissions compared to 2011
of 1,602 t CO2e.
Table 2: change in emission factors for Renault Trucks SAS between 2011 and 2014
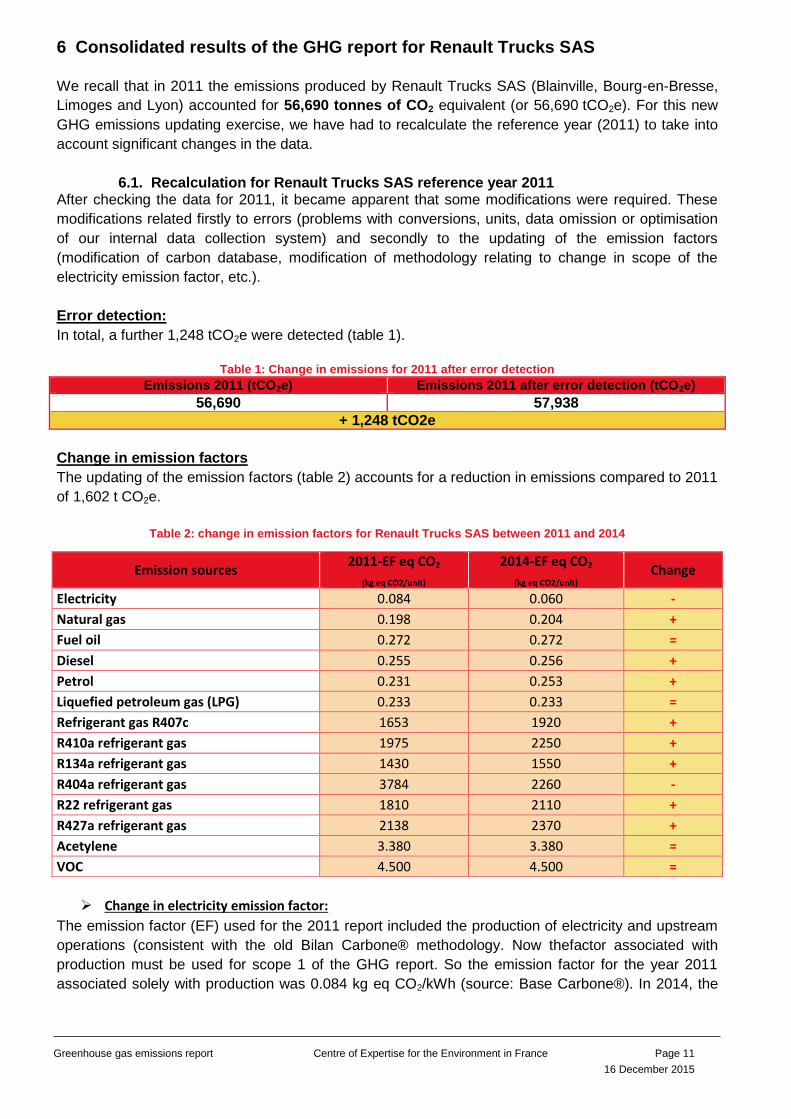
Change in electricity emission factor:
The emission factor (EF) used for the 2011 report included the production of electricity and upstream
operations (consistent with the old Bilan Carbone® methodology. Now thefactor associated with
production must be used for scope 1 of the GHG report. So the emission factor for the year 2011
associated solely with production was 0.084 kg eq CO2/kWh (source: Base Carbone®). In 2014, the
Emission sources 2011-EF eq CO2
(kg eq CO2/unit) 2014-EF eq CO2
(kg eq CO2/unit) Change
Electricity 0.084 0.060 -
Natural gas 0.198 0.204 +
Fuel oil 0.272 0.272 =
Diesel 0.255 0.256 +
Petrol 0.231 0.253 +
Liquefied petroleum gas (LPG) 0.233 0.233 =
Refrigerant gas R407c 1653 1920 +
R410a refrigerant gas 1975 2250 +
R134a refrigerant gas 1430 1550 +
R404a refrigerant gas 3784 2260 -
R22 refrigerant gas 1810 2110 +
R427a refrigerant gas 2138 2370 +
Acetylene 3.380 3.380 =
VOC 4.500 4.500 =
Greenhouse gas emissions report Centre of Expertise for the Environment in France Page 12
16 December 2015
electricity EF is 0.060 kg eq CO2/kWh accounting for a reduction of - 2,877 t CO2e compared to the
2011 report.
Figure1: effect of change in electricity emission factor (tCO2e)
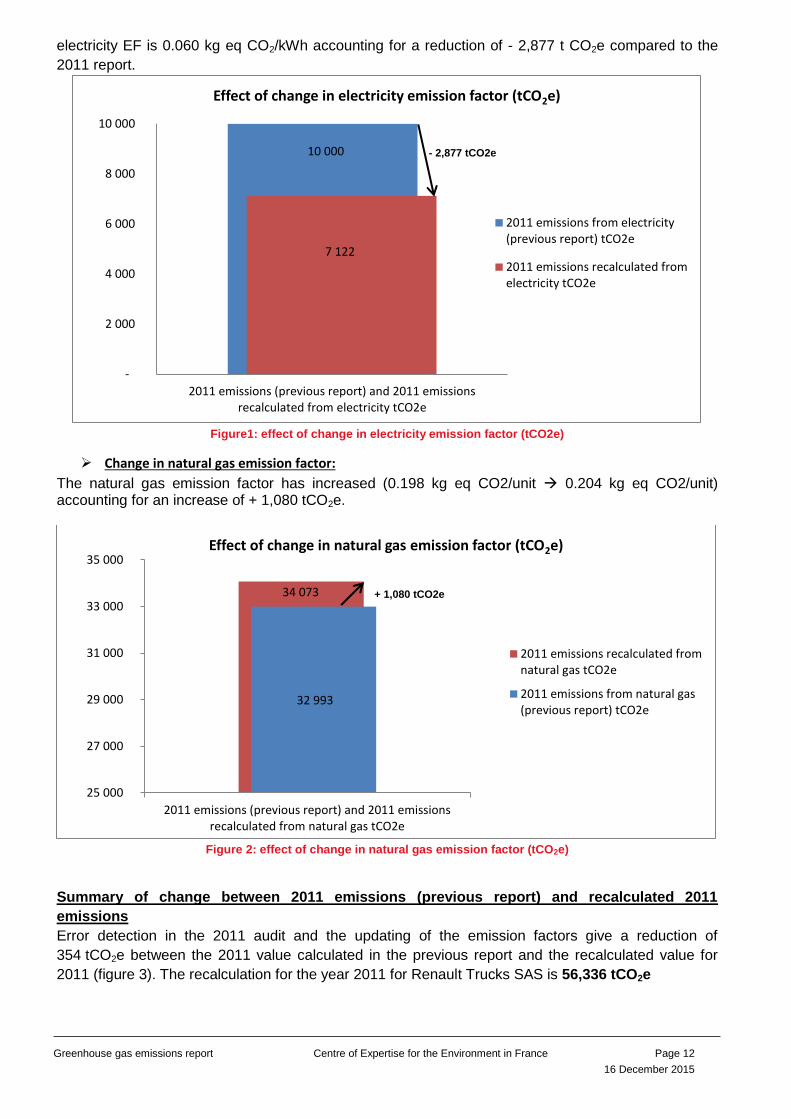
Change in natural gas emission factor:
The natural gas emission factor has increased (0.198 kg eq CO2/unit 0.204 kg eq CO2/unit) accounting for an increase of + 1,080 tCO2e.
Figure 2: effect of change in natural gas emission factor (tCO2e)
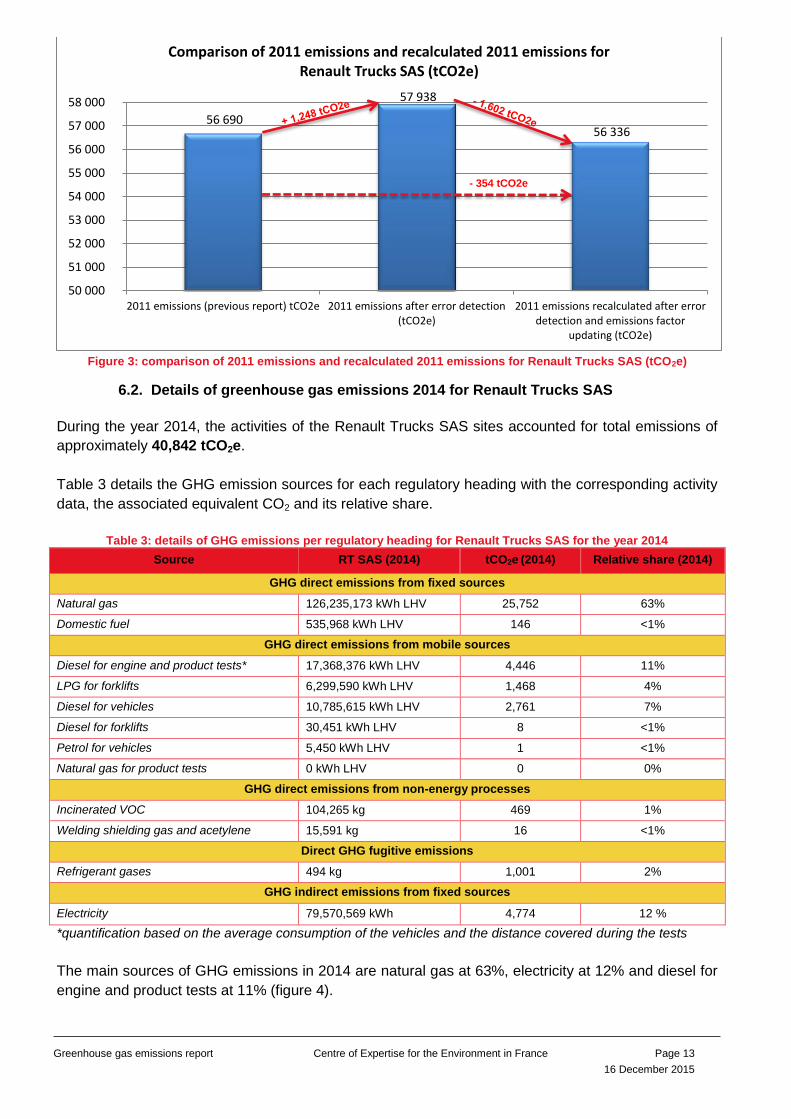
Summary of change between 2011 emissions (previous report) and recalculated 2011
emissions
Error detection in the 2011 audit and the updating of the emission factors give a reduction of
354 tCO2e between the 2011 value calculated in the previous report and the recalculated value for
2011 (figure 3). The recalculation for the year 2011 for Renault Trucks SAS is 56,336 tCO2e
10 000
7 122
-
2 000
4 000
6 000
8 000
10 000
2011 emissions (previous report) and 2011 emissionsrecalculated from electricity tCO2e
Effect of change in electricity emission factor (tCO2e)
2011 emissions from electricity(previous report) tCO2e
2011 emissions recalculated fromelectricity tCO2e
34 073
32 993
25 000
27 000
29 000
31 000
33 000
35 000
2011 emissions (previous report) and 2011 emissionsrecalculated from natural gas tCO2e
Effect of change in natural gas emission factor (tCO2e)
2011 emissions recalculated fromnatural gas tCO2e
2011 emissions from natural gas(previous report) tCO2e
+ 1,080 tCO2e
- 2,877 tCO2e
Greenhouse gas emissions report Centre of Expertise for the Environment in France Page 13
16 December 2015
Figure 3: comparison of 2011 emissions and recalculated 2011 emissions for Renault Trucks SAS (tCO2e)
6.2. Details of greenhouse gas emissions 2014 for Renault Trucks SAS
During the year 2014, the activities of the Renault Trucks SAS sites accounted for total emissions of
approximately 40,842 tCO2e.
Table 3 details the GHG emission sources for each regulatory heading with the corresponding activity
data, the associated equivalent CO2 and its relative share.
Table 3: details of GHG emissions per regulatory heading for Renault Trucks SAS for the year 2014
Source RT SAS (2014) tCO2e (2014) Relative share (2014)
GHG direct emissions from fixed sources
Natural gas 126,235,173 kWh LHV 25,752 63%
Domestic fuel 535,968 kWh LHV 146 <1%
GHG direct emissions from mobile sources
Diesel for engine and product tests* 17,368,376 kWh LHV 4,446 11%
LPG for forklifts 6,299,590 kWh LHV 1,468 4%
Diesel for vehicles 10,785,615 kWh LHV 2,761 7%
Diesel for forklifts 30,451 kWh LHV 8 <1%
Petrol for vehicles 5,450 kWh LHV 1 <1%
Natural gas for product tests 0 kWh LHV 0 0%
GHG direct emissions from non-energy processes
Incinerated VOC 104,265 kg 469 1%
Welding shielding gas and acetylene 15,591 kg 16 <1%
Direct GHG fugitive emissions
Refrigerant gases 494 kg 1,001 2%
GHG indirect emissions from fixed sources
Electricity 79,570,569 kWh 4,774 12 %
*quantification based on the average consumption of the vehicles and the distance covered during the tests
The main sources of GHG emissions in 2014 are natural gas at 63%, electricity at 12% and diesel for
engine and product tests at 11% (figure 4).
56 690
57 938
56 336
50 000
51 000
52 000
53 000
54 000
55 000
56 000
57 000
58 000
2011 emissions (previous report) tCO2e 2011 emissions after error detection(tCO2e)
2011 emissions recalculated after errordetection and emissions factor
updating (tCO2e)
Comparison of 2011 emissions and recalculated 2011 emissions for Renault Trucks SAS (tCO2e)
- 354 tCO2e
Greenhouse gas emissions report Centre of Expertise for the Environment in France Page 14
16 December 2015
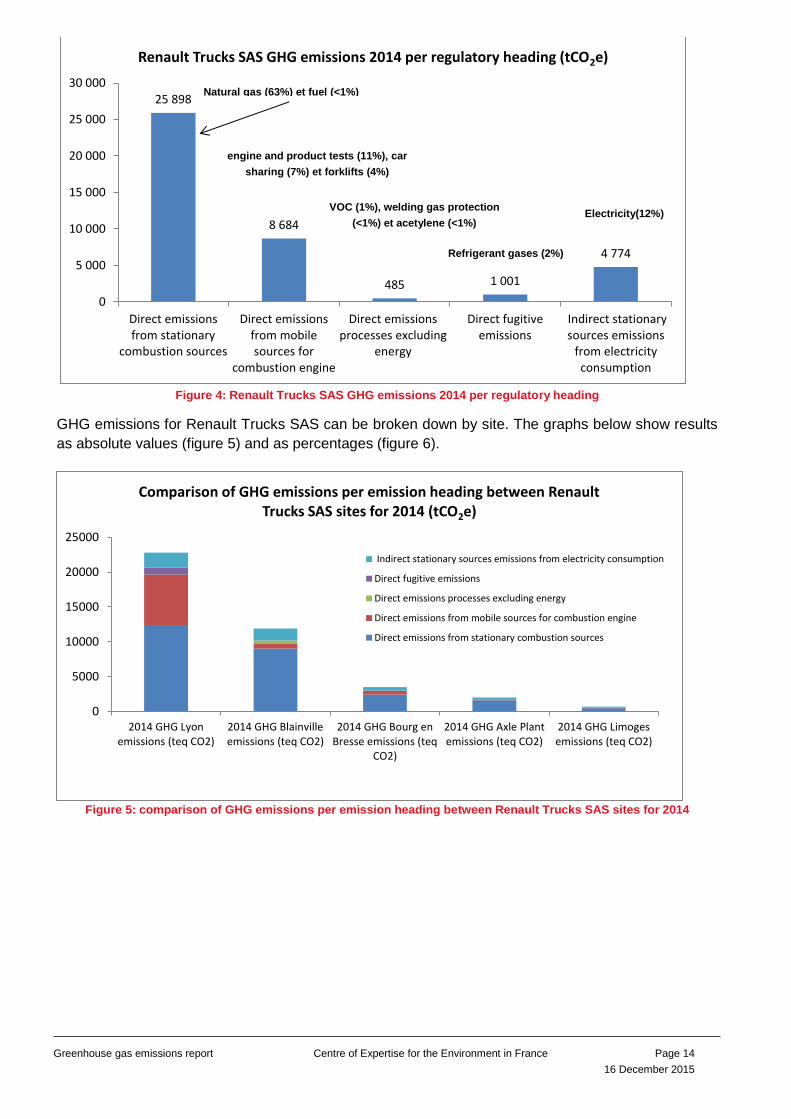
Figure 4: Renault Trucks SAS GHG emissions 2014 per regulatory heading
GHG emissions for Renault Trucks SAS can be broken down by site. The graphs below show results
as absolute values (figure 5) and as percentages (figure 6).
Figure 5: comparison of GHG emissions per emission heading between Renault Trucks SAS sites for 2014
25 898
8 684
485 1 001
4 774
0
5 000
10 000
15 000
20 000
25 000
30 000
Direct emissionsfrom stationary
combustion sources
Direct emissionsfrom mobilesources for
combustion engine
Direct emissionsprocesses excluding
energy
Direct fugitiveemissions
Indirect stationarysources emissions
from electricityconsumption
Renault Trucks SAS GHG emissions 2014 per regulatory heading (tCO2e)
0
5000
10000
15000
20000
25000
2014 GHG Lyonemissions (teq CO2)
2014 GHG Blainvilleemissions (teq CO2)
2014 GHG Bourg enBresse emissions (teq
CO2)
2014 GHG Axle Plantemissions (teq CO2)
2014 GHG Limogesemissions (teq CO2)
Comparison of GHG emissions per emission heading between Renault Trucks SAS sites for 2014 (tCO2e)
Indirect stationary sources emissions from electricity consumption
Direct fugitive emissions
Direct emissions processes excluding energy
Direct emissions from mobile sources for combustion engine
Direct emissions from stationary combustion sources
Natural gas (63%) et fuel (<1%)
Electricity(12%)
Refrigerant gases (2%)
VOC (1%), welding gas protection
(<1%) et acetylene (<1%)
engine and product tests (11%), car
sharing (7%) et forklifts (4%)
Greenhouse gas emissions report Centre of Expertise for the Environment in France Page 15
16 December 2015
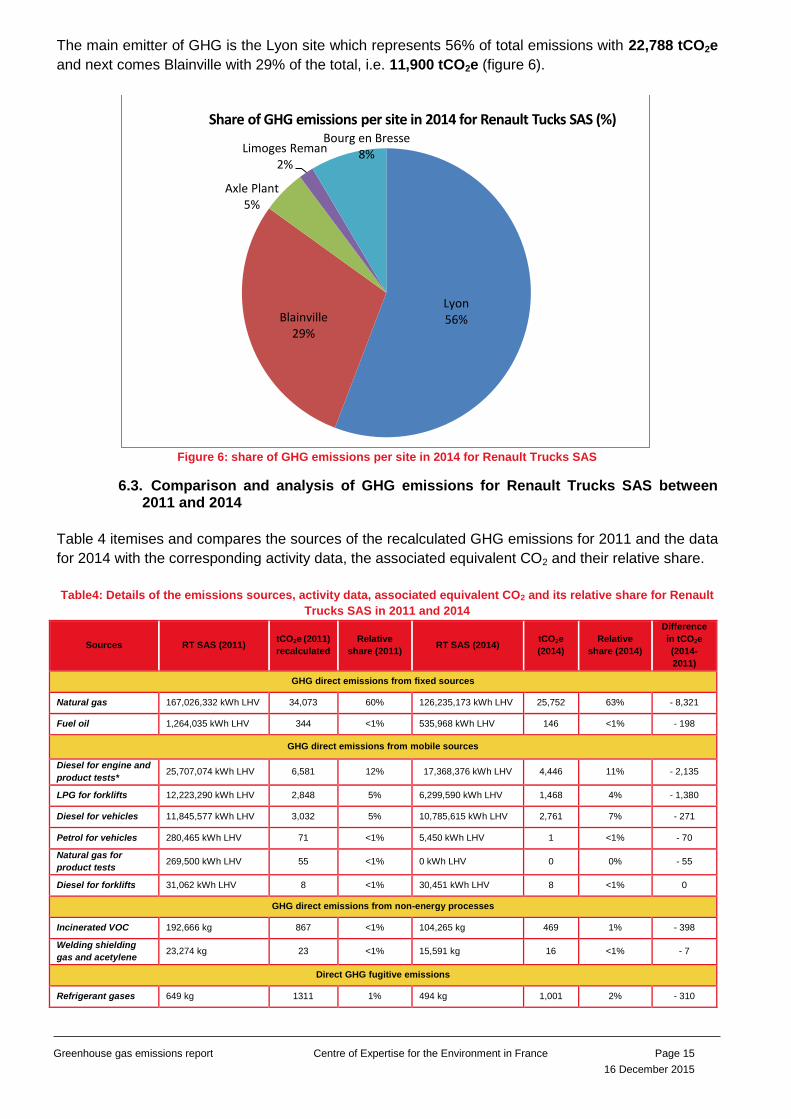
The main emitter of GHG is the Lyon site which represents 56% of total emissions with 22,788 tCO2e
and next comes Blainville with 29% of the total, i.e. 11,900 tCO2e (figure 6).
Figure 6: share of GHG emissions per site in 2014 for Renault Trucks SAS
6.3. Comparison and analysis of GHG emissions for Renault Trucks SAS between 2011 and 2014
Table 4 itemises and compares the sources of the recalculated GHG emissions for 2011 and the data
for 2014 with the corresponding activity data, the associated equivalent CO2 and their relative share.
Table4: Details of the emissions sources, activity data, associated equivalent CO2 and its relative share for Renault
Trucks SAS in 2011 and 2014
Sources RT SAS (2011) tCO2e (2011)
recalculated
Relative
share (2011) RT SAS (2014)
tCO2e
(2014)
Relative
share (2014)
Difference
in tCO2e
(2014-
2011)
GHG direct emissions from fixed sources
Natural gas 167,026,332 kWh LHV 34,073 60% 126,235,173 kWh LHV 25,752 63% - 8,321
Fuel oil 1,264,035 kWh LHV 344 <1% 535,968 kWh LHV 146 <1% - 198
GHG direct emissions from mobile sources
Diesel for engine and
product tests* 25,707,074 kWh LHV 6,581 12% 17,368,376 kWh LHV 4,446 11% - 2,135
LPG for forklifts 12,223,290 kWh LHV 2,848 5% 6,299,590 kWh LHV 1,468 4% - 1,380
Diesel for vehicles 11,845,577 kWh LHV 3,032 5% 10,785,615 kWh LHV 2,761 7% - 271
Petrol for vehicles 280,465 kWh LHV 71 <1% 5,450 kWh LHV 1 <1% - 70
Natural gas for
product tests 269,500 kWh LHV 55 <1% 0 kWh LHV 0 0% - 55
Diesel for forklifts 31,062 kWh LHV 8 <1% 30,451 kWh LHV 8 <1% 0
GHG direct emissions from non-energy processes
Incinerated VOC 192,666 kg 867 <1% 104,265 kg 469 1% - 398
Welding shielding
gas and acetylene 23,274 kg 23 <1% 15,591 kg 16 <1% - 7
Direct GHG fugitive emissions
Refrigerant gases 649 kg 1311 1% 494 kg 1,001 2% - 310
Lyon 56% Blainville
29%
Axle Plant 5%
Limoges Reman 2%
Bourg en Bresse 8%
Share of GHG emissions per site in 2014 for Renault Tucks SAS (%)
Greenhouse gas emissions report Centre of Expertise for the Environment in France Page 16
16 December 2015
GHG indirect emissions from fixed sources
Electricity 118,707,957 kWh 7,122 13% 79,570,569 kWh 4774 12 % - 2,348
*quantification based on the average consumption of the vehicles and the distance covered during the tests
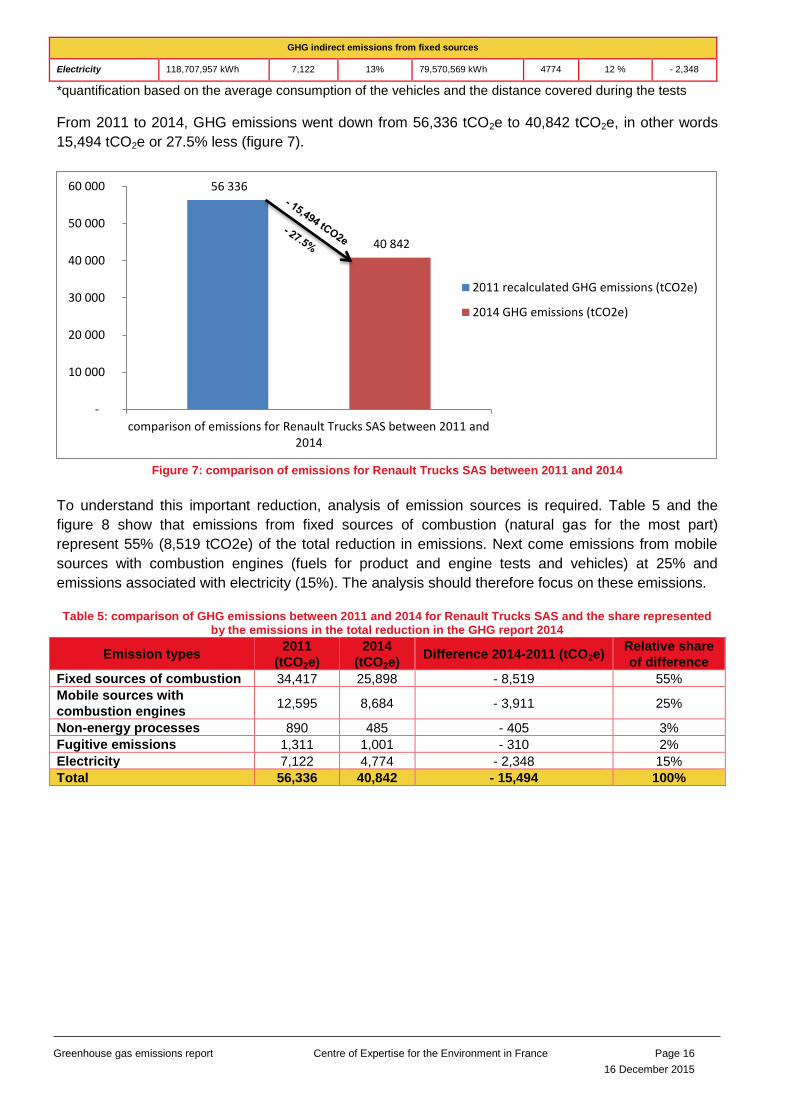
From 2011 to 2014, GHG emissions went down from 56,336 tCO2e to 40,842 tCO2e, in other words
15,494 tCO2e or 27.5% less (figure 7).
Figure 7: comparison of emissions for Renault Trucks SAS between 2011 and 2014
To understand this important reduction, analysis of emission sources is required. Table 5 and the
figure 8 show that emissions from fixed sources of combustion (natural gas for the most part)
represent 55% (8,519 tCO2e) of the total reduction in emissions. Next come emissions from mobile
sources with combustion engines (fuels for product and engine tests and vehicles) at 25% and
emissions associated with electricity (15%). The analysis should therefore focus on these emissions.
Table 5: comparison of GHG emissions between 2011 and 2014 for Renault Trucks SAS and the share represented
by the emissions in the total reduction in the GHG report 2014
Emission types 2011
(tCO2e)
2014
(tCO2e) Difference 2014-2011 (tCO2e)
Relative share
of difference
Fixed sources of combustion 34,417 25,898 - 8,519 55%
Mobile sources with
combustion engines 12,595 8,684 - 3,911 25%
Non-energy processes 890 485 - 405 3%
Fugitive emissions 1,311 1,001 - 310 2%
Electricity 7,122 4,774 - 2,348 15%
Total 56,336 40,842 - 15,494 100%
56 336
40 842
-
10 000
20 000
30 000
40 000
50 000
60 000
comparison of emissions for Renault Trucks SAS between 2011 and2014
2011 recalculated GHG emissions (tCO2e)
2014 GHG emissions (tCO2e)
Greenhouse gas emissions report Centre of Expertise for the Environment in France Page 17
16 December 2015
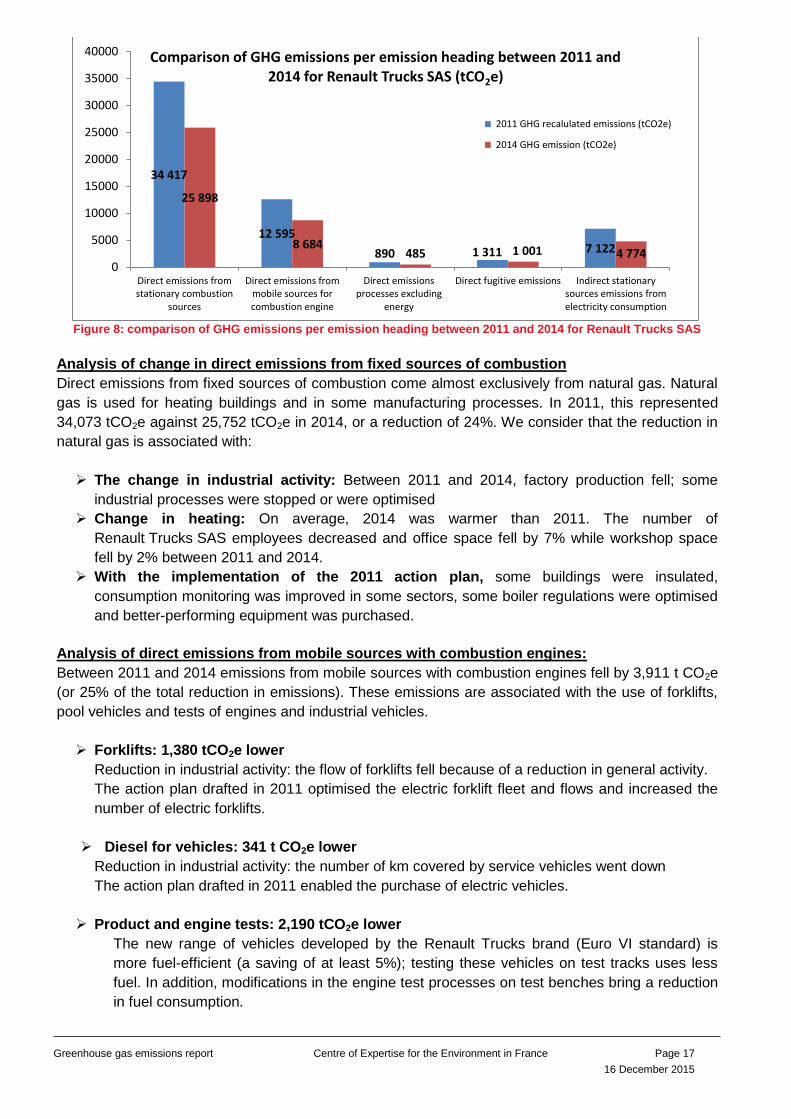
Figure 8: comparison of GHG emissions per emission heading between 2011 and 2014 for Renault Trucks SAS
Analysis of change in direct emissions from fixed sources of combustion
Direct emissions from fixed sources of combustion come almost exclusively from natural gas. Natural
gas is used for heating buildings and in some manufacturing processes. In 2011, this represented
34,073 tCO2e against 25,752 tCO2e in 2014, or a reduction of 24%. We consider that the reduction in
natural gas is associated with:
The change in industrial activity: Between 2011 and 2014, factory production fell; some
industrial processes were stopped or were optimised
Change in heating: On average, 2014 was warmer than 2011. The number of
Renault Trucks SAS employees decreased and office space fell by 7% while workshop space
fell by 2% between 2011 and 2014.
With the implementation of the 2011 action plan, some buildings were insulated,
consumption monitoring was improved in some sectors, some boiler regulations were optimised
and better-performing equipment was purchased.
Analysis of direct emissions from mobile sources with combustion engines:
Between 2011 and 2014 emissions from mobile sources with combustion engines fell by 3,911 t CO2e
(or 25% of the total reduction in emissions). These emissions are associated with the use of forklifts,
pool vehicles and tests of engines and industrial vehicles.
Forklifts: 1,380 tCO2e lower
Reduction in industrial activity: the flow of forklifts fell because of a reduction in general activity.
The action plan drafted in 2011 optimised the electric forklift fleet and flows and increased the
number of electric forklifts.
Diesel for vehicles: 341 t CO2e lower
Reduction in industrial activity: the number of km covered by service vehicles went down
The action plan drafted in 2011 enabled the purchase of electric vehicles.
Product and engine tests: 2,190 tCO2e lower
The new range of vehicles developed by the Renault Trucks brand (Euro VI standard) is
more fuel-efficient (a saving of at least 5%); testing these vehicles on test tracks uses less
fuel. In addition, modifications in the engine test processes on test benches bring a reduction
in fuel consumption.
34 417
12 595
890 1 311 7 122
25 898
8 684 485 1 001 4 774
0
5000
10000
15000
20000
25000
30000
35000
40000
Direct emissions fromstationary combustion
sources
Direct emissions frommobile sources forcombustion engine
Direct emissionsprocesses excluding
energy
Direct fugitive emissions Indirect stationarysources emissions fromelectricity consumption
Comparison of GHG emissions per emission heading between 2011 and 2014 for Renault Trucks SAS (tCO2e)
2011 GHG recalulated emissions (tCO2e)
2014 GHG emission (tCO2e)
Greenhouse gas emissions report Centre of Expertise for the Environment in France Page 18
16 December 2015
Analysis of indirect emissions from fixed sources associated with the consumption of
electricity:
In 2011, GHG emissions associated with electricity represented 7,122 tCO2e against 4,774 tCO2e in
2014, or a reduction of 33%. The consumption comes mainly from heating, lighting and manufacturing
processes. We consider that the reduction in electricity is associated with:
The change in industrial activity:
Between 2011 and 2014, factory production fell. Some activities ceased (machining, stamping
centre painting) and some industrial processes and equipment were optimised. Note that new
activities (new production line at the engine plant) increased GHG emissions.
Change in heating and lighting:
On average, 2014 was warmer than 2011, and between 2011 and 2014 the number of
Renault Trucks SAS employees decreased, leading to a fall in emissions. Office space fell by
7% and workshop space fell by 2% between 2011 and 2014.
With the implementation of the 2011 action plan, some buildings were insulated,
consumption monitoring was improved in some sectors, some boiler regulations were optimised
and better-performing equipment was purchased (pumps, lighting, geothermal heating, etc.).
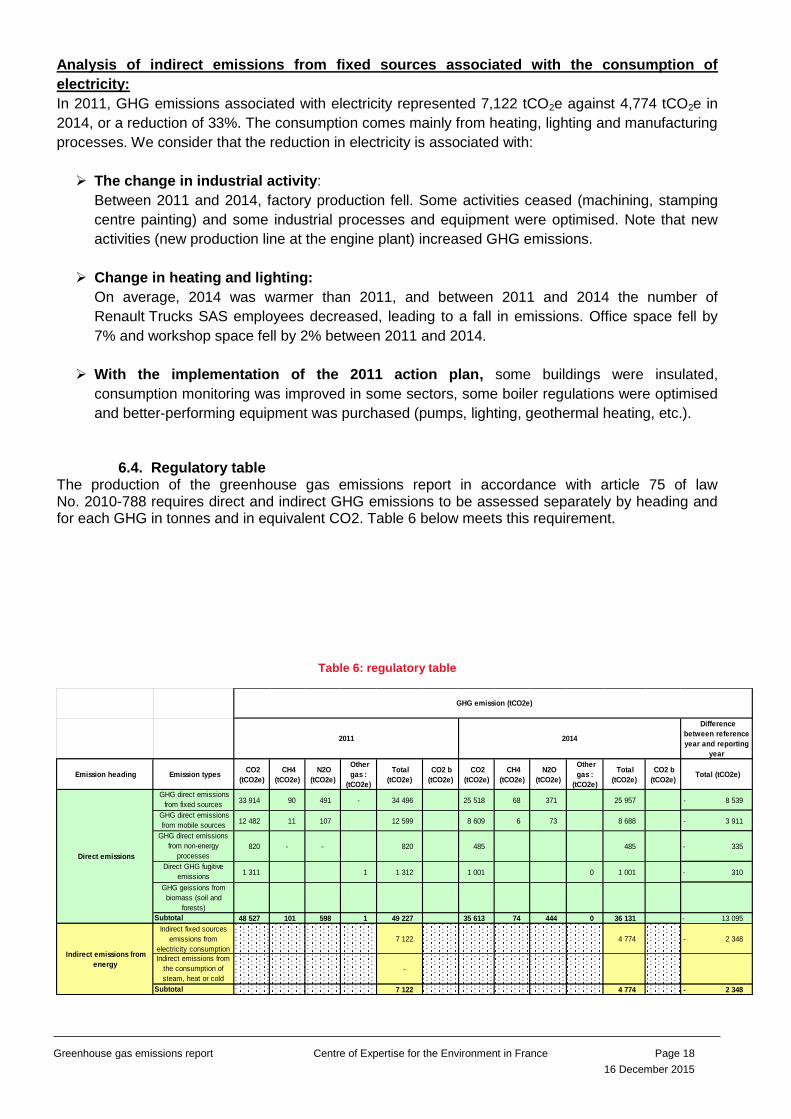
6.4. Regulatory table The production of the greenhouse gas emissions report in accordance with article 75 of law No. 2010-788 requires direct and indirect GHG emissions to be assessed separately by heading and for each GHG in tonnes and in equivalent CO2. Table 6 below meets this requirement.
Table 6: regulatory table
Difference
between reference
year and reporting
year
Emission heading Emission types CO2
(tCO2e)
CH4
(tCO2e)
N2O
(tCO2e)
Other
gas :
(tCO2e)
Total
(tCO2e)
CO2 b
(tCO2e)
CO2
(tCO2e)
CH4
(tCO2e)
N2O
(tCO2e)
Other
gas :
(tCO2e)
Total
(tCO2e)
CO2 b
(tCO2e) Total (tCO2e)
GHG direct emissions
from fixed sources 33 914 90 491 - 34 496 25 518 68 371 25 957 8 539 -
GHG direct emissions
from mobile sources 12 482 11 107 12 599 8 609 6 73 8 688 3 911 -
GHG direct emissions
from non-energy
processes
820 - - 820 485 485 335 -
Direct GHG fugitive
emissions1 311 1 1 312 1 001 0 1 001 310 -
GHG geissions from
biomass (soil and
forests)
Subtotal 48 527 101 598 1 49 227 35 613 74 444 0 36 131 13 095 -
Indirect fixed sources
emissions from
electricity consumption
7 122 4 774 2 348 -
Indirect emissions from
the consumption of
steam, heat or cold
-
Subtotal 7 122 4 774 2 348 -
Indirect emissions from
energy
GHG emission (tCO2e)
2011 2014
Direct emissions
Greenhouse gas emissions report Centre of Expertise for the Environment in France Page 19
16 December 2015
7 Action plan
This section meets the legal requirement of providing a summary of the actions of the submitting
parties with the report of the legal entity.
First of all a review of the actions from the previous GHG report was prepared in order to estimate the
CO2e gains costed in 2012.
In 2012, 108 actions were identified and approved by the management of each Renault Trucks SAS
entity.
Of the 108 actions identified, 76 actions have been implemented and 10 actions are in progress (over
50% adopted as of today). The action plans are an integral part of the environmental management
system of the entities and periodic reviews take place (all the sites of the legal entity are certified to
standard ISO 14001).
The actions taken focus mainly on the following areas:
- The complete renovation of some buildings
-Controlling and reducing heat loss for buildings (insulation of walls, roofing, pipes, installation of sun
shades, etc.)
- Purchase of better-performing heating equipment or processes (boilers, air conditioning, motors,
geothermal heating, etc.)
- Controlling and reducing energy requirements for heating/air conditioning/processes
- Reducing and optimising lighting requirements (better-performing lighting, walls painted to give light)
- Reducing CO2 emissions for on-site and inter-site travel (development of video-conferencing,
purchase of electric vehicles for maintenance and employees, company car policy)
- The design and use of sustainable buildings
- Reducing CO2 emissions for engine tests by means of a change in the process
- Awareness and involvement of employees in energy savings
It is difficult to assess the reduction in CO2e emissions associated with the action plan but, according
to the costing presented in 2012, the actions taken represented a reduction of 2,220 tCO2e at the
time.
Summary of action plan:
To prepare the new 3-year action plan, we have carried over some actions from the previous plan,
integrated actions from the statutory energy audits, and added some other actions not previously
identified. These actions focus on the areas previously mentioned, namely:
- Renovation of buildings or improvements to insulation (roofing, walls, pipes, etc.)
- Improvements to existing buildings or processes by better regulation and the purchase of better-
performing equipment.
- Improvements to lighting
- Reduction in emissions for business travel
- Personnel awareness campaigns
Actions were quantified when all the data required for calculations had been collected. Failing this, it
was decided to not quantify the actions.
Greenhouse gas emissions report Centre of Expertise for the Environment in France Page 20
16 December 2015
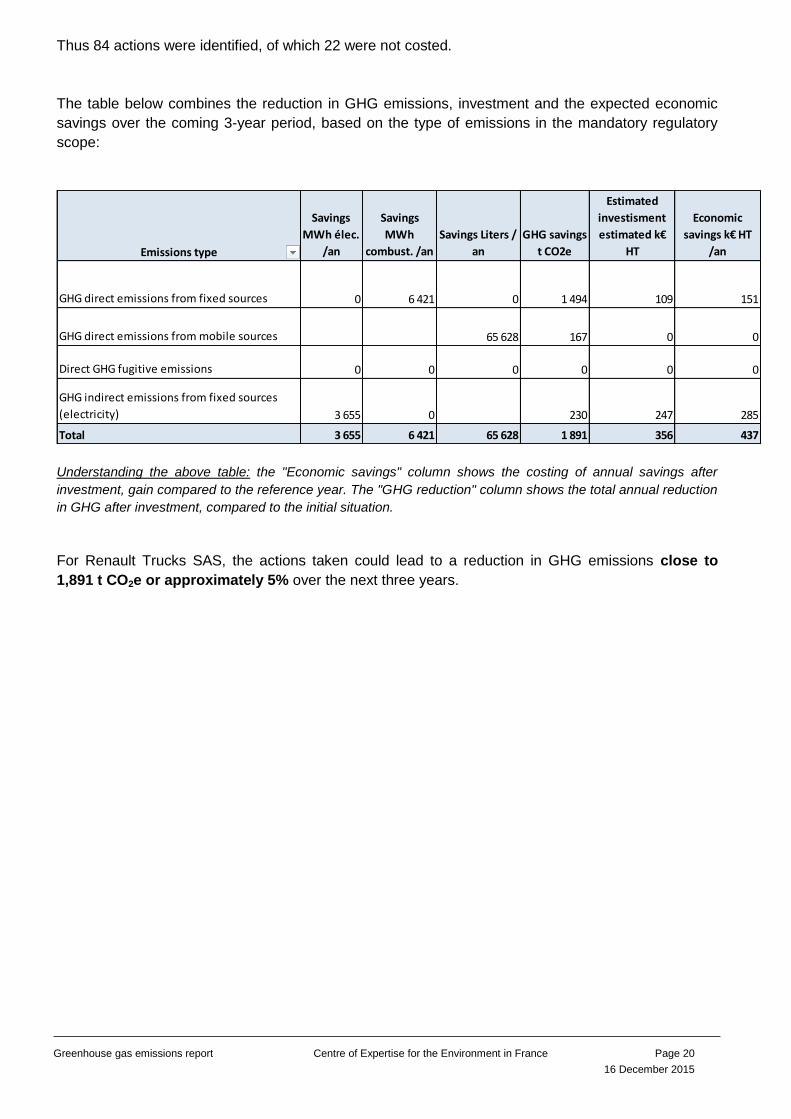
Thus 84 actions were identified, of which 22 were not costed.
The table below combines the reduction in GHG emissions, investment and the expected economic
savings over the coming 3-year period, based on the type of emissions in the mandatory regulatory
scope:
Understanding the above table: the "Economic savings" column shows the costing of annual savings after
investment, gain compared to the reference year. The "GHG reduction" column shows the total annual reduction
in GHG after investment, compared to the initial situation.
For Renault Trucks SAS, the actions taken could lead to a reduction in GHG emissions close to
1,891 t CO2e or approximately 5% over the next three years.
Emissions type
Savings
MWh élec.
/an
Savings
MWh
combust. /an
Savings Liters /
an
GHG savings
t CO2e
Estimated
investisment
estimated k€
HT
Economic
savings k€ HT
/an
GHG direct emissions from fixed sources 0 6 421 0 1 494 109 151
GHG direct emissions from mobile sources 65 628 167 0 0
Direct GHG fugitive emissions 0 0 0 0 0 0
GHG indirect emissions from fixed sources
(electricity) 3 655 0 230 247 285
Total 3 655 6 421 65 628 1 891 356 437
Greenhouse gas emissions report Centre of Expertise for the Environment in France Page 21
16 December 2015


![Greenhouse Gas Emissions and Emissions Trading in North … · 2020. 2. 23. · 2002] Stephenson-Greenhouse Gas Emissions, Kyoto and U.S. Response 45 greenhouse gas molecules. This](https://img.pdfslide.net/doc/110x75/60facf56e286b02f9b10de99/greenhouse-gas-emissions-and-emissions-trading-in-north-2020-2-23-2002-stephenson-greenhouse.jpg)