Embed Size (px)
Citation preview

GGreenhouse Gases Emissions and Mitigationreenhouse Gases Emissions and Mitigation
from Rice Productionfrom Rice Production
Kruamas SmakgahnKruamas Smakgahn*, Tamon Fumoto and Kazuyuki Yagi*, Tamon Fumoto and Kazuyuki Yagi
National Institute for Agro-Environmental SciencesNational Institute for Agro-Environmental SciencesTsukuba, Ibaraki, JapanTsukuba, Ibaraki, Japan
E-mail: [email protected]: [email protected]

ContentsContents
Background Background ObjectivesObjectives Introduction to modelsIntroduction to models ResultsResults
Models validationModels validationSensitivity testSensitivity test
ConclusionsConclusions

http://www.epa.gov/methane/sources.htmlhttp://www.epa.gov/methane/sources.html
Natural Sources of Atmospheric Methane

Methane is emitted to the Methane is emitted to the atmosphere from atmosphere from wetlands via three wetlands via three primary modes: primary modes:
(i) diffusion of dissolved (i) diffusion of dissolved methane across the water-methane across the water-interface, interface,
(ii) bubble ebullition, and (ii) bubble ebullition, and (iii) air circulation (iii) air circulation
between the atmosphere between the atmosphere and buried tissues of and buried tissues of aquatic plants, with the aquatic plants, with the stems and leaves serving stems and leaves serving as conduits. as conduits.
Source: http://www.riceweb.org/reserch/Res.issmethane.htm
Methane emissions from rice fields.Methane emissions from rice fields.

Nitrous oxide (NNitrous oxide (N22O) is a powerful greenhouse gas, about 310 times more O) is a powerful greenhouse gas, about 310 times more effective at trapping heat than carbon dioxide on a molecule-for-molecule effective at trapping heat than carbon dioxide on a molecule-for-molecule basis. basis.
Agricultural activities and animal production systems are the largest Agricultural activities and animal production systems are the largest anthropogenic sources of these emissions. anthropogenic sources of these emissions.
NN22O emissions from agricultural soils occur through the nitrification and O emissions from agricultural soils occur through the nitrification and denitrification of nitrogen in soils, particularly that from mineral or denitrification of nitrogen in soils, particularly that from mineral or organic fertilizers. organic fertilizers.
Emissions are very dependent on local management practices, fertilizer Emissions are very dependent on local management practices, fertilizer types, and climatic and soil conditions,types, and climatic and soil conditions,
Natural Sources of Atmospheric N2O

Expanding cultivation areas of rice have significantly contributed to the increase in the concentration of atmospheric CH4 and N2O concentration
It is difficult to measure emission in large scale and obtain mitigation options, thus model implementation is a promising options for
predictions.
Objectives
To simulate CHTo simulate CH44 and N and N22 O emissions from rice fields with varying cultivations O emissions from rice fields with varying cultivations
practice in different locations in order to consider an accuracy of estimationpractice in different locations in order to consider an accuracy of estimation
To obtain mitigation options of CHTo obtain mitigation options of CH44 and N and N22O emissions from rice fieldsO emissions from rice fields

The process base model:The process base model:De-Nitrification De-Nitrification
De-composition modelDe-composition model
Source: R.A.J. Plant 1998
Source: Fumoto et al. (Submitted GCB)
Schematic descriptions of soil Biogeochemistry sub-models

Location of study sitesLocation of study sites
locations of study site in Thailand
1. Rice cultivation under rice straw incorporation (7 sites)
Bangkok, Khon Kean, Phrae, Phitsanulok, Sanphatong (Chiang Mai), Suphanburi and Surin province
2. Rice cultivation without rice straw incorporation (2 sites)
Samutsakorn and Singburi

soil properties of study sites
Site Soil name Soil taxonomy
Soil texture
Carbon(%)
Total N (%)
Available N (µg N g-
1)
Free Fe2
O3 (g kg-1)
SO42-
(µ g S mL-1)
Soil pH (flooded)
Bangkhen Bangkhen (Bkn)Bangkhen (Bkn) Typic Typic Tropaquepts Tropaquepts
Heavy clayHeavy clay 0.1880.188 0.20.2 115 1.8 454 6.7
Khon Kaen Roi Et (Et) Aeric Paleaquults
Sandy loam 0.049 * 0.002 37 0.1 < 1 6.8
Phisanulok Alluvial complex Light clay 0.14 * 0.014 91 2.2 48 6.3
Phrae Lampang (Lp) Typic Paleaqualfs
Silt clay loam
0.089 * 0.009 32 1.2 28 6.9
Samutsakorn Bangkok (Bk) Typic Tropaquepts
Clay 1.31 0.06 No data No data No data 6.10
San Pa Thong
Hang Dong (Hd) Typic Tropaquepts
Light clay 0.103* 0.011 49 1.5 29 6.9
Singburi Sanphaya (Sp) Aquic Ustifluvents
Loam 0.78 0.06 No data No data No data 6.90
Suphaburi Phimai (Pm) Vertic Tropaquepts
Clay 1.30 * 0.010 84 1.6 2-23 5.4-6.1
Surin Roi Et (Re) Aeric Paleaquults
Sandy loam 0.049 0.003 35 0.8 < 1 6.6

Rice cultivation with rice straw incorporationRice cultivation with rice straw incorporation
0
20
40
60
80
100
Study sites
CH
4 (g
/m2 /s
easo
n)
Revised DNDC model
DNDC model
Observation
The revised DNDC model, which is modified The revised DNDC model, which is modified
by focusing on electron donors by focusing on electron donors
presented in soils, yielded appropriated results presented in soils, yielded appropriated results
compared with the original DNDC modelcompared with the original DNDC model
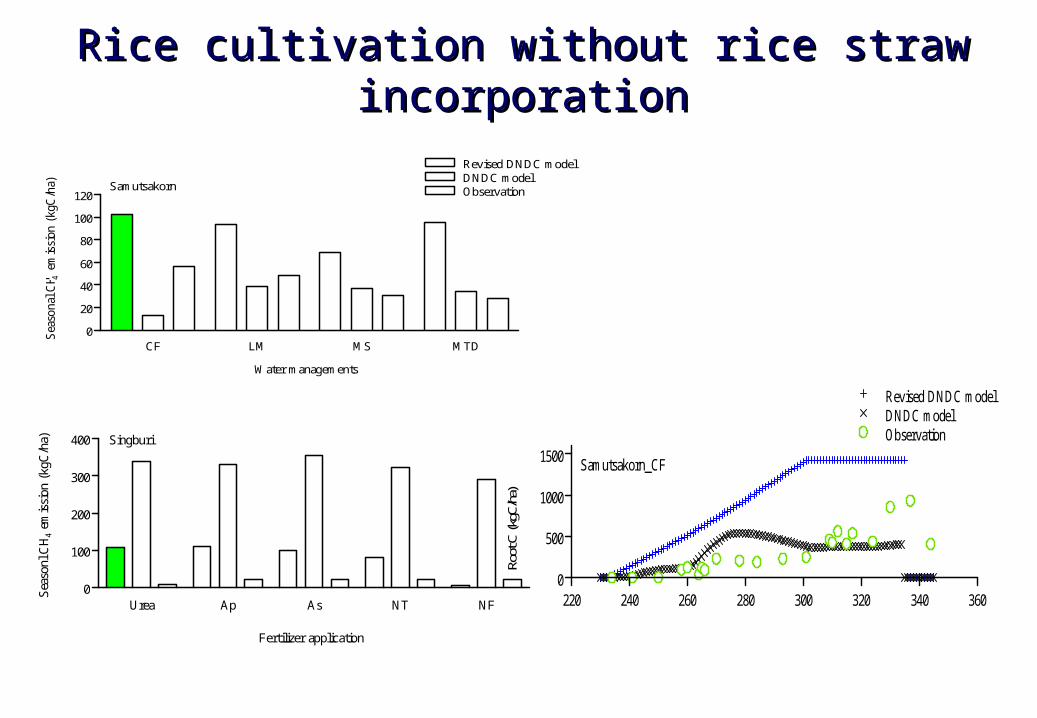
Rice cultivation without rice straw incorporationRice cultivation without rice straw incorporation
CF LM MS MTD0
20
40
60
80
100
120
Water managements
Sea
son
al C
H 4 e
mis
sio
n (
kgC
/ha) Samutsakorn
Revised DNDC modelDNDC modelObservation
Urea Ap As NT NF0
100
200
300
400
Fertilizer application
Sea
sonl
CH
4 em
issi
on (
kgC
/ha) Singburi
220 240 260 280 300 320 340 3600
500
1000
1500
Root
C (k
gC/h
a)
Samutsakorn_CF
Revised DNDC modelDNDC modelObservation

Effect of soil properties
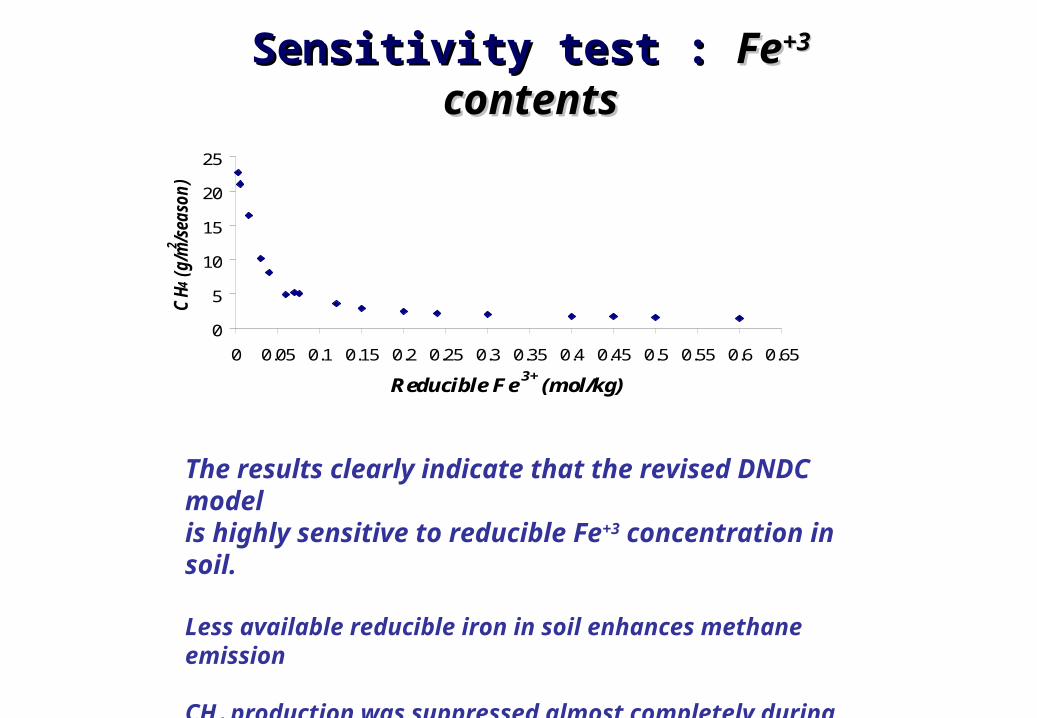
The results clearly indicate that the revised DNDC model is highly sensitive to reducible Fe+3 concentration in soil.
Less available reducible iron in soil enhances methane emission
CH4 production was suppressed almost completely during ferric iron reductions.
Sensitivity test : Sensitivity test : FeFe+3+3 contents contents
Samutsakorn
0
5
10
15
20
25
0 0.05 0.1 0.15 0.2 0.25 0.3 0.35 0.4 0.45 0.5 0.55 0.6 0.65
Reducible Fe 3+ (mol/kg)
CH
4 (g
/m2 /s
easo
n)

Soil Clay Contents
Samutsakorn
0
5
10
15
(Org.)0.06
0.03 0.06 0.09 0.14 0.19 0.27 0.34 0.40 0.43 0.49Soil clay content (%)
CH
4 (g
/m2 /se
ason
)
High clay content in soil or heavy clay texture is trended to mitigated CH4 emission
Low clay content in sandy soil, silt clay soil, silt clay loam are not suitable for CH4 production predicted by revised DNDC model

Effect of rice straw incorporation

Methane emission under with and without rice straw Methane emission under with and without rice straw incorporationincorporation
Rice cultivation without rice straw incorporation help methane mitigation by 60-90 %.
0
10
20
30
40
50
60
70
80
Bkn Kkn Phrae Pnl Spr Spt Surin
Study site
CH
4 (
g/m
2 /sea
son)
.Revised DNDC_without rice strawRevised DNDC_with rice strawObserved_with rice straw

Sanphatong
-300
-200
-100
0
100
200
300
400
500
600
700
0 100 200 300 400 500 600 700 800
Julian day (1993-1994)
Soil
Eh (m
V) .
Revised DNDC_With RSRevised DNDC_No RSObserved_With RS
Sanphatong
20000
25000
30000
35000
40000
0 100 200 300 400 500 600 700 800
Julian day (1993-1994)
SOC
(kgC
/ha)
.
With RSNo RS
-Rice straw incorporated into soil significantly enhanced CH4 emission.
- Correlation between rice straw incorporation and methane emission is linear form
Sensitivity tests: Sensitivity tests: Rice straw incorporationRice straw incorporation
Sanphatong
05
101520253035
Nostraw
500 1000 1500 2000 2500 3000
Rice straw (ton C/ha)
CH
4 (g
/m2 /s
easo
n)

Effect of rice cultivar
Rice root biomass directly influences estimation of methane emission
- Rice root is a major source of electron donor (DOC) for methane production
0 100 200 300 4000
2
4
6
8
10
12
14
16
Julian day
CH
4 (
kgC
/ha/
day)
Suphanburi 19912004006008001000120014001600
Rice root

Methane and biomassMethane and biomass
Sanphatong_3 VI
y = 8.0764x + 626.29
R2 = 0.9548
0
500
1000
1500
2000
2500
0 50 100 150 200Methane (kgC/ha)
Bio
mas
s (kg
C/h
a) .
Sanphatong_15 VI
y = 17.919x + 884.15
R2 = 0.9349
0
500
1000
1500
2000
2500
0 20 40 60 80
Methane (kgC/ha)
Bio
mas
s (k
gC/h
a) .

Effect of water management

Field drainageField drainage
Field drainage during growing period (i.e. vegetative, panicle initial, and ripening stage) reduced CH4 emissions
Methane emission was reduced under longer period of field drainage.
Methane reduction rate from field drainage in vegetative period is higher than other growth period under the same drainage duration.
0
5
10
15
20
25
30
35
Seas
onal
CH
em
issi
on (
kgC
/ha)
.3 5 7 10
Drainage period (day)
Vegetative stage
Panicle initiation
Flowering stage
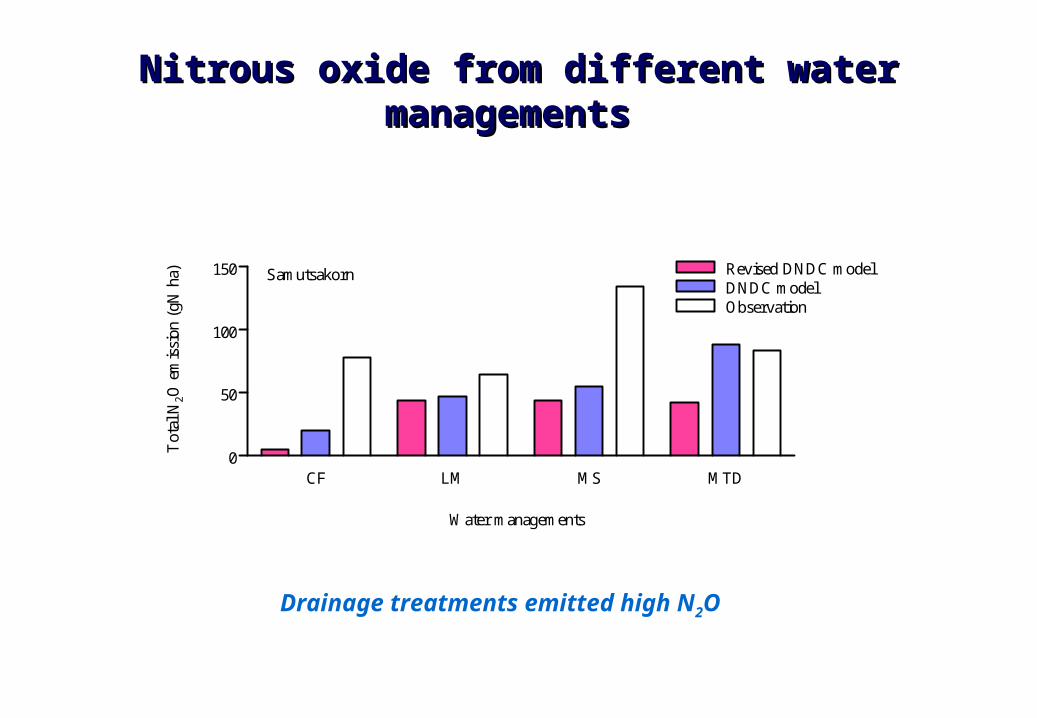
NitrousNitrous oxide from different water managementsoxide from different water managements
CF LM MS MTD0
50
100
150
Water managements
Tot
al N
2O e
mis
sion
(gN
ha) Samutsakorn Revised DNDC model
DNDC modelObservation
Drainage treatments emitted high N2O

Simulated NSimulated N22O from different type of O from different type of
fertilizer applicationsfertilizer applications
Urea Ap NT As NF0
0.5
1
1.5
2
Fertilizer application
Tota
l N2O
em
issio
ns (g
N h
a-1
)
SingburiRevised DNDC model
High N contained fertilizer enhances N2ON2O emission

ConclusionsConclusions
The sensitivity analysis suggested that soil properties such The sensitivity analysis suggested that soil properties such as Feas Fe+3+3 contents, rice straw incorporation and field drainage contents, rice straw incorporation and field drainage are the main factors influence on CHare the main factors influence on CH44 emission emission
Field drainage and fertilizer application influence on NField drainage and fertilizer application influence on N22O O
emissionemission

Mitigation optionsMitigation options
Possible mitigation optionsPossible mitigation options
1) Reduce amount of rice straw incorporation into rice soil, 1) Reduce amount of rice straw incorporation into rice soil,
2) conduct field drainage during growing period. 2) conduct field drainage during growing period. However, field drainage may induce weeds and possible to reduce rice However, field drainage may induce weeds and possible to reduce rice grain yield. Therefore, optimum drainage period in optimum growth stage grain yield. Therefore, optimum drainage period in optimum growth stage of rice plant needs to concern to obtain the practical mitigation option. of rice plant needs to concern to obtain the practical mitigation option.
3) Fertilizer application3) Fertilizer application
4. Rice cultivar 4. Rice cultivar

AcknowledgementsAcknowledgements
This research was funded by the grant of Eco-Frontier This research was funded by the grant of Eco-Frontier Fellowship program by Ministry of the Environment, Japan.Fellowship program by Ministry of the Environment, Japan.
We thanks Prof. C.S. Li for DNDC model. We thanks Prof. C.S. Li for DNDC model. Sincere thanks to Prof. Shu Fukai, Dr. Naruo Matsumoto, Sincere thanks to Prof. Shu Fukai, Dr. Naruo Matsumoto,
Dr. Niwat Nadheerong, Mr. Chitnucha Buddhaboon for Dr. Niwat Nadheerong, Mr. Chitnucha Buddhaboon for valuable data and their kindly suggestions on of Thai rice valuable data and their kindly suggestions on of Thai rice plants characteristics. plants characteristics.


![Ntop Howto [Ubuntu 8.04] - · PDF file© 2008 | M.A. TAMON | |Page 2 of 34 © Table of Contents Table of Contents](https://img.pdfslide.net/doc/110x75/5a7b5fb57f8b9a49588bdcae/ntop-howto-ubuntu-804-2008-ma-tamon-page-2-of-34-table-of-contents-table.jpg)


![Kazuyuki Tanaka ECEI Experiment D (2013 Practices)kazu/ECEI-Experiment... · 2015-04-14 · April, 2015 電気・通信・電子・情報工学実験D [Kazuyuki Tanaka Practice] 7](https://img.pdfslide.net/doc/110x75/5f25ec35cdc42b708b7e6301/kazuyuki-tanaka-ecei-experiment-d-2013-practices-kazuecei-experiment-2015-04-14.jpg)


![Kazuyuki Aihara arXiv:1206.4557v2 [physics.soc-ph] 3 Apr 2013](https://img.pdfslide.net/doc/110x75/620618186a76532a540832e7/kazuyuki-aihara-arxiv12064557v2-3-apr-2013.jpg)