Embed Size (px)
Citation preview
Greenhouse Gases Inventory
Year 2016
Cemig - Companhia Energética de Minas Gerais

Sumamry
1. Cemig .................................................................................................................. 3
2. About the inventory ............................................................................................. 4
3. Applied methodology ........................................................................................... 5
4. Covered Period ................................................................................................... 7
5. Organizational and geographical boundaries ...................................................... 7
6. Operational limits and emission sources ............................................................. 9
7. GHG emissions ................................................................................................. 10
7.1 Emissions of Scope 1 ................................................................................. 10
7.1.1 Stationary combustion .......................................................................... 11
7.1.2 Mobile Combustion............................................................................... 13
7.1.3 Fugitive emissions ................................................................................ 13
7.1.4 Agricultural activities ............................................................................. 14
7.2 Emissions of Scope 2 ................................................................................. 14
7.3 Emissions of Scope 3 ................................................................................. 15
7.3.1 Emissions from energy consumption by third parties ........................... 17
8. Total Emissions ................................................................................................. 18
9. Scope 1, quantified separately for each GHG ................................................... 19
10. Corporate targets ........................................................................................... 20
11. GHG emissions from biomass ....................................................................... 22
12. GHG Removals and reductions ..................................................................... 22
13. Exclusions ...................................................................................................... 27
14. Recalculation ................................................................................................. 27
15. Uncertainties and quality of the report ............................................................ 27
16. Responsible for preparing this report ............................................................. 29
17. Annex 1 - Verification statement .................................................................... 30
3
1. Cemig
Cemig completed 64 years of operation in 2016. Since its foundation, on May 22nd,
1952, the Company has assumed the role of bringing the collective welfare to the
regions where it operates in an innovative and sustainable way. This determination
led to its position as the largest power distributor in lines extension and networks,
and one of the largest power generation and power transmission companies in the
country.
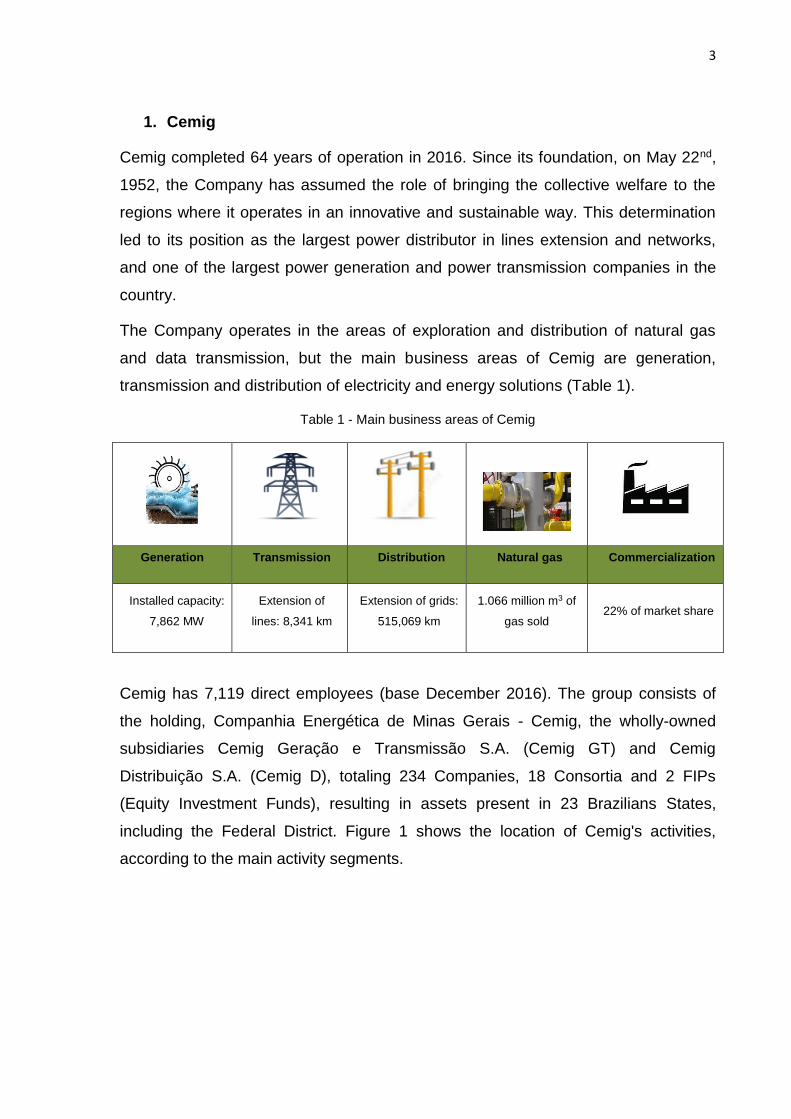
The Company operates in the areas of exploration and distribution of natural gas
and data transmission, but the main business areas of Cemig are generation,
transmission and distribution of electricity and energy solutions (Table 1).
Table 1 - Main business areas of Cemig
Generation Transmission Distribution Natural gas Commercialization
Installed capacity:
7,862 MW
Extension of
lines: 8,341 km
Extension of grids:
515,069 km
1.066 million m3 of
gas sold 22% of market share
Cemig has 7,119 direct employees (base December 2016). The group consists of
the holding, Companhia Energética de Minas Gerais - Cemig, the wholly-owned
subsidiaries Cemig Geração e Transmissão S.A. (Cemig GT) and Cemig
Distribuição S.A. (Cemig D), totaling 234 Companies, 18 Consortia and 2 FIPs
(Equity Investment Funds), resulting in assets present in 23 Brazilians States,
including the Federal District. Figure 1 shows the location of Cemig's activities,
according to the main activity segments.

4
Figure 1 - Map of geographical location of the Company’s main activities
STATES and in theFederal District
Generation
Generation (under construction)
Transmission
Transmission (under construction)
Distribution
Cemig’s Free Customers
Purchase of Energy
Wind generation
Natural gas distribution
Telecommunication
Present in
For a more detailed description of Cemig's business, access here.
See the full organization chart of the Cemig Group companies.
2. About the inventory
In line with the guidelines of the corporate document "Commitment to Climate
Change", Cemig invests in initiatives that positively position it in the efficient
management of its impacts and its exposure to the risks of the global climate
change. Accordingly, the Company contemplates in its strategy actions and
initiatives necessary to prevent and minimize impacts from its activities, develop
measures to adapt it to climate changes in order to minimize its risks, and the
related subjects are widely communicated and disclosed to society and its
shareholders.
In this sense, Cemig quantifies its emissions and makes public for the sixth
consecutive time its Inventory of Greenhouse Gases, recognizing its share of
responsibility in the theme and identifying opportunities to reduce emissions and
costs, adequately managing its risks related to climate changes. It should be noted
that these last six inventories were submitted to an independent verification
conducted, in this case, by Bureau Veritas Certification (Annex 1 - Verification
Statement, page 30).
This inventory, for 2016, was prepared according to these guidelines:

5
ABNT NBR ISO 14064-1 - Specification with guidance at the organization
level for quantification and reporting of greenhouse gas emissions and
removals.
Specifications of the GHG Protocol Brazilian Program - Accounting,
Quantification and Publishing Corporate Inventories of Greenhouse Gas
Emissions - Second Edition.
Intergovernmental Panel on Climate Change (IPCC) 2006, 2007, IPCC
Guidelines for National Greenhouse Gas Inventories, prepared by the
National Greenhouse Gas Inventories Program.
“The Greenhouse Gas Protocol - a Corporate Accounting and Reporting
Standard – Reviewed edition.”
Corporate Value Chain (Scope 3) Accounting and Reporting Standard -
Supplement to the GHG Protocol Corporate Accounting and Reporting
Standard (WRI / WBCSD).
3. Applied methodology
For the calculation of GHG emissions, the “Estimating tool of greenhouse gases for
intersectorial sources” was used (GHG Protocol Tool), Brazilian version,
"Ferramenta_GHG_Protocol_V2017.3".
The choice of the calculation methodology was mainly based on the internal
evaluation of data availability and the specific emission factors, in order to present
more transparent and consistent results with the reality of the electric sector, in line
with the Brazilian reality. Specific national GHG emission factors recognized by the
applicability principle, followed by the emission factors of the Intergovernmental
Panel on Climate Change (IPCC) (1996, 2001, 2006, 2007) were adopted. The data
referenced for the calculation of Scopes 1, 2 and 3 were collected through a
centralized approach to those responsible for its management, and the following
means of calculation were used:
6
Existing records in the Cemig´s ERP system1
Records in operating and corporate control systems
Invoices
Contracts
Registration Worksheets
It should be noted that the areas responsible for the information are certified in
internationally referenced management standards such as NBR ISO 9001:2008
and/or NBR ISO 14001:2004 and SGA Level 12 that Cemig has developed for units
whose license has not yet been issued by the environmental agency. All these
certifications are audited internally and by third party certifying organization.
Cemig is in the process of adapting its Management System to the requirements of
ISO 14001:2015 and ISO 9001:2015. The ISO 2015 Standards Transition Project
aims to better align management systems and strategic guidelines by introducing
the risk management mentality, stakeholder requirements analysis, organizational
learning, change management and greater engagement of the leadership, at all
levels, into the management system. The project started in 2015 and is expected to
be completed in September 2018. It consists of several stages, including training of
people involved, review of all management system documentation, redefinition of
certification scopes, review of the system for measuring results and conducting
audits.
Due to the complexity of collecting some data for the calculation of emissions, an
additional clarification is necessary for these cases, as described below.
1 ERP = Enterprise Resource Planning. It is a kind of business management system (e.g. SAP and others) used by large corporations. 2 SGA Level 1: Certification of Environmental Management System in NBR ISO 14001 is only possible for areas that have environmental license and, since many facilities were built before the environmental legislation, currently they are in corrective licensing process with environmental agencies. These facilities had good Environmental Management practices, but were prevented from getting ISO 14001 certification. Thus, Cemig developed the SGA Level 1 as a step towards ISO 14001 certification. In fact, over time, the facilities that have been obtaining the Environmental Operating License, after the first external audit, were recommended for ISO 14001 certification, showing the accuracy of the SGA Level 1 practices.
7
For the estimation of the loss percentage of SF6, the factor of 0.5%3 per year was
used for Cemig Distribuição equipment and 1%4 per year for Cemig Transmissão
equipment, bibliographic data acceptable to the operation sector of the Company.
Regarding the calculation of the distance between airports in the category "Business
Trips - Scope 3", SABRE Red Workspace, version v.2.10.1, developed by SABRE
Inc. was used.
Cemig receives the calculations of energy losses in Transmission, amounts verified
externally and attributed to its responsibility, counted by the CCEE (Brazilian Electric
Power Commercialization Chamber). For calculations of energy losses in
Distribution, Cemig calculates the data according to the Procedure for Distribution of
Electric Energy in the National Electric System - PRODIST, Module 7 - Calculation
of Distribution Losses.
4. Covered Period
The quantification of emissions from activities directly and indirectly developed by
Cemig corresponds to the period between January 1st, 2016 and December 31st,
2016. The historical base year chosen and referenced for the calculations, including
for the establishment of the corporate emission reduction target of Scope 1, was
2014, since it presented power generation at the Igarapé Thermoelectric Plant.
5. Organizational and geographical boundaries
For reporting purposes, in this inventory, Cemig adopted the Operational Control
approach, i.e., quantified the emissions of companies in which Cemig holds 100% of
the control. All these companies are in Brazilian territory. As a clarification, all
international trips considered for calculation of the emissions have sections with
departure or arrival in Brazil.
3 German Voluntary Self-Commitment Treaty (2005) available at http://vik.de/tl_files/downloads/public / sf6 / SV-SF6.pdf 4 SF6 Emission Estimation and Reporting Protocol for Electric Utilities (Final Version) prepared by Greenhouse Gas Division of Environment Canada and Canadian Electricity Association, available at http://publications.gc.ca/collections/collection_2013/ec/En4-229-2008-eng.pdf
8
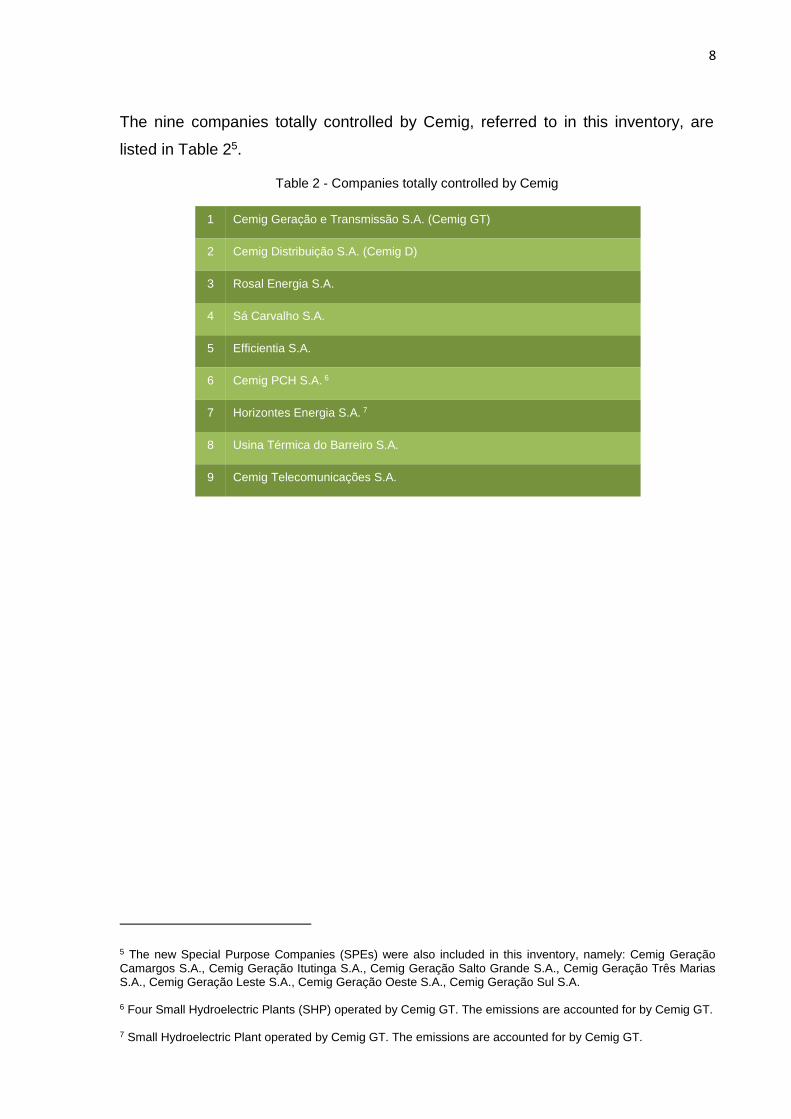
The nine companies totally controlled by Cemig, referred to in this inventory, are
listed in Table 25.
Table 2 - Companies totally controlled by Cemig
1 Cemig Geração e Transmissão S.A. (Cemig GT)
2 Cemig Distribuição S.A. (Cemig D)
3 Rosal Energia S.A.
4 Sá Carvalho S.A.
5 Efficientia S.A.
6 Cemig PCH S.A. 6
7 Horizontes Energia S.A. 7
8 Usina Térmica do Barreiro S.A.
9 Cemig Telecomunicações S.A.
5 The new Special Purpose Companies (SPEs) were also included in this inventory, namely: Cemig Geração Camargos S.A., Cemig Geração Itutinga S.A., Cemig Geração Salto Grande S.A., Cemig Geração Três Marias S.A., Cemig Geração Leste S.A., Cemig Geração Oeste S.A., Cemig Geração Sul S.A. 6 Four Small Hydroelectric Plants (SHP) operated by Cemig GT. The emissions are accounted for by Cemig GT. 7 Small Hydroelectric Plant operated by Cemig GT. The emissions are accounted for by Cemig GT.

9
6. Operational limits and emission sources
Table 3 lists greenhouse gas emission sources and their respective categories.
Table 3 - Emission sources and category
SCOPE 1
Emission Sources Category
Fuel consumption of the corporate fleet Mobile combustion
Fuel consumption in aircraft and small vessels Mobile combustion
Emergency generators Stationary combustion
Fuel used in Igarapé Thermoelectric Plant Stationary combustion
Fuel used in the startup and operation of the process gas thermal plant
(Barreiro TPP) Stationary combustion
Machinery and equipment Stationary combustion
SF6 emissions from electrical equipment Fugitive emissions
Fertilizers used in the production of seedlings and in plantations Agricultural activities
Fuels used in forklifts and cranes Stationary combustion
SCOPE 2
Emission Sources Category
Consumption of electricity in administrative and operational units Purchase of electricity
Technical losses of electricity in Transmission and Distribution systems Purchase of electricity
SCOPE 3
Emission Sources Category
Outsourced transportation of materials, solid waste and equipment Upstream Transportation and
Distribution
Air travel Business travel
Gasoline, alcohol and diesel consumption by Distribution contractors Downstream Transportation and
Distribution
Electricity consumption by final consumers Use of goods and services sold
Outsourced transportation of employees Employees commuting

10
It should be noted that in this inventory, the contribution from reservoirs of
hydroelectric power plants to climate change was not evaluated due to the lack of
a scientific conclusion about its relation with the greenhouse gases emissions,
and methodologies and conceptual models universally accepted and credible are
not available to quantify the GHG emissions in reservoirs.
7. GHG emissions
Table 4 shows the details of the emissions of Scope 1, Scope 2 and Scope 3,
allowing, also, the historical analysis of the last nine years (2008/2016).
Comments on emissions performance are described in subsequent items.
Table 4 - GHG emissions history - Scopes 1, 2 and 3 - 2008 to 2016
Year Scope 1 (t CO2e) Scope 2 (t CO2e) Scope 3 (t CO2e)
2008 287,307 282,439 ND
2009 111,758 390,039 ND
2010 59,642 295,478 4,937,535
2011 24,384 168,189 5,202,775
2012 53,567 436,750 5,341,863
2013 156,618 608,971 7,658,967
2014 617,717 858,014 11,332,770
2015 164,537 809,583 9,629,715
2016 15,462 552,805 6,065,110
7.1 Emissions of Scope 1
The following were the emissions of Scope 1 in 2016: 10,302 tCO2e, from the fleet
of vehicles, boats and aircrafts; 4,884 tCO2e of fugitive gas emissions SF6, present
in electrical equipment; 96 tCO2e, from the start of the Barreiro Thermal Power
Plant; 27 tCO2e, from the use of emergency generators; 101 tCO2e, from the use of
machinery and forklifts; and 53 tCO2e from the use of fertilizers.
The intensity of Cemig's direct emissions was 0.000664 tCO2e/MWh.
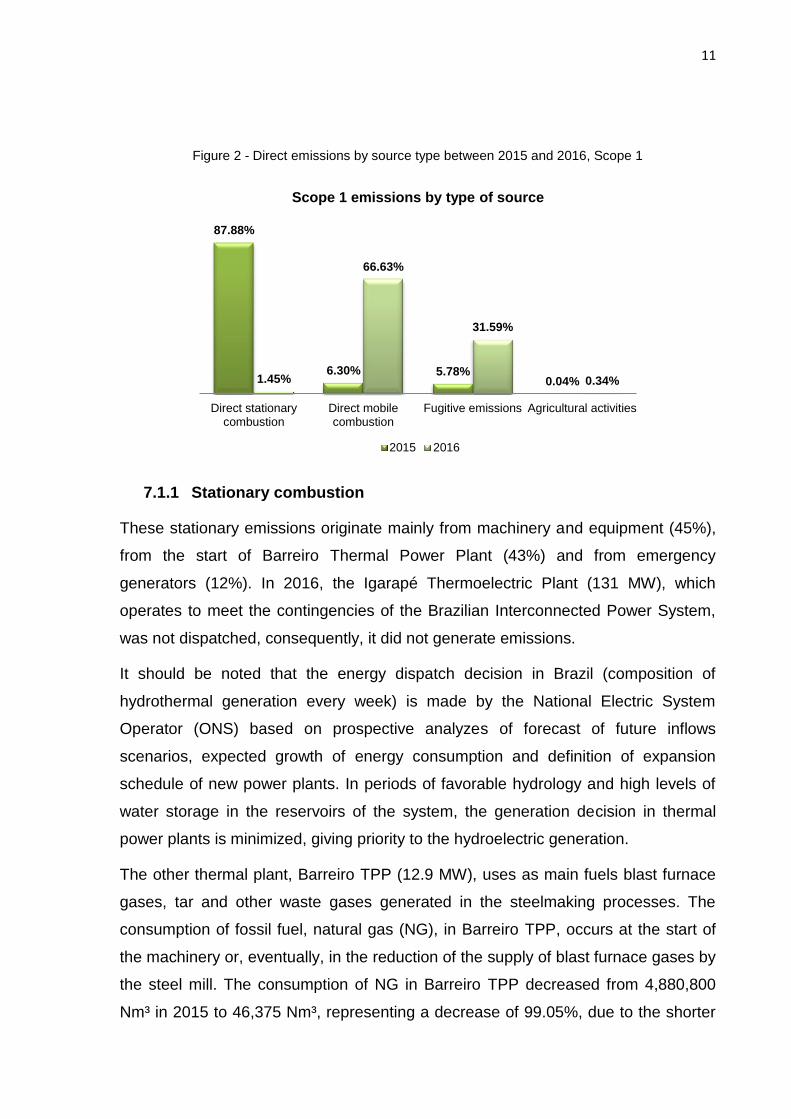
Figure 2 shows the emission sources of Scope 1 by type of source and the
contribution in relation to the total, referring to 2015 and 2016.
11
Figure 2 - Direct emissions by source type between 2015 and 2016, Scope 1
87.88%
6.30% 5.78%0.04%1.45%
66.63%
31.59%
0.34%
Direct stationarycombustion
Direct mobilecombustion
Fugitive emissions Agricultural activities
Scope 1 emissions by type of source
2015 2016
7.1.1 Stationary combustion
These stationary emissions originate mainly from machinery and equipment (45%),
from the start of Barreiro Thermal Power Plant (43%) and from emergency
generators (12%). In 2016, the Igarapé Thermoelectric Plant (131 MW), which
operates to meet the contingencies of the Brazilian Interconnected Power System,
was not dispatched, consequently, it did not generate emissions.
It should be noted that the energy dispatch decision in Brazil (composition of
hydrothermal generation every week) is made by the National Electric System
Operator (ONS) based on prospective analyzes of forecast of future inflows
scenarios, expected growth of energy consumption and definition of expansion
schedule of new power plants. In periods of favorable hydrology and high levels of
water storage in the reservoirs of the system, the generation decision in thermal
power plants is minimized, giving priority to the hydroelectric generation.
The other thermal plant, Barreiro TPP (12.9 MW), uses as main fuels blast furnace
gases, tar and other waste gases generated in the steelmaking processes. The
consumption of fossil fuel, natural gas (NG), in Barreiro TPP, occurs at the start of
the machinery or, eventually, in the reduction of the supply of blast furnace gases by
the steel mill. The consumption of NG in Barreiro TPP decreased from 4,880,800
Nm³ in 2015 to 46,375 Nm³, representing a decrease of 99.05%, due to the shorter
12
operating time of the plant, 713.95 hours in 2016 versus 6,641.62 hours in 2015,
because of the shutdown of one of the blast furnaces by Vallourec. The Cemig -
Vallourec contract for the operation of Barreiro TPP was terminated in December
2016, therefore, this Thermoelectric Plant will no longer be part of Cemig’s GHG
inventory, as of the next edition.
It should also be noted that the reused gases from the steelmaking process burned
at Barreiro TPP are not accounted for here, since they are generated in Vallourec's
production process and recorded in the inventory of that company. Complementary
to this fact, these gases are generated due to the use of charcoal produced by
planted forests, i.e., wood of sustainable origin, and, therefore, these emissions are
considered neutral.
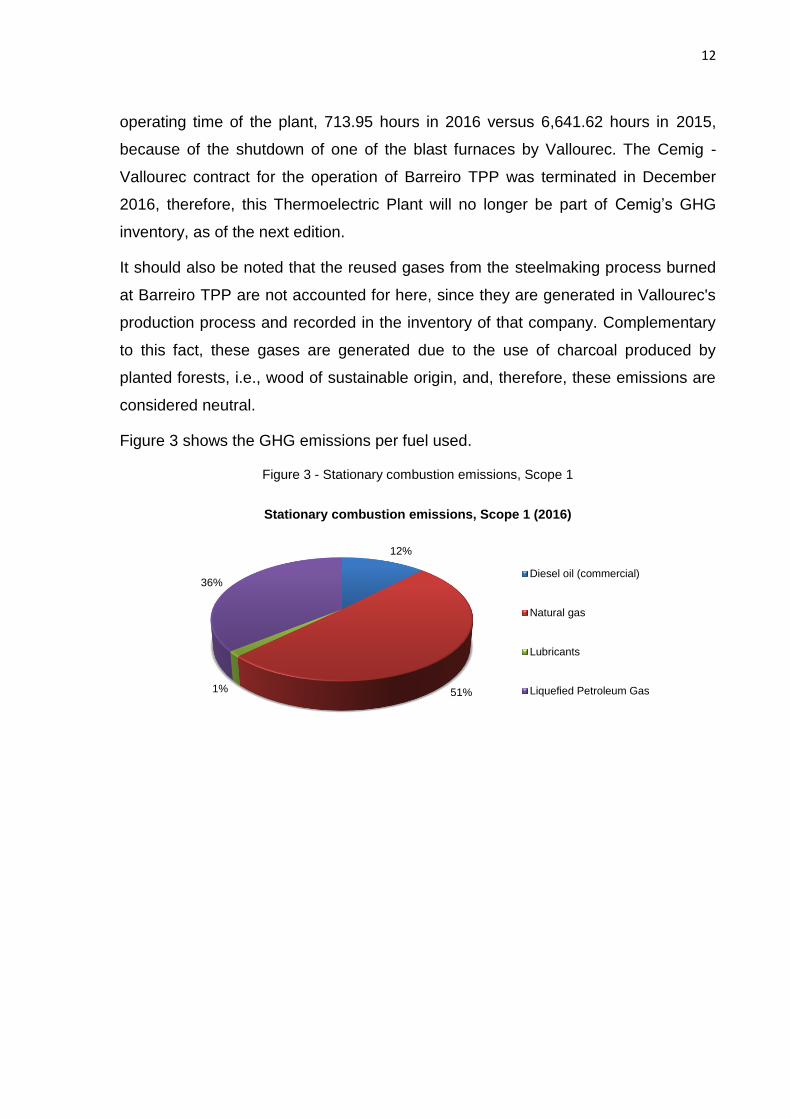
Figure 3 shows the GHG emissions per fuel used.
Figure 3 - Stationary combustion emissions, Scope 1
12%
51%1%
36%
Stationary combustion emissions, Scope 1 (2016)
Diesel oil (commercial)
Natural gas
Lubricants
Liquefied Petroleum Gas
13
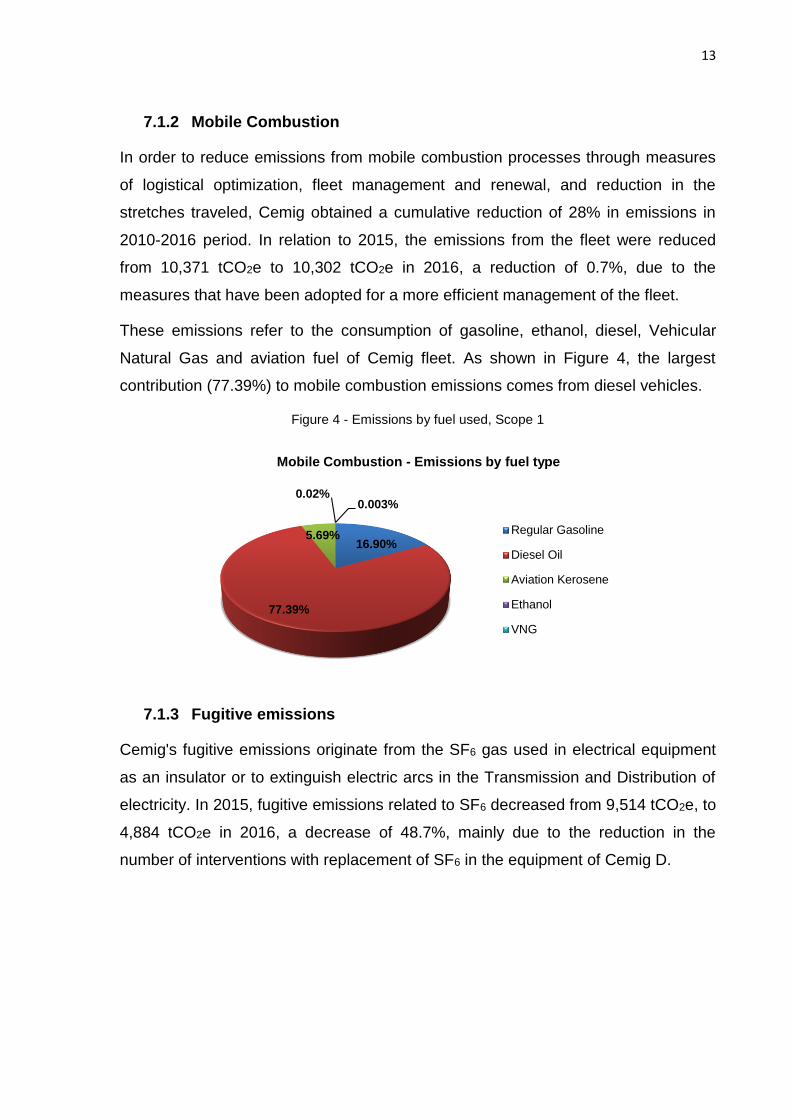
7.1.2 Mobile Combustion
In order to reduce emissions from mobile combustion processes through measures
of logistical optimization, fleet management and renewal, and reduction in the
stretches traveled, Cemig obtained a cumulative reduction of 28% in emissions in
2010-2016 period. In relation to 2015, the emissions from the fleet were reduced
from 10,371 tCO2e to 10,302 tCO2e in 2016, a reduction of 0.7%, due to the
measures that have been adopted for a more efficient management of the fleet.
These emissions refer to the consumption of gasoline, ethanol, diesel, Vehicular
Natural Gas and aviation fuel of Cemig fleet. As shown in Figure 4, the largest
contribution (77.39%) to mobile combustion emissions comes from diesel vehicles.
Figure 4 - Emissions by fuel used, Scope 1
16.90%
77.39%
5.69%
0.02%0.003%
Mobile Combustion - Emissions by fuel type
Regular Gasoline
Diesel Oil
Aviation Kerosene
Ethanol
VNG
7.1.3 Fugitive emissions
Cemig's fugitive emissions originate from the SF6 gas used in electrical equipment
as an insulator or to extinguish electric arcs in the Transmission and Distribution of
electricity. In 2015, fugitive emissions related to SF6 decreased from 9,514 tCO2e, to
4,884 tCO2e in 2016, a decrease of 48.7%, mainly due to the reduction in the
number of interventions with replacement of SF6 in the equipment of Cemig D.

14
7.1.4 Agricultural activities
Emissions from Cemig's agricultural activities come from from the use of organic or
chemical fertilizers in the production of seedlings of native species and others for
urban afforestation, planting of riparian forests and as nutrients used for fish
farming. Comparing 2015 and 2016, the amounts went from 57 tCO2e to 53 tCO2e,
a variation of 6.9%, due to the decrease in these activities.
7.2 Emissions of Scope 2
The emissions of Scope 2 are related to the electricity consumption used in
industrial and administrative facilities, from the National Interconnected System
(SIN), and energy losses in Transmission and Distribution (T&D) in the electrical
system, the latter being the main source of emissions of the Company. As described
in the Methodology item, energy losses are calculated by an energy balance,
accounted for according to standard Aneel procedures. As a comparison, it is worth
mentioning that emissions of Scope 2 are strongly influenced by changes in the
electricity emission factor of SIN8, which varies as a function of greater or lesser
dispatch of thermal power plants throughout the year (Table 5).
Table 5 - History of the Emission Factors of the National Interconnected System
Year Annual average (tCO2e/MWh)
2011 0.0292
2012 0.0686
2013 0.0960
2014 0.1355
2015 0.1244
2016 0.0817
Out of the total emissions of Scope 2 in 2016, 0.6% of them, equivalent to 3,566
tCO2e, as a result of energy consumption, and 99.4%, equivalent to 549,239 tCO2e,
as a result of technical losses.
8 http://www.mct.gov.br/index.php/content/view/321144.html#ancora

15
The total emissions of Scope 2, Figure 5, decreased from 809,583 tCO2e to 552,805
tCO2e between 2015 and 2016 (31.7%), as a result of the reduction of electricity
losses and the SIN factor.
Figure 5 - Indirect emissions from electricity consumption, Scope 2
168,189
436,750
608,971
858,014 809,583
552,805
5,760
6,368 6,341 6,333
6,506
6,768
5200
5400
5600
5800
6000
6200
6400
6600
6800
7000
0
100000
200000
300000
400000
500000
600000
700000
800000
900000
1000000
2011 2012 2013 2014 2015 2016
GW
h
tCO₂e
Indirect emissions from electricity consumption
CO2 emission (t) Total electricity consumed (GWh)
The main actions undertaken to minimize emissions related to energy losses in T&D
are described in the Corporate targets item.
7.3 Emissions of Scope 3
Cemig seeks the continuous improvement of the inventory of Scope 3 emissions,
introducing new emission sources, always according to the assessment of the level
of availability, quality, veracity and traceability of such data from third parties. Table
6 shows Scope 3 emissions per emission activity.

16
Table 6 - GHG emissions in tCO2e per emission activity of Scope 3
GHG emissions (tCO2e) 2011 2012 2013 2014 2015 2016
Transport of Materials, Equipment and Waste
(Upstream Transportation and Distribution)
(Commuting)
1,618 2,874 2,035 1,403 974 1,138
Business travels 1,786 1,953 1,691 1,361 1,138 846
Sale of Energy
(Use of goods and services sold) 5,199,371 5,321,724 7,643,677 11,324,277 9,614,752 6,049,885
Operation and maintenance services of Cemig
Distribuição
(Fuel consumption of contractors)
(Downstream Transportation and Distribution)
ND 15,313 11,563 5,729* 12,851 13,241
* 2014 was atypical, with low adherence of third parties in the data reporting.
The main emission source of Scope 3 is the consumption of electricity by end
consumers. In 2016, Cemig recorded a 4.2% reduction in total sales, which
generated a 37.1% decrease in indirect emissions, a fact also highlighted by the
reduction of the SIN emission factor from 0.1244 tCO2e/MWh in 2015 to 0.0817
tCO2e/MWh in 2016. It was used the SIN emission factor because energy provided
by Cemig for the Interconnected System composes this calculation made by the
Ministry of Science and Technology, although the Company emission factor is lower
than the Brazilian Matrix emission factor.
Representing 0.014% of indirect emissions, business travels accounted for 846
tCO2e. The reduction of 25.6% in the respective emissions in relation to 2015 was a
consequence of the reduction in the use of this service.
Out of the other emitting sources, 548 tCO2e came from the transport of materials,
equipment and waste; 591 tCO2e, from the transport of employees, there was an
increase of approximately 46.6% and a reduction of approximately 1.5% in relation
to 2015, respectively.
Emissions from the vehicles of the contractors that provided operating and
maintenance services for Cemig Distribuição totaled 13,241 tCO2e in 21 contractors,
a total of 25 with contracts in force in 2016, invited to participate. It is important to
emphasize that the participation and the contribution with information by the
contractors are voluntary. It should be noted that the Company continues to engage
its suppliers in relation to climate issues.
17
7.3.1 Emissions from energy consumption by third parties
The energy sold by Cemig corresponds to the sale of energy to captive consumers
and free customers, in the concession area in Minas Gerais and outside the State;
the sale of energy to other agents of the electricity sector in the ACR (Regulated
Contracting Environment) and the ACL (Free Contracting Environment); and sales in
Proinfa (Programme of Incentives for Alternative Electricity Sources) and CCEE
(Electric Energy Commercialization Chamber), eliminating the existing transactions
between the companies of the Cemig Group.
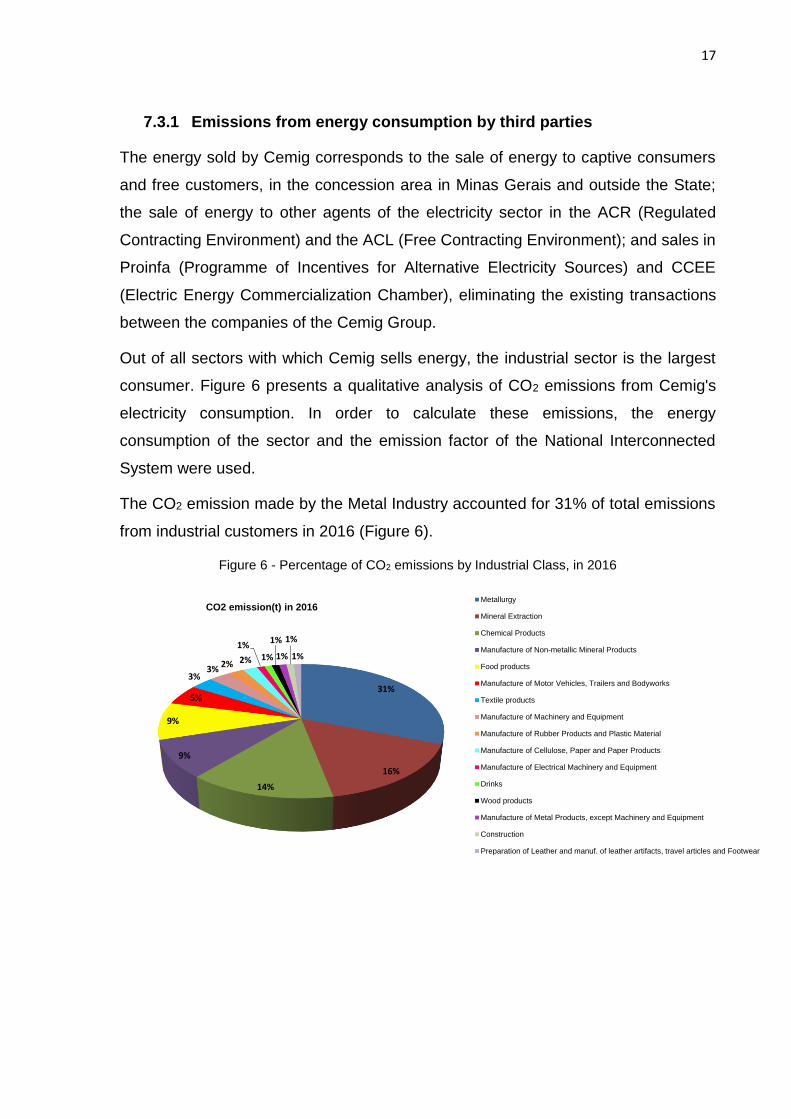
Out of all sectors with which Cemig sells energy, the industrial sector is the largest
consumer. Figure 6 presents a qualitative analysis of CO2 emissions from Cemig's
electricity consumption. In order to calculate these emissions, the energy
consumption of the sector and the emission factor of the National Interconnected
System were used.
The CO2 emission made by the Metal Industry accounted for 31% of total emissions
from industrial customers in 2016 (Figure 6).
Figure 6 - Percentage of CO2 emissions by Industrial Class, in 2016
31%
16%
14%
9%
9%
5%
3%3%
2% 2%
1%1%
1%
1%
1%
1%
CO2 emission(t) in 2016Metallurgy
Mineral Extraction
Chemical Products
Manufacture of Non-metallic Mineral Products
Food products
Manufacture of Motor Vehicles, Trailers and Bodyworks
Textile products
Manufacture of Machinery and Equipment
Manufacture of Rubber Products and Plastic Material
Manufacture of Cellulose, Paper and Paper Products
Manufacture of Electrical Machinery and Equipment
Drinks
Wood products
Manufacture of Metal Products, except Machinery and Equipment
Construction
Preparation of Leather and manuf. of leather artifacts, travel articles and Footwear
18
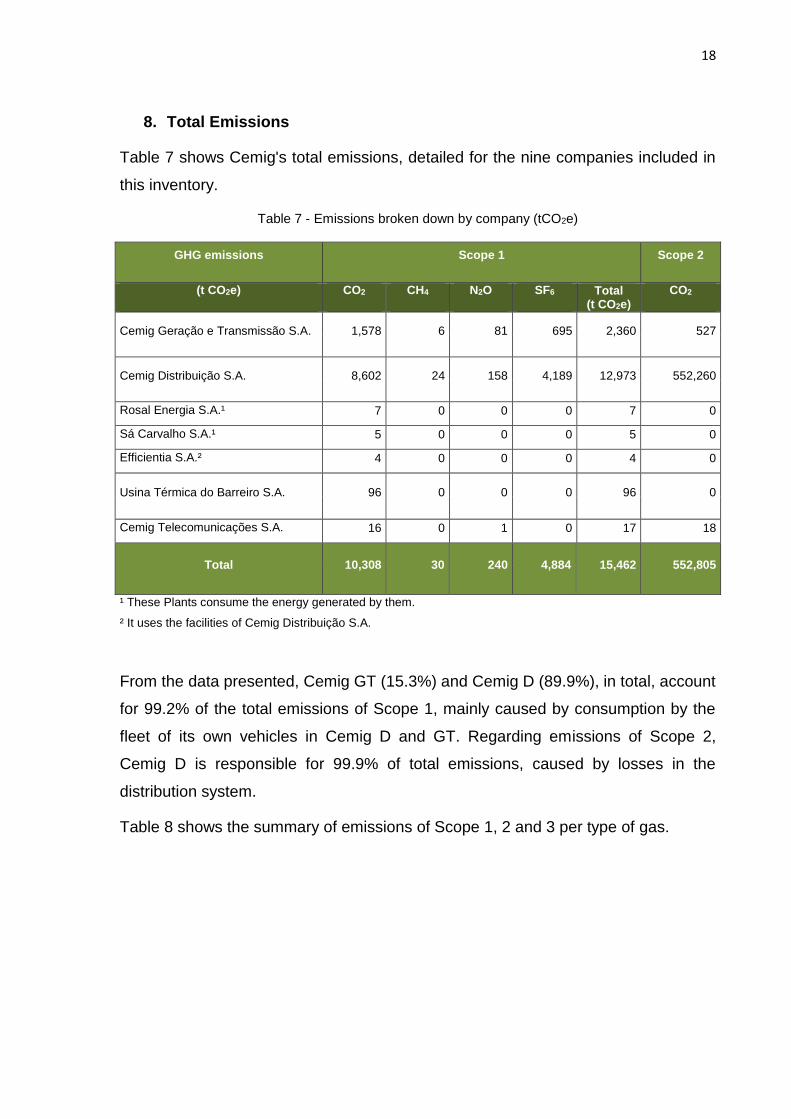
8. Total Emissions
Table 7 shows Cemig's total emissions, detailed for the nine companies included in
this inventory.
Table 7 - Emissions broken down by company (tCO2e)
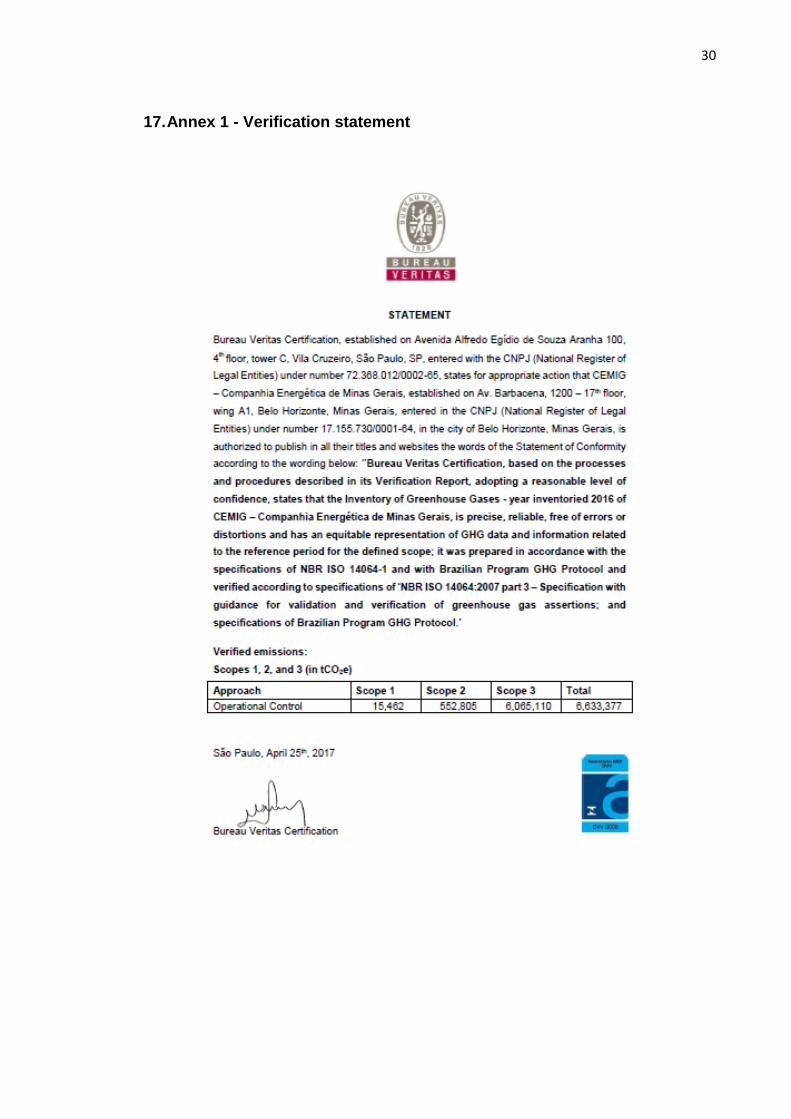
GHG emissions Scope 1 Scope 2
(t CO2e) CO2 CH4 N2O SF6 Total (t CO2e)
CO2
Cemig Geração e Transmissão S.A. 1,578 6 81 695 2,360 527
Cemig Distribuição S.A. 8,602 24 158 4,189 12,973 552,260
Rosal Energia S.A.¹ 7 0 0 0 7 0
Sá Carvalho S.A.¹ 5 0 0 0 5 0
Efficientia S.A.² 4 0 0 0 4 0
Usina Térmica do Barreiro S.A. 96 0 0 0 96 0
Cemig Telecomunicações S.A. 16 0 1 0 17 18
Total 10,308 30 240 4,884 15,462 552,805
¹ These Plants consume the energy generated by them.
² It uses the facilities of Cemig Distribuição S.A.
From the data presented, Cemig GT (15.3%) and Cemig D (89.9%), in total, account
for 99.2% of the total emissions of Scope 1, mainly caused by consumption by the
fleet of its own vehicles in Cemig D and GT. Regarding emissions of Scope 2,
Cemig D is responsible for 99.9% of total emissions, caused by losses in the
distribution system.
Table 8 shows the summary of emissions of Scope 1, 2 and 3 per type of gas.
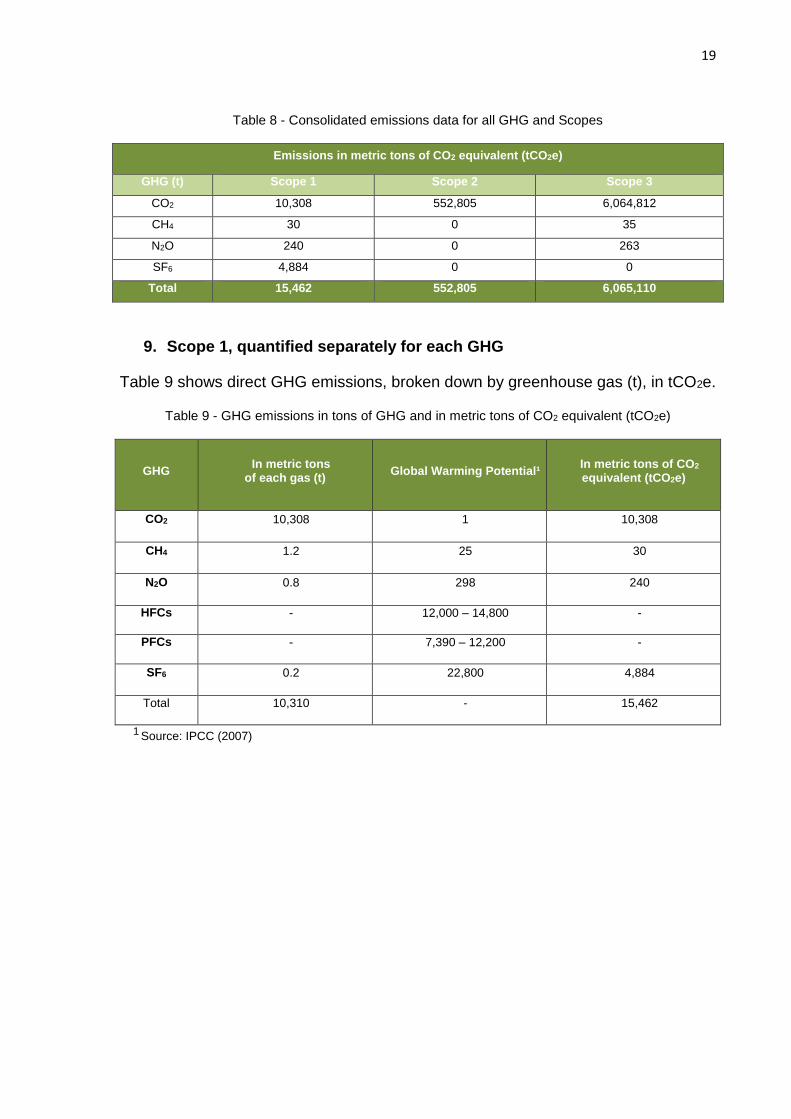
19
Table 8 - Consolidated emissions data for all GHG and Scopes
Emissions in metric tons of CO2 equivalent (tCO2e)
GHG (t) Scope 1 Scope 2 Scope 3
CO2 10,308 552,805 6,064,812
CH4 30 0 35
N2O 240 0 263
SF6 4,884 0 0
Total 15,462 552,805 6,065,110
9. Scope 1, quantified separately for each GHG
Table 9 shows direct GHG emissions, broken down by greenhouse gas (t), in tCO2e.
Table 9 - GHG emissions in tons of GHG and in metric tons of CO2 equivalent (tCO2e)
GHG In metric tons
of each gas (t) Global Warming Potential¹
In metric tons of CO2 equivalent (tCO2e)
CO2 10,308 1 10,308
CH4 1.2 25 30
N2O 0.8 298 240
HFCs - 12,000 – 14,800 -
PFCs - 7,390 – 12,200 -
SF6 0.2 22,800 4,884
Total 10,310 - 15,462
1 Source: IPCC (2007)
20
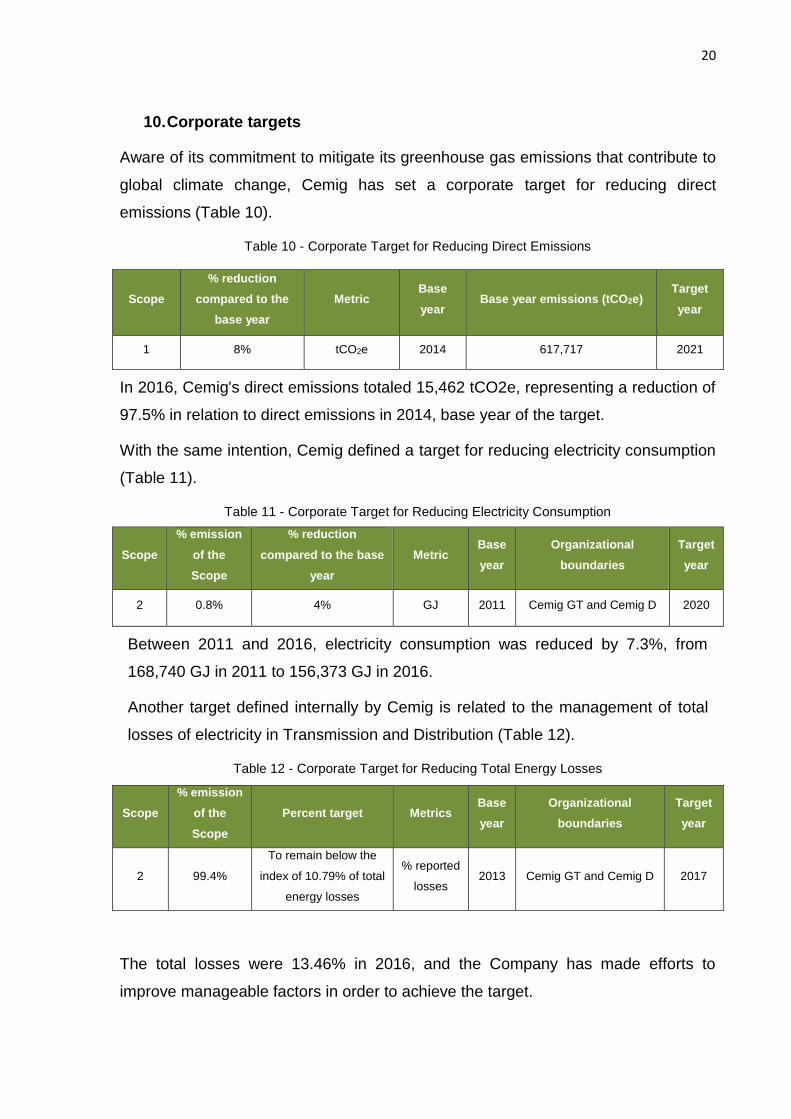
10. Corporate targets
Aware of its commitment to mitigate its greenhouse gas emissions that contribute to
global climate change, Cemig has set a corporate target for reducing direct
emissions (Table 10).
Table 10 - Corporate Target for Reducing Direct Emissions
Scope
% reduction
compared to the
base year
Metric Base
year Base year emissions (tCO2e)
Target
year
1 8% tCO2e 2014 617,717 2021
In 2016, Cemig's direct emissions totaled 15,462 tCO2e, representing a reduction of
97.5% in relation to direct emissions in 2014, base year of the target.
With the same intention, Cemig defined a target for reducing electricity consumption
(Table 11).
Table 11 - Corporate Target for Reducing Electricity Consumption
Scope
% emission
of the
Scope
% reduction
compared to the base
year
Metric Base
year
Organizational
boundaries
Target
year
2 0.8% 4% GJ 2011 Cemig GT and Cemig D 2020
Between 2011 and 2016, electricity consumption was reduced by 7.3%, from
168,740 GJ in 2011 to 156,373 GJ in 2016.
Another target defined internally by Cemig is related to the management of total
losses of electricity in Transmission and Distribution (Table 12).
Table 12 - Corporate Target for Reducing Total Energy Losses
The total losses were 13.46% in 2016, and the Company has made efforts to
improve manageable factors in order to achieve the target.
Scope
% emission
of the
Scope
Percent target Metrics Base
year
Organizational
boundaries
Target
year
2 99.4%
To remain below the
index of 10.79% of total
energy losses
% reported
losses 2013 Cemig GT and Cemig D 2017
21
Total distribution losses (IPTD) are segmented into technical losses (PPTD) and
non-technical losses (PPNT) or commercial losses and are calculated by the
difference between what was billed and the amount of loss in the basic network, as
determined by CCEE. The technical losses are inherent to the transportation of
energy along the equipment and transmission and distribution lines. They are
influenced, among other factors, by the conditions of dispatch of the plants, by the
level of works of reinforcement in the electric system, by the behavior of the
consumer market and by the adoption of specific measures for reduction. Non-
technical losses are related to deficiencies or irregularities in the measurement and
billing of consumer units as well as to the existence of clandestine connections in
the network of the distributor. The control of non-technical losses is fundamental to
minimize the Company's financial losses, which are, in part, passed on to
consumers' tariffs during the tariff review process.
Regarding the calculation of the losses indicators, the IPTD in 2016 was 13.46% in
relation to the total energy injected into the distribution system, an increase of 0.94
p.p. in relation to 2015, and the regulatory target established for the end of 2016
was 10.79%. The Total Losses of the Distribution are composed by the Technical
Losses plus the Commercial Losses (Non-Technical Losses). The Technical Losses
Index in 2016 was 9.09% in relation to the total energy injected into the distribution
system (reduction of 0.37 p.p. compared to the value realized in 2015) for a
regulatory target of 7.84%. On the other hand, the PPNT (non-technical losses) was
4.37% for a target of 3.03%.
This increase was driven by an unfavorable macroeconomic scenario, with inflation
and unemployment rising, associated with tariff readjustments of approximately 46%
for the residential class in 2014 and 2015. In addition to this scenario, there was a
reduction in the execution of inspection services in consumer units.
Regarding the management of Commercial Losses, in 2016 approximately 26
thousand inspections were carried out in consumer units, providing recovery and
energy increment of 36 GWh and 80 GWh, respectively. Despite the reduction in the
number of inspections made in relation to 2015, the energy incorporated with the
regularizations remained stable, due to the good volume of charges made in 2016
and the contribution in the increase of energy due to the inspections made in 2015.
These amounts of energy correspond to aggregate revenues for the Company of R$
22
30 and R$ 36 million, respectively. Therefore, in 2016, the regularization process in
consumer units provided additional revenue for the Company of R$ 66 million.
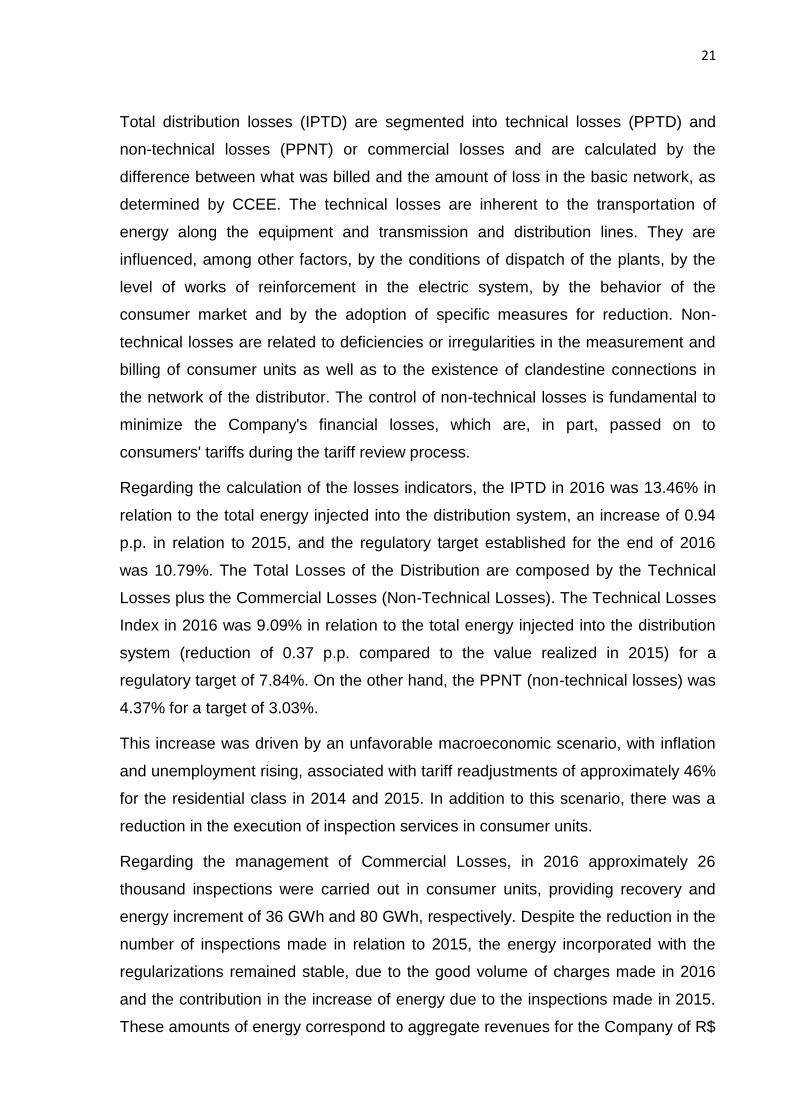
11. GHG emissions from biomass
The "neutral carbon" emitted on biomass burning is reported separately, according
to the guidelines of the GHG Protocol. For the fossil fuels with the addition of
biofuels, the values indicated by the National Agency of Petroleum (ANP) were
used, compiled in the Calculation Tool of the GHG Protocol Brazilian Program. In
2016, the average addition of ethanol (anhydrous) to gasoline marketed in Brazil
was 27% and 7% of biodiesel to diesel.
Table 13 shows emissions from biomass consumption.
Table 13 - Emissions of biogenic CO2 (tCO2e)
Scope 1 1,181
Scope 3 1,390
Total 2,571
12. GHG Removals and reductions
Cemig undertakes some actions that indirectly contribute to the removal of GHG,
however, due to its peculiar characteristics related to the quantification of emissions
and its low level of assertiveness and integrity, at this moment, the Company chose
not to quantify them.
The following are some of the initiatives that contribute to the reduction of GHG:
The Riparian Reforestation Program, which is a cooperative action between
the Company, the rural owners of the areas around reservoirs, considered
Permanent Preservation Areas (APP), and the Public Prosecutor's Office.
The owners are encouraged by Cemig to preserve these areas and promote
riparian reforestation. In order to do so, the Company provides the seedlings
and accounts for the implementation costs; in turn, the owners make the
areas available and commit themselves to their proper maintenance. In 2016,
23
Cemig recovered approximately 46 ha of riparian forests around its
reservoirs, in partnership with the rural owners of the Permanent Preservation
Areas.
The Company manages two forest nurseries, located in the environmental
stations of Itutinga and Volta Grande, where seedlings are also produced for
urban afforestation, as well as a seed laboratory, located in Belo Horizonte. In
addition to producing seedlings of urban afforestation in compliance with
agreements with municipal governments, Cemig's nurseries also produce
seedlings of native species for reforestation of riparian forests around their
reservoirs, tributary rivers and springs, in partnership with farmers.
Between 2012 and 2016, a Research and Development (R&D 484) project
was developed, in partnership with the Federal University of Ouro Preto -
UFOP, in order to evaluate the effectiveness and sustainability of the riparian
forests of Volta Grande HPP, in the conservation of ecological processes and
biodiversity. In this work, the ecosystem services provided by the riparian
forests of the Volta Grande HPP reservoir were identified. Among these
services, can be mentioned the conservation of natural ecosystems and the
supply of goods and services, such as water and food. In addition to the
wood provided by the forest, it still provides seeds, fruits, medicinal and
ornamental plants, fibers and dyes. The forests also contain organisms that
play important roles in the maintenance of the environment and also provide
other services of immense influence on climate, hydrological cycles,
biodiversity, water and air quality and soil fertilization.
The main results obtained by the R&D 484, which evaluated the last 30 years
of the project of implantation of riparian forests in the Volta Grande HPP,
allow the following conclusions:
- The reforested areas around the reservoir, although not recovered for the
specific purpose of recovering biodiversity, ecological processes and
ecosystem services, present today such a set of elements that are important
for their own "survival" and longevity;
24
- These areas house a relatively high biodiversity, compared to other
fragments in the same region, although the similarity of composition, structure
and dynamics are below what would be considered ideal;
- The restoration process of riparian forests has already achieved several
benefits, including: erosion control, maintenance of soil fertility and
hydrological cycles;
- It is remarkable the increase in plant biodiversity and fauna, biodiversity of
aquatic invertebrates, vegetation productivity and carbon sequestration,
which brings direct benefits to human life;
- The presence of a greater number of animal species can be considered an
important tool for the conservation and restoration of riparian forest fragments
because of the ecosystem services provided by these animals;
- Studies have shown that several species of birds, mammals and
invertebrates, such as ants and beetles, act as dispersers of fruits and seeds
and decomposers of organic matter, contributing to the enrichment of the
flora.
For more details on the R&D 484 project, visit: http://www.prociliar.ufop.br/
Access here Cemig 2016 Biodiversity Report.
The strategy for reducing GHG emissions is based on ten principles outlined in the
document "Commitment to Climate Change", in which three main initiatives stands
out: 1. Energy generation from renewable sources; 2. Fleet management; and 3.
Expansion of the renewable matrix and maintenance of assets. The following are
some of the corporate initiatives that contribute to the reduction of GHG:
Scope 1
Defined as a corporate strategic driver, the promotion of the use of renewable
energy sources is also oriented to offer greater diversification of the
generating park, with new sources such as wind, solar and other possibilities
pointed out by the researches, and innovation of the Company.
Recent R&D projects present results that can be used in a large scale by the
Company in the medium and long term, among them: i) generation of
electricity in solar plants connected to the electrical system, know-how which

25
has been pioneering developed by Cemig through the projects Sete Lagoas
Solar Power Plant and Mineirão Solar, the latest already inaugurated; and ii)
development of PVT (photovoltaic-thermal) solution to increase the efficiency
of solar plants.
Considering Cemig D and Cemig GT's fleet of vehicles, its fuel consumption
was reduced by 1.22%, representing an economy of approximately R$ 1.6
million for the Company between 2015 and 2016. Comparing the years 2012
and 2016, Cemig has reduced its annual consumption by 10.16%, i.e., there
has been a reduction in consumption of more than one million liters. This
reduction in consumption is due to the updating of the vehicles fleet, resulting
from the "Fleet Optimization Program", made in 2015. The optimization of the
fleet was possible because all vehicles replaced since 2010 had Electronic
Management System installed. This tool has been allowing constant
monitoring in the use of vehicles. Between 2012 and 2016, there was a
reduction of 630 vehicles. In addition, in 2016, with the implementation of the
new fleet replacement program, about 93% of the pickup truck fleet started to
use Diesel S10, which contains low sulfur content.
Investments in training, equipment, change of methodology and processes
focused on the mitigation of SF6 losses, either by eliminating leaks or by
eliminating losses in the maintenance process.
In addition, it should be noted that Cemig assesses the risk of the increase in
carbon emissions in its energy matrix by carrying out environmental due
diligence related to the acquisition and/or merger of new assets, or
considering the risk in the calculation of the economical and technical
feasibility of new projects through sensitivity analysis. This initiative has
helped the Company in decision making, considering the climate strategy in
the expansion of its business.
Scope 2
Establishment of corporate targets to reduce electricity consumption at
Cemig, as described in Corporate target item.
26
In 2016, in order to curb the increase in Commercial Losses and educate the
population about the various damages caused by the irregularities, Cemig
promoted several inspections at strategic points in Belo Horizonte and in the
interior of Minas Gerais State, with simultaneous media and publicity of news
by different means of communication (written media, radio and television
broadcast).
In addition, improvements were made to the software for the selection of
inspection targets (SGC/SAP/SAS/MECE), improvements in the quality of the
irregular consumption collection process, and the screening of medium and
large-sized consumer revenues, whereas Cemig since 2012 has a dedicated
telemetry structure, based on its Integrated Measurement Center, which
enables the remote monitoring of approximately 13 thousand large
customers, representing about 45% of the Company's revenues.
Another important action to mitigate Commercial Losses relates to the
program to modernize the measurement park of consumers throughout the
Minas Gerais State. In 2016, as of this program, approximately 215 thousand
obsolete and depreciated meters were replaced by new meters, with
electronic technology, allowing a more precise measurement, reducing the
susceptibility to the accomplishment of the energy theft in these equipment.
All these actions avoided the emission of 3,197.4 tCO2.
Scope 3
The Energy Efficiency Projects included in Cemig's Smart Energy Program
are relevant instruments for the reduction of indirect emissions of third
parties, by providing a reduction in the electric energy consumption of end
consumers by the replacement of obsolete electric equipment, with high
consumption levels, and environmental education initiatives. In 2016 these
projects avoided the emission of 738 tCO2e.
The incentivized projects implemented by Efficientia in 2016 prevented the
emission of 147.18 tCO2e/year in customers of the industrial and commercial
sectors. Efficientia is an Energy Services Company (ESCO), which acts in the
27
development and viability of technological solutions that promote the efficient
use of energy and the consequent reduction of greenhouse gas emissions in
the installations of medium and large-size customers, from commercial,
industrial and service sectors.
13. Exclusions
The inventory sought to account for all major sources of emissions from Scope 1
and Scope 2. The solid wastes (organic matter) and the effluents generated in the
operation, which are treated and destined by third parties, were not included in
Scope 3.
14. Recalculation
There was no need to recalculate previous years reported in the last inventories,
since Cemig did not present significant changes in its structure, capacity and
emission sources in 2016.
15. Uncertainties and quality of the report
Cemig has sought grounds on the best methodologies, references and tools for the
calculation of GHG emissions, publicly available, to guarantee an excellent quality of
the report and reduce as much as possible the level of uncertainty of this inventory.
In relation to the verified data, in opting for the centralized approach, Cemig
understands that it reduced the risk of duplication of calculations, estimates and
possible errors in formulas and calculations.
Another fundamental element to ensure the quality of its inventory is the fact that the
sources of information used are covered by the Company Management System,
which is based on ISO 9001 - Quality Management System, ISO 14001 -
Environmental Management System and OHSAS 18001 - Occupational Health and
Safety Management System, which guarantee processes and procedures oriented
to the quality, reliability and tracking of the information verified. Standards to ensure
critical analysis, treatment and management of information, as well as regulatory
requirements to ensure greater reliability in results, are described in the
28
Management Systems Manual and in the General Procedures, prepared and
approved at the corporate level. Finally, all data used, their sources and
methodology of collection and procedures, in order to guarantee the integrity of
information, were verified by an independent third party.
The uncertainty level of an inventory is given by errors introduced in the calculation
of these emissions, whether in the quantification of the activity of a source or by the
emission factor used. The activity of a source is the data that expresses the intensity
of that source. For example, the consumption of fossil fuel by the thermal power
plant or the fleet is an activity data of this source, and inaccuracies related to this
data increases the uncertainty percentage of the emission calculation of this source.
This inaccuracy is usually given by the sum of the inaccuracies of the equipment
that measures the activity of the source. In the case of fuel consumption, this
uncertainty is given by the uncertainty of the equipment that measures the quantity
in liters that was actually consumed and the burning efficiency of that fuel. Failures
in data collection are associated with the quality of the inventory, much more than
the uncertainty of the calculation.
Similarly, the imprecision in the emission factor of the fuel burning also increases
the uncertainty of the final calculation. The final uncertainty is predominantly
determined by the uncertainty of the activity and the uncertainty of the emission
factor.
In order to estimate the uncertainty of Cemig's GHG inventory, "GHG Protocol Short
Guidance for Calculating Measurement and Estimation Uncertainty for GHG
Emissions" was used, with an uncertainty level of +/- 4.7%.
It is understood that this calculation of uncertainty follows the recommendations of
the Guidance mentioned above, but it should be noted that it contains errors and
inaccuracies regarding the way in which it was carried out, i.e., it considers general
factors, not actual inaccuracies, which would be laborious and costly to do to obtain
a more accurate value. However, the data serves as a general indicator that the
inventory follows the good practices recommended by the GHG Protocol, resulting
in adherent information and with the quality expected by the methodology adopted.
29
16. Responsible for preparing this report
Companhia Energética de Minas Gerais - Cemig
Responsible: Superintendence of Corporate Sustainability
Technical support: Keyassociados Consultoria e Treinamento
Date: April, 2017
e-mail: [email protected]
Phone: +55 (31) 3506-2005
Address: Avenida Barbacena, 1200 - 13° andar, Ala A1,
Santo Agostinho - Belo Horizonte/MG - CEP 30.190-131
www.cemig.com.br/en-us
30
17. Annex 1 - Verification statement