Embed Size (px)
Citation preview
i
GREENHOUSE SANITATION: EFFICACY OF DISINFECTANTS ON CUTTING BLADES USING
TOBACCO MOSAIC VIRUS ON PETUNIA AS A MODEL
By
Amanda J. Hayes
A thesis submitted in partial fulfillment of the requirements for graduation with research distinction in the undergraduate College
of Food, Agriculture, and Environmental Sciences of The Ohio State University
The Ohio State University
2008
Project Advisor: Dr. Dennis J. Lewandowski, Department of Plant Pathology
i
THE OHIO STATE UNIVERSITY
ABSTRACT
GREENHOUSE SANITATION: EFFICACY OF DISINFECTANTS ON CUTTING BLADES USING TOBACCO MOSAIC VIRUS ON PETUNIA AS
A MODEL
By Amanda J. Hayes
Petunias (Petunia x hybrida) are one of the most popular ornamental crops in the United States. In the early 1990’s, the introduction of asexually propagated petunias into the landscape market was associated with increased reports of virus infections, including Tobacco mosaic virus (TMV), which is transmitted mechanically. In greenhouses, TMV can be transferred to cutting tools, subsequently infecting healthy stock plants and cuttings. An outbreak of TMV in a greenhouse can quickly spread and devastate entire crops, rendering them unsalable. During vegetative propagation, multiple cuttings are taken from one mother stock plant and multiple stock plants are commonly used. Tool disinfection is critical in preventing the spread of pathogens during this process. At this time, there is no disinfectant that is labeled for greenhouse use against plant viruses with a reasonable contact time.
Commercially available disinfectants and other materials were tested at varying concentrations and contact times to determine the most effective treatments to reproducibly prevent transmission of TMV to healthy plants. Two cultivars of petunia plantlets were tested with eight treatments by dipping razor blades in TMV-contaminated plant sap, then the disinfectant, then making a cut on a healthy plant. Post-inoculation, the petunias were sampled and tested for TMV by double-antibody sandwich enzyme-linked immunosorbent assay (DAS-ELISA). Based on these results, the four most effective treatments were used in a trial to more closely simulate vegetative propagation.
All treatments tested reduced incidence of TMV infection from contaminated razor blades. The most effective one-minute disinfectant treatments in these studies were: 20% non-fat dry milk, 20% non-fat dry milk plus surfactant, 1:10 household bleach, and 1% Virkon®S.
ii
Acknowledgments
A word of appreciation is extended to my research advisor Dr. Dennis Lewandowski, my professor
and friend Dr. Landon Rhodes, and my academic advisor Dr. Mike Boehm.
This research was funded in part by an Ohio Agricultural Research and Development Center
(OARDC) SEEDS grant, an OSU Honors and Scholars Research Grant, and the USDA Floriculture
and Nursery Research Initiative. Gratitude is also expressed to EuroAmerican Propagators for plant
material, and to Dümmen USA and Timbuk II Farms for providing quality petunias for the bulk of
these experiments.
Thanks also to Debra Bermann and the Brazil Research Exchange program; Alyssa Kriss (the
Statistician); Mike Kelly (the Grinder); David Snodgrass (the Sprayer); Carola de la Torre Cuba, Jessica
Schafer, and Chris Woltjen for support, help, advice, and friendship; Jim Gibson and Stacy Decker at
Timbuk Farms; Dr. P. Allen Hammer at Dümmen USA/Red Fox; and Bart Hayes at OSU
Horticulture and Crop Science and at home.
iii
TABLE OF CONTENTS
List of Tables ...................................................................................................................... iv List of Figures.......................................................................................................................v Introduction..........................................................................................................................1 Objective, Phase I................................................................................................................6 Materials and Methods, Phase I ........................................................................................6 Plant Material and Crop Records.............................................................................................6 Inoculum and Blade Contamination .........................................................................................7 Plant Rating and Data Analysis .............................................................................................8 Results, Phase I ....................................................................................................................9 Objective, Phase II ........................................................................................................... 10 Materials and Methods, Phase II ................................................................................... 10 Plant Material and Crop Records.......................................................................................... 10 Inoculum and Blade Contamination ...................................................................................... 11 Plant Rating and Data Analysis .......................................................................................... 11 Results, Phase II................................................................................................................ 12 Discussion .......................................................................................................................... 13 Tables .................................................................................................................................. 16 Figures................................................................................................................................. 24 Bibliography....................................................................................................................... 31
iv
LIST OF TABLES
Table 1. Treatments Used for Disinfection. ..................................................................... 16 Table 2. Chemical dilutions for Phase I and II experiments. ........................................ 17 Table 3. Julian dates for Phase I and II experiments ...................................................... 18 Table 4. Phase I overall analysis of variance..................................................................... 19 Table 5. Phase I incidence of TMV infection of petunia liners cut with TMV-contaminated razor blades treated with a disinfectant prior to cutting each healthy liner...................................................................................................... 20 Table 6. DAS-ELISA results for plants used for Inoculum, Phase II......................... 21 Table 7. Phase II overall analysis of variance ................................................................... 22 Table 8. Phase II incidence of TMV infection of Petunia x hybrida ‘Sweetunia® Blue Sky’ plants cut with a TMV-contaminated razor Blade treated with disinfectant prior to cutting each healthy plant.............................. 23
v
LIST OF FIGURES
1. TMV symptoms on two cultivars of Petunia x hybrida 24
2. Percent infected plants in Preliminary Study 1. 25
3. Percent infected plants in Preliminary Study 2. 26
4. Bleach vs. positive control plants in Preliminary Study I 27
5. Non-fat dry milk vs. positive control plants in Preliminary Study I 27
6. Tri-sodium phosphate vs. positive control plants in Preliminary Study I 27
7. Plant arrangement in Phase I to prevent plants from touching. 28
8. Liner tray map of plants, Phase I. 28
9. Plant arrangement in the greenhouse, Phase I 29
10. Binder clip with razor blades aligned for contamination with TMV, Phase I 30
11. Bound razor blades in sap from TMV-infected petunia, Phase I 30
1
INTRODUCTION
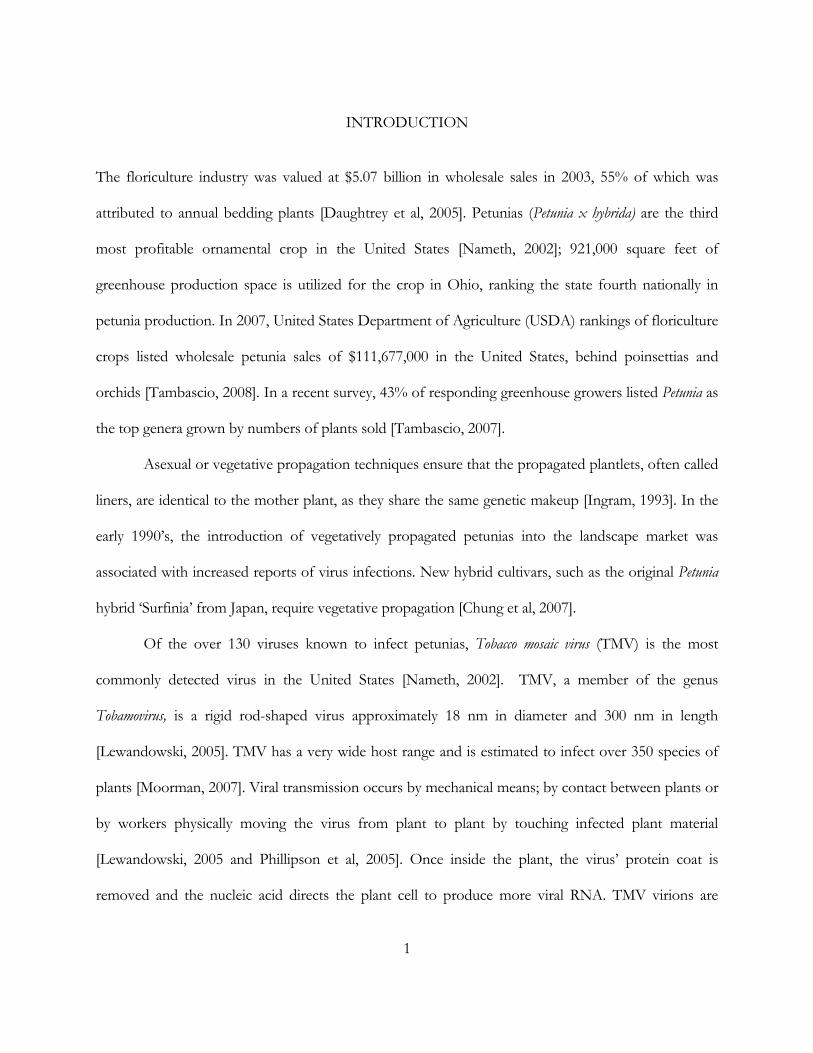
The floriculture industry was valued at $5.07 billion in wholesale sales in 2003, 55% of which was
attributed to annual bedding plants [Daughtrey et al, 2005]. Petunias (Petunia x hybrida) are the third
most profitable ornamental crop in the United States [Nameth, 2002]; 921,000 square feet of
greenhouse production space is utilized for the crop in Ohio, ranking the state fourth nationally in
petunia production. In 2007, United States Department of Agriculture (USDA) rankings of floriculture
crops listed wholesale petunia sales of $111,677,000 in the United States, behind poinsettias and
orchids [Tambascio, 2008]. In a recent survey, 43% of responding greenhouse growers listed Petunia as
the top genera grown by numbers of plants sold [Tambascio, 2007].
Asexual or vegetative propagation techniques ensure that the propagated plantlets, often called
liners, are identical to the mother plant, as they share the same genetic makeup [Ingram, 1993]. In the
early 1990’s, the introduction of vegetatively propagated petunias into the landscape market was
associated with increased reports of virus infections. New hybrid cultivars, such as the original Petunia
hybrid ‘Surfinia’ from Japan, require vegetative propagation [Chung et al, 2007].
Of the over 130 viruses known to infect petunias, Tobacco mosaic virus (TMV) is the most
commonly detected virus in the United States [Nameth, 2002]. TMV, a member of the genus
Tobamovirus, is a rigid rod-shaped virus approximately 18 nm in diameter and 300 nm in length
[Lewandowski, 2005]. TMV has a very wide host range and is estimated to infect over 350 species of
plants [Moorman, 2007]. Viral transmission occurs by mechanical means; by contact between plants or
by workers physically moving the virus from plant to plant by touching infected plant material
[Lewandowski, 2005 and Phillipson et al, 2005]. Once inside the plant, the virus’ protein coat is
removed and the nucleic acid directs the plant cell to produce more viral RNA. TMV virions are
2
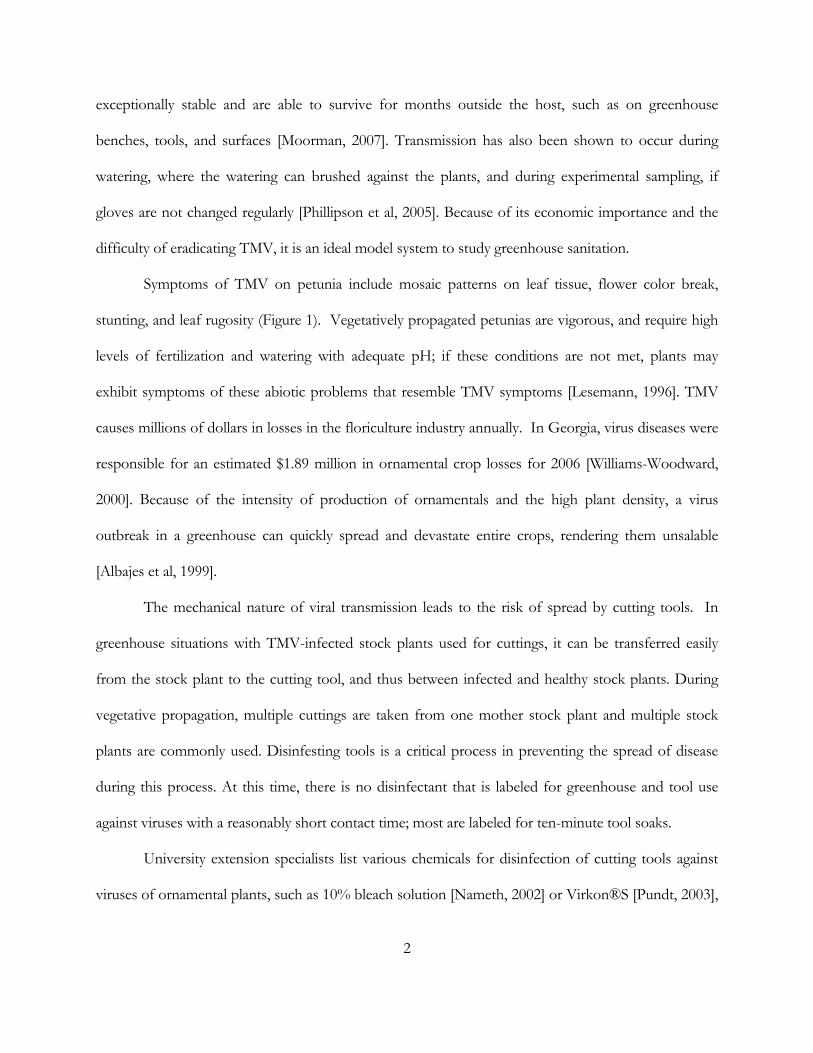
exceptionally stable and are able to survive for months outside the host, such as on greenhouse
benches, tools, and surfaces [Moorman, 2007]. Transmission has also been shown to occur during
watering, where the watering can brushed against the plants, and during experimental sampling, if
gloves are not changed regularly [Phillipson et al, 2005]. Because of its economic importance and the
difficulty of eradicating TMV, it is an ideal model system to study greenhouse sanitation.
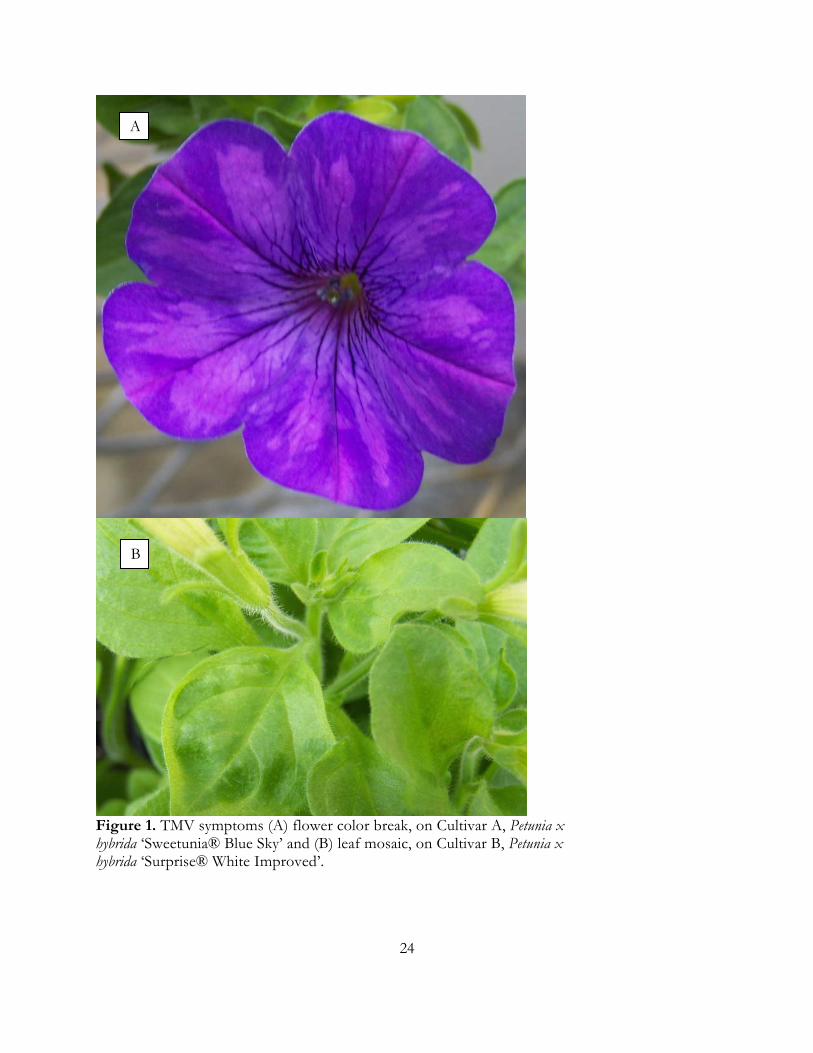
Symptoms of TMV on petunia include mosaic patterns on leaf tissue, flower color break,
stunting, and leaf rugosity (Figure 1). Vegetatively propagated petunias are vigorous, and require high
levels of fertilization and watering with adequate pH; if these conditions are not met, plants may
exhibit symptoms of these abiotic problems that resemble TMV symptoms [Lesemann, 1996]. TMV
causes millions of dollars in losses in the floriculture industry annually. In Georgia, virus diseases were
responsible for an estimated $1.89 million in ornamental crop losses for 2006 [Williams-Woodward,
2000]. Because of the intensity of production of ornamentals and the high plant density, a virus
outbreak in a greenhouse can quickly spread and devastate entire crops, rendering them unsalable
[Albajes et al, 1999].
The mechanical nature of viral transmission leads to the risk of spread by cutting tools. In
greenhouse situations with TMV-infected stock plants used for cuttings, it can be transferred easily
from the stock plant to the cutting tool, and thus between infected and healthy stock plants. During
vegetative propagation, multiple cuttings are taken from one mother stock plant and multiple stock
plants are commonly used. Disinfesting tools is a critical process in preventing the spread of disease
during this process. At this time, there is no disinfectant that is labeled for greenhouse and tool use
against viruses with a reasonably short contact time; most are labeled for ten-minute tool soaks.
University extension specialists list various chemicals for disinfection of cutting tools against
viruses of ornamental plants, such as 10% bleach solution [Nameth, 2002] or Virkon®S [Pundt, 2003],
3
but for varying lengths of time; and recommend various chemicals for hand sanitization, such as tri-
sodium phosphate (TSP) or milk [Albajes et al, 1999 and Pundt, 2003].
Nester et al. [1995] list the ideal germicidal chemical selection factors as level of toxicity to
humans, activity in presence of organic matter, compatibility with the material being treated, presence
and toxicity of residues, cost and availability, storage and stability, and environmental risk. If used
when plants are present, greenhouse disinfectants should not cause phytotoxicity. The disinfectant
should also be broad spectrum, and be effective against a wide range of plant pathogens. This research
focused on controlling an important virus disease; however, efficacy against bacterial and fungal
pathogens should also be considered. The ideal disinfectant would reproducibly prevent the spread of
TMV from tools to healthy plants with a short contact time—ideally no more than one minute. This
would enable greenhouse growers to soak one tool while another is being used, minimizing downtime
spent waiting for tool sanitation. There is a lack of comprehensive, independent, replicated studies to
determine which of the commercially available disinfectants or other treatments are most effective to
minimize the spread of plant viruses, and what methods should be used to get the best results from
those disinfectants.
The most widely used greenhouse disinfectants include those produced from quaternary
ammonium chloride salts, hydrogen dioxides, chlorine bleach, and 70% alcohol [Smith, 2007].
Alcohol, although effective and fast-acting, is not practical in a greenhouse situation due to its
flammability.
Quaternary ammonium salts are non-toxic enough that they are often used on food
preparation surfaces. They are inactivated by anionic soap or detergents, and are a positively charged
(cationic) detergent. These chemicals reduce the surface tension of liquids and help wash away dirt,
enabling microorganisms to be physically removed. Because of their positive charge, they are attracted
to cell surfaces, and are known to destroy bacteria and enveloped viruses by coagulation and
4
denaturation of proteins [Nester et al, 1995]. In addition, the compound’s activity decreases when
mixed with hard water or organic material [Jeffrey, 1995].
The peroxygen compounds are readily biodegradable and less toxic than traditional
alternatives. However, their spectrum of activity is limited; the common enzyme catalase degrades the
compound into water and oxygen. The presence of this oxygen inhibits the growth of anaerobic
organisms [Nester et al, 1995]. Peroxygen compounds are considered, at certain concentrations, to be
bactericidal and virucidal, though non-enveloped viruses may be resistant [Dvorak, 2005]. Experiments
have shown Virkon®S, the chemical used in this experiment, to be effective to some degree against
bacterial and fungal plant pathogens [Howard et al, 2007]. In addition, the compound has a short half-
life and degrades quickly once diluted with water.
Disinfectants produced from halogens are inexpensive and readily available. Chlorine destroys
all types of microorganisms and viruses, but is irritating to the skin and corrosive to tools. Organic
matter and impurities can neutralize chlorine’s activity by consuming free ions, necessitating a rinse
prior to use if excessive plant material is present on the cutting tool. In addition, working solutions
have a short half-life (two hours) and are light sensitive [17]. Chlorine compounds are electronegative;
they function through denaturing pathogen proteins [Nester et al, 1995]. Sodium hypochlorite has
been shown to negate fungal spores’ viability on greenhouse surfaces, such as plastic, wood, and metal
[Copes et al, 1996].
Milk has been shown to control some powdery mildew fungi, and is especially popular in
organic agriculture [Bettiol, 1999], and skimmed milk contains proteins which encapsulate plant
virions, preventing transmission [Albajes et al, 1999]. In addition, industry professionals often
recommend the use of a solution of non-fat dry milk (NFDM) after hand washing to prevent plant
virus transmission, or as a spray for transplants to prevent transmission from hand to plant [Henn,
2004 and Seebold, 2008]. Tri-sodium phosphate (TSP) has been used for years, usually as a hand-
5
washing agent for workers to prevent the spread of plant viruses. In a study where TSP was mixed
with sap from TMV-infected plants and then rubbed on an indicator plant, 5%, 10%, and 20% TSP
inactivated the virions after five minutes [Brock, 1952]. These results, combined with the prevalence of
tri-sodium phosphate use within the floriculture industry, necessitated its inclusion in this study; an
industry recommended 3% TSP solution (various manufacturers) was utilized for these studies.
In Florida, tool sterilization has been tested against Hibiscus latent Fort Pierce virus (HLFPV), a
Tobamovirus infecting hibiscus. In this study, Kamenova et al. [2004] found that a one-minute contact
time with 10% Sodium hypochlorite (swimming pool chlorine) or 20% NFDM prevented virus
transmission to healthy plants.
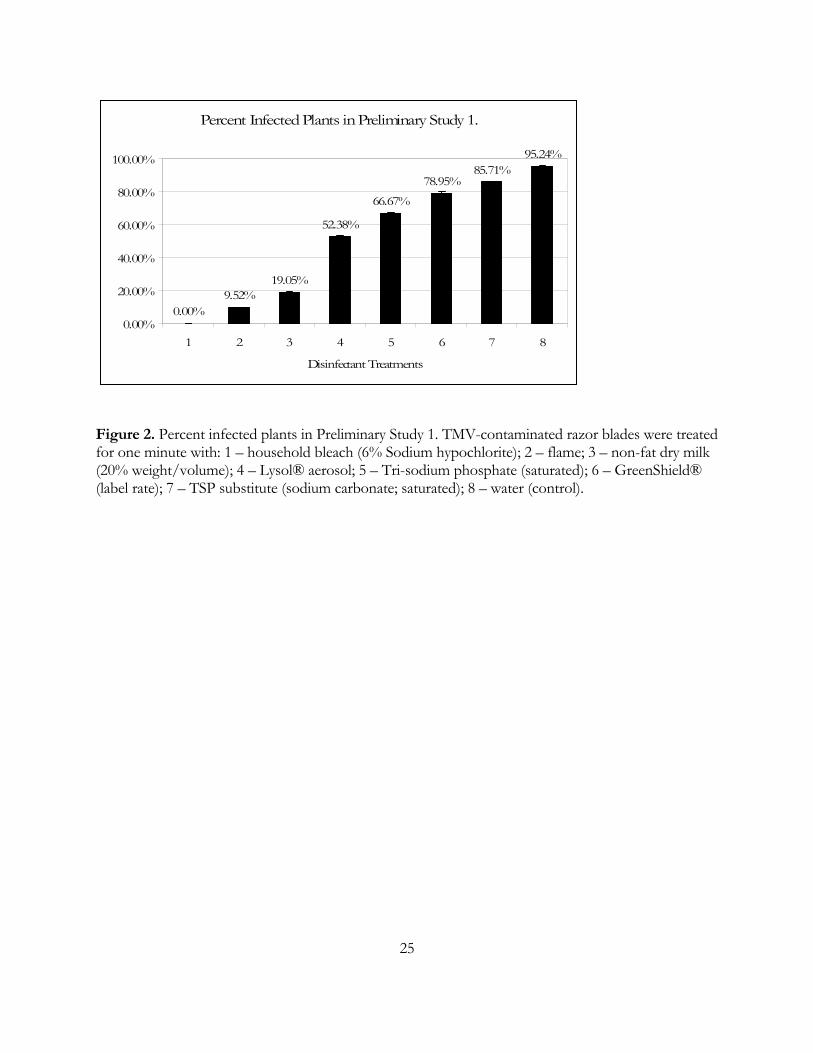
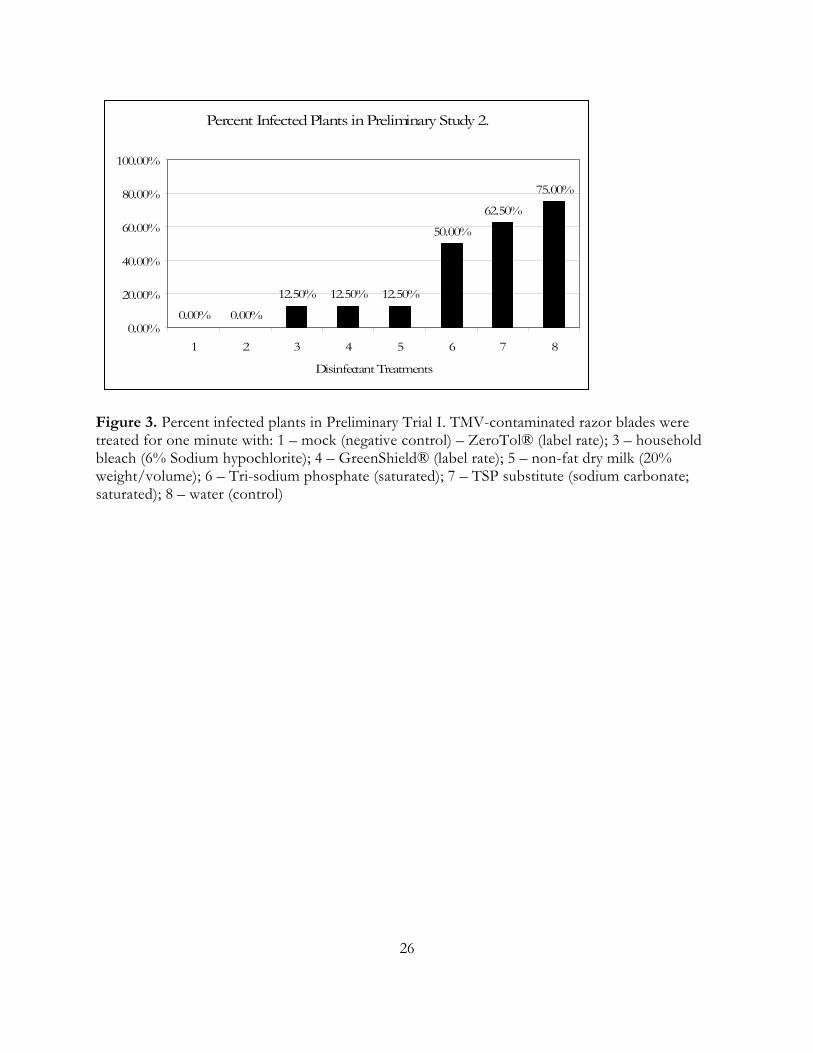
In a preliminary study conducted summer, 2007, small numbers of petunias (19-21 in Study I;
8 in Study II) were utilized in two separate tests. From these trials, it was determined that ZeroTol®,
bleach, and NFDM were the most effective disinfectants tested, and saturated TSP was one of the
least effective (Figures 2-6). GreenShield®, a popular industry quaternary ammonium salt-based
product was not effective at a one-minute soaking time. This necessitated changes in concentration or
contact time in an attempt to improve efficacy of GreenShield® and TSP. In addition, a surfactant was
mixed with NFDM in an attempt to provide better contact between the tools and the disinfectant.
6
OBJECTIVE, PHASE I
Screening of Disinfectant Treatments against TMV
During this phase of experimentation, the objective was to identify the most effective
treatments for reducing transmission of TMV from contaminated cutting tool to healthy plants. The
disinfectants were tested at one minute (except GreenShield® at label concentration, which, due to its
limited efficacy in preliminary screenings, was tested at three minutes), and the razor blades were
rinsed prior to disinfection.
MATERIALS AND METHODS, PHASE I
Plant Material and Crop Records
Unrooted cuttings of two susceptible petunia cultivars were utilized: Petunia x hybrida
‘Sweetunia® Blue Sky’ (Cultivar A) and P. x hybrida ‘Surprise® White Improved’ (Cultivar B) were
donated by Dümmen USA and rooted at Timbuk II Farms in Granville, Ohio. The six-week-old liners
were delivered to The Ohio State University on a biweekly schedule. Groups of six plants (biological
replicate) were arranged in 102-cell liner trays (17 x 6) [figures 7 and 8]. Trays were labeled with block
number, cultivar, and start date with permanent marker on tray edge. Biological replicates were then
randomly selected and subjected to one of the ten treatments including positive (water) and negative
(no virus) controls. Each treatment was replicated five times per trial, with two trials per cultivar. The
first plant in each biological replicate was tagged with treatment number, block number, and cultivar.
Plants were placed in the greenhouse on an isolated bench (Figure 9) and fertilized periodically
with 300 parts per million (ppm) 20-10-20 fertilizers (Peters Professional® General Purpose™, The
Scotts Company, USA). Plants were watered from overhead using either hand watering or an
7
automatic sprinkler system as needed. Soil temperatures in the greenhouse ranged from 17.1° C to
30.2° C and air temperatures ranged from 17.9° C to 33.5° C; relative humidity ranged from 56.8% to
82.0%. Blue sticky cards for insect population monitoring and trapping were placed among the canopy
and checked weekly; insecticides were sprayed as needed to maintain low insect populations in the
greenhouse.
Inoculum and Blade Contamination
Symptomatic leaf tissue from TMV-infected petunias was tested for TMV infection with an
ImmunoStrip® (Agdia, Inc., Elkhart, Indiana, USA) immediately prior to use and 5 g tissue was
ground with a mortar and pestle in 35 mL de-ionized water for inoculum. Thirty (30) mL of inoculum
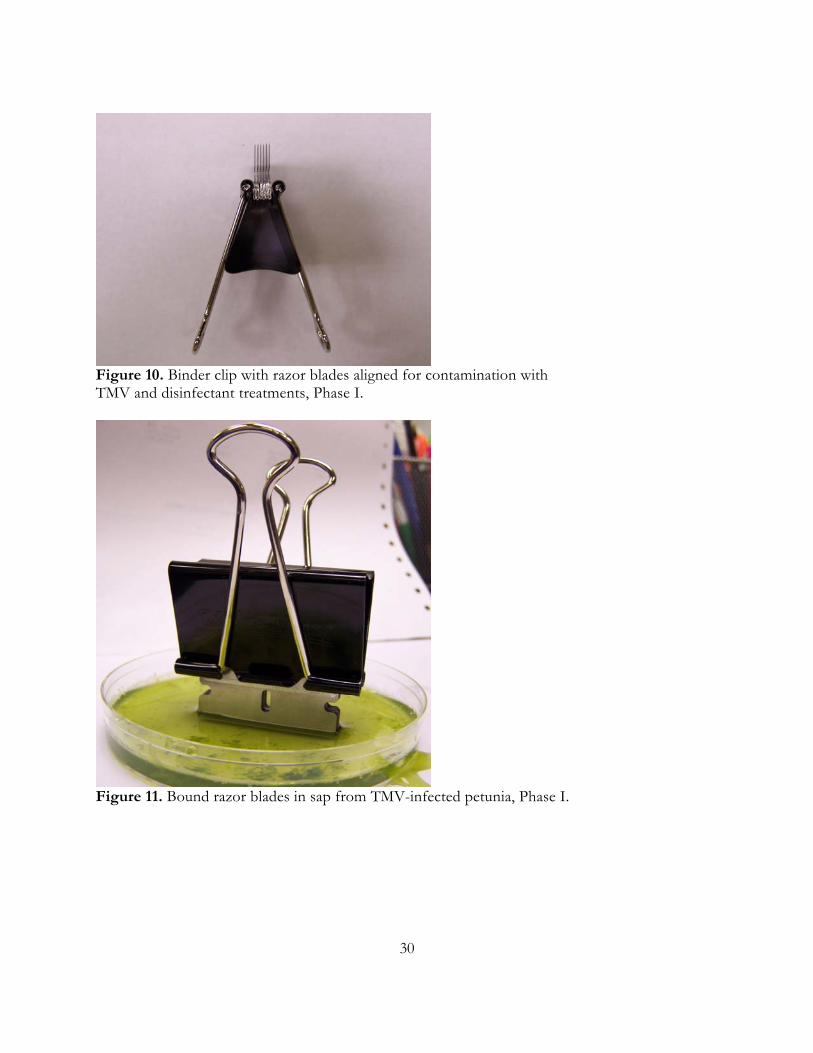
was transferred to a 100 x 15 mm plastic, disposable Petri dish. Six single-edged surgical carbon-steel
razor blades (1.5L x 0.75W in., 0.12 in. thick, ASR Co., USA) were bound together with a 2” binder
clip (Figure 10). Chemical treatments (Table 1) were mixed (Table 2) with de-ionized water
immediately prior to initiating each trial. 20 mL of each mixture was dispensed into five 60 x 15 mm
plastic, disposable Petri dishes. The bound groups of blades were dipped into the inoculum for 30
seconds by standing the blades on end in the Petri dish (Figure 11). The group was then blotted on a
clean paper towel by gently touching the corner of the group opposite where the cut was to be made;
this removed excess sap prior to rinsing. The group was then briefly rinsed in 25 mL clean de-ionized
water in a 60 x 15 mm Petri dish to remove excess plant material. The blade groups were soaked in the
chemical treatment for one minute (with the exception of GreenShield® at label concentration, which
was soaked for three minutes). The blades were unclipped onto a clean paper towel, and each used to
make a single cut on a single petunia liner. The positive control consisted of plants cut with blades
dipped in infected sap, rinsed, and then soaked in water for one minute. Negative controls consisted of
plants cut with clean, uncontaminated razor blades.
8
Plant rating and data analysis
The first symptoms appeared as flower color break on cultivar A at 34 days post-treatment,
and appeared on additional new plants through day 98 post-treatment. On cultivar B, a white cultivar,
symptoms appeared as leaf mosaic on new, expanding leaves at day 61 post-treatment and appeared
on additional plants until day 102 post-treatment. Plants of different biological replicates were
prevented from touching one another for the course of the experiment (Figures 7, 9).
At 55 days post-treatment (cultivar A) and 60 days post-treatment (cultivar B), the newest fully
expanded flower and associated terminal bud of each plant were sampled by cutting with a sterile
blade. If present, symptomatic tissue was sampled. Tissue from each asymptomatic plant as well as one
symptomatic plant per block was sampled. Symptomatic plants that were not sampled were rated as
infected. Tissue was ground with 3 mL General Extraction Buffer (Agdia, Inc.) for DAS-ELISA
according to supplier’s protocols.
All asymptomatic plants, (DAS-ELISA negative and positive), were potted into 3” square pots
at day 62 (Cultivar A and B week 13 tested with DAS-ELISA) and day 69-71 (Cultivar A and B week
15 tested with DAS-ELISA) post-treatment. DAS-ELISA positive, asymptomatic plants were placed
together in a pot shuttle apart from DAS-ELISA negative, asymptomatic plants. The DAS-ELISA
positive group was monitored every 2-3 days for symptoms. Once symptoms had appeared on all but
one plant (a Cultivar B), the plants were rated again for symptoms and arbitrarily sampled and tested
by DAS-ELISA (Table 3).
Percent incidence was calculated for each biological replicate from the number of symptomatic
plus ELISA positive asymptomatic plants divided by the total number of plants and multiplied by 100.
9
Data were analyzed using SAS 9.1.3 (SAS Institute Inc., Cary, NC). Analysis of variance was
conducted to determine statistical significance of block, cultivar, treatment, and date using square root
transformed data. Means were separated using Fisher’s LSD at P=0.05.
RESULTS, PHASE I
Experiments were conducted with two cultivars and on two different dates to determine if
there were any effects that might be due to cultivar and/or environmental conditions that differed
throughout the season. Phase I data (week 13 and 15 plants) were analyzed to determine if there were
any significant effects due to block, cultivar, date and treatment, and whether there were interactions
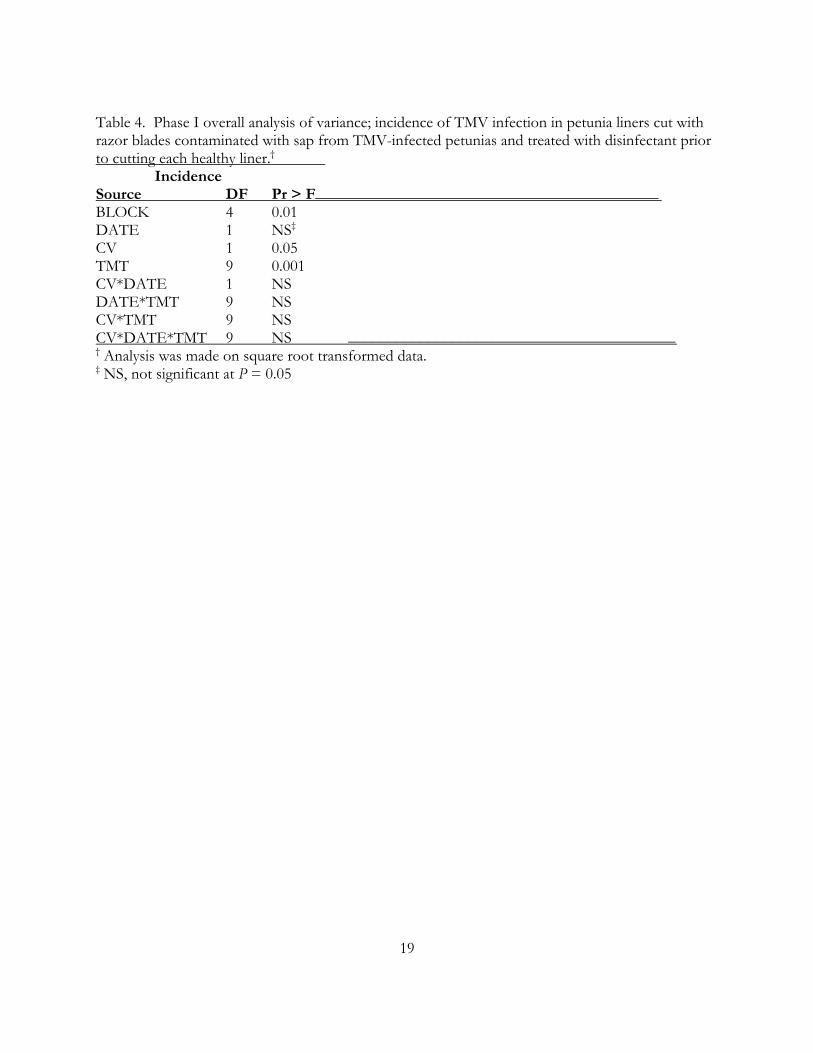
between cultivar, date, and treatment. There were significant effects due to block (P=0.01), cultivar
(P=0.05) and treatment (P<0.001) (Table 4). However, there were no significant interactions between
cultivar, date and treatment (Table 4).
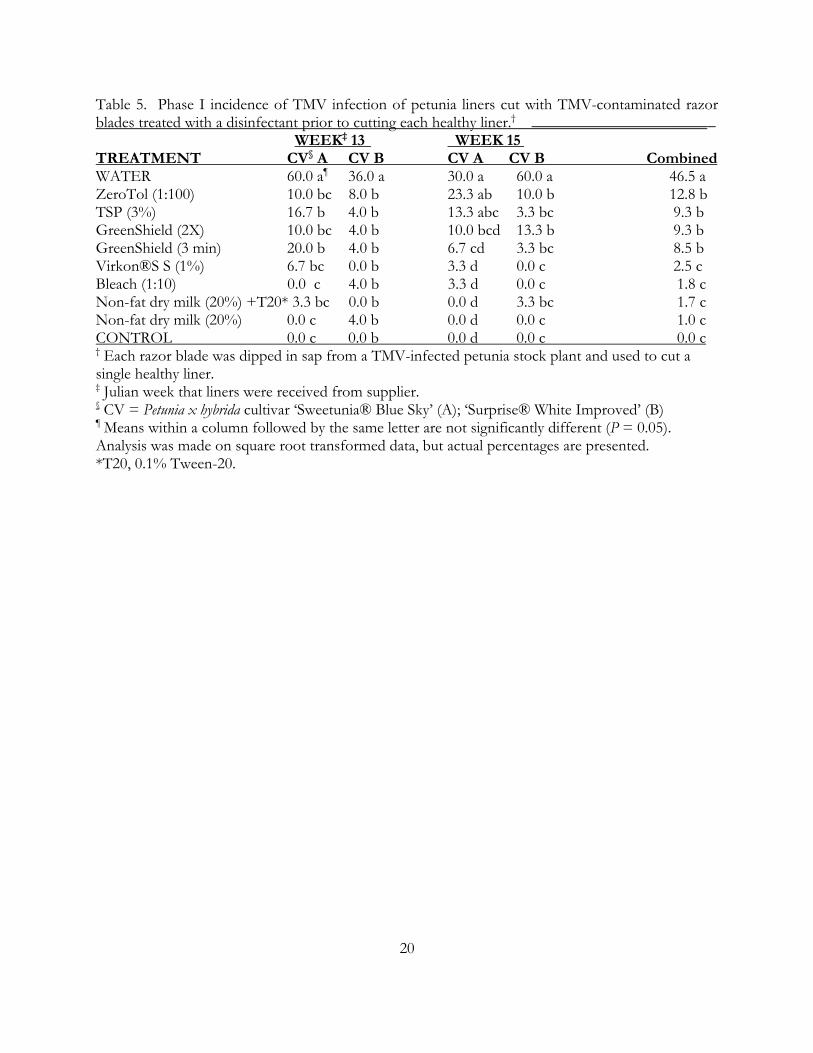
Other than ZeroTol and TSP in week 15, cultivar A, all treatments significantly reduced the
incidence of TMV infection at both dates and cultivars (Table 5). When experiments were combined,
all treatments were found to have significantly reduced the incidence of TMV infection. The most
effective treatments were NFDM, NFDM with Tween-20®, Virkon®S, and bleach, which were
significantly different than the other four treatments (Table 5). Thus, NFDM, NFDM with Tween-
20®, Virkon®S, and bleach were chosen for Phase II.
10
OBJECTIVE, PHASE II
Simulated Propagation
The goal of this phase of experimentation is to closely simulate the vegetative propagation
process which is commonly used to commercially produce petunias for the floriculture industry.
Each razor blade was contaminated by making a single cut on a TMV-infected petunia stem,
simulating the process of taking a cutting for propagation. In contrast to Phase I tests, the rinse
step was eliminated to more closely replicate grower practices. Each blade was then placed into
the disinfectant treatment for one minute.
Plants used for Phase II were older than in Phase I, and had been potted in 3” pots and heavily
fertilized to maintain vegetative, healthy growth.
MATERIALS AND METHODS, PHASE II
Plant Material and Crop Records
Sixteen-week-old petunias in 3” pots (potted at nine weeks) of cultivar A (‘Sweetunia® Blue
Sky’) were utilized. Groups of ten plants (biological replicate) were tested for each of the four most
effective disinfectant treatments from Phase I (Table 5), plus positive (water) and negative (no virus)
controls. Each treatment was replicated five times per trial, with two trials performed on liners
received Julian week 17 and Julian week 19.
Plants were maintained in the greenhouse and fertilized periodically with 300 parts per million
(ppm) 20-10-20 fertilizers (Peters Professional® General Purpose™, The Scotts Company, USA);
overhead irrigation was used. Soil temperatures in the greenhouse ranged from 17.1°C to 33.3°C and
air temperatures ranged from 19.3°C to 36.7°C; relative humidity ranged from 60.2% to 82.0%.
Insecticides were sprayed as needed to maintain low insect populations in the greenhouse.
11
Inoculum and Blade Contamination
Twelve symptomatic, TMV-infected petunia stock plants (cultivar A) were utilized for
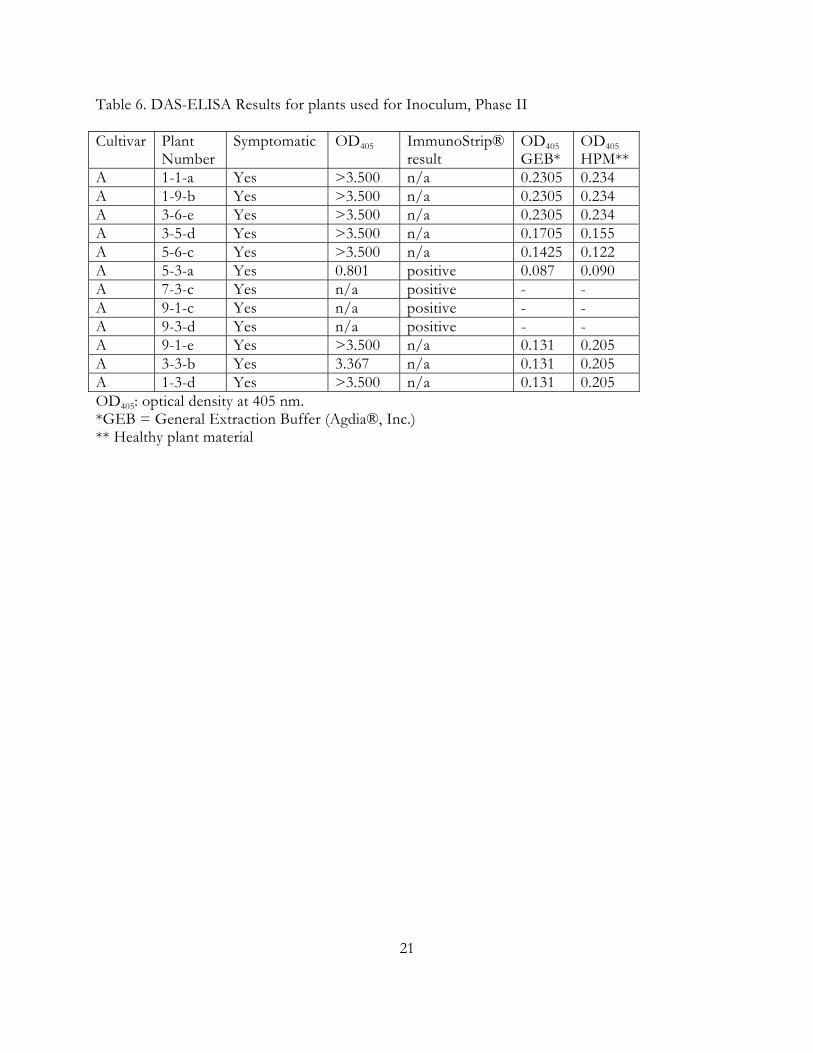
inoculum for this phase. Eight of these twelve had previously tested positive for TMV infection with
DAS-ELISA, OD405 >3.367; the other four plants were tested for TMV infection with a TMV
ImmunoStrip® (Agdia, Inc.) immediately prior to use (Table 6). Flower shoots with terminal
symptomatic flowers were arbitrarily removed from the plants (1-2 per plant); with an average shoot
length of 8”. Each shoot was used to contaminate single-edged razor blades by cutting through the
stem tissue. Each blade was used to make a single cut on one stem of a shoot, then soaked in the
disinfectant treatment for one minute and finally used to make a single cut on the main stem of a
potted petunia. All chemical dilutions were prepared fresh with de-ionized water immediately before
use. Positive controls consisted of plants cut with blades contaminated as above and then soaked in
water for one minute. Negative controls consisted of plants cut with clean, uncontaminated razor
blades.
Plant Rating and Data Analysis
Symptoms began appearing as flower color break as early as 12 days post-treatment, and
continued appearing through day 62 post-treatment. Symptomatic plants were rated as TMV-positive,
and asymptomatic plants were rated as TMV-negative. At 61-62 days post trial, the newest fully
expanded flower and associated terminal bud was harvested from a random sampling of plants by
cutting with a sterile blade (one out of every 10 plants). If present, symptomatic tissue was sampled.
Tissue was ground with 3 mL General Extraction Buffer (Agdia, Inc.) for DAS-ELISA.
Percent incidence was calculated for each biological replicate from the number of symptomatic
plants divided by the total number of plants and multiplied by 100. All symptomatic, tested plants were
confirmed to be infected with TMV based on DAS-ELISA. All asymptomatic plants were found to be
12
TMV-negative based on DAS-ELISA. Data were analyzed using SAS 9.1.3 (SAS Institute Inc., Cary,
NC). Analysis of variance was conducted to determine statistical significance of block, treatment, and
date. Means were separated using Fisher’s LSD at P=0.05.
RESULTS, PHASE II
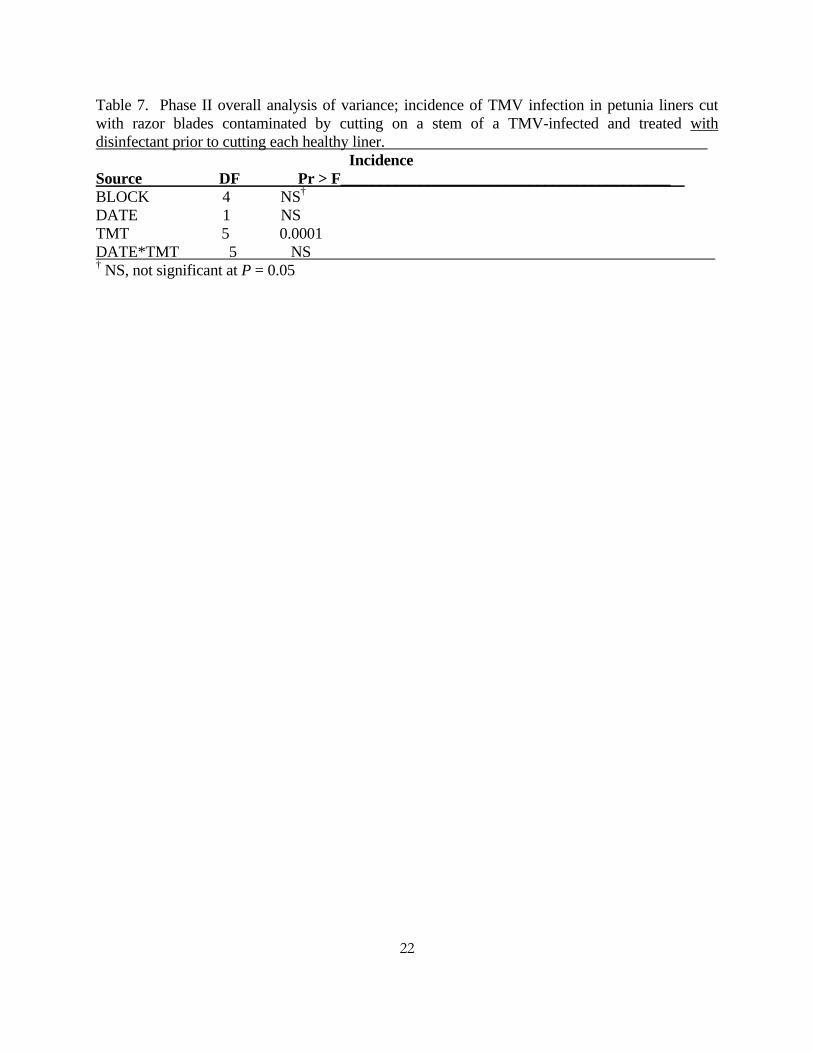
Phase II TMV-incidence data (week 17 and 19 plants) were analyzed to determine if there
were any significant effects due to block, date, and treatment, and whether there were interactions
between date and treatment. There was a significant effect of treatment (P<0.001); however, there
was no significant effect of date or interaction between date and treatment (Table 7). Data were
analyzed by date and combined (Table 7).
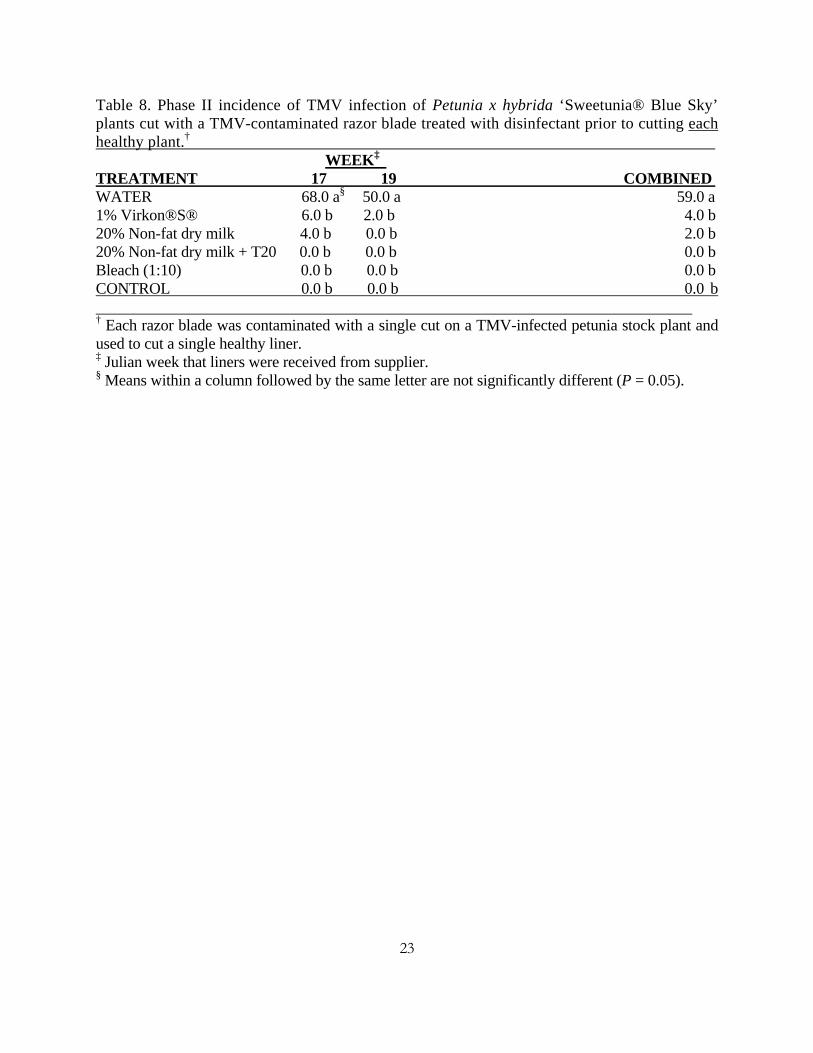
All four treatments significantly reduced the incidence of TMV infection (Table 8). There
was zero incidence of TMV infection for two treatments (NFDM with Tween-20® and bleach).
13
DISCUSSION
The two Petunia x hybrida cultivars used for these experiments (‘Sweetunia® Blue Sky’ and
‘Surprise® White Improved’) showed different symptoms as a result of TMV infection.
‘Sweetunia® Blue Sky’ displayed a characteristic and easily recognizable flower color break as early
as day 36 of the Phase I experiments, and as early as day 26 of the Phase II experiments.
‘Surprise® White Improved’ displayed a primary symptom of leaf mosaic, which began day 88 for
Phase I. Because of the long delay in symptoms on ‘Surprise® White Improved’, it was not used
for Phase II experiments. The reliability and ease of recognition of the flower color break
symptom on ‘Sweetunia® Blue Sky’ make it an ideal model for TMV.
Because the plants remained in liner trays for an extended period in Phase I, they were
difficult to maintain. Their root systems quickly became pot-bound, and they required frequent
watering to prevent the root mass from drying out. In addition, their nutrient needs could not
easily be met, and they were susceptible to Botrytis cinerea infections. Daily, crop residue and dying
plant material had to be carefully removed with sterile forceps to prevent botrytis stem rot. In
light of these difficulties, potted plants were used for Phase II experiments. However, these
provided challenges, as well. The plants quickly overgrew their space, and more space was needed
to prevent the plants from touching.
The addition of a surfactant (0.1% Tween-20®) to NFDM had no significant effect on the
percentage of infected plants. Milk is safe for workers, plants, equipment, and beneficial insects,
and can be used by certified organic and sustainable operations. In addition, it causes no runoff or
greenhouse re-entry problems and waste disposal is not an issue. Because of these factors and its
excellent performance in these trials, further research into elucidating a mechanism may be
warranted. NFDM, both with and without Tween-20®, was utilized in Phase II experiments.
14
Bleach, although effective in this trial, caused severe corrosion of the razor blades. After
the one-minute soak in a 1:10 bleach solution (0.6% NaOCl), the blades were speckled with rust.
In a greenhouse setting where expensive pruning shears or blades are used repeatedly for many
seasons, this corrosion may prove undesirable for growers. Also, when diluted, bleach has a short
half-life which may prove impractical for growers, as they would need to replace the solution
periodically throughout the day. Despite the detrimental effects (corrosion) on the blades, bleach
was one of the most effective treatments to reduce TMV transmission, and was thus included in
Phase II experiments.
ZeroTol® and Virkon®S are both oxidizing agents. However, Virkon®S was significantly
more effective at reducing incidence of TMV infection than ZeroTol®, possibly due to the
instability of ZeroTol® in the presence of organic matter. In this experiment, ZeroTol® was
mixed prior to use; an estimated one hour lapsed between mixing and completion of use.
Because Virkon®S significantly reduced TMV transmission, it was subsequently included in Phase
II experiments.
The incidence of TMV infection in plants cut with TMV-contaminated blades treated with
GreenShield® at label rate were not significantly different at three minutes than blades treated
with GreenShield® at double the label rate for one minute. The GreenShield® label recommends
a ten-minute soak for tools, which was not tested. Neither GreenShield® treatment was tested in
Phase II.
In preliminary tests, saturated TSP (~20%) was not as effective at reducing TMV
transmission in Petunia as it was for a Tobamovirus in a woody host [Kamenova et al, 2004]. The
TSP concentration was reduced to 3% per discussions with industry representatives. 3% TSP
significantly reduced the incidence of TMV infection, but was not among the most effective
treatments. Therefore, TSP was not included in Phase II.
15
These studies demonstrate a robust system to test various disinfectant treatments for
treating virus-contaminated cutting tools. Using these methods, we were able to show that some
treatments were significantly more effective than others. Although these studies were conducted
with one host-virus combination, the method could easily be adapted to other pathogens and
hosts. The four treatments tested in Phase II were not statistically significant from one another.
However, greenhouse growers have a zero tolerance policy for virus transmission during
propagation, so even the two and four percent transmission rates for Virkon®S and 20% NFDM
would be unacceptable for growers. Of the two treatments which provided zero percent incidence
of transmission, bleach is corrosive to cutting tools, and thus non-fat dry milk is the preferred
treatment. The method by which milk is able to prevent transmission is unknown; this warrants
further study. The effect of different surfactants or surfactant concentrations also merits further
exploration.
16
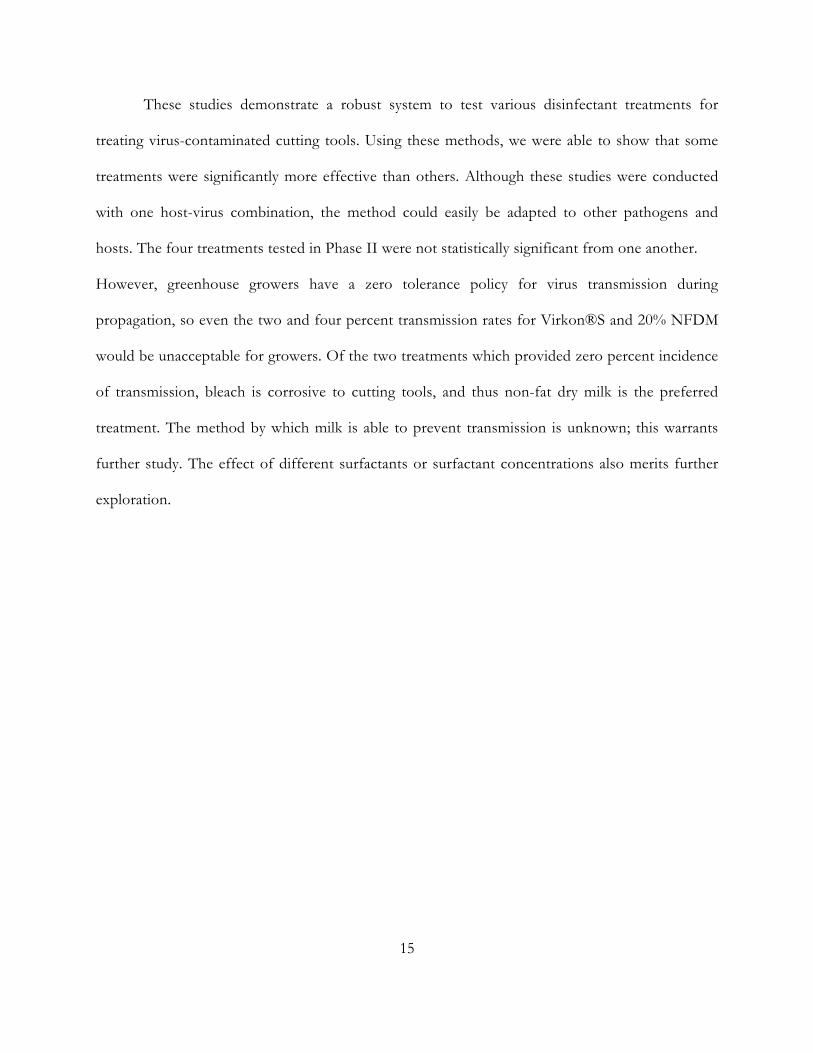
Table 1. Treatments Used for Disinfection. Treatment Manufacturer Chemical Class Contact
Time(min) Concentration
*De-ionized Water - - 1 - *Bleach The Clorox Company,
USA Halogen 1 0.6%
Tri-sodium phosphate (TSP)
Various phosphate 1 3% wt/vol
GreenShield® Whitmire Microgen Research Laboratories, Inc., USA
Quaternary ammonium salt
3 1 tsp/1 qt
GreenShield® Whitmire Microgen Research Laboratories, Inc., USA
Quaternary ammonium salt
1 2 tsp/1 qt
ZeroTol® Biosafe Systems, LLC, USA
Hydrogen dioxide 1 1:100
*Non-fat dry milk (NFDM)
Nestlé USA, Ohio, USA Milk product 1 20% wt/vol
*NFDM + Tween-20®
Nestlé USA, Ohio, USA + Cayman Chemical Co., USA
Milk product +polysorbate 20
1 20% wt/vol (milk) + 0.1 % Tween-20®
*VirkonS® Antec International Ltd., UK
Sodium chloride 1 1%
* Chemicals used for both Phase I and II are marked with an asterisk (*). Those without were used only for Phase I.
17
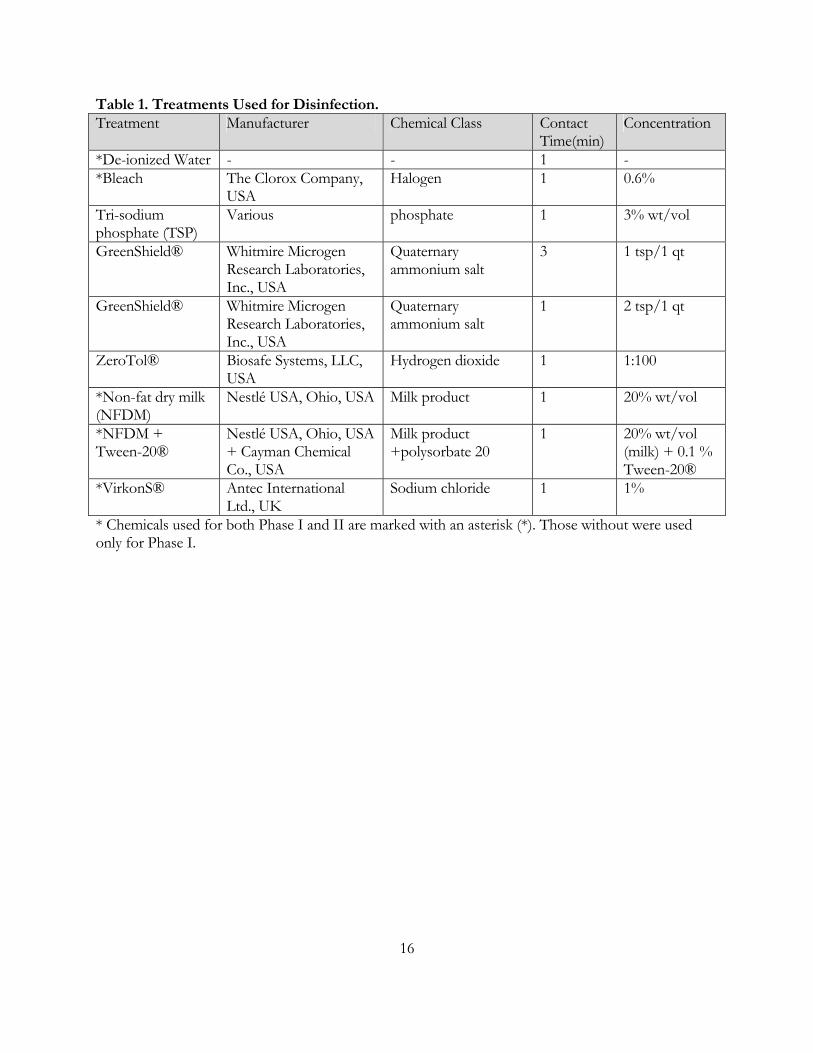
Table 2. Chemical dilutions for Phase I and II experiments. Treatment Number
Treatment Volume Concentration Concentrate De-ionized water
1* Water 125 mL - - 125 mL 2* Bleach 125 mL 0.6% 12.5 mL 112.5 mL 3 TSP 125 mL 3% wt/vol 3.75 g 125 mL 4 GS 125 mL 1 tsp/qt 0.651 mL 124.35 mL 5 GS x 2 125 mL 2 tsp/qt 1.302 mL 123.7 mL 6 ZeroTol® 125 mL 1:100 1.25 mL 123.75 mL 7* NFDM 125 mL 20% wt/vol 25 g 125 mL 8* NFDM +
T20 125 mL 20% wt/vol + 0.1%
T20 25 g NFDM + 125 µL T20
125 mL
9 * Virkon®S 125 mL 1% 1.25 g 125 mL TSP = Tri-sodium phosphate GS = GreenShield® GS x 2 = GreenShield® at twice label rate NFDM = non-fat dry milk T20 = Tween-20® *Disinfectants used for both Phase I and II are marked with an asterisk (*). Those without were used only for Phase I.
18
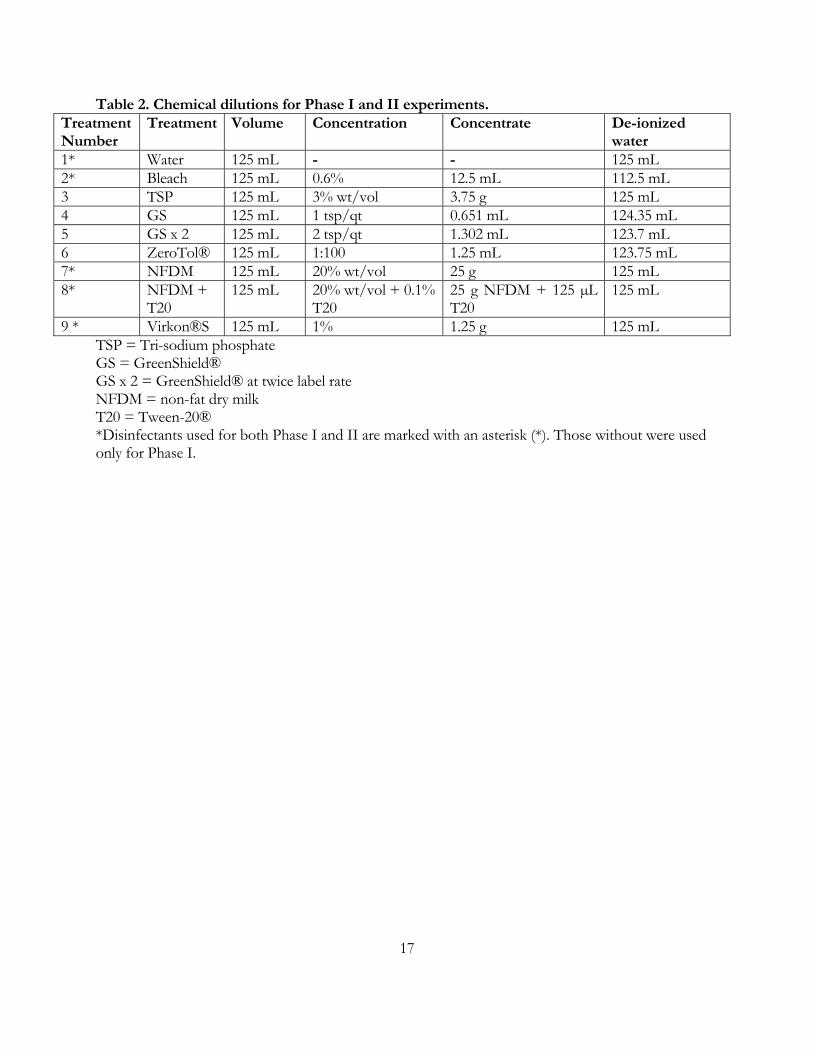
Table 3. Julian dates for Phase I and II Experiments. Phase I Julian week plants received
CV* Trial start
1st symptoms
Last plant that developed symptoms
DAS-ELISA sampling
Potted DAS-ELISA sampling
Teardown of trial
13 A 86 129 178 141-142 148 182 192 13 B 87 148 182 149-150 156 189 189 15 A 100 134 198 154-155 169-171 198-200 198-200 15 B 101 189 213 161-162 175-6 189-200 198-200 Phase II Julian week plants received
Received Potted Trial start 1st Symptoms
Last plant that developed symptoms
DAS-ELISA sampling
Teardown of trial
17 115 136-138 184 198 246 246 246 19 128 156 191 213 248 248 248 *CV (cultivar) A: Petunia x hybrida ‘Sweetunia® Blue Sky’. CV B: Petunia x hybrida ‘Surprise® White Improved’.
19
Table 4. Phase I overall analysis of variance; incidence of TMV infection in petunia liners cut with razor blades contaminated with sap from TMV-infected petunias and treated with disinfectant prior to cutting each healthy liner.†
Incidence Source DF Pr > F___________________________________________ BLOCK 4 0.01 DATE 1 NS‡ CV 1 0.05 TMT 9 0.001 CV*DATE 1 NS DATE*TMT 9 NS CV*TMT 9 NS CV*DATE*TMT 9 NS _________________________________________ † Analysis was made on square root transformed data. ‡ NS, not significant at P = 0.05
20
Table 5. Phase I incidence of TMV infection of petunia liners cut with TMV-contaminated razor blades treated with a disinfectant prior to cutting each healthy liner.† ______________________ _ WEEK‡ 13 WEEK 15 TREATMENT CV§ A CV B CV A CV B Combined WATER 60.0 a¶ 36.0 a 30.0 a 60.0 a 46.5 a ZeroTol (1:100) 10.0 bc 8.0 b 23.3 ab 10.0 b 12.8 b TSP (3%) 16.7 b 4.0 b 13.3 abc 3.3 bc 9.3 b GreenShield (2X) 10.0 bc 4.0 b 10.0 bcd 13.3 b 9.3 b GreenShield (3 min) 20.0 b 4.0 b 6.7 cd 3.3 bc 8.5 b Virkon®S S (1%) 6.7 bc 0.0 b 3.3 d 0.0 c 2.5 c Bleach (1:10) 0.0 c 4.0 b 3.3 d 0.0 c 1.8 c Non-fat dry milk (20%) +T20* 3.3 bc 0.0 b 0.0 d 3.3 bc 1.7 c Non-fat dry milk (20%) 0.0 c 4.0 b 0.0 d 0.0 c 1.0 c CONTROL 0.0 c 0.0 b 0.0 d 0.0 c 0.0 c † Each razor blade was dipped in sap from a TMV-infected petunia stock plant and used to cut a single healthy liner. ‡ Julian week that liners were received from supplier. § CV = Petunia x hybrida cultivar ‘Sweetunia® Blue Sky’ (A); ‘Surprise® White Improved’ (B) ¶ Means within a column followed by the same letter are not significantly different (P = 0.05). Analysis was made on square root transformed data, but actual percentages are presented. *T20, 0.1% Tween-20.
21
Table 6. DAS-ELISA Results for plants used for Inoculum, Phase II Cultivar Plant
Number Symptomatic OD405 ImmunoStrip®
result OD405 GEB*
OD405 HPM**
A 1-1-a Yes >3.500 n/a 0.2305 0.234 A 1-9-b Yes >3.500 n/a 0.2305 0.234 A 3-6-e Yes >3.500 n/a 0.2305 0.234 A 3-5-d Yes >3.500 n/a 0.1705 0.155 A 5-6-c Yes >3.500 n/a 0.1425 0.122 A 5-3-a Yes 0.801 positive 0.087 0.090 A 7-3-c Yes n/a positive - - A 9-1-c Yes n/a positive - - A 9-3-d Yes n/a positive - - A 9-1-e Yes >3.500 n/a 0.131 0.205 A 3-3-b Yes 3.367 n/a 0.131 0.205 A 1-3-d Yes >3.500 n/a 0.131 0.205 OD405: optical density at 405 nm. *GEB = General Extraction Buffer (Agdia®, Inc.) ** Healthy plant material
22
Table 7. Phase II overall analysis of variance; incidence of TMV infection in petunia liners cut with razor blades contaminated by cutting on a stem of a TMV-infected and treated with disinfectant prior to cutting each healthy liner.
Incidence Source DF Pr > F__________________________________________ BLOCK 4 NS† DATE 1 NS TMT 5 0.0001 DATE*TMT 5 NS † NS, not significant at P = 0.05
23
Table 8. Phase II incidence of TMV infection of Petunia x hybrida ‘Sweetunia® Blue Sky’ plants cut with a TMV-contaminated razor blade treated with disinfectant prior to cutting each healthy plant.† WEEK‡ TREATMENT 17 19 COMBINED WATER 68.0 a§ 50.0 a 59.0 a 1% Virkon®S® 6.0 b 2.0 b 4.0 b 20% Non-fat dry milk 4.0 b 0.0 b 2.0 b 20% Non-fat dry milk + T20 0.0 b 0.0 b 0.0 b Bleach (1:10) 0.0 b 0.0 b 0.0 b CONTROL 0.0 b 0.0 b 0.0 b † Each razor blade was contaminated with a single cut on a TMV-infected petunia stock plant and used to cut a single healthy liner. ‡ Julian week that liners were received from supplier. § Means within a column followed by the same letter are not significantly different (P = 0.05).
24
Figure 1. TMV symptoms (A) flower color break, on Cultivar A, Petunia x hybrida ‘Sweetunia® Blue Sky’ and (B) leaf mosaic, on Cultivar B, Petunia x hybrida ‘Surprise® White Improved’.
A
B
25
Figure 2. Percent infected plants in Preliminary Study 1. TMV-contaminated razor blades were treated for one minute with: 1 – household bleach (6% Sodium hypochlorite); 2 – flame; 3 – non-fat dry milk (20% weight/volume); 4 – Lysol® aerosol; 5 – Tri-sodium phosphate (saturated); 6 – GreenShield® (label rate); 7 – TSP substitute (sodium carbonate; saturated); 8 – water (control).
Percent Infected Plants in Preliminary Study 1.
0.00%9.52%
19.05%
52.38%
66.67%
78.95%85.71%
95.24%
0.00%
20.00%
40.00%
60.00%
80.00%
100.00%
1 2 3 4 5 6 7 8
Disinfectant Treatments
26
Percent Infected Plants in Preliminary Study 2.
0.00% 0.00%
12.50% 12.50% 12.50%
50.00%
62.50%
75.00%
0.00%
20.00%
40.00%
60.00%
80.00%
100.00%
1 2 3 4 5 6 7 8
Disinfectant Treatments
Figure 3. Percent infected plants in Preliminary Trial I. TMV-contaminated razor blades were treated for one minute with: 1 – mock (negative control) – ZeroTol® (label rate); 3 – household bleach (6% Sodium hypochlorite); 4 – GreenShield® (label rate); 5 – non-fat dry milk (20% weight/volume); 6 – Tri-sodium phosphate (saturated); 7 – TSP substitute (sodium carbonate; saturated); 8 – water (control)
27
Figure 4. Bleach vs. positive control (water) plants in Preliminary Study 1, 2007.
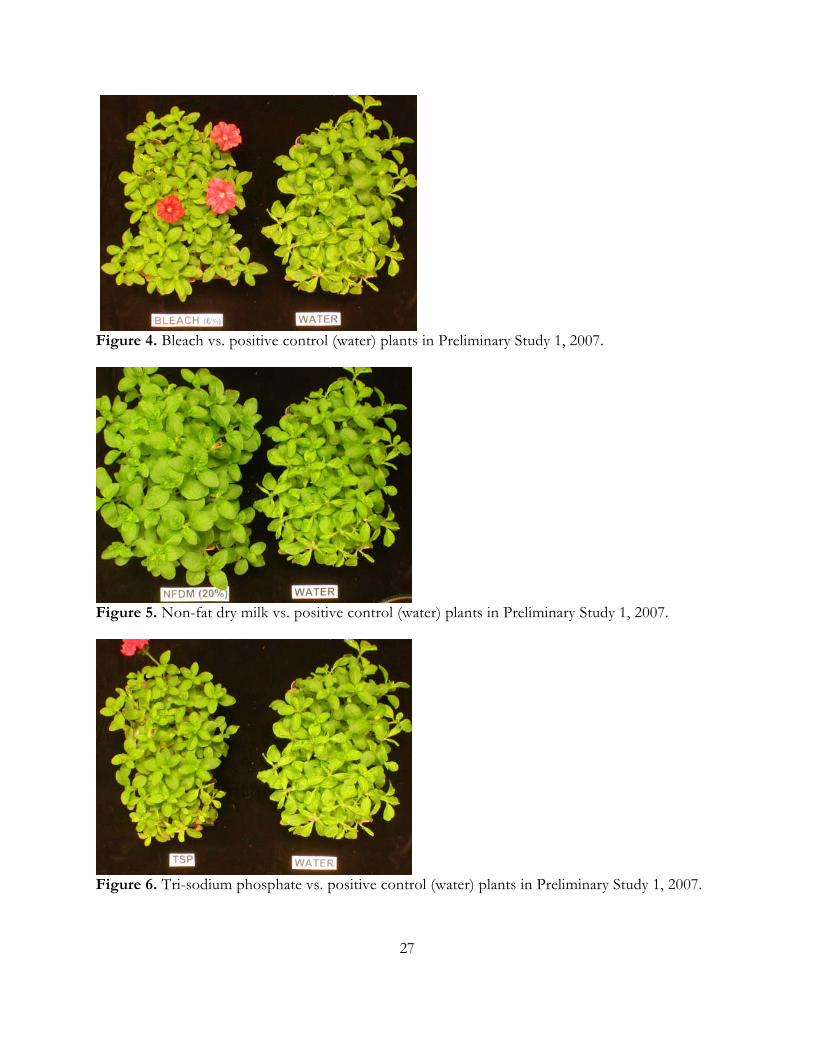
Figure 5. Non-fat dry milk vs. positive control (water) plants in Preliminary Study 1, 2007.
Figure 6. Tri-sodium phosphate vs. positive control (water) plants in Preliminary Study 1, 2007.
28
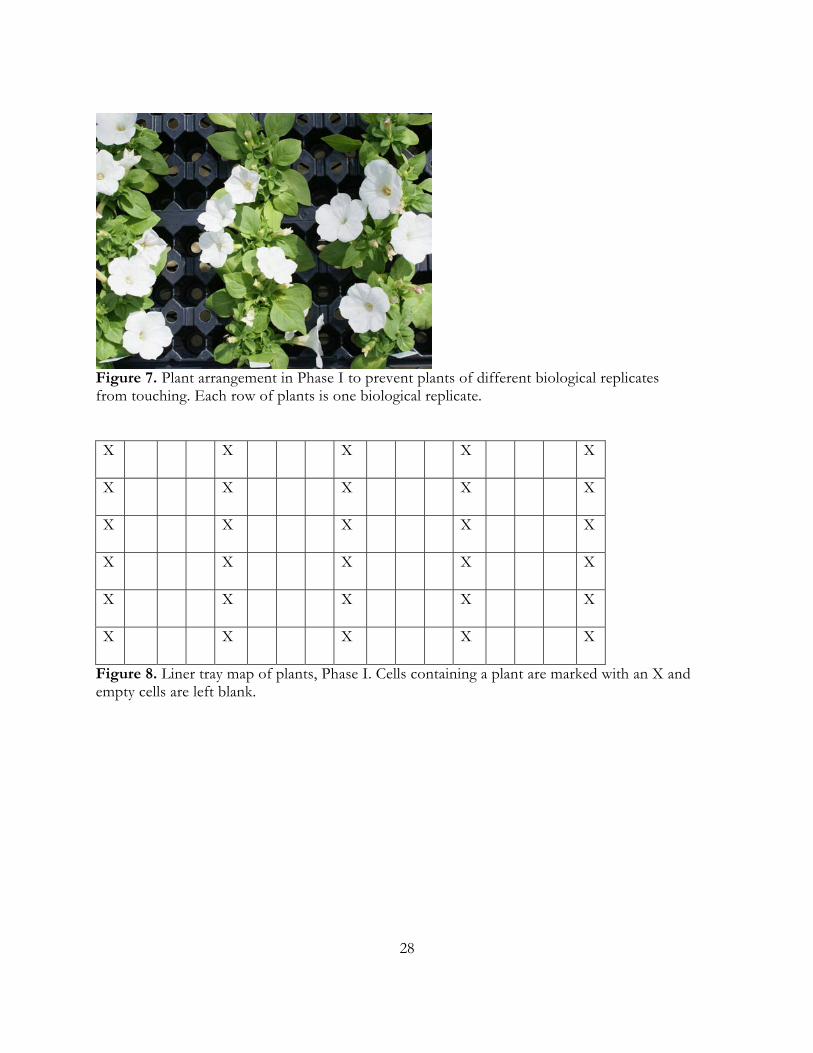
Figure 7. Plant arrangement in Phase I to prevent plants of different biological replicates from touching. Each row of plants is one biological replicate. X X X X X
X X X X X
X X X X X
X X X X X
X X X X X
X X X X X
Figure 8. Liner tray map of plants, Phase I. Cells containing a plant are marked with an X and empty cells are left blank.
29
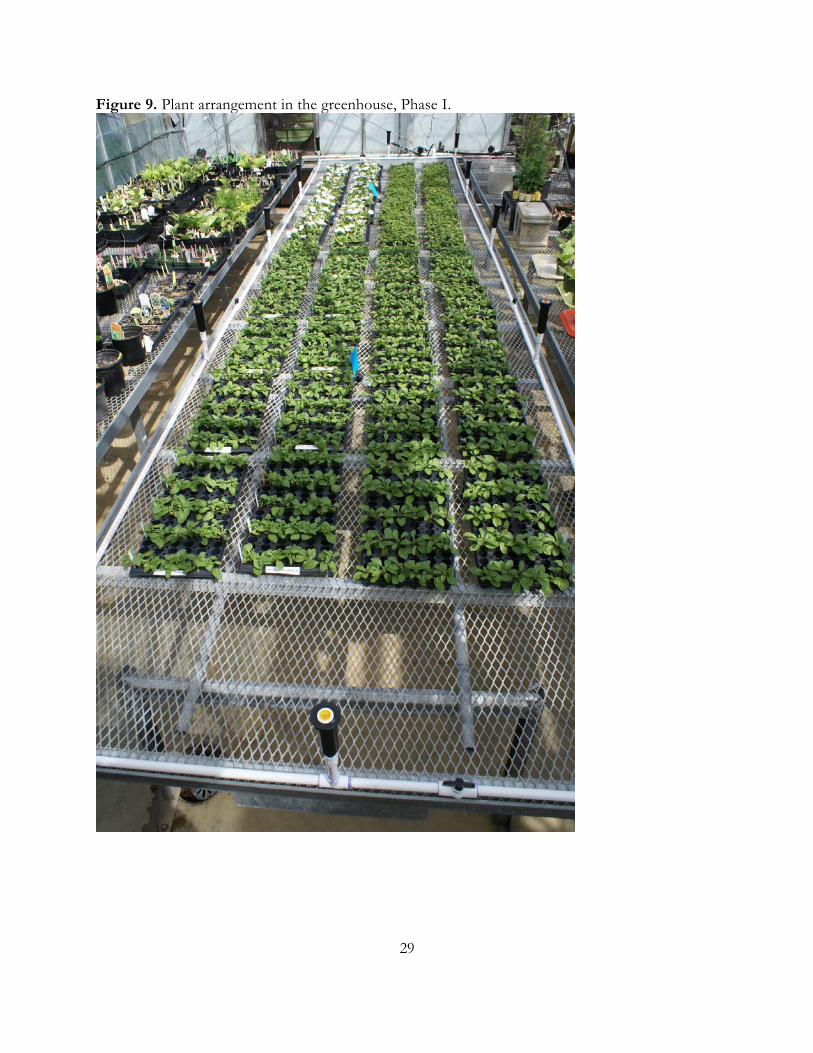
Figure 9. Plant arrangement in the greenhouse, Phase I.
30
Figure 10. Binder clip with razor blades aligned for contamination with TMV and disinfectant treatments, Phase I.
Figure 11. Bound razor blades in sap from TMV-infected petunia, Phase I.
32
BIBLIOGRAPHY
Albajes, R., Gullino, M.L., Van Lenteren, J.C., and Elad, Y. 1999. Integrated Pest and Disease Management in Greenhouse Crops. Kluwer Academic Publishers, Dordrecht.
Bettiol, W. 1999. Effectiveness of cow’s milk against zucchini squash powdery mildew (Sphaerotheca
fuliginous) in greenhouse conditions. Crop Protection 18:489-492. Bockholt, S., Hellwald, K.H., and Buchenauer, H. 1988. Investigation of the influence of two
quaternary ammonium compounds on some viruses and their mode of action. Journal of Phytopathology 127:331-340.
Brock, R.D. 1952. The use of trisodium phosphate as an inactivating agent for plant viruses. Journal of
Australian Agricultural Sciences 18:41-43. Chung, B.N., Kim, J.S., Cho, J.D., Cheong, S.R., and Jeong, M.I. 2007. Tobacco mosaic virus Detected in
Vegetatively Propagated Petunia Hybrids ‘Surfinia’. Plant Pathology Journal 23 (1): 34-36. Copes, W.E., and Hendrix, F.F. 1996. Chemical Disinfection of Greenhouse Growing Surface
Materials Contaminated with Thielaviopsis basicola. Plant Disease 80 (8): 885-886. Daughtrey, M.L., and Benson, D.M. 2005. Principles of Plant Health Management for Ornamental
Plants. Annual Review of Phytopathology 43:141-69. Dvorak, G. 2005. Disinfection 101. The Center for Food Security and Public Health, Iowa State
University. www.cfsph.iastate.edu/BRM/resources/Disinfectants/Disinfection101Feb2005.pdf Henn, A. 2004. Tobacco Mosaic Virus. Mississippi State University Extension Service Information
Sheet 1665. Howard, R., Harding, M., Savidov, N., Lisowski, S., Burke, D., and Pugh, S. 2007. Identifying
Effective Chemical Disinfectants for Use in Sanitizing Greenhouses. Interim Progress Report II, Alberta Professional Horticultural Growers Congress and Foundation Society.
Ingram, D.L. 1993. Landscape Plant Propagation Workbook: Unit I. General Principles of Plant
Propagation. University of Florida IFAS Extension. CIR 723. Jeffrey, D.J. 1995. Chemicals used as disinfectants: active ingredients and enhancing additives. Revue
Scieńtifique et technique Office International des Épizooties 14 (1): 57-74. Kamenova, I., and Adkins, S. 2004. Comparison of Detection Methods for a Novel Tobamovirus
Isolated from Florida Hibiscus. Plant Disease 88 (1): 34-40.
33
Lesemann, D.E. 1996. Viruses recently detected in Vegetatively Propagated Petunia. Acta Horticulturae 432:88-92.
Lewandowski, D. 2005. Genus Tobamovirus, Type Species Tobacco mosaic virus. In Virus Taxonomy:
Eighth Report of the International Committee on Taxonomy of Viruses. Ed: Fauquet, C.M., Mayo, M.A., Maniloff, J., Desselberger, U., and Ball, L.A. California, USA, Elsevier, 2005. pp: 1009-1014.
Moorman, G.W. Tobacco Mosaic Virus. Cooperative Extension Service, The Pennsylvania State
University Department of Plant Pathology. http://www.ppath.cas.psu.edu/extension/PLANT_DISEASE/pdf%20Flowers/Tobacco%20Mosaic%20Virus%20in%20Greenhouses.pdf
Nameth, S. 1996.Virus Disease of Greenhouse Floral Crops. The Ohio State University Extension
factsheet HYG-3065-96. Nester, M.T., Anderson, D.G., and Roberts Jr., C.E. Microbiology, A Human Perspective. USA, McGraw-
Hill Science Engineering, 1995. Pearce, B., Palmer, G., Bailey, A., Seebold, K., and Townsend, L. Management of Tobacco Float
Systems. In 2008 Kentucky Tobacco Production Guide. University of Kentucky ID-160. Ed: Seebold, K., and Pearch, B. pp. 12-22.
Phillipson, B., and Weekes, R. 2005. Containment of GM plant viruses being developed as gene
technology vectors. www.hse.gov.uk/research/rrhtm/rr378.htm. Pundt, L. 2003. Some Virus Diseases of Greenhouse Crops. University of Connecticut Integrated Pest
Management. http://www.hort.uconn.edu/ipm/greenhs/htms/gcrpvirus.htm. Smith, T. 2007. Cleaning and Disinfecting the Greenhouse. University of Massachusetts, Amherst
Department of Plant, Soils, and Insect Sciences. www.umass.edu/umext/floriculture/fact_sheets/greenhouse_management/ghsanitz.html.
Tambascio, S. 2007. Yesterday, Today, Tomorrow. Greenhouse Grower, May 2007: 1-8. Tambascio, S. 2008. Top Crops. Greenhouse Grower, August 2008: 34. Williams-Woodward, J. 2000. 1999 Georgia Plant Disease Loss Estimates. Cooperative Extension
Service, The University of Georgia College of Agricultural and Environmental Sciences. Special Bulletin 41-02/July 2000.