Embed Size (px)
Citation preview
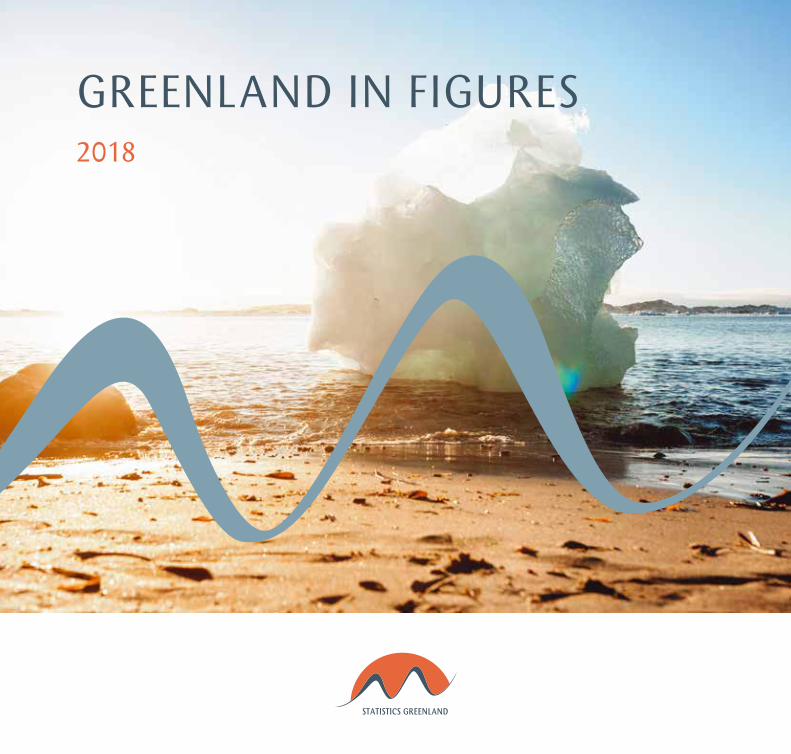
Greenland in FiGures 2018
Greenland in Figures 2018 • 15th revised edition • Editorial deadline: May 2018 • Number printed: 1,200
Published by Statistics Greenland • Telephone: +299 34 57 70 • Fax: +299 34 57 90 • [email protected] • www.stat.gl
Edited by Naduk Kleemann, Statistics Greenland • Typesetting and graphics by nuisi.gl • Printed by G-grafisk
© Statistics Greenland 2018. Quotations from this leaflet are permitted provided that the source is acknowledged.
ISBN: 978-87-998113-3-5 EAN: 9788798678786 ISSN: 1602-5709
Symbols- 0. Category not applicable0 Less than 0.5 of the unit used… Data not available* Provisional or estimated figures All economic figures are in Danish kroner (DKK).
index
5 Greenland – The world’s largest island
6 Politics
7 Population
8 Migration
9 Deaths and Births
10 Health
12 Families and Households
13 Education
15 Social Welfare
16 Crime
17 Culture
18 Climate and Environment
20 Transportation
21 Labour Market
23 Business
25 Fishing
27 Hunting
28 Agriculture
29 Tourism
31 Income
32 Prices
33 Foreign Trade
34 Public Finances
35 National Accounts
37 Key Figures
39 More Information about Greenland
Uummannaq
Upernavik
QeqertarsuaqIlulissat
AasiaatQasigiannguit
Sisimiut
Maniitsoq
Nanortalik
Kangerlussuaq
Qaanaaq
TasiilaqKulusuk
Ittoqqortoormiit
National Park
Narsaq
Paamiut
Kangaatsiaq
Nuuk
QaqortoqNarsarsuaq
Pituffik/Thule
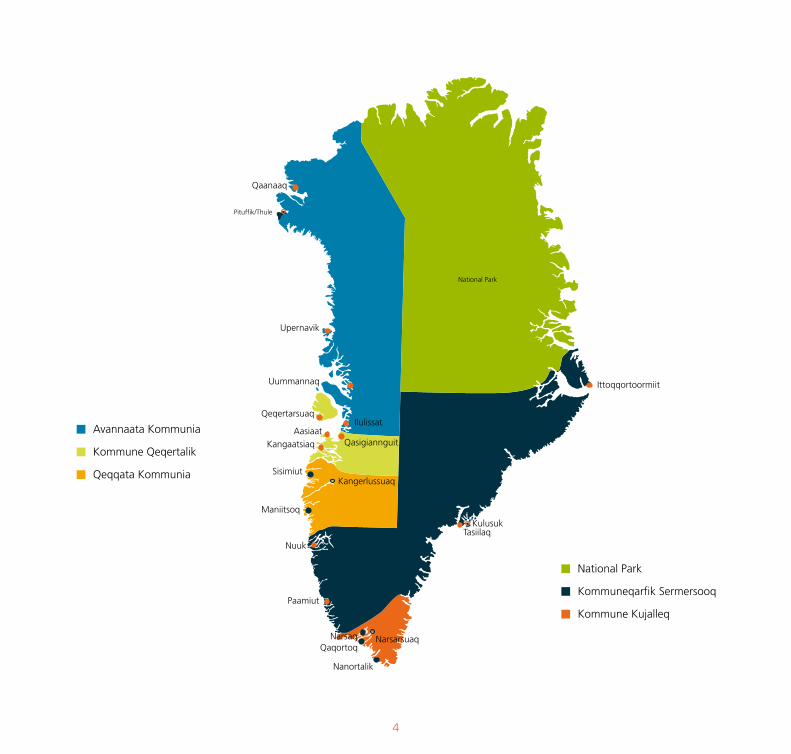
Avannaata Kommunia
Kommune Qeqertalik
Qeqqata Kommunia
National Park
Kommuneqarfik Sermersooq
Kommune Kujalleq
4
Greenland
The world’s largest islandGreenland is geographically located on the North American continent. In terms of geopolitics, however, it is a part of Eu-rope. 81 percent of Greenland is covered by ice, and the total population is just about 56,000, on an area 1/6 of Siberia´s. The population density is the lowest in the world. Counting the ice-free areas only, it is a mere 0.3 persons per square ki-lometre. For comparison, this is about 1/10 of Siberia´s popu-lation density.
Greenland is a self-governing region within the Kingdom of Denmark. In 1721, Greenland became a Danish colony, in 1953 a Danish County, and in 1979, home rule was granted. Self-rule was established on June 21th 2009.
Along with Denmark, Greenland was an EU member from 1973 on. Following a referendum in 1985, however, Green-land left the union and has not been a member since.
Most of the Greenlandic landscape is pristine tundra. All towns and settlements are located along the coast line. No roads exist between towns, and all travel is by ship and air-craft only. Most of the population lives on the southern west coast. This includes the capital Nuuk with 17,000 inhabitants.
Greenland has its own national flag, and issues its own stamps. Danish Krone (DKK) is legal tender.
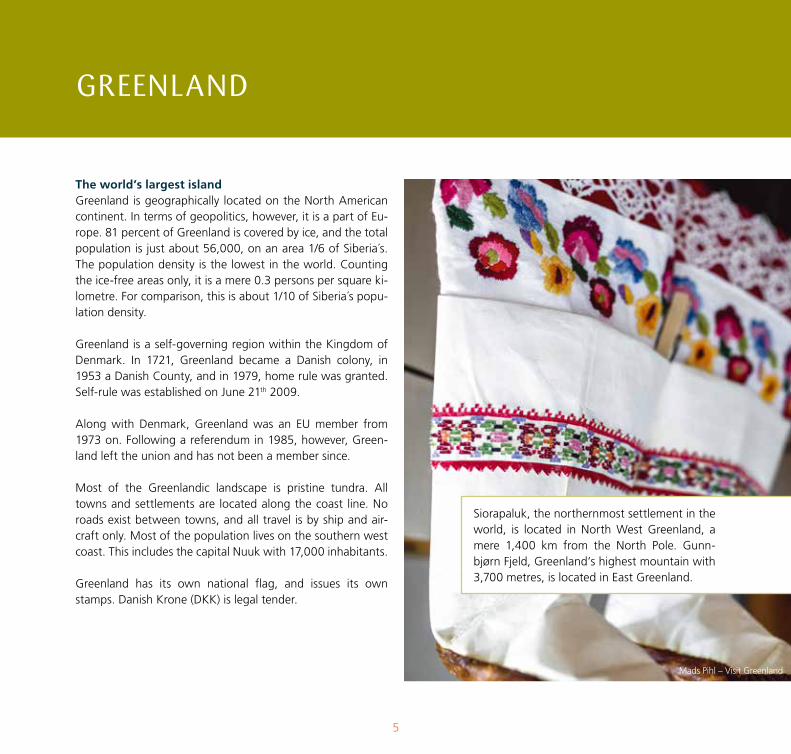
Mads Pihl – Visit Greenland
Siorapaluk, the northernmost settlement in the world, is located in North West Greenland, a mere 1,400 km from the North Pole. Gunn-bjørn Fjeld, Greenland’s highest mountain with 3,700 metres, is located in East Greenland.
5
Politics
The Inatsisartut (Parliament of Greenland) with 31 members, and Naalakkersuisut (the Government) are both located in the capital Nuuk. The Head of Naalakkersuisut is termed “Naalak-kersuisut Siulittaasuat”.
Every four years, elections for the Inatsisartut are held. After each election, the Inatsisartut appoints the new Naalakkersu-isut members and the new Naalakkersuisut Siulittaasuat. A candidate can run for a party or as an independent. The D´Hondt method of seat calculation is used.
Election to the Greenlandic Parliament. April 24th, 2018 by Party
Votes Per Cent Mandates Elected women
Parties 29,003 100.0 31 12Atassut 1,730 5.9 2 -Demokraatit 5,712 19.5 6 3Inuit Ataqatigiit 7,478 25.5 8 5Siumut 7,957 27.2 9 3Nunatta Qitornai 1,002 3.4 1 -Partii Naleraq 3,931 13.4 4 -Samarbejdspartiet 1,193 4.1 1 1
Source: The Election Board, Government of Greenland
Greenland is divided into five municipalities; Kommune Kujal-leq, Kommuneqarfik Sermersooq, Qeqqata Kommunia, Kom-mune Qeqertalik and Avannaata Kommunia. Elections for the municipal boards are also held every four years. As of March 2018, Greenland has 7 political parties. The two largest are Siumut (“Forward”) and Inuit Ataqatagiit (“Unified Inuit”).
Being a part of the Kingdom of Denmark, Greenland has two seats in Folketinget, the parliament of Denmark. The members are elected in conjunction with the election for the Danish par-liament. From time to time, referendums about political deci-sions are held. In 1979, Greenland voted for home rule, and in 2008 for self-rule. In 1982, Greenland voted for leaving the EU.
Election to the municipal councils, April 4th 2017Greenland
totalAvannaata Kommunia
Kommune Qeqertalik
Qeqqata Kommunia
Kommuneqarfik Sermersooq
Kommune Kujalleq
Distribution of votes Atassut 11.8 16.6 7.7 21.2 7.6 8.6Demokraatit 8.2 6.7 5.0 - 16.9 -Inuit Ataqatigiit 32.4 16.0 44.5 17.4 43.0 33.5Partii Naleraq 4.6 10.8 0.9 8.3 2.6 -Siumut 41.5 48.7 40.6 51.7 28.2 56.0
Source: The Election Board, Government of Greenland
6
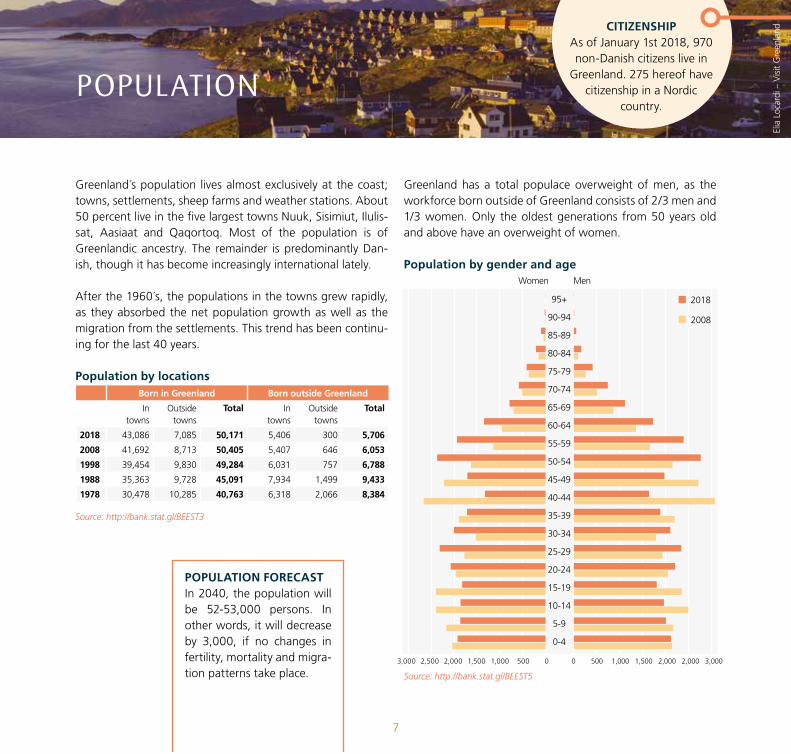
PoPulation
Greenland´s population lives almost exclusively at the coast; towns, settlements, sheep farms and weather stations. About 50 percent live in the five largest towns Nuuk, Sisimiut, Ilulis-sat, Aasiaat and Qaqortoq. Most of the population is of Greenlandic ancestry. The remainder is predominantly Dan-ish, though it has become increasingly international lately.
After the 1960´s, the populations in the towns grew rapidly, as they absorbed the net population growth as well as the migration from the settlements. This trend has been continu-ing for the last 40 years.
Population by locationsBorn in Greenland Born outside Greenland
In towns
Outside towns
Total In towns
Outside towns
Total
2018 43,086 7,085 50,171 5,406 300 5,706
2008 41,692 8,713 50,405 5,407 646 6,053
1998 39,454 9,830 49,284 6,031 757 6,788
1988 35,363 9,728 45,091 7,934 1,499 9,433
1978 30,478 10,285 40,763 6,318 2,066 8,384
Source: http://bank.stat.gl/BEEST3
Greenland has a total populace overweight of men, as the workforce born outside of Greenland consists of 2/3 men and 1/3 women. Only the oldest generations from 50 years old and above have an overweight of women.
Population by gender and age
Source: http://bank.stat.gl/BEEST5
CITIZENSHIP As of January 1st 2018, 970 non-Danish citizens live in
Greenland. 275 hereof have citizenship in a Nordic
country.
POPULATION FORECASTIn 2040, the population will be 52-53,000 persons. In other words, it will decrease by 3,000, if no changes in fertility, mortality and migra-tion patterns take place.
Elia
Loc
ardi
– V
isit
Gre
enla
nd
7
Women Men
3,000 2,500 2,000 1,500 1,000 500 0 0 500 1,000 1,500 2,000 2,000 3,000
2018
2008
0-4
5-9
10-14
15-19
20-24
25-29
30-34
35-39
40-44
45-49
50-54
55-59
60-64
65-69
70-74
75-79
80-84
85-89
90-94
95+
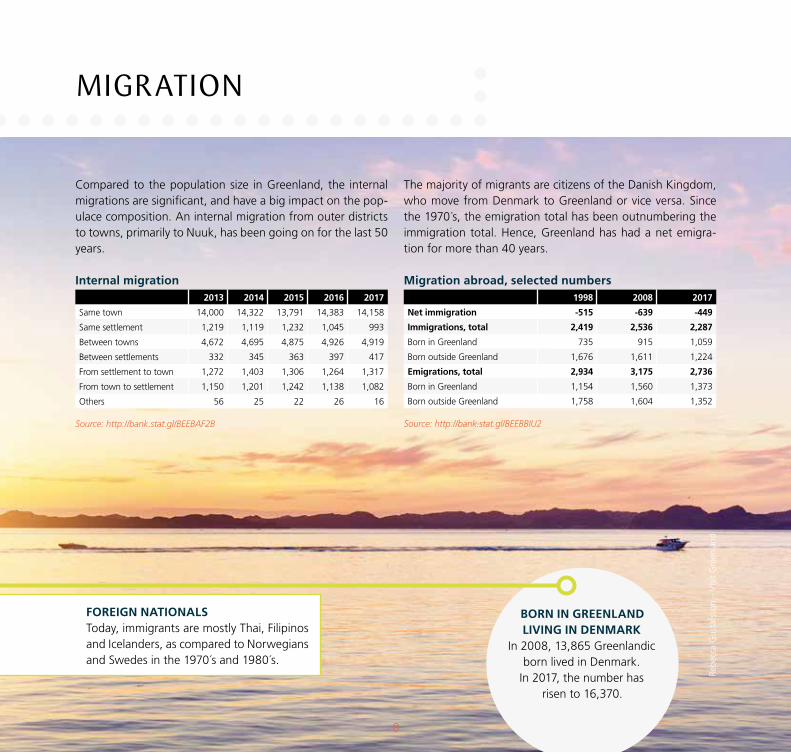
MiGration
Compared to the population size in Greenland, the internal migrations are significant, and have a big impact on the pop-ulace composition. An internal migration from outer districts to towns, primarily to Nuuk, has been going on for the last 50 years.
Internal migration2013 2014 2015 2016 2017
Same town 14,000 14,322 13,791 14,383 14,158
Same settlement 1,219 1,119 1,232 1,045 993
Between towns 4,672 4,695 4,875 4,926 4,919
Between settlements 332 345 363 397 417
From settlement to town 1,272 1,403 1,306 1,264 1,317
From town to settlement 1,150 1,201 1,242 1,138 1,082
Others 56 25 22 26 16
Source: http://bank.stat.gl/BEEBAF2B
The majority of migrants are citizens of the Danish Kingdom, who move from Denmark to Greenland or vice versa. Since the 1970´s, the emigration total has been outnumbering the immigration total. Hence, Greenland has had a net emigra-tion for more than 40 years.
Migration abroad, selected numbers1998 2008 2017
Net immigration -515 -639 -449
Immigrations, total 2,419 2,536 2,287
Born in Greenland 735 915 1,059
Born outside Greenland 1,676 1,611 1,224
Emigrations, total 2,934 3,175 2,736
Born in Greenland 1,154 1,560 1,373
Born outside Greenland 1,758 1,604 1,352
Source: http://bank.stat.gl/BEEBBIU2
BORN IN GREENLAND LIVING IN DENMARK
In 2008, 13,865 Greenlandic born lived in Denmark.
In 2017, the number has risen to 16,370.
FOREIGN NATIONALSToday, immigrants are mostly Thai, Filipinos and Icelanders, as compared to Norwegians and Swedes in the 1970´s and 1980´s.
Rebe
cca
Gus
tafs
son
– V
isit
Gre
enla
nd
8
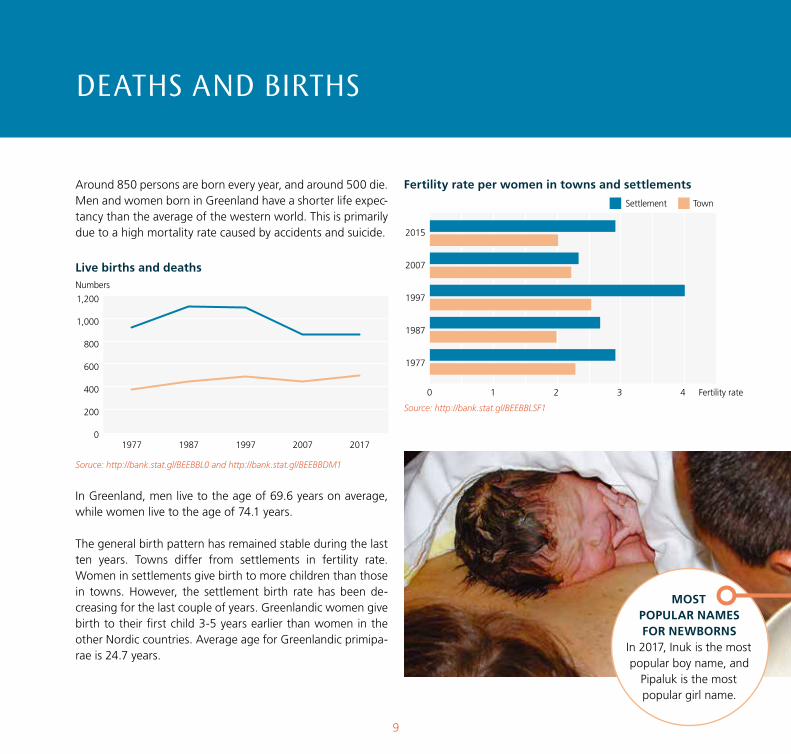
Around 850 persons are born every year, and around 500 die. Men and women born in Greenland have a shorter life expec-tancy than the average of the western world. This is primarily due to a high mortality rate caused by accidents and suicide.
Live births and deaths
Soruce: http://bank.stat.gl/BEEBBL0 and http://bank.stat.gl/BEEBBDM1
In Greenland, men live to the age of 69.6 years on average, while women live to the age of 74.1 years.
The general birth pattern has remained stable during the last ten years. Towns differ from settlements in fertility rate. Women in settlements give birth to more children than those in towns. However, the settlement birth rate has been de-creasing for the last couple of years. Greenlandic women give birth to their first child 3-5 years earlier than women in the other Nordic countries. Average age for Greenlandic primipa-rae is 24.7 years.
Fertility rate per women in towns and settlements
Source: http://bank.stat.gl/BEEBBLSF1
MOST POPULAR NAMES FOR NEWBORNS
In 2017, Inuk is the most popular boy name, and
Pipaluk is the most popular girl name.
9
1,200
1,000
800
600
400
200
01977 1987 1997 2007 2017
2015
2007
1997
1987
1977
0 1 2 3 4 Fertility rate
deaths and Births
Numbers
Settlement Town
health
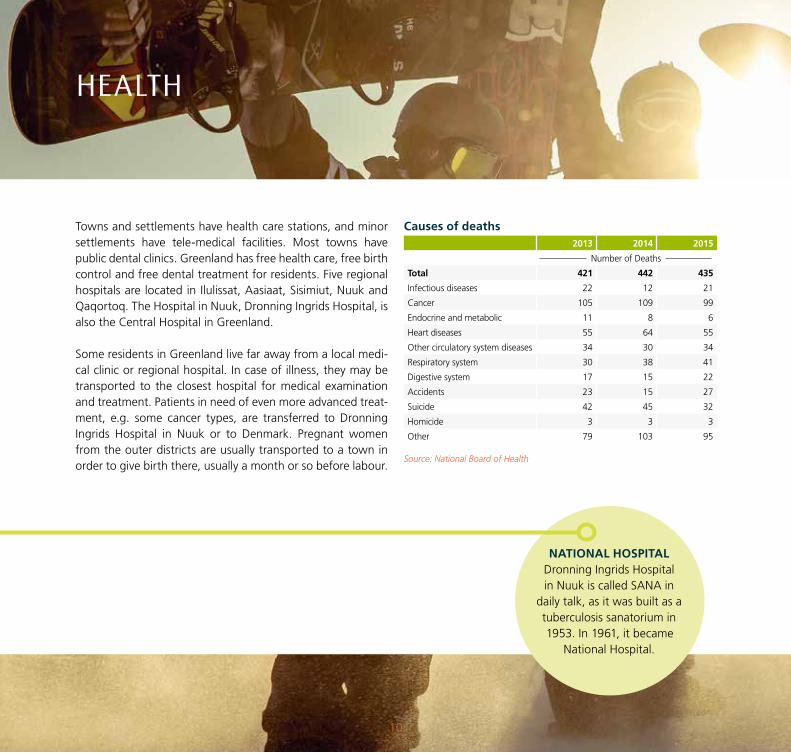
Towns and settlements have health care stations, and minor settlements have tele-medical facilities. Most towns have public dental clinics. Greenland has free health care, free birth control and free dental treatment for residents. Five regional hospitals are located in Ilulissat, Aasiaat, Sisimiut, Nuuk and Qaqortoq. The Hospital in Nuuk, Dronning Ingrids Hospital, is also the Central Hospital in Greenland.
Some residents in Greenland live far away from a local medi-cal clinic or regional hospital. In case of illness, they may be transported to the closest hospital for medical examination and treatment. Patients in need of even more advanced treat-ment, e.g. some cancer types, are transferred to Dronning Ingrids Hospital in Nuuk or to Denmark. Pregnant women from the outer districts are usually transported to a town in order to give birth there, usually a month or so before labour.
Causes of deaths2013 2014 2015
Number of Deaths
Total 421 442 435
Infectious diseases 22 12 21
Cancer 105 109 99
Endocrine and metabolic 11 8 6
Heart diseases 55 64 55
Other circulatory system diseases 34 30 34
Respiratory system 30 38 41
Digestive system 17 15 22
Accidents 23 15 27
Suicide 42 45 32
Homicide 3 3 3
Other 79 103 95
Source: National Board of Health
NATIONAL HOSPITALDronning Ingrids Hospital in Nuuk is called SANA in
daily talk, as it was built as a tuberculosis sanatorium in 1953. In 1961, it became
National Hospital.
10
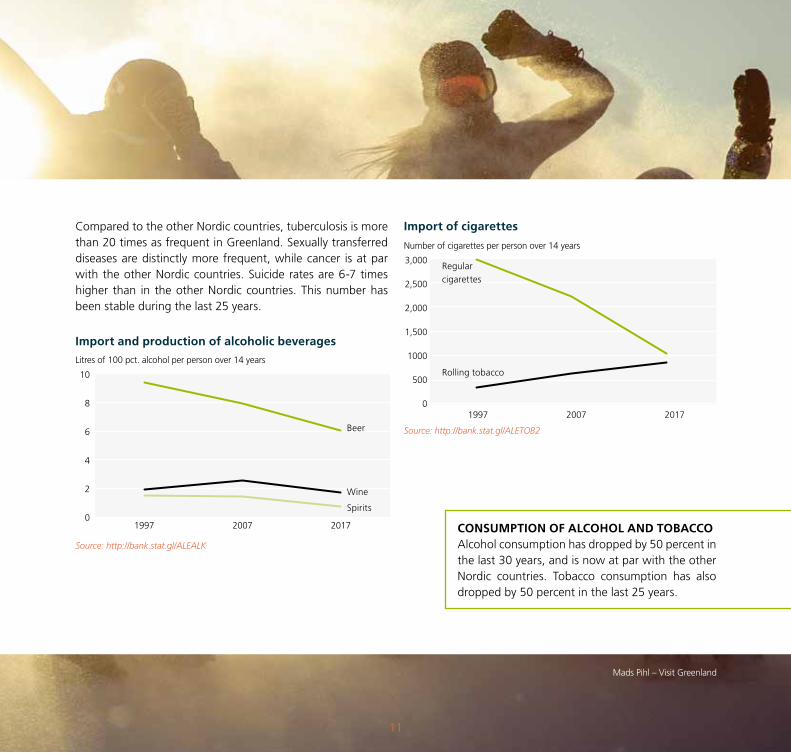
Compared to the other Nordic countries, tuberculosis is more than 20 times as frequent in Greenland. Sexually transferred diseases are distinctly more frequent, while cancer is at par with the other Nordic countries. Suicide rates are 6-7 times higher than in the other Nordic countries. This number has been stable during the last 25 years.
Import and production of alcoholic beverages
Source: http://bank.stat.gl/ALEALK
Import of cigarettes
Source: http://bank.stat.gl/ALETOB2
CONSUMPTION OF ALCOHOL AND TOBACCOAlcohol consumption has dropped by 50 percent in the last 30 years, and is now at par with the other Nordic countries. Tobacco consumption has also dropped by 50 percent in the last 25 years.
Mads Pihl – Visit Greenland
11
Beer
Wine
Spirits
10
8
6
4
2
0
3,000
2,500
2,000
1,500
1000
500
0
1997 2007 2017
1997 2007 2017
Regular
cigarettes
Rolling tobaccoLitres of 100 pct. alcohol per person over 14 years
Number of cigarettes per person over 14 years
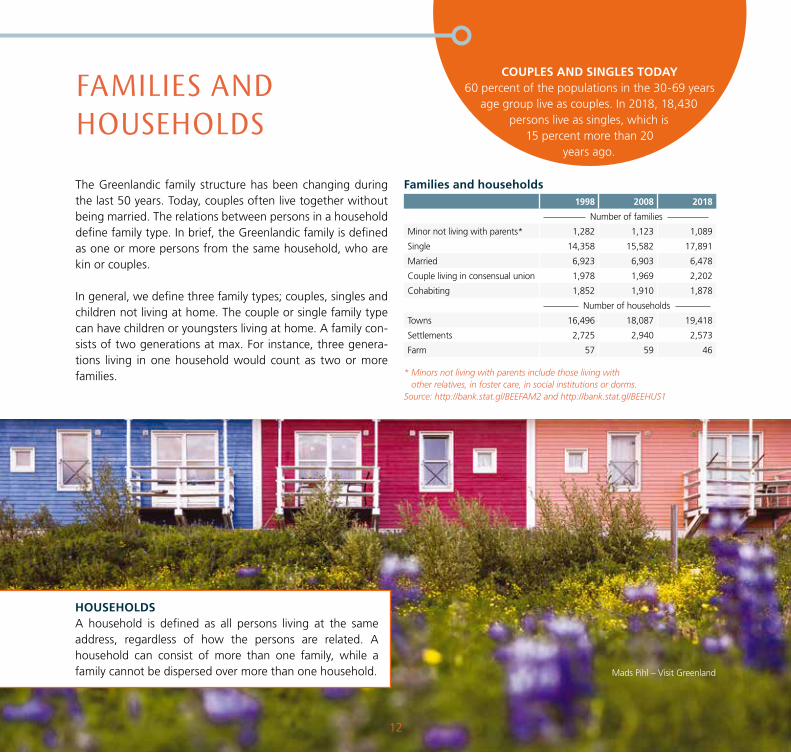
FaMilies and households
The Greenlandic family structure has been changing during the last 50 years. Today, couples often live together without being married. The relations between persons in a household define family type. In brief, the Greenlandic family is defined as one or more persons from the same household, who are kin or couples.
In general, we define three family types; couples, singles and children not living at home. The couple or single family type can have children or youngsters living at home. A family con-sists of two generations at max. For instance, three genera-tions living in one household would count as two or more families.
Families and households 1998 2008 2018
Number of families
Minor not living with parents* 1,282 1,123 1,089
Single 14,358 15,582 17,891
Married 6,923 6,903 6,478
Couple living in consensual union 1,978 1,969 2,202
Cohabiting 1,852 1,910 1,878
Number of households
Towns 16,496 18,087 19,418
Settlements 2,725 2,940 2,573
Farm 57 59 46
* Minors not living with parents include those living with other relatives, in foster care, in social institutions or dorms.
Source: http://bank.stat.gl/BEEFAM2 and http://bank.stat.gl/BEEHUS1
COUPLES AND SINGLES TODAY60 percent of the populations in the 30-69 years
age group live as couples. In 2018, 18,430 persons live as singles, which is
15 percent more than 20 years ago.
HOUSEHOLDSA household is defined as all persons living at the same address, regardless of how the persons are related. A household can consist of more than one family, while a family cannot be dispersed over more than one household. Mads Pihl – Visit Greenland
12
education
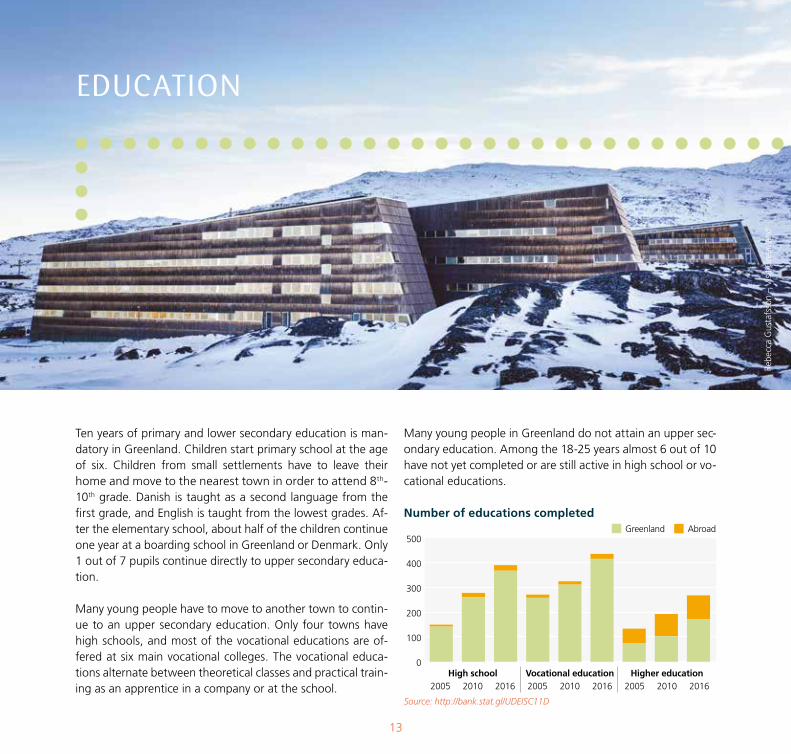
Ten years of primary and lower secondary education is man-datory in Greenland. Children start primary school at the age of six. Children from small settlements have to leave their home and move to the nearest town in order to attend 8th-10th grade. Danish is taught as a second language from the first grade, and English is taught from the lowest grades. Af-ter the elementary school, about half of the children continue one year at a boarding school in Greenland or Denmark. Only 1 out of 7 pupils continue directly to upper secondary educa-tion.
Many young people have to move to another town to contin-ue to an upper secondary education. Only four towns have high schools, and most of the vocational educations are of-fered at six main vocational colleges. The vocational educa-tions alternate between theoretical classes and practical train-ing as an apprentice in a company or at the school.
Many young people in Greenland do not attain an upper sec-ondary education. Among the 18-25 years almost 6 out of 10 have not yet completed or are still active in high school or vo-cational educations.
Number of educations completed
Source: http://bank.stat.gl/UDEISC11D
Rebe
cca
Gus
tafs
son
– V
isit
Gre
enla
nd
13
High school Vocational education Higher education2005 2010 2016 2005 2010 2016 2005 2010 2016
500
400
300
200
100
0
Greenland Abroad
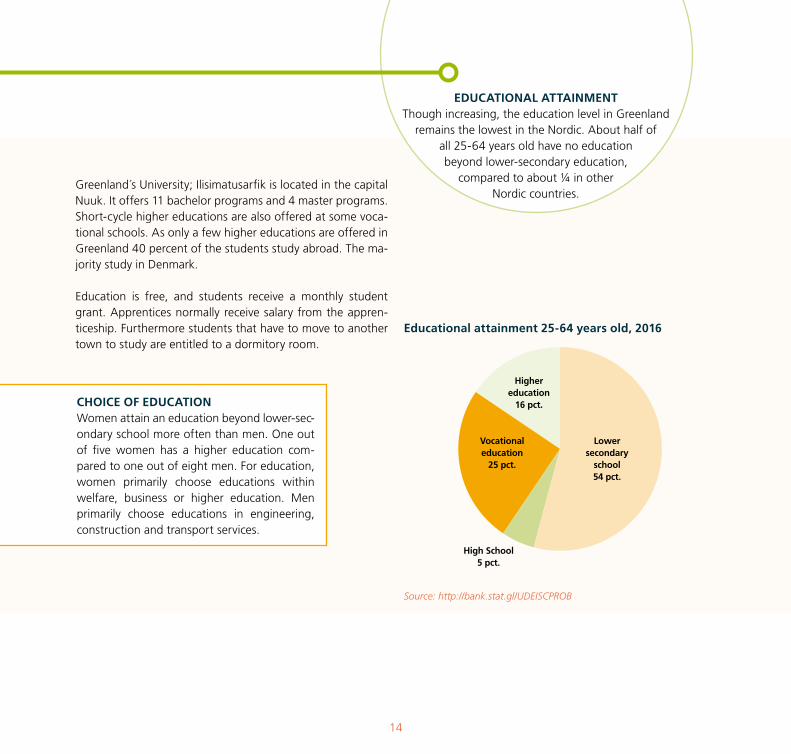
Greenland´s University; Ilisimatusarfik is located in the capital Nuuk. It offers 11 bachelor programs and 4 master programs. Short-cycle higher educations are also offered at some voca-tional schools. As only a few higher educations are offered in Greenland 40 percent of the students study abroad. The ma-jority study in Denmark.
Education is free, and students receive a monthly student grant. Apprentices normally receive salary from the appren-ticeship. Furthermore students that have to move to another town to study are entitled to a dormitory room.
Educational attainment 25-64 years old, 2016
Source: http://bank.stat.gl/UDEISCPROB
EDUCATIONAL ATTAINMENTThough increasing, the education level in Greenland
remains the lowest in the Nordic. About half of all 25-64 years old have no education beyond lower-secondary education,
compared to about ¼ in other Nordic countries.
CHOICE OF EDUCATIONWomen attain an education beyond lower-sec-ondary school more often than men. One out of five women has a higher education com-pared to one out of eight men. For education, women primarily choose educations within welfare, business or higher education. Men primarily choose educations in engineering, construction and transport services.
14
Lower secondary
school54 pct.
High School5 pct.
Vocational education
25 pct.
Higher education
16 pct.
Carlo Lukassen – Visit Greenland
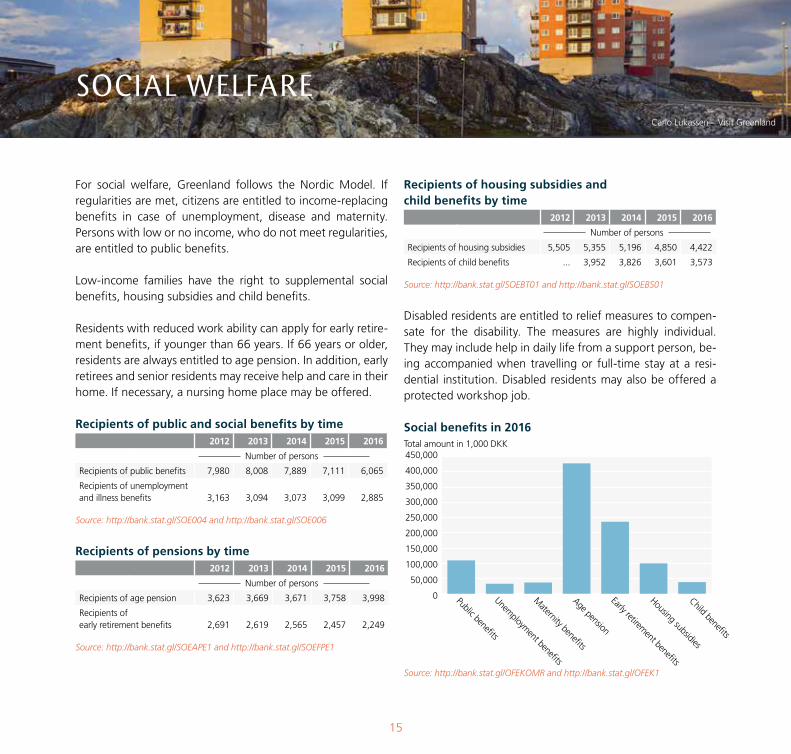
social WelFare
For social welfare, Greenland follows the Nordic Model. If regularities are met, citizens are entitled to income-replacing benefits in case of unemployment, disease and maternity. Persons with low or no income, who do not meet regularities, are entitled to public benefits.
Low-income families have the right to supplemental social benefits, housing subsidies and child benefits.
Residents with reduced work ability can apply for early retire-ment benefits, if younger than 66 years. If 66 years or older, residents are always entitled to age pension. In addition, early retirees and senior residents may receive help and care in their home. If necessary, a nursing home place may be offered.
Recipients of public and social benefits by time2012 2013 2014 2015 2016
Number of persons
Recipients of public benefits 7,980 8,008 7,889 7,111 6,065
Recipients of unemployment and illness benefits 3,163 3,094 3,073 3,099 2,885
Source: http://bank.stat.gl/SOE004 and http://bank.stat.gl/SOE006
Recipients of pensions by time2012 2013 2014 2015 2016
Number of persons
Recipients of age pension 3,623 3,669 3,671 3,758 3,998
Recipients of early retirement benefits 2,691 2,619 2,565 2,457 2,249
Source: http://bank.stat.gl/SOEAPE1 and http://bank.stat.gl/SOEFPE1
Recipients of housing subsidies and child benefits by time
2012 2013 2014 2015 2016
Number of persons
Recipients of housing subsidies 5,505 5,355 5,196 4,850 4,422
Recipients of child benefits ... 3,952 3,826 3,601 3,573
Source: http://bank.stat.gl/SOEBT01 and http://bank.stat.gl/SOEBS01
Disabled residents are entitled to relief measures to compen-sate for the disability. The measures are highly individual. They may include help in daily life from a support person, be-ing accompanied when travelling or full-time stay at a resi-dential institution. Disabled residents may also be offered a protected workshop job.
Social benefits in 2016
Source: http://bank.stat.gl/OFEKOMR and http://bank.stat.gl/OFEK1
15
Child benefits
Housing subsidies
Early retirement benefits
Age pension
Maternity benefits
Unemploym
ent benefits
Public benefits
450,000
400,000
350,000
300,000
250,000
200,000
150,000
100,000
50,000
0
Total amount in 1,000 DKK
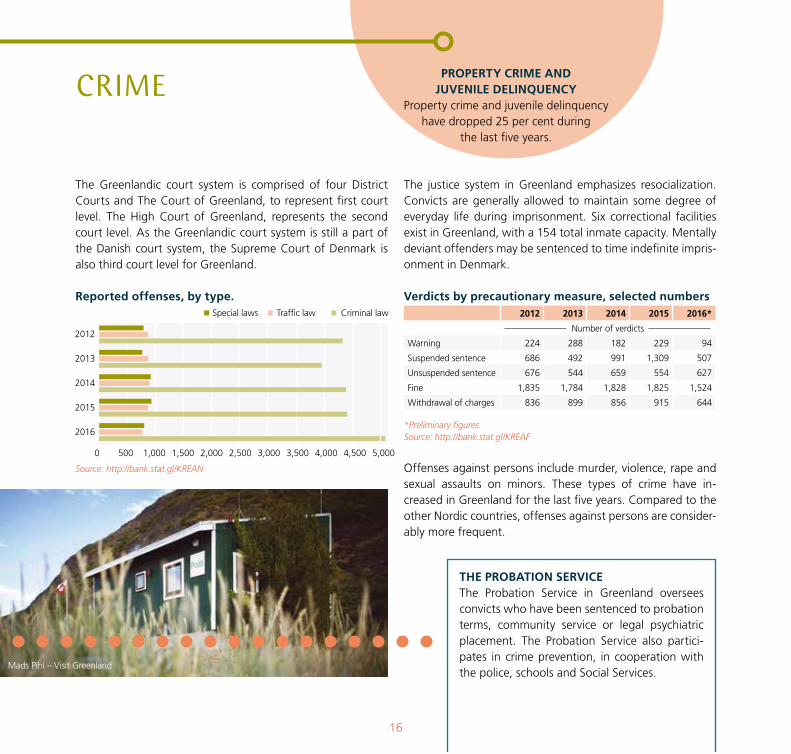
criMe
The Greenlandic court system is comprised of four District Courts and The Court of Greenland, to represent first court level. The High Court of Greenland, represents the second court level. As the Greenlandic court system is still a part of the Danish court system, the Supreme Court of Denmark is also third court level for Greenland.
Reported offenses, by type.
Source: http://bank.stat.gl/KREAN
The justice system in Greenland emphasizes resocialization. Convicts are generally allowed to maintain some degree of everyday life during imprisonment. Six correctional facilities exist in Greenland, with a 154 total inmate capacity. Mentally deviant offenders may be sentenced to time indefinite impris-onment in Denmark.
Verdicts by precautionary measure, selected numbers2012 2013 2014 2015 2016*
Number of verdicts
Warning 224 288 182 229 94
Suspended sentence 686 492 991 1,309 507
Unsuspended sentence 676 544 659 554 627
Fine 1,835 1,784 1,828 1,825 1,524
Withdrawal of charges 836 899 856 915 644
*Preliminary figuresSource: http://bank.stat.gl/KREAF
Offenses against persons include murder, violence, rape and sexual assaults on minors. These types of crime have in-creased in Greenland for the last five years. Compared to the other Nordic countries, offenses against persons are consider-ably more frequent.
PROPERTY CRIME AND JUVENILE DELINQUENCY
Property crime and juvenile delinquency have dropped 25 per cent during
the last five years.
THE PROBATION SERVICEThe Probation Service in Greenland oversees convicts who have been sentenced to probation terms, community service or legal psychiatric placement. The Probation Service also partici-pates in crime prevention, in cooperation with the police, schools and Social Services.
Mads Pihl – Visit Greenland
16
Special laws Traffic law Criminal law
2012
2013
2014
2015
2016
0 500 1,000 1,500 2,000 2,500 3,000 3,500 4,000 4,500 5,000
Mad
s Pi
hl –
Vis
it G
reen
land
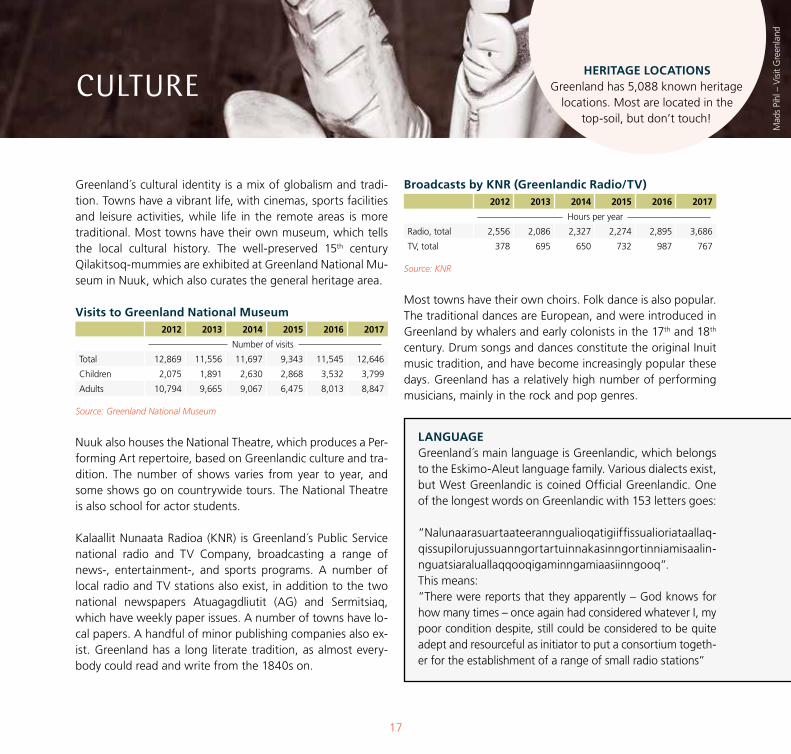
culture
Greenland´s cultural identity is a mix of globalism and tradi-tion. Towns have a vibrant life, with cinemas, sports facilities and leisure activities, while life in the remote areas is more traditional. Most towns have their own museum, which tells the local cultural history. The well-preserved 15th century Qilakitsoq-mummies are exhibited at Greenland National Mu-seum in Nuuk, which also curates the general heritage area.
Visits to Greenland National Museum2012 2013 2014 2015 2016 2017
Number of visits
Total 12,869 11,556 11,697 9,343 11,545 12,646
Children 2,075 1,891 2,630 2,868 3,532 3,799
Adults 10,794 9,665 9,067 6,475 8,013 8,847
Source: Greenland National Museum
Nuuk also houses the National Theatre, which produces a Per-forming Art repertoire, based on Greenlandic culture and tra-dition. The number of shows varies from year to year, and some shows go on countrywide tours. The National Theatre is also school for actor students.
Kalaallit Nunaata Radioa (KNR) is Greenland´s Public Service national radio and TV Company, broadcasting a range of news-, entertainment-, and sports programs. A number of local radio and TV stations also exist, in addition to the two national newspapers Atuagagdliutit (AG) and Sermitsiaq, which have weekly paper issues. A number of towns have lo-cal papers. A handful of minor publishing companies also ex-ist. Greenland has a long literate tradition, as almost every-body could read and write from the 1840s on.
Broadcasts by KNR (Greenlandic Radio/TV)2012 2013 2014 2015 2016 2017
Hours per year
Radio, total 2,556 2,086 2,327 2,274 2,895 3,686
TV, total 378 695 650 732 987 767
Source: KNR
Most towns have their own choirs. Folk dance is also popular. The traditional dances are European, and were introduced in Greenland by whalers and early colonists in the 17th and 18th century. Drum songs and dances constitute the original Inuit music tradition, and have become increasingly popular these days. Greenland has a relatively high number of performing musicians, mainly in the rock and pop genres.
LANGUAGEGreenland´s main language is Greenlandic, which belongs to the Eskimo-Aleut language family. Various dialects exist, but West Greenlandic is coined Official Greenlandic. One of the longest words on Greenlandic with 153 letters goes:
”Nalunaarasuartaateeranngualioqatigiiffissualioriataallaq-qissupilorujussuanngortartuinnakasinngortinniamisaalin-nguatsiaraluallaqqooqigaminngamiaasiinngooq”.This means: ”There were reports that they apparently – God knows for how many times – once again had considered whatever I, my poor condition despite, still could be considered to be quite adept and resourceful as initiator to put a consortium togeth-er for the establishment of a range of small radio stations”
HERITAGE LOCATIONSGreenland has 5,088 known heritage
locations. Most are located in the top-soil, but don’t touch!
17
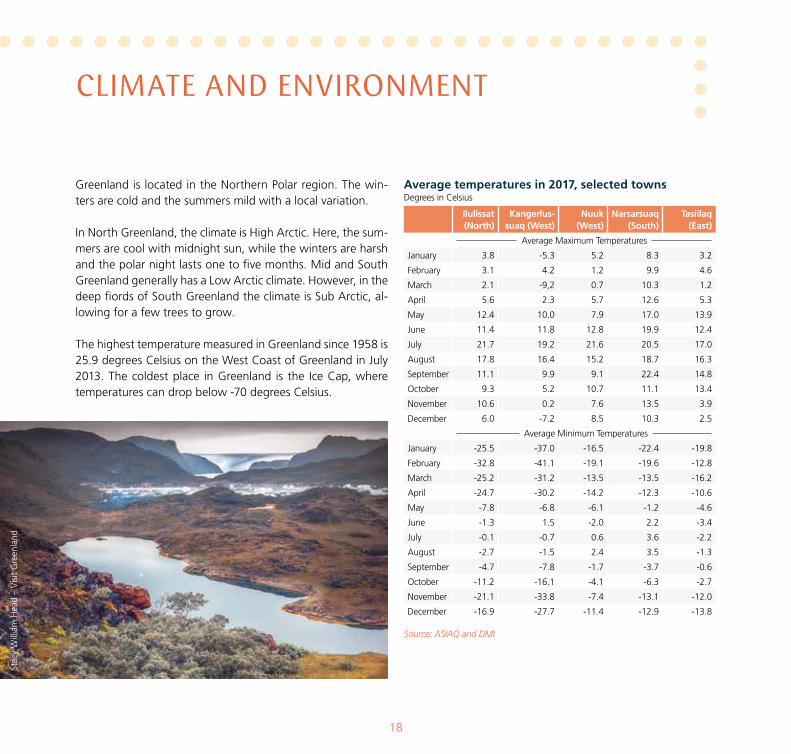
cliMate and environMent
Greenland is located in the Northern Polar region. The win-ters are cold and the summers mild with a local variation.
In North Greenland, the climate is High Arctic. Here, the sum-mers are cool with midnight sun, while the winters are harsh and the polar night lasts one to five months. Mid and South Greenland generally has a Low Arctic climate. However, in the deep fiords of South Greenland the climate is Sub Arctic, al-lowing for a few trees to grow.
The highest temperature measured in Greenland since 1958 is 25.9 degrees Celsius on the West Coast of Greenland in July 2013. The coldest place in Greenland is the Ice Cap, where temperatures can drop below -70 degrees Celsius.
Average temperatures in 2017, selected townsDegrees in Celsius
Ilulissat (North)
Kangerlus-suaq (West)
Nuuk (West)
Narsarsuaq (South)
Tasiilaq (East)
Average Maximum Temperatures
January 3.8 -5.3 5.2 8.3 3.2
February 3.1 4.2 1.2 9.9 4.6
March 2.1 -9,2 0.7 10.3 1.2
April 5.6 2.3 5.7 12.6 5.3
May 12.4 10.0 7.9 17.0 13.9
June 11.4 11.8 12.8 19.9 12.4
July 21.7 19.2 21.6 20.5 17.0
August 17.8 16.4 15.2 18.7 16.3
September 11.1 9.9 9.1 22.4 14.8
October 9.3 5.2 10.7 11.1 13.4
November 10.6 0.2 7.6 13.5 3.9
December 6.0 -7.2 8.5 10.3 2.5
Average Minimum Temperatures
January -25.5 -37.0 -16.5 -22.4 -19.8
February -32.8 -41.1 -19.1 -19.6 -12.8
March -25.2 -31.2 -13.5 -13.5 -16.2
April -24.7 -30.2 -14.2 -12.3 -10.6
May -7.8 -6.8 -6.1 -1.2 -4.6
June -1.3 1.5 -2.0 2.2 -3.4
July -0.1 -0.7 0.6 3.6 -2.2
August -2.7 -1.5 2.4 3.5 -1.3
September -4.7 -7.8 -1.7 -3.7 -0.6
October -11.2 -16.1 -4.1 -6.3 -2.7
November -21.1 -33.8 -7.4 -13.1 -12.0
December -16.9 -27.7 -11.4 -12.9 -13.8
Source: ASIAQ and DMI
Stac
y W
illia
m H
ead
– V
isit
Gre
enla
nd
18
Paul
Ziz
ka –
Vis
it G
reen
land
Due to the cold climate, Greenland has a large need for ener-gy. Since the 1990s, five hydropower plants have been built, supplying Nuuk, Qaqortoq/Narsaq, Sisimiut, Ilulissat and Tasiilaq. Before hydropower plants were introduced, power was produced from fossil fuels only. Smaller towns, settle-ments and outer districts still rely entirely on fossil fuels for production of electricity. A small amount of heating is pro-duced from incineration of waste in treatment plants.
Energy consumption and degree of self sufficiency
Source: http://bank.stat.gl/ENE1ACT
EMISSION OF GREENHOUSE GASIn 2016, the actual emission of greenhouse gases from energy consumption was 525,148 ton CO
2 equivalent. Compared to 1990, the ac-
tual emission of greenhouse gases from energy consumption has dropped 16.0 percent.
19
Consumption of fossil fuels
Consumption of renewable energy
Degree of self sufficiency
2012 2013 2014 2015 2016
Pct.100
80
60
40
20
0
transPortation
Transportation in Greenland is very different from the other Nordic countries. Due to the climate and geography, Green-land has no railroads or roads to connect towns and settle-ments. Passengers and goods are transported by sea or air only. Most towns have paved roads. Here, cars are the typical means of transportation. Bigger towns also have buses and taxies. Smaller towns and settlements usually have gravel or dirt roads only.
Number of registered motor vehicles in 2017
Buses Taxis CarsSnow-
mobilesOther motor
vehicles*
North Greenland
Qaanaaq - - 9 3 13Upernavik 1 1 21 139 16Uummannaq 0 6 62 12 37Ilulissat 13 33 333 159 259Qasigiannguit - 4 26 40 35Aasiaat 1 17 81 32 37Kangaatsiaq - - 4 - 1Qeqertarsuaq - 1 22 6 11
West Greenland
Sisimiut 12 21 560 572 356Maniitsoq 3 16 115 36 60Nuuk 42 87 2,937 290 1,544Paamiut 2 1 45 11 34
South Greenland
Narsaq - 6 44 5 29Nanortalik 1 1 24 1 19Qaqortoq 4 13 174 29 103
East Greenland
Tasiilaq 3 3 43 25 35Ittoqqortoormiit - - 1 42 27
* ATV and 4-wheelers, construction machineries, trucks, a motorcycle, trailer, emergency vehicles, vans and other unspecified vehicles.
Source: http://bank.stat.gl/ENEMO2DI
Greenland´s major airline company, Air Greenland, maintains international flight routes to Denmark and Iceland as well as all domestic flight and helicopter routes. The main gateway to Greenland is the former American air base Kangerlussuaq. Nuuk, Ilulissat and Kulusuk have Air Greenland routes bound for Iceland. Moreover, Air Iceland Connect maintains routes out of Reykjavik, bound for Nuuk, Ilulissat, Narsarsuaq, Ku-lusuk and Nerlerit Inaat/Ittoqqortoormiit.
Passenger traffic by Air2013 2014 2015 2016
Domestic traffic by plane 193,812 193,618 198,921 212,540
International traffic by plane 159,432 158,191 166,688 184,307
Helicopter traffic 44,612 44,611 41,675 41,239
Source: Greenland Airports
Greenland´s largest shipping company, Royal Arctic Line, has freight routes to towns and settlements. Arctic Umiaq Line´s passenger ship, Sarfaq Ittuk, maintains passenger routes on the West Coast most of the year. Several minor passenger routes also exist. Travel by sea to the far northern and eastern regions is impeded by the High Arctic sea ice during winter time. These areas only have ship arrivals from springtime to fall. Greenland has no international passenger ship routes, but is itself a popular destination for cruise ships from US, Canada and Europe.
AIRPORTS AND HARBOURS
Greenland has 13 airports and 43 helipads. The
entire country has 383 km paved road.
NORTH AND EAST GREENLANDIn the outer districts of North and East Greenland, snow mobiles and dog sleds are used for local transportation when the sea is covered by ice in winter time. In summer, dinghy boats are used.
Mad
s Pi
hl –
Vis
it G
reen
land
Source: Greenland Airports, ASIAQ
20
laBour Market
A large proportion of the Greenlandic labour market are pub-lic jobs, in the municipalities or Government of Greenland. In towns, most people work as employees. In the settlements, a large proportion are mainly huntsmen and fishermen. In gen-eral, the Greenlandic labour market follow the Scandinavian model, having employee- and employer organizations, wage agreements and an extensive legislation for worker protec-tion, arbitration, vacation and worker´s compensation. Per-sons without Danish or Nordic citizenship need a residence- and work permit.
Main employment by industry and nationality, 2015Total Greenland Denmark Other Nordic
countriesEurope Africa America Asia
Number of main employed persons in average per month
Total 25,620 22,214 2,993 124 63 8 20 193
Fishing, hunting & agriculture 4,085 3,887 169 14 2 2 - 10
Mining and quarrying 124 83 37 - 3 1 - -
Manufacturing 234 195 36 1 - - 1 1
Electricity and water supply 380 312 64 1 2 - 1 -
Construction 1,844 1,474 345 10 7 - 2 6
Wholesale 2,890 2,617 239 3 - - - 30
Hotels and restaurants 762 558 100 3 4 - - 98
Transportation 2,445 2,018 370 33 12 1 1 11
Business activities 1,332 961 335 7 3 1 4 21
Public administration and service 10,307 9,111 1,120 28 23 3 9 11
Other industries 914 777 122 4 2 - 2 6
Activity not stated 301 221 55 19 6 - 1 -
Source: http://bank.stat.gl/AREBFB7
CHOICE OF PROFESSION
Around 40 percent of all jobs are found in the public sector. More
than 60 percent of employed women are working in the public sector. For
men, fishing, hunting, agriculture and public administration and service are the most popular
choices.
Source: Greenland Airports, ASIAQ
21
Rebe
cca
Gus
tafs
son
– V
isit
Gre
enla
nd
Unemployment rate by age and quarter, 2015
Source: http://bank.stat.gl/ARELED4
Unemployment and educational backgroundThe unemployed part of the work force has a high proportion of unskilled workers. Around 84 percent have no education apart from primary school. The unemployment rate for all other workforce segments are below the 9.1 percent national average. For the higher educations, the unemployment rate is very low.
Another distinct feature in the Greenlandic labour market is a large seasonal variation in employment, due to the climate and the geographic dispersion, which limits mobility.
Pct.
22
60-64 years
55-5950-54
45-4940-44
35-3930-34
25-2920-24
18-19
28
24
20
16
12
8
4
0
1. quarter2. quarter3. quarter4. quarter
Business
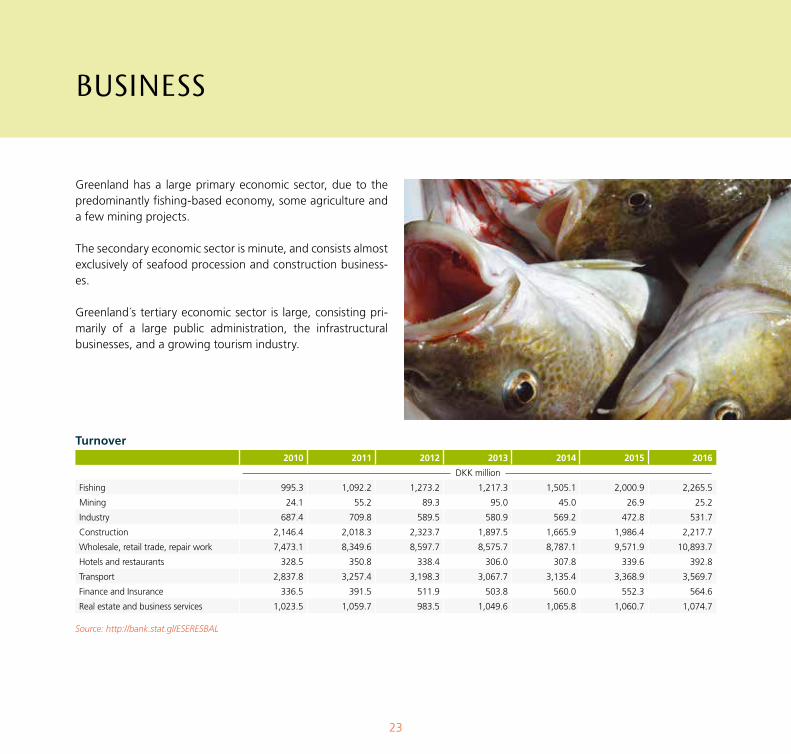
Greenland has a large primary economic sector, due to the predominantly fishing-based economy, some agriculture and a few mining projects.
The secondary economic sector is minute, and consists almost exclusively of seafood procession and construction business-es.
Greenland´s tertiary economic sector is large, consisting pri-marily of a large public administration, the infrastructural businesses, and a growing tourism industry.
Turnover 2010 2011 2012 2013 2014 2015 2016
DKK million
Fishing 995.3 1,092.2 1,273.2 1,217.3 1,505.1 2,000.9 2,265.5
Mining 24.1 55.2 89.3 95.0 45.0 26.9 25.2
Industry 687.4 709.8 589.5 580.9 569.2 472.8 531.7
Construction 2,146.4 2,018.3 2,323.7 1,897.5 1,665.9 1,986.4 2,217.7
Wholesale, retail trade, repair work 7,473.1 8,349.6 8,597.7 8,575.7 8,787.1 9,571.9 10,893.7
Hotels and restaurants 328.5 350.8 338.4 306.0 307.8 339.6 392.8
Transport 2,837.8 3,257.4 3,198.3 3,067.7 3,135.4 3,368.9 3,569.7
Finance and Insurance 336.5 391.5 511.9 503.8 560.0 552.3 564.6
Real estate and business services 1,023.5 1,059.7 983.5 1,049.6 1,065.8 1,060.7 1,074.7
Source: http://bank.stat.gl/ESERESBAL
23
The distribution of the primary and secondary sectors varies from town to settlement, with the primary sector being mark-edly larger in settlements than in towns, and the secondary being small in towns and almost non-existent in settlements. The tertiary sector comprises no less than 2/3 of gross value added.
Profit or loss before tax
2010 2011 2012 2013 2014 2015 2016
DKK million
Fishing 81.1 179.1 265.8 157.3 142.2 269.3 495.5
Mining -77.9 120.7 -146.7 -80.3 -28.9 -160.7 -59.3
Industry 54.5 67.7 80.9 36.8 20.7 33.8 62.1
Construction 112.2 76.1 21.1 58.3 3.9 92.7 82.3
Wholesale, retail trade, repair work 229.2 407.1 415.2 380.0 407.9 633.7 630.3
Hotels and restaurants 24.4 18.6 15.4 4.9 9.4 15.1 32.6
Transport 196.9 281.7 226.3 141.1 196.3 268.5 332.0
Finance and Insurance 114.3 82.0 158.6 131.9 123.7 38.1 150.2
Real estate and business services 58.9 60.8 24.8 74.9 68.6 -166.1 226.5
Source: http://bank.stat.gl/ESERESBAL
BUSINESS IN GREENLANDGreenland´s business life is dominated by large publicly owned
enterprises. The largest companies with a 100 percent self-rule ownership are Royal Greenland A/S (fishing
industry), KNI A/S (retail and oil business), Royal Arctic Line A/S (shipping) and Tele Greenland
A/S (telecommunications).
PRIMARY, SECONDARY AND TERTIARY SECTORSThe primary economic sector extracts or collects natural resources. It includes fish-ing, hunting, agriculture and mining. The secondary economic sector includes in-dustries that manufacture finished, usable products or are involved in construction. The tertiary economic sector produces services, rather than products. It includes administration, education, tourism, infrastructural services and public health.
24
Mads Pihl – Visit Greenland
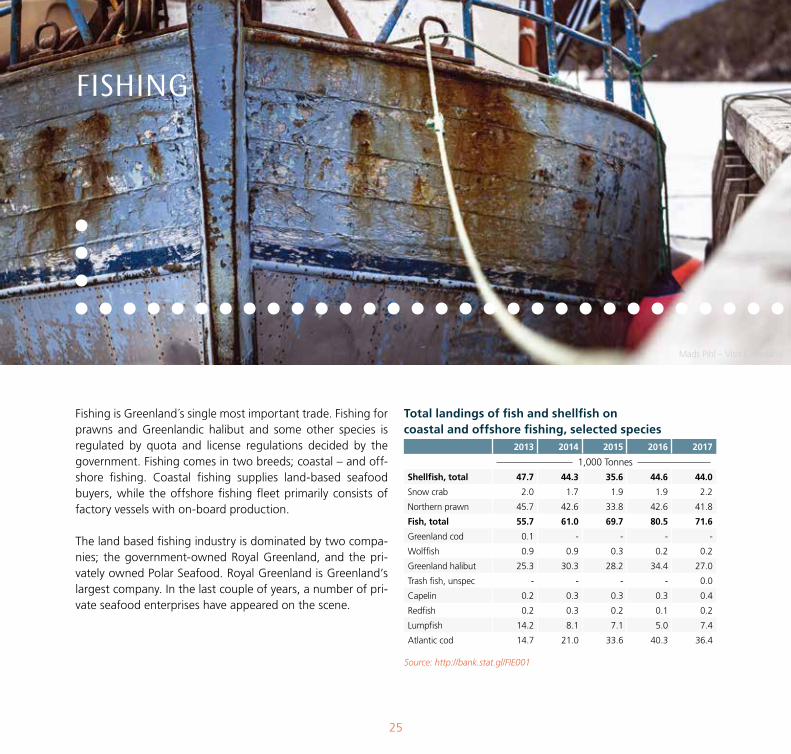
FishinG
Fishing is Greenland´s single most important trade. Fishing for prawns and Greenlandic halibut and some other species is regulated by quota and license regulations decided by the government. Fishing comes in two breeds; coastal – and off-shore fishing. Coastal fishing supplies land-based seafood buyers, while the offshore fishing fleet primarily consists of factory vessels with on-board production.
The land based fishing industry is dominated by two compa-nies; the government-owned Royal Greenland, and the pri-vately owned Polar Seafood. Royal Greenland is Greenland’s largest company. In the last couple of years, a number of pri-vate seafood enterprises have appeared on the scene.
Total landings of fish and shellfish on coastal and offshore fishing, selected species
2013 2014 2015 2016 2017
1,000 Tonnes
Shellfish, total 47.7 44.3 35.6 44.6 44.0
Snow crab 2.0 1.7 1.9 1.9 2.2
Northern prawn 45.7 42.6 33.8 42.6 41.8
Fish, total 55.7 61.0 69.7 80.5 71.6
Greenland cod 0.1 - - - -
Wolffish 0.9 0.9 0.3 0.2 0.2
Greenland halibut 25.3 30.3 28.2 34.4 27.0
Trash fish, unspec - - - - 0.0
Capelin 0.2 0.3 0.3 0.3 0.4
Redfish 0.2 0.3 0.2 0.1 0.2
Lumpfish 14.2 8.1 7.1 5.0 7.4
Atlantic cod 14.7 21.0 33.6 40.3 36.4
Source: http://bank.stat.gl/FIE001
25
Total catch of fish and shellfish on offshore fishing, Greenlandic vessels
2013 2014 2015 2016 2017
1,000 Tonnes
Greenland halibut 9.5 7.3 9.6 7.6 10.7
Atlantic cod 10.7 10.3 12.6 16 17.8
Capelin 27.7 22.4 43.8 3.3 28.7
Atlantic halibut - - - - -
Haddock 1.6 1.1 1.1 1.4 1.4
Herring 12.1 13.2 12.4 17.8 12.8
Icelandic scallop 0.6 0.6 0.8 0.7 0.5
Mixed fish 0.7 1.3 3.1 5.1 2.4
Saithe 1 0.4 0.4 0.6 0.4
Deep sea prawn 32.7 37 33 35.7 42.2
Redfish 5.8 4.7 4.9 5.5 4.7
Catfishes - - - - 0.1
Blue whiting 2.1 6.5 5.7 12.7 20.6
Mackerel 52.8 78.7 30.7 35.8 46.3
Other species - - 0.9 0.2 1
Source: http://bank.stat.gl/FIE008
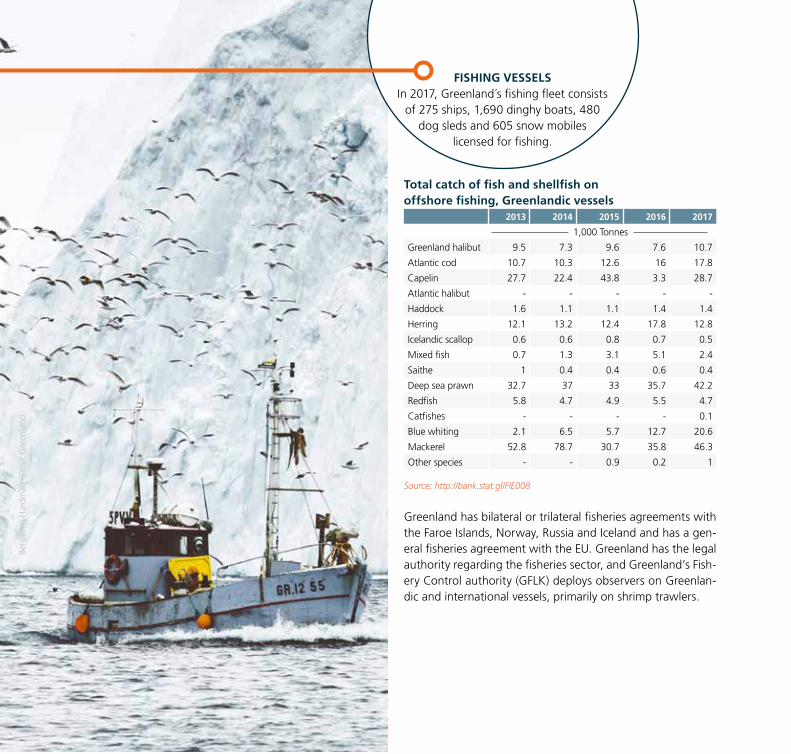
Greenland has bilateral or trilateral fisheries agreements with the Faroe Islands, Norway, Russia and Iceland and has a gen-eral fisheries agreement with the EU. Greenland has the legal authority regarding the fisheries sector, and Greenland’s Fish-ery Control authority (GFLK) deploys observers on Greenlan-dic and international vessels, primarily on shrimp trawlers.
FISHING VESSELSIn 2017, Greenland´s fishing fleet consists
of 275 ships, 1,690 dinghy boats, 480 dog sleds and 605 snow mobiles
licensed for fishing.
Benj
amin
Har
dman
– V
isit
Gre
enla
nd
Tikk
i Gei
sler
– V
isit
Gre
enla
nd
huntinG
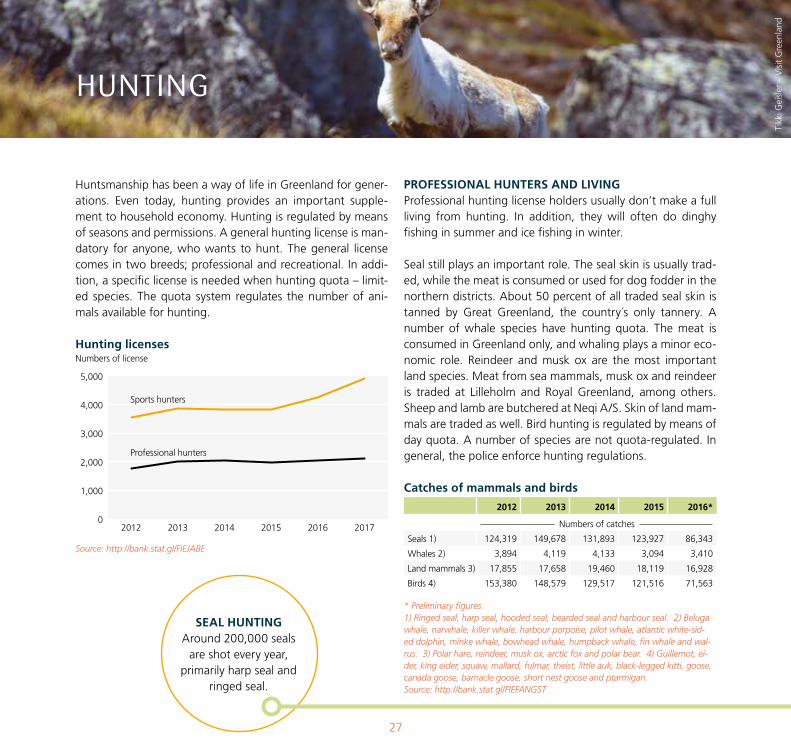
Huntsmanship has been a way of life in Greenland for gener-ations. Even today, hunting provides an important supple-ment to household economy. Hunting is regulated by means of seasons and permissions. A general hunting license is man-datory for anyone, who wants to hunt. The general license comes in two breeds; professional and recreational. In addi-tion, a specific license is needed when hunting quota – limit-ed species. The quota system regulates the number of ani-mals available for hunting.
Hunting licenses
Source: http://bank.stat.gl/FIEJABE
PROFESSIONAL HUNTERS AND LIVINGProfessional hunting license holders usually don’t make a full living from hunting. In addition, they will often do dinghy fishing in summer and ice fishing in winter.
Seal still plays an important role. The seal skin is usually trad-ed, while the meat is consumed or used for dog fodder in the northern districts. About 50 percent of all traded seal skin is tanned by Great Greenland, the country´s only tannery. A number of whale species have hunting quota. The meat is consumed in Greenland only, and whaling plays a minor eco-nomic role. Reindeer and musk ox are the most important land species. Meat from sea mammals, musk ox and reindeer is traded at Lilleholm and Royal Greenland, among others. Sheep and lamb are butchered at Neqi A/S. Skin of land mam-mals are traded as well. Bird hunting is regulated by means of day quota. A number of species are not quota-regulated. In general, the police enforce hunting regulations.
Catches of mammals and birds
2012 2013 2014 2015 2016*
Numbers of catches
Seals 1) 124,319 149,678 131,893 123,927 86,343
Whales 2) 3,894 4,119 4,133 3,094 3,410
Land mammals 3) 17,855 17,658 19,460 18,119 16,928
Birds 4) 153,380 148,579 129,517 121,516 71,563
* Preliminary figures1) Ringed seal, harp seal, hooded seal, bearded seal and harbour seal. 2) Beluga whale, narwhale, killer whale, harbour porpoise, pilot whale, atlantic white-sid-ed dolphin, minke whale, bowhead whale, humpback whale, fin whale and wal-rus. 3) Polar hare, reindeer, musk ox, arctic fox and polar bear. 4) Guillemot, ei-der, king eider, squaw, mallard, fulmar, theist, little auk, black-legged kitti, goose, canada goose, barnacle goose, short nest goose and ptarmigan.Source: http://bank.stat.gl/FIEFANGST
SEAL HUNTINGAround 200,000 seals
are shot every year, primarily harp seal and
ringed seal.
Numbers of license
27
5,000
4,000
3,000
2,000
1,000
02012 2013 2014 2015 2016 2017
Sports hunters
Professional hunters
Mad
s Pi
hl –
Vis
it G
reen
land
aGriculture
Greenland´s agriculture is mainly based on sheep farming, with summer grazing of sheep and lamb. A modest number of poultry, bees, horses and cattle are held, plus a few thou-sand domesticated reindeer. Winter feed for animals is grown, along with potatoes and vegetables for the home market. Agriculture exists almost only in the fiords of South Green-land, due to the region´s sub-arctic climate.
In a historical context, Greenlandic agriculture dates back to the Late Viking Age, where Norse settlers colonized South-west Greenland in 986 and lived there up til mid 15th century. In 1782, today’s sheep farming tradition was founded in Iga-liku, literally on the ancient Norse fields as a hobby business. In 1924 the first full-scale farm was established at Erik the Red's old settlement in Qassiarsuk.
Livestock2006 2008 2010 2012 2014 2016
Number of animals
Sheep 20,963 20,499 20,729 20,107 18,738 18,190
Tame reindeer 3,100 2,500 3,000 3,000 3,000 3,000
Cows 20 49 65 98 143 155
Horses 202 203 164 147 123 137
Fowls 147 148 241 212 174 211
Beehives 13 10 … 4 4 6
Source: Agricultural Consulting Services
Over the last decades, sheep farms have become fewer and bigger, and often two or three generations join forces on run-ning a farm.
Upernaviarsuk is South Greenland´s experimental farm. Here, an arctic climate test program is carried out for most common crops and winter feeds. Upernaviarsuk also runs an agricultur-al school, offering educations in sheep farming, production gardening and greenhouse gardening.
Farms by location
Source: Agricultural Consulting Services
UNESCO WORLD HERITAGEThe 350 sq. km cultural and agricultural Kujataa landscape in South Greenland was inscribed as UN-ESCO World Heritage in 2017. Kujataa consists of five areas around the Tunulliarfik and Igaliku Fiords.
28
NarsaqQaqortoq
NanortalikPaamiut
Nuuk
2004 2006 2008 2010 2012 2014 2016
35
30
25
20
15
0
Numbers of farms
Mad
s Pi
hl –
Vis
it G
reen
land
tourisM
Tourists enter Greenland by cruise ship or international flights into Ilulissat, Kangerlussuaq, Nuuk, Narsarsuaq, Kulusuk or Nerlerit Inaat in Ittoqqortoormiit. Inside Greenland, travelling usually means a combination of flight and ship. Cruise season generally runs from spring to fall. Outdoor tourism also peaks in the summer season, but maintains some activity in winter as well.
Numbers of flight and cruise passengers by season
2013 2014 2015 2016 2017
International flight passengers
Winter 1) 10,027 10,278 10,666 11,561 12,059
Spring 2) 14,093 13,940 14,434 15,756 16,059
Summer 3) 31,482 32,053 34,528 37,174 37,653
Autumn 4) 13,453 13,309 15,692 16,315 17,716
Cruise passengers
Winter 1) - - - - -
Spring 2) 206 293 163 562 185
Summer 3) 9,564 13,594 15,791 17,089 17,506
Autumn 4) 11,726 6,327 9,095 6,593 9,734
Note: International flight passengers include residents in Greenland. 1) December, January and February 2) March, April and May 3) June, July and August 4) September, October and November.
Source: http://bank.stat.gl/TUEUPAX and http://bank.stat.gl/TUEKRP
29
International flight passengers In 2017, a total of 89,892 flight passengers travelled out of Greenland. About 37 percent of these were Greenland resi-dents.
Accommodation standards differ; from hotels to bed and breakfasts in towns, to private accommodation in settle-ments. Camping is an option too, though it requires prepara-tion.
Hotel guests by nationality
2013 2014 2015 2016 2017
Number of guests
Greenland 44,270 43,277 48,934 57,501 63,393
Nordic countries 23,216 21,852 22,281 23,918 25,493
Germany 2,252 2,668 2,958 2,440 3,150
France 733 555 660 748 1,250
Italy 198 291 391 365 524
The Netherlands 243 281 247 253 331
Great Britain 1,022 855 1,259 1,595 1,826
Rest of Europa 1,746 2,612 1,944 2,035 3,384
USA 2,915 3,050 2,372 2,767 2,178
Japan 286 393 517 583 429
Canada 641 599 513 716 923
Other countries 3,714 3,440 5,149 3,301 6,870
Source: http://bank.stat.gl/TUEHOT
The Disko Bay area has the predominant part of cruise tour-ism and hotel stays, and is the best developed tourism market in Greenland. It also has the highest number of tourism oper-ators. The Kangerlussuaq and Narsarsuaq airports were built as American Cold-War military airports, and later on given to Greenland. They are located far inland, where weather is more stable. This makes them good hubs for outdoor tour-ism. Kulusuk in East Greenland has many one-day visits from Iceland. East Greenland is also a popular destination for ad-vanced outdoor tourists. A few outdoor tourists dare venture across the Ice Cap, usually between Kangerlussuaq and Tasiilaq. This requires a special permit from the government.
UNESCO WORLD HERITAGE
The Ilulissat Icefiord (Sermeq Kujalleq) has been UNESCO World Heritage since 2004. It is the size of
66,000 soccer fields. Every day it produces an amount of ice equal
to New York´s yearly water consumption.
THE WORLD’S LARGEST NATIONAL PARKThe World´s largest National Park is North East Greenland, with an area of 972,000 km². The only residents are the Sirius dog sled special force and weather stations staff.
30
incoMe
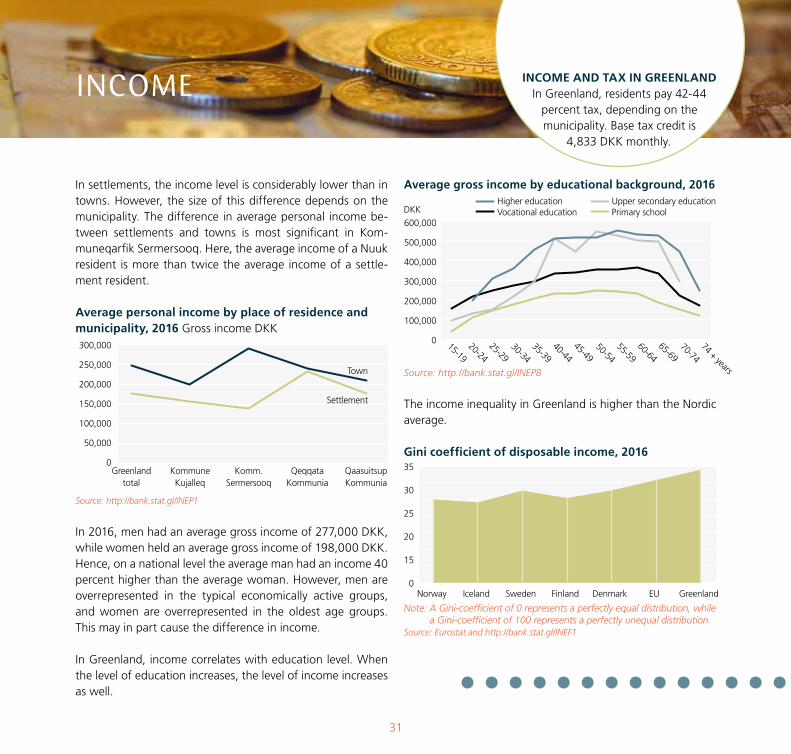
In settlements, the income level is considerably lower than in towns. However, the size of this difference depends on the municipality. The difference in average personal income be-tween settlements and towns is most significant in Kom-muneqarfik Sermersooq. Here, the average income of a Nuuk resident is more than twice the average income of a settle-ment resident.
Average personal income by place of residence and municipality, 2016 Gross income DKK
Source: http://bank.stat.gl/INEP1
In 2016, men had an average gross income of 277,000 DKK, while women held an average gross income of 198,000 DKK. Hence, on a national level the average man had an income 40 percent higher than the average woman. However, men are overrepresented in the typical economically active groups, and women are overrepresented in the oldest age groups. This may in part cause the difference in income.
In Greenland, income correlates with education level. When the level of education increases, the level of income increases as well.
Average gross income by educational background, 2016
Source: http://bank.stat.gl/INEP8
The income inequality in Greenland is higher than the Nordic average.
Gini coefficient of disposable income, 2016
Note: A Gini-coefficient of 0 represents a perfectly equal distribution, while a Gini-coefficient of 100 represents a perfectly unequal distribution.
Source: Eurostat and http://bank.stat.gl/INEF1
Greenland total
Kommune Kujalleq
Komm. Sermersooq
Qeqqata Kommunia
Qaasuitsup Kommunia
INCOME AND TAX IN GREENLANDIn Greenland, residents pay 42-44
percent tax, depending on the municipality. Base tax credit is
4,833 DKK monthly.
31
300,000
250,000
200,000
150,000
100,000
50,000
0
600,000
500,000
400,000
300,000
200,000
100,000
0
Norway Iceland Sweden Finland Denmark EU Greenland
35
30
25
20
15
0
74 + years
70-74
65-6960-64
55-5950-54
45-49
40-4435-39
30-34
25-29
20-24
15-19
Higher education Upper secondary educationVocational education Primary school
Town
Settlement
DKK
Prices
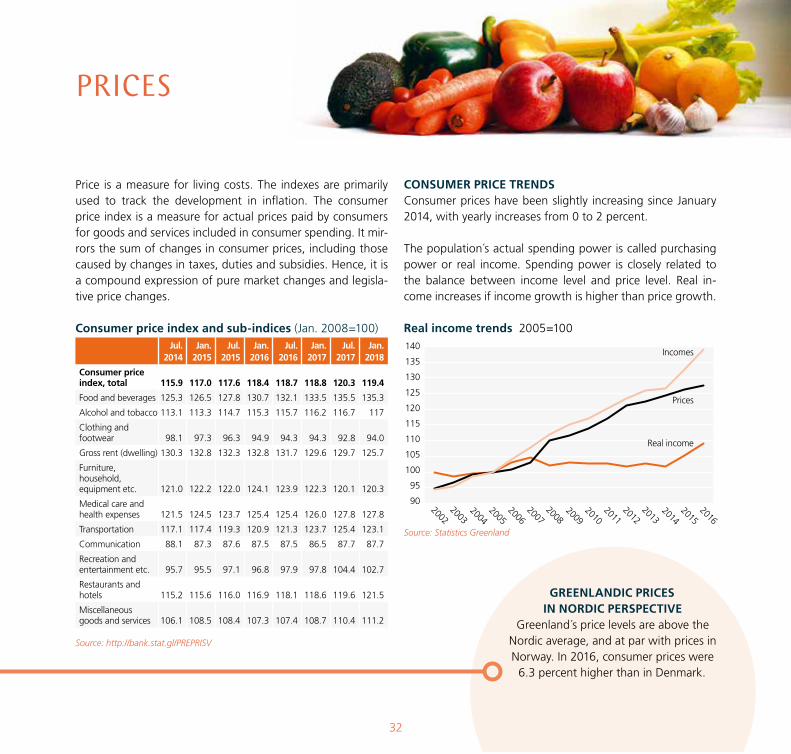
Price is a measure for living costs. The indexes are primarily used to track the development in inflation. The consumer price index is a measure for actual prices paid by consumers for goods and services included in consumer spending. It mir-rors the sum of changes in consumer prices, including those caused by changes in taxes, duties and subsidies. Hence, it is a compound expression of pure market changes and legisla-tive price changes.
Consumer price index and sub-indices (Jan. 2008=100)Jul.
2014Jan.
2015Jul.
2015Jan.
2016Jul.
2016Jan.
2017Jul.
2017Jan.
2018
Consumer price index, total 115.9 117.0 117.6 118.4 118.7 118.8 120.3 119.4
Food and beverages 125.3 126.5 127.8 130.7 132.1 133.5 135.5 135.3
Alcohol and tobacco 113.1 113.3 114.7 115.3 115.7 116.2 116.7 117
Clothing and footwear 98.1 97.3 96.3 94.9 94.3 94.3 92.8 94.0
Gross rent (dwelling) 130.3 132.8 132.3 132.8 131.7 129.6 129.7 125.7
Furniture, household, equipment etc. 121.0 122.2 122.0 124.1 123.9 122.3 120.1 120.3
Medical care and health expenses 121.5 124.5 123.7 125.4 125.4 126.0 127.8 127.8
Transportation 117.1 117.4 119.3 120.9 121.3 123.7 125.4 123.1
Communication 88.1 87.3 87.6 87.5 87.5 86.5 87.7 87.7
Recreation and entertainment etc. 95.7 95.5 97.1 96.8 97.9 97.8 104.4 102.7
Restaurants and hotels 115.2 115.6 116.0 116.9 118.1 118.6 119.6 121.5
Miscellaneous goods and services 106.1 108.5 108.4 107.3 107.4 108.7 110.4 111.2
Source: http://bank.stat.gl/PREPRISV
CONSUMER PRICE TRENDSConsumer prices have been slightly increasing since January 2014, with yearly increases from 0 to 2 percent.
The population´s actual spending power is called purchasing power or real income. Spending power is closely related to the balance between income level and price level. Real in-come increases if income growth is higher than price growth.
Real income trends 2005=100
Source: Statistics Greenland
GREENLANDIC PRICES IN NORDIC PERSPECTIVE
Greenland´s price levels are above the Nordic average, and at par with prices in Norway. In 2016, consumer prices were
6.3 percent higher than in Denmark.
32
140
135
130
125
120
115
110
105
100
95
902016
20152014
20132012
20112010
20092008
20072006
20052004
20032002
Incomes
Prices
Real income
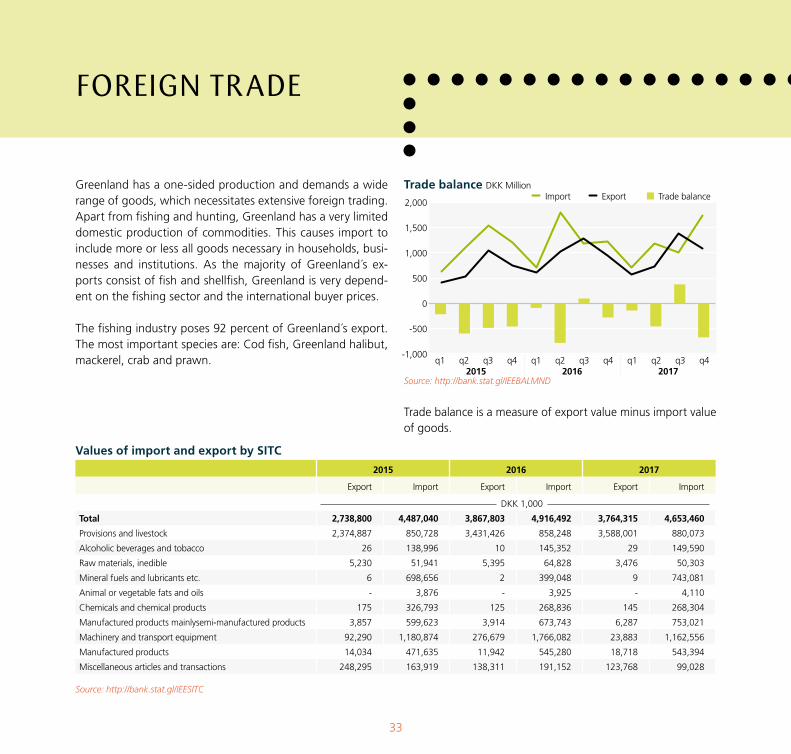
Greenland has a one-sided production and demands a wide range of goods, which necessitates extensive foreign trading. Apart from fishing and hunting, Greenland has a very limited domestic production of commodities. This causes import to include more or less all goods necessary in households, busi-nesses and institutions. As the majority of Greenland´s ex-ports consist of fish and shellfish, Greenland is very depend-ent on the fishing sector and the international buyer prices.
The fishing industry poses 92 percent of Greenland´s export. The most important species are: Cod fish, Greenland halibut, mackerel, crab and prawn.
Values of import and export by SITC
2015 2016 2017
Export Import Export Import Export Import
DKK 1,000
Total 2,738,800 4,487,040 3,867,803 4,916,492 3,764,315 4,653,460
Provisions and livestock 2,374,887 850,728 3,431,426 858,248 3,588,001 880,073
Alcoholic beverages and tobacco 26 138,996 10 145,352 29 149,590
Raw materials, inedible 5,230 51,941 5,395 64,828 3,476 50,303
Mineral fuels and lubricants etc. 6 698,656 2 399,048 9 743,081
Animal or vegetable fats and oils - 3,876 - 3,925 - 4,110
Chemicals and chemical products 175 326,793 125 268,836 145 268,304
Manufactured products mainlysemi-manufactured products 3,857 599,623 3,914 673,743 6,287 753,021
Machinery and transport equipment 92,290 1,180,874 276,679 1,766,082 23,883 1,162,556
Manufactured products 14,034 471,635 11,942 545,280 18,718 543,394
Miscellaneous articles and transactions 248,295 163,919 138,311 191,152 123,768 99,028
Source: http://bank.stat.gl/IEESITC
Trade balance DKK Million
Source: http://bank.stat.gl/IEEBALMND
Trade balance is a measure of export value minus import value of goods.
ForeiGn trade
33
2,000
1,500
1,000
500
0
-500
-1,000q1 q2 q3 q4 q1 q2 q3 q4 q1 q2 q3 q4
2015 2016 2017
Import Export Trade balance
Rebecca Gustafsson – Visit Greenland
PuBlic Finances
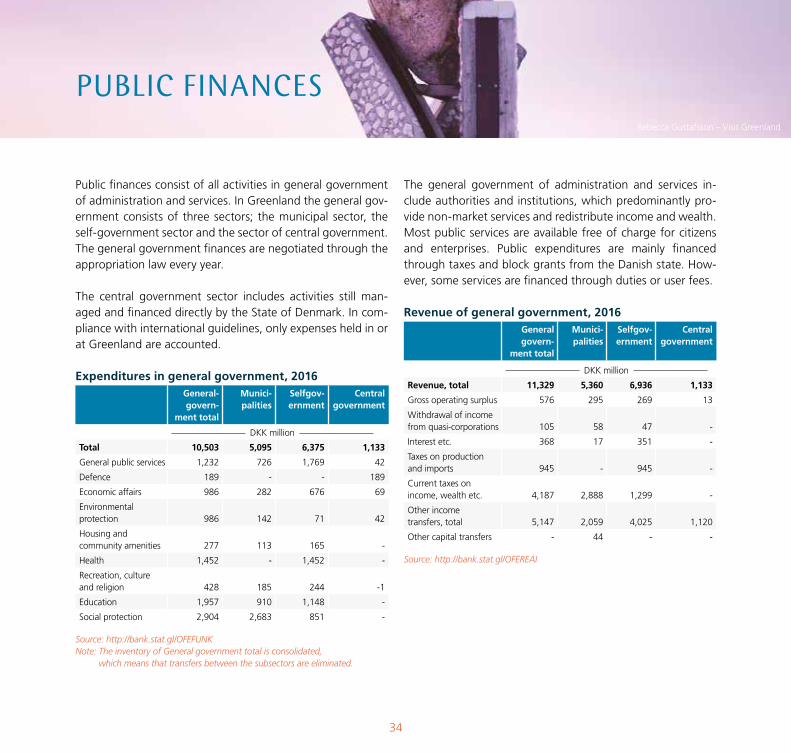
Public finances consist of all activities in general government of administration and services. In Greenland the general gov-ernment consists of three sectors; the municipal sector, the self-government sector and the sector of central government. The general government finances are negotiated through the appropriation law every year.
The central government sector includes activities still man-aged and financed directly by the State of Denmark. In com-pliance with international guidelines, only expenses held in or at Greenland are accounted.
Expenditures in general government, 2016General-govern-
ment total
Munici-palities
Selfgov-ernment
Central government
DKK million
Total 10,503 5,095 6,375 1,133
General public services 1,232 726 1,769 42
Defence 189 - - 189
Economic affairs 986 282 676 69
Environmental protection 986 142 71 42
Housing and community amenities 277 113 165 -
Health 1,452 - 1,452 -
Recreation, culture and religion 428 185 244 -1
Education 1,957 910 1,148 -
Social protection 2,904 2,683 851 -
Source: http://bank.stat.gl/OFEFUNK Note: The inventory of General government total is consolidated,
which means that transfers between the subsectors are eliminated.
The general government of administration and services in-clude authorities and institutions, which predominantly pro-vide non-market services and redistribute income and wealth. Most public services are available free of charge for citizens and enterprises. Public expenditures are mainly financed through taxes and block grants from the Danish state. How-ever, some services are financed through duties or user fees.
Revenue of general government, 2016General
govern-ment total
Munici-palities
Selfgov-ernment
Central government
DKK million
Revenue, total 11,329 5,360 6,936 1,133
Gross operating surplus 576 295 269 13
Withdrawal of income from quasi-corporations 105 58 47 -
Interest etc. 368 17 351 -
Taxes on production and imports 945 - 945 -
Current taxes on income, wealth etc. 4,187 2,888 1,299 -
Other income transfers, total 5,147 2,059 4,025 1,120
Other capital transfers - 44 - -
Source: http://bank.stat.gl/OFEREAI
34
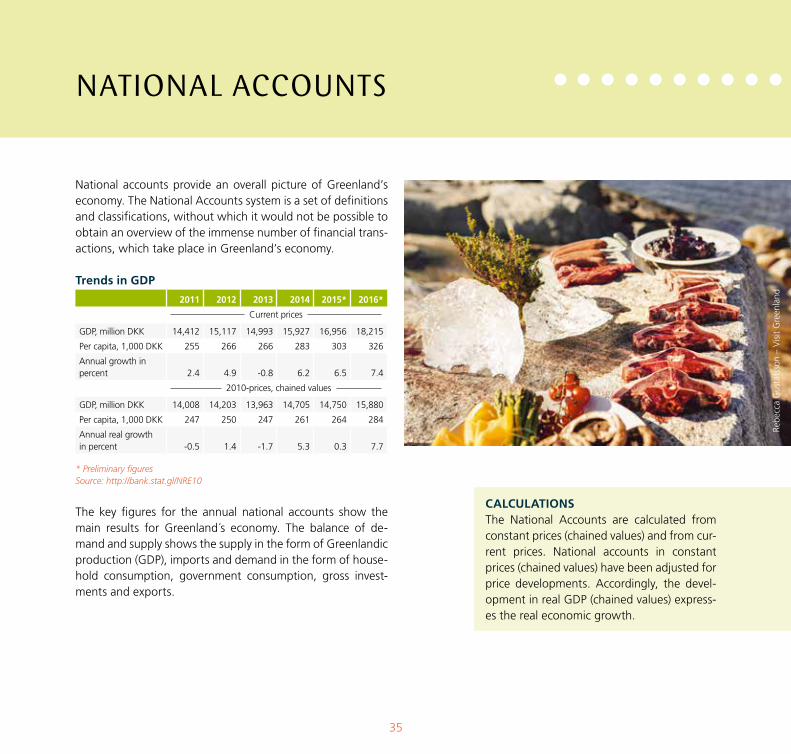
National accounts provide an overall picture of Greenland’s economy. The National Accounts system is a set of definitions and classifications, without which it would not be possible to obtain an overview of the immense number of financial trans-actions, which take place in Greenland’s economy.
Trends in GDP
2011 2012 2013 2014 2015* 2016*
Current prices
GDP, million DKK 14,412 15,117 14,993 15,927 16,956 18,215
Per capita, 1,000 DKK 255 266 266 283 303 326
Annual growth in percent 2.4 4.9 -0.8 6.2 6.5 7.4
2010-prices, chained values
GDP, million DKK 14,008 14,203 13,963 14,705 14,750 15,880
Per capita, 1,000 DKK 247 250 247 261 264 284
Annual real growth in percent -0.5 1.4 -1.7 5.3 0.3 7.7
* Preliminary figuresSource: http://bank.stat.gl/NRE10
The key figures for the annual national accounts show the main results for Greenland´s economy. The balance of de-mand and supply shows the supply in the form of Greenlandic production (GDP), imports and demand in the form of house-hold consumption, government consumption, gross invest-ments and exports.
national accounts
Rebe
cca
Gus
tafs
son
– V
isit
Gre
enla
nd
CALCULATIONSThe National Accounts are calculated from constant prices (chained values) and from cur-rent prices. National accounts in constant prices (chained values) have been adjusted for price developments. Accordingly, the devel-opment in real GDP (chained values) express-es the real economic growth.
35
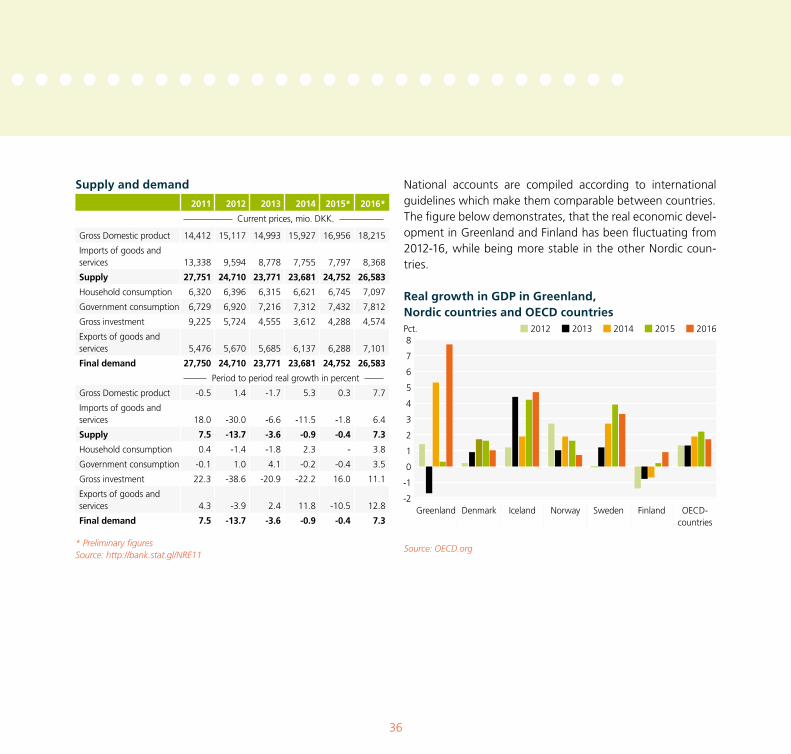
Supply and demand
2011 2012 2013 2014 2015* 2016*
Current prices, mio. DKK.
Gross Domestic product 14,412 15,117 14,993 15,927 16,956 18,215
Imports of goods and services 13,338 9,594 8,778 7,755 7,797 8,368
Supply 27,751 24,710 23,771 23,681 24,752 26,583
Household consumption 6,320 6,396 6,315 6,621 6,745 7,097
Government consumption 6,729 6,920 7,216 7,312 7,432 7,812
Gross investment 9,225 5,724 4,555 3,612 4,288 4,574
Exports of goods and services 5,476 5,670 5,685 6,137 6,288 7,101
Final demand 27,750 24,710 23,771 23,681 24,752 26,583
Period to period real growth in percent
Gross Domestic product -0.5 1.4 -1.7 5.3 0.3 7.7
Imports of goods and services 18.0 -30.0 -6.6 -11.5 -1.8 6.4
Supply 7.5 -13.7 -3.6 -0.9 -0.4 7.3
Household consumption 0.4 -1.4 -1.8 2.3 - 3.8
Government consumption -0.1 1.0 4.1 -0.2 -0.4 3.5
Gross investment 22.3 -38.6 -20.9 -22.2 16.0 11.1
Exports of goods and services 4.3 -3.9 2.4 11.8 -10.5 12.8
Final demand 7.5 -13.7 -3.6 -0.9 -0.4 7.3
* Preliminary figuresSource: http://bank.stat.gl/NRE11
National accounts are compiled according to international guidelines which make them comparable between countries. The figure below demonstrates, that the real economic devel-opment in Greenland and Finland has been fluctuating from 2012-16, while being more stable in the other Nordic coun-tries.
Real growth in GDP in Greenland, Nordic countries and OECD countries
Source: OECD.org
36
2012 2013 2014 2015 20168
7
6
5
4
3
2
1
0
-1
-2Greenland Denmark Iceland Norway Sweden Finland OECD-
countries
Pct.
key FiGures
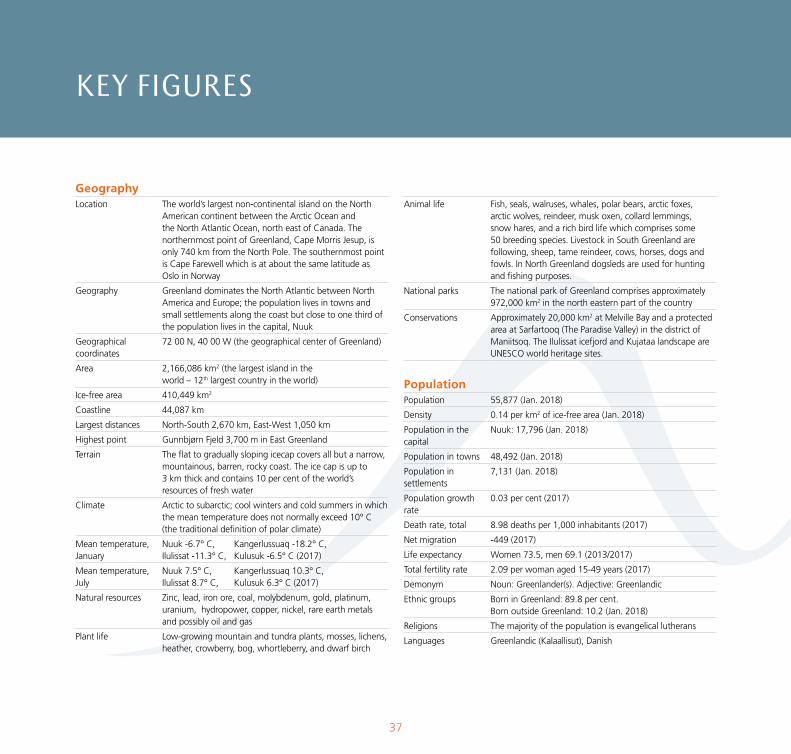
GeographyLocation The world’s largest non-continental island on the North
American continent between the Arctic Ocean and the North Atlantic Ocean, north east of Canada. The northernmost point of Greenland, Cape Morris Jesup, is only 740 km from the North Pole. The southernmost point is Cape Farewell which is at about the same latitude as Oslo in Norway
Geography Greenland dominates the North Atlantic between North America and Europe; the population lives in towns and small settlements along the coast but close to one third of the population lives in the capital, Nuuk
Geographical coordinates
72 00 N, 40 00 W (the geographical center of Greenland)
Area 2,166,086 km2 (the largest island in the world – 12th largest country in the world)
Ice-free area 410,449 km2
Coastline 44,087 km
Largest distances North-South 2,670 km, East-West 1,050 km
Highest point Gunnbjørn Fjeld 3,700 m in East Greenland
Terrain The flat to gradually sloping icecap covers all but a narrow, mountainous, barren, rocky coast. The ice cap is up to 3 km thick and contains 10 per cent of the world’s resources of fresh water
Climate Arctic to subarctic; cool winters and cold summers in which the mean temperature does not normally exceed 10° C (the traditional definition of polar climate)
Mean temperature, January
Nuuk -6.7° C, Kangerlussuaq -18.2° C, Ilulissat -11.3° C, Kulusuk -6.5° C (2017)
Mean temperature, July
Nuuk 7.5° C, Kangerlussuaq 10.3° C, Ilulissat 8.7° C, Kulusuk 6.3° C (2017)
Natural resources Zinc, lead, iron ore, coal, molybdenum, gold, platinum, uranium, hydropower, copper, nickel, rare earth metals and possibly oil and gas
Plant life Low-growing mountain and tundra plants, mosses, lichens, heather, crowberry, bog, whortleberry, and dwarf birch
Animal life Fish, seals, walruses, whales, polar bears, arctic foxes, arctic wolves, reindeer, musk oxen, collard lemmings, snow hares, and a rich bird life which comprises some 50 breeding species. Livestock in South Greenland are following, sheep, tame reindeer, cows, horses, dogs and fowls. In North Greenland dogsleds are used for hunting and fishing purposes.
National parks The national park of Greenland comprises approximately 972,000 km2 in the north eastern part of the country
Conservations Approximately 20,000 km2 at Melville Bay and a protected area at Sarfartooq (The Paradise Valley) in the district of Maniitsoq. The Ilulissat icefjord and Kujataa landscape are UNESCO world heritage sites.
Population
Population 55,877 (Jan. 2018)
Density 0.14 per km2 of ice-free area (Jan. 2018)
Population in the capital
Nuuk: 17,796 (Jan. 2018)
Population in towns 48,492 (Jan. 2018)
Population in settlements
7,131 (Jan. 2018)
Population growth rate
0.03 per cent (2017)
Death rate, total 8.98 deaths per 1,000 inhabitants (2017)
Net migration -449 (2017)
Life expectancy Women 73.5, men 69.1 (2013/2017)
Total fertility rate 2.09 per woman aged 15-49 years (2017)
Demonym Noun: Greenlander(s). Adjective: Greenlandic
Ethnic groups Born in Greenland: 89.8 per cent. Born outside Greenland: 10.2 (Jan. 2018)
Religions The majority of the population is evangelical lutherans
Languages Greenlandic (Kalaallisut), Danish
37
Lola Akinmade Åkerström – Visit Greenland
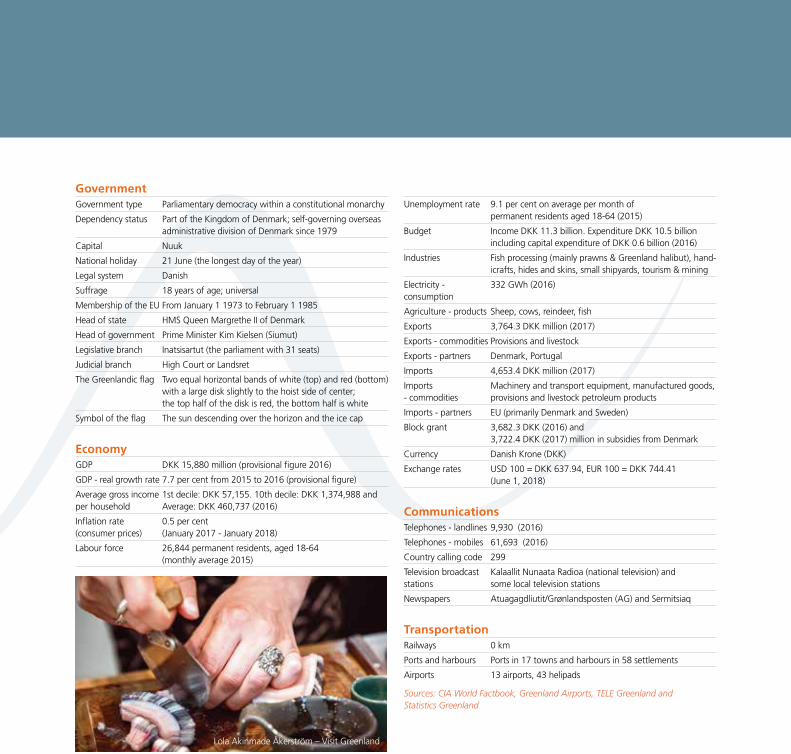
Government
Government type Parliamentary democracy within a constitutional monarchy
Dependency status Part of the Kingdom of Denmark; self-governing overseas administrative division of Denmark since 1979
Capital Nuuk
National holiday 21 June (the longest day of the year)
Legal system Danish
Suffrage 18 years of age; universal
Membership of the EU From January 1 1973 to February 1 1985
Head of state HMS Queen Margrethe II of Denmark
Head of government Prime Minister Kim Kielsen (Siumut)
Legislative branch Inatsisartut (the parliament with 31 seats)
Judicial branch High Court or Landsret
The Greenlandic flag Two equal horizontal bands of white (top) and red (bottom) with a large disk slightly to the hoist side of center; the top half of the disk is red, the bottom half is white
Symbol of the flag The sun descending over the horizon and the ice cap
EconomyGDP DKK 15,880 million (provisional figure 2016)
GDP - real growth rate 7.7 per cent from 2015 to 2016 (provisional figure)
Average gross income per household
1st decile: DKK 57,155. 10th decile: DKK 1,374,988 and Average: DKK 460,737 (2016)
Inflation rate (consumer prices)
0.5 per cent (January 2017 - January 2018)
Labour force 26,844 permanent residents, aged 18-64 (monthly average 2015)
Unemployment rate 9.1 per cent on average per month of permanent residents aged 18-64 (2015)
Budget Income DKK 11.3 billion. Expenditure DKK 10.5 billion including capital expenditure of DKK 0.6 billion (2016)
Industries Fish processing (mainly prawns & Greenland halibut), hand-icrafts, hides and skins, small shipyards, tourism & mining
Electricity - consumption
332 GWh (2016)
Agriculture - products Sheep, cows, reindeer, fish
Exports 3,764.3 DKK million (2017)
Exports - commodities Provisions and livestock
Exports - partners Denmark, Portugal
Imports 4,653.4 DKK million (2017)
Imports - commodities
Machinery and transport equipment, manufactured goods, provisions and livestock petroleum products
Imports - partners EU (primarily Denmark and Sweden)
Block grant 3,682.3 DKK (2016) and 3,722.4 DKK (2017) million in subsidies from Denmark
Currency Danish Krone (DKK)
Exchange rates USD 100 = DKK 637.94, EUR 100 = DKK 744.41 (June 1, 2018)
CommunicationsTelephones - landlines 9,930 (2016)
Telephones - mobiles 61,693 (2016)
Country calling code 299
Television broadcast stations
Kalaallit Nunaata Radioa (national television) and some local television stations
Newspapers Atuagagdliutit/Grønlandsposten (AG) and Sermitsiaq
TransportationRailways 0 km
Ports and harbours Ports in 17 towns and harbours in 58 settlements
Airports 13 airports, 43 helipads
Sources: CIA World Factbook, Greenland Airports, TELE Greenland and Statistics Greenland
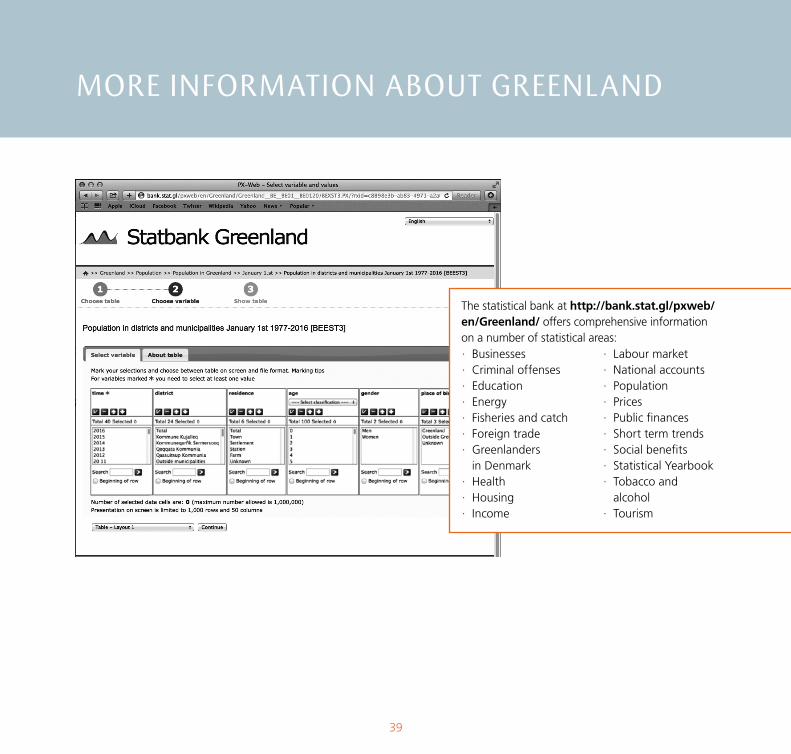
More inForMation aBout Greenland
The statistical bank at http://bank.stat.gl/pxweb/en/Greenland/ offers comprehensive information on a number of statistical areas:· Businesses· Criminal offenses· Education· Energy· Fisheries and catch· Foreign trade· Greenlanders
in Denmark· Health· Housing· Income
· Labour market· National accounts· Population· Prices· Public finances· Short term trends· Social benefits· Statistical Yearbook· Tobacco and
alcohol· Tourism
39
Rebecca Gustafsson – Visit Greenland
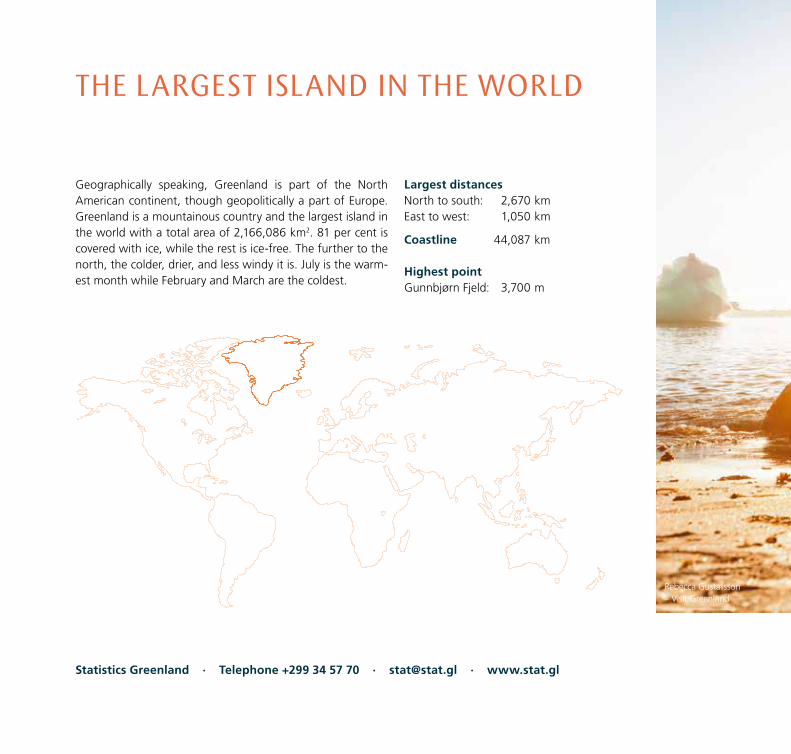
the larGest island in the World
Geographically speaking, Greenland is part of the North American continent, though geopolitically a part of Europe. Greenland is a mountainous country and the largest island in the world with a total area of 2,166,086 km2. 81 per cent is covered with ice, while the rest is ice-free. The further to the north, the colder, drier, and less windy it is. July is the warm-est month while February and March are the coldest.
Statistics Greenland · Telephone +299 34 57 70 · [email protected] · www.stat.gl
Largest distancesNorth to south: 2,670 kmEast to west: 1,050 km
Coastline 44,087 km
Highest pointGunnbjørn Fjeld: 3,700 m