Embed Size (px)
Citation preview

Greenville
LWIA
Workforce
Report
Greenville Workforce Report
• Economics
• Workforce Supply
• Workforce Demand
• Challenges
Purpose of the Report
• Highlights some of Greenville’s key
workforce indicators
• Approaches workforce from a supply and
demand perspective
• Provides data for LWIA plans using LMI
Sources
Greenville Workforce Report
• Economics
• Workforce Supply
• Workforce Demand
• Challenges
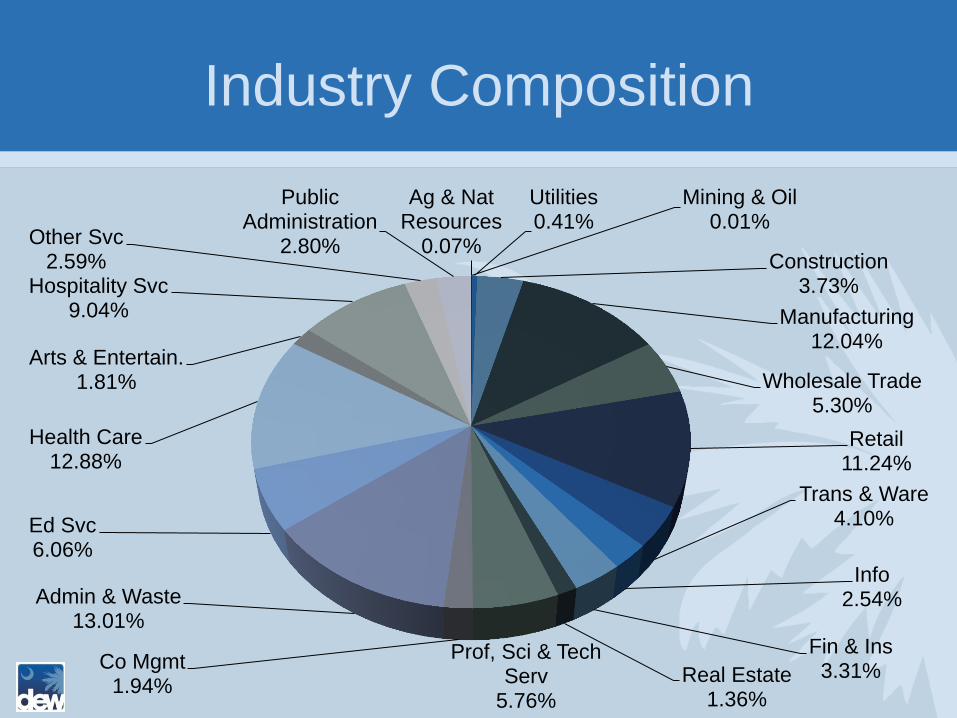
Industry Composition
Ag & Nat Resources
0.07%
Mining & Oil 0.01%
Utilities 0.41%
Construction 3.73%
Manufacturing 12.04%
Wholesale Trade 5.30%
Retail 11.24%
Trans & Ware 4.10%
Info 2.54%
Fin & Ins 3.31% Real Estate
1.36%
Prof, Sci & Tech Serv
5.76%
Co Mgmt 1.94%
Admin & Waste 13.01%
Ed Svc 6.06%
Health Care 12.88%
Arts & Entertain. 1.81%
Hospitality Svc 9.04%
Other Svc 2.59%
Public Administration
2.80%
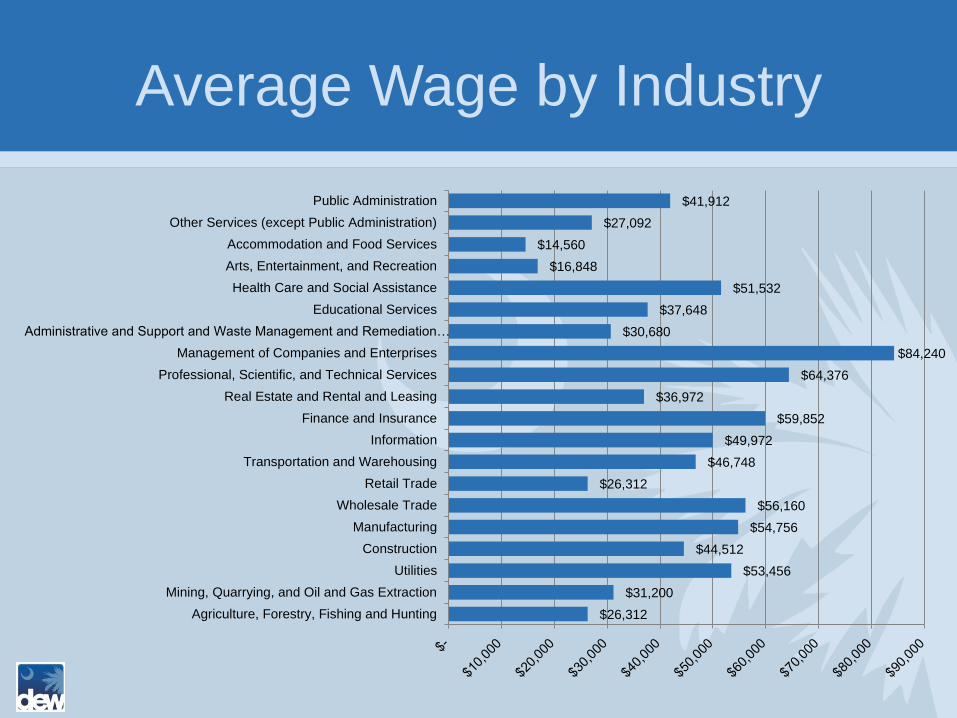
Average Wage by Industry
$26,312
$31,200
$53,456
$44,512
$54,756
$56,160
$26,312
$46,748
$49,972
$59,852
$36,972
$64,376
$84,240
$30,680
$37,648
$51,532
$16,848
$14,560
$27,092
$41,912
Agriculture, Forestry, Fishing and Hunting
Mining, Quarrying, and Oil and Gas Extraction
Utilities
Construction
Manufacturing
Wholesale Trade
Retail Trade
Transportation and Warehousing
Information
Finance and Insurance
Real Estate and Rental and Leasing
Professional, Scientific, and Technical Services
Management of Companies and Enterprises
Administrative and Support and Waste Management and Remediation…
Educational Services
Health Care and Social Assistance
Arts, Entertainment, and Recreation
Accommodation and Food Services
Other Services (except Public Administration)
Public Administration
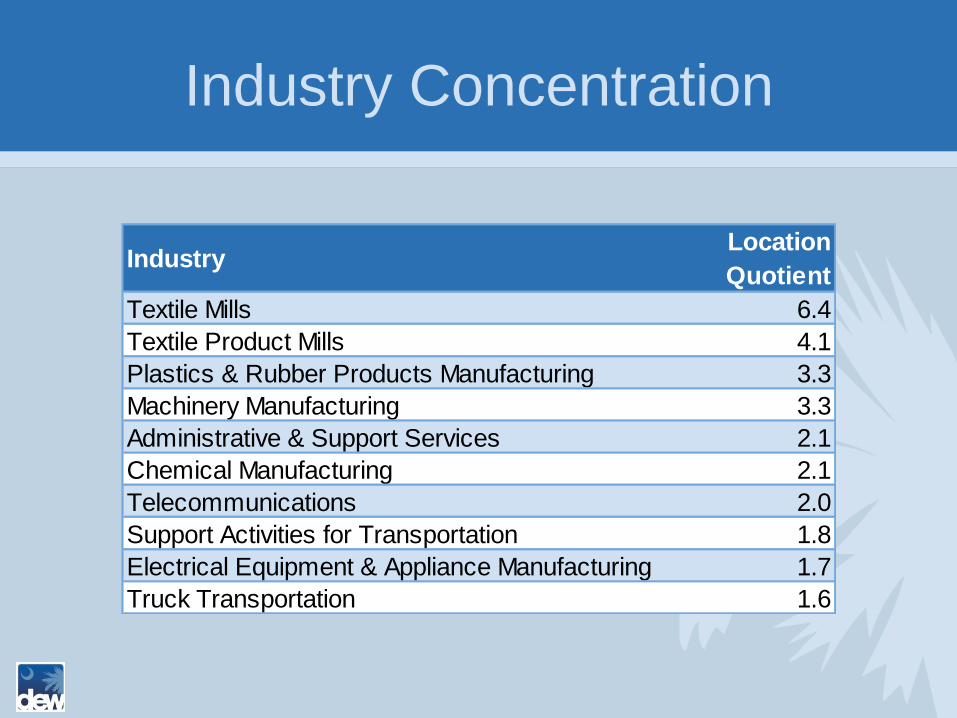
Industry Concentration
IndustryLocation
Quotient
Textile Mills 6.4
Textile Product Mills 4.1
Plastics & Rubber Products Manufacturing 3.3
Machinery Manufacturing 3.3
Administrative & Support Services 2.1
Chemical Manufacturing 2.1
Telecommunications 2.0
Support Activities for Transportation 1.8
Electrical Equipment & Appliance Manufacturing 1.7
Truck Transportation 1.6
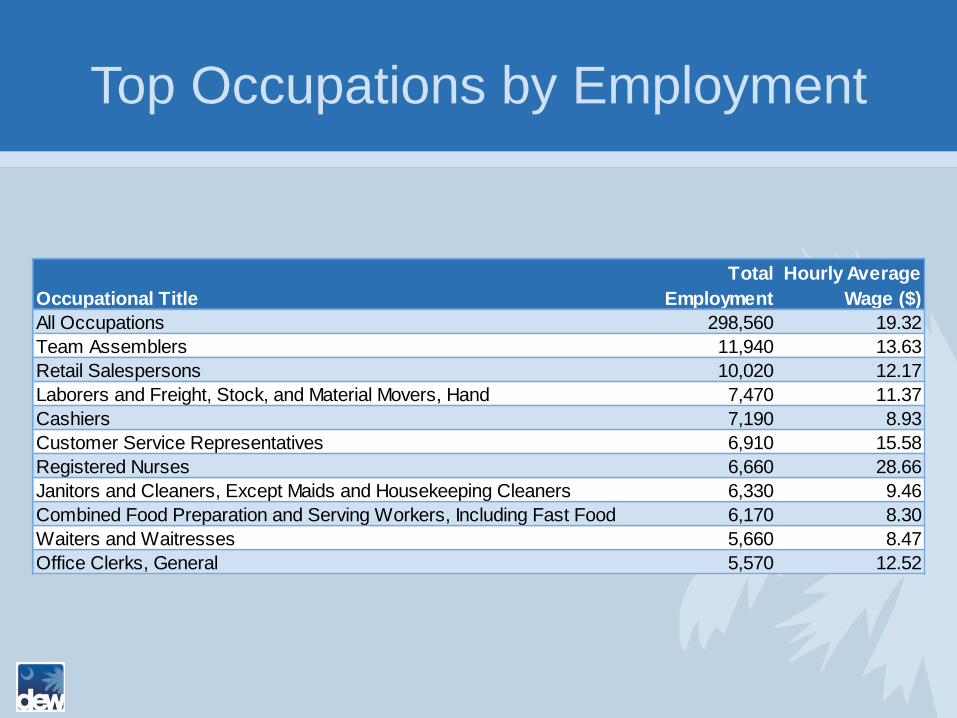
Top Occupations by Employment
Occupational Title
Total
Employment
Hourly Average
Wage ($)
All Occupations 298,560 19.32
Team Assemblers 11,940 13.63
Retail Salespersons 10,020 12.17
Laborers and Freight, Stock, and Material Movers, Hand 7,470 11.37
Cashiers 7,190 8.93
Customer Service Representatives 6,910 15.58
Registered Nurses 6,660 28.66
Janitors and Cleaners, Except Maids and Housekeeping Cleaners 6,330 9.46
Combined Food Preparation and Serving Workers, Including Fast Food 6,170 8.30
Waiters and Waitresses 5,660 8.47
Office Clerks, General 5,570 12.52
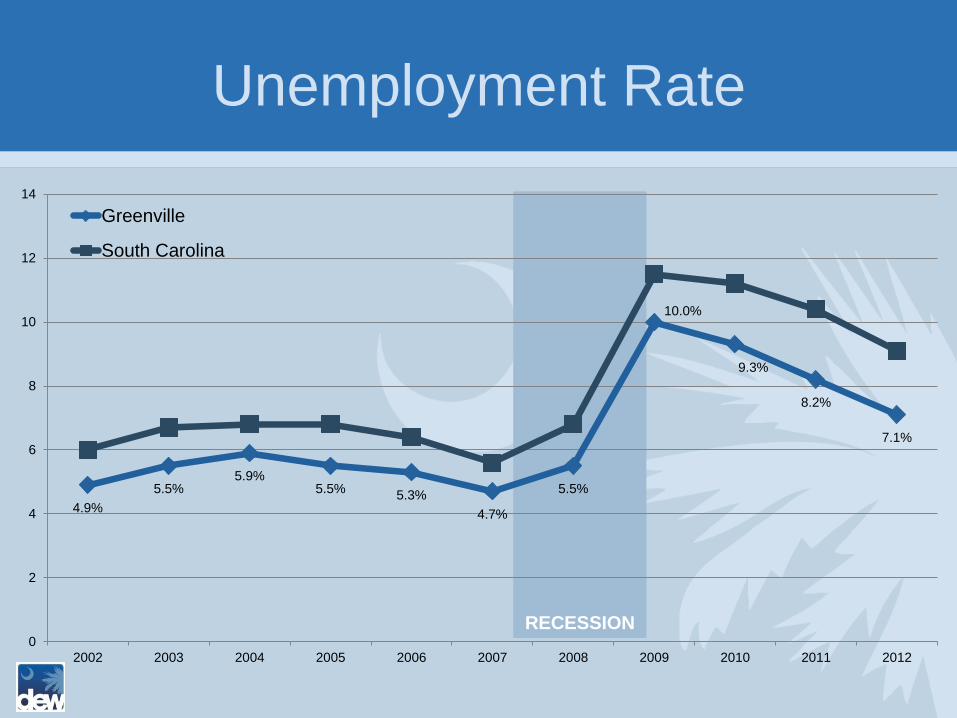
RECESSION
Unemployment Rate
4.9%
5.5% 5.9%
5.5% 5.3%
4.7%
5.5%
10.0%
9.3%
8.2%
7.1%
0
2
4
6
8
10
12
14
2002 2003 2004 2005 2006 2007 2008 2009 2010 2011 2012
Greenville
South Carolina
Greenville Workforce Report
• Economics
• Workforce Supply
• Workforce Demand
• Challenges
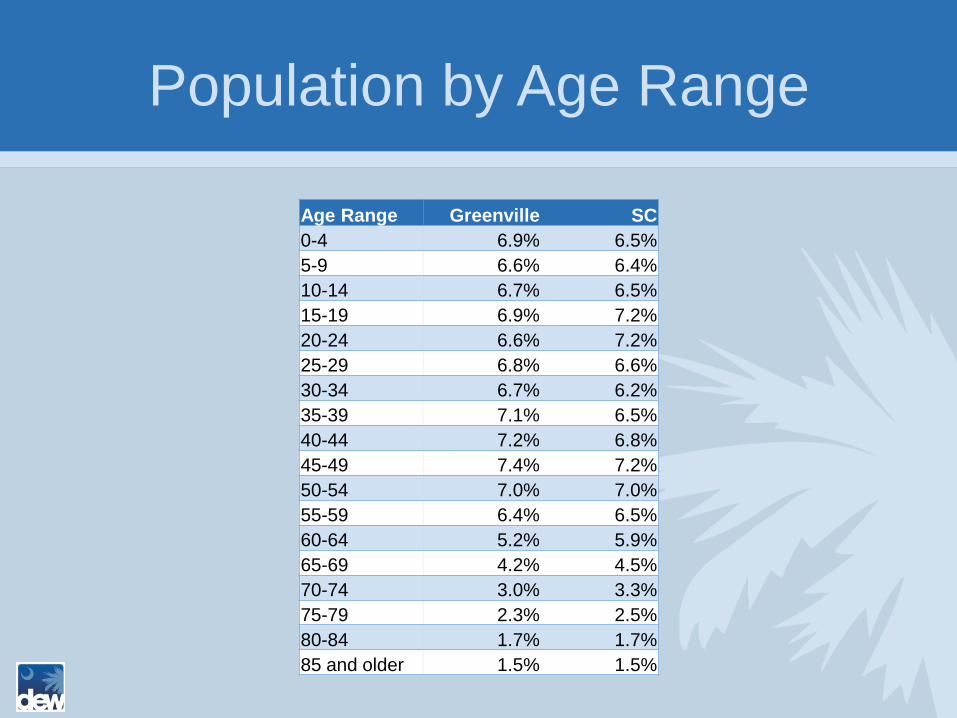
Population by Age Range
Age Range Greenville SC
0-4 6.9% 6.5%
5-9 6.6% 6.4%
10-14 6.7% 6.5%
15-19 6.9% 7.2%
20-24 6.6% 7.2%
25-29 6.8% 6.6%
30-34 6.7% 6.2%
35-39 7.1% 6.5%
40-44 7.2% 6.8%
45-49 7.4% 7.2%
50-54 7.0% 7.0%
55-59 6.4% 6.5%
60-64 5.2% 5.9%
65-69 4.2% 4.5%
70-74 3.0% 3.3%
75-79 2.3% 2.5%
80-84 1.7% 1.7%
85 and older 1.5% 1.5%
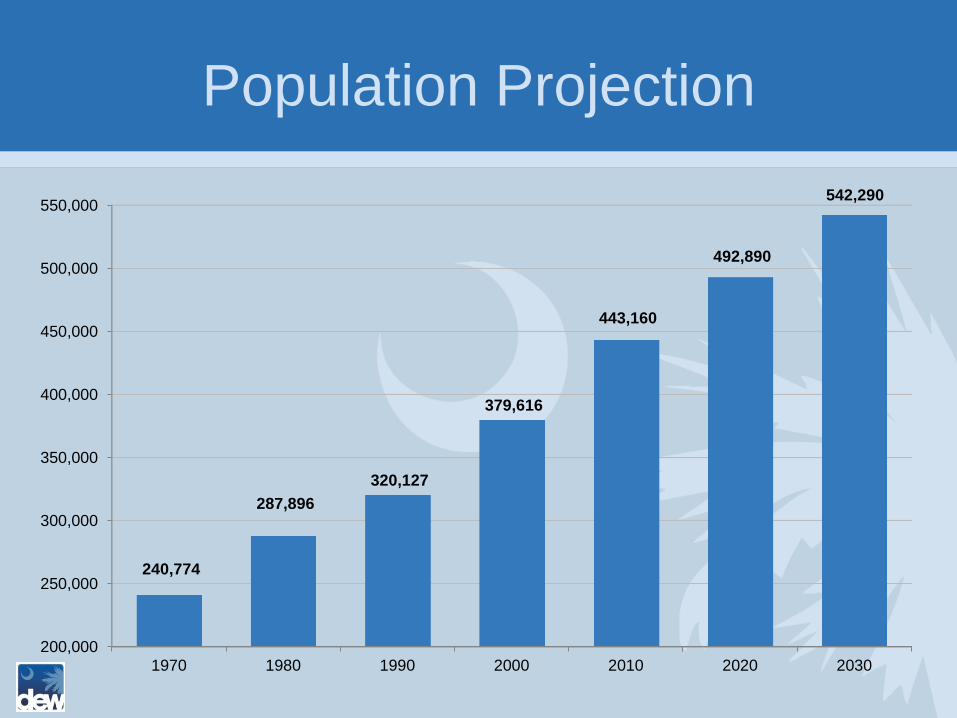
Population Projection
200,000
250,000
300,000
350,000
400,000
450,000
500,000
550,000
1970 1980 1990 2000 2010 2020 2030
240,774
287,896
320,127
379,616
443,160
492,890
542,290
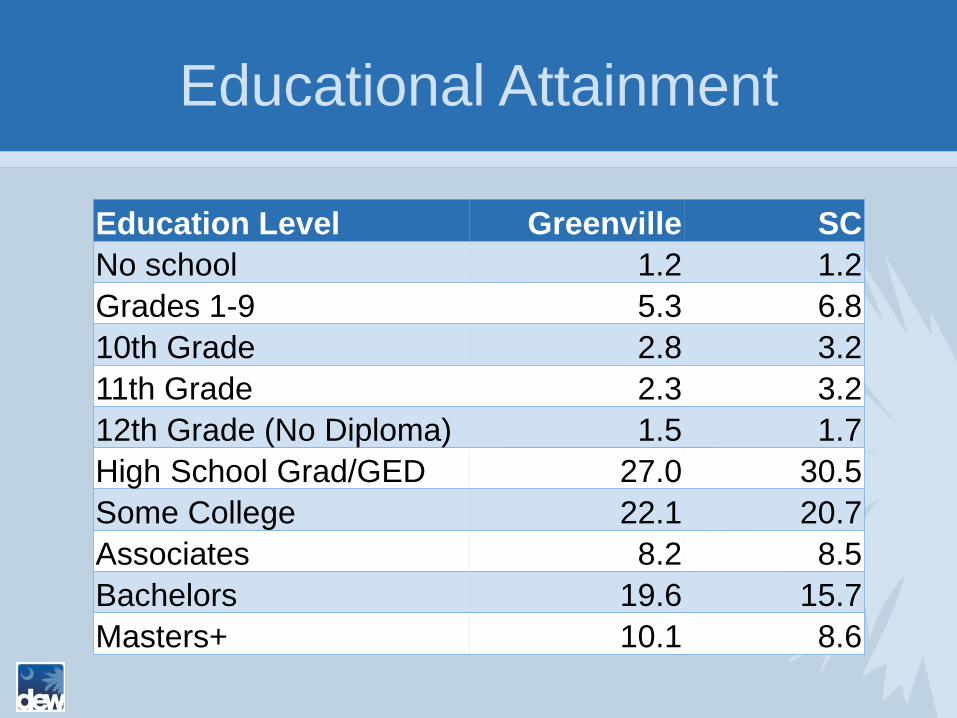
Educational Attainment
Education Level Greenville SC
No school 1.2 1.2
Grades 1-9 5.3 6.8
10th Grade 2.8 3.2
11th Grade 2.3 3.2
12th Grade (No Diploma) 1.5 1.7
High School Grad/GED 27.0 30.5
Some College 22.1 20.7
Associates 8.2 8.5
Bachelors 19.6 15.7
Masters+ 10.1 8.6
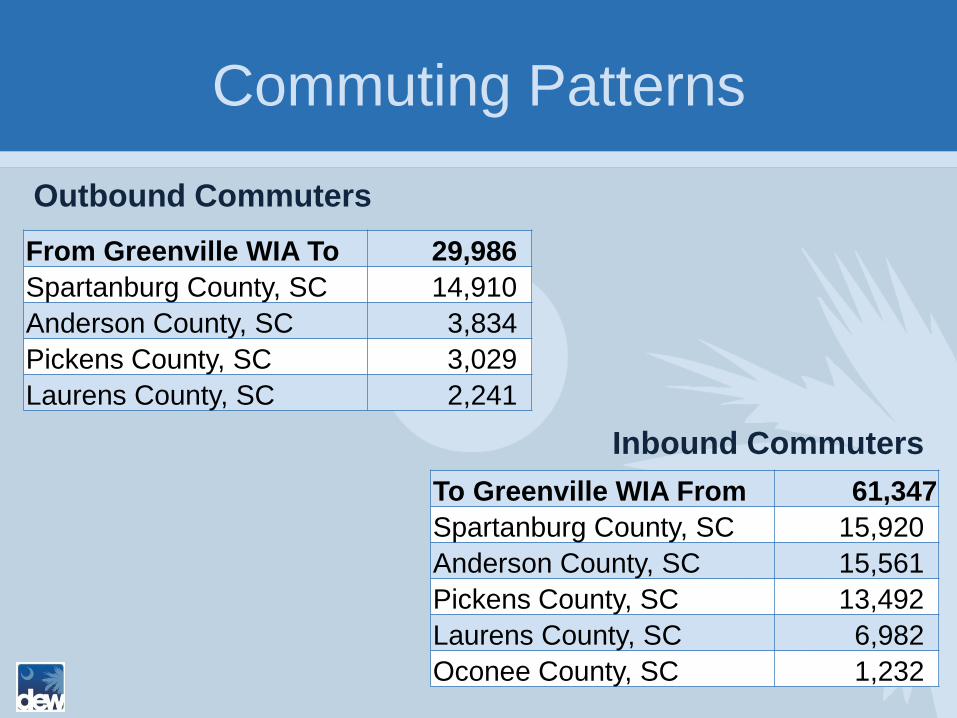
Commuting Patterns
Outbound Commuters
From Greenville WIA To 29,986
Spartanburg County, SC 14,910
Anderson County, SC 3,834
Pickens County, SC 3,029
Laurens County, SC 2,241
To Greenville WIA From 61,347
Spartanburg County, SC 15,920
Anderson County, SC 15,561
Pickens County, SC 13,492
Laurens County, SC 6,982
Oconee County, SC 1,232
Inbound Commuters
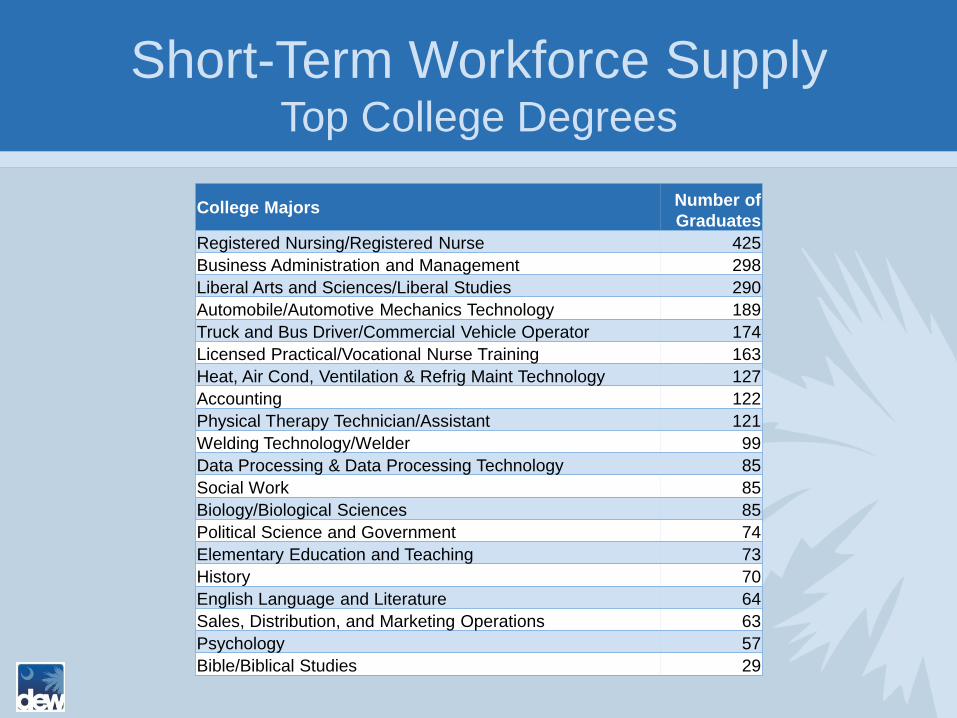
Short-Term Workforce Supply Top College Degrees
College Majors Number of
Graduates
Registered Nursing/Registered Nurse 425
Business Administration and Management 298
Liberal Arts and Sciences/Liberal Studies 290
Automobile/Automotive Mechanics Technology 189
Truck and Bus Driver/Commercial Vehicle Operator 174
Licensed Practical/Vocational Nurse Training 163
Heat, Air Cond, Ventilation & Refrig Maint Technology 127
Accounting 122
Physical Therapy Technician/Assistant 121
Welding Technology/Welder 99
Data Processing & Data Processing Technology 85
Social Work 85
Biology/Biological Sciences 85
Political Science and Government 74
Elementary Education and Teaching 73
History 70
English Language and Literature 64
Sales, Distribution, and Marketing Operations 63
Psychology 57
Bible/Biblical Studies 29
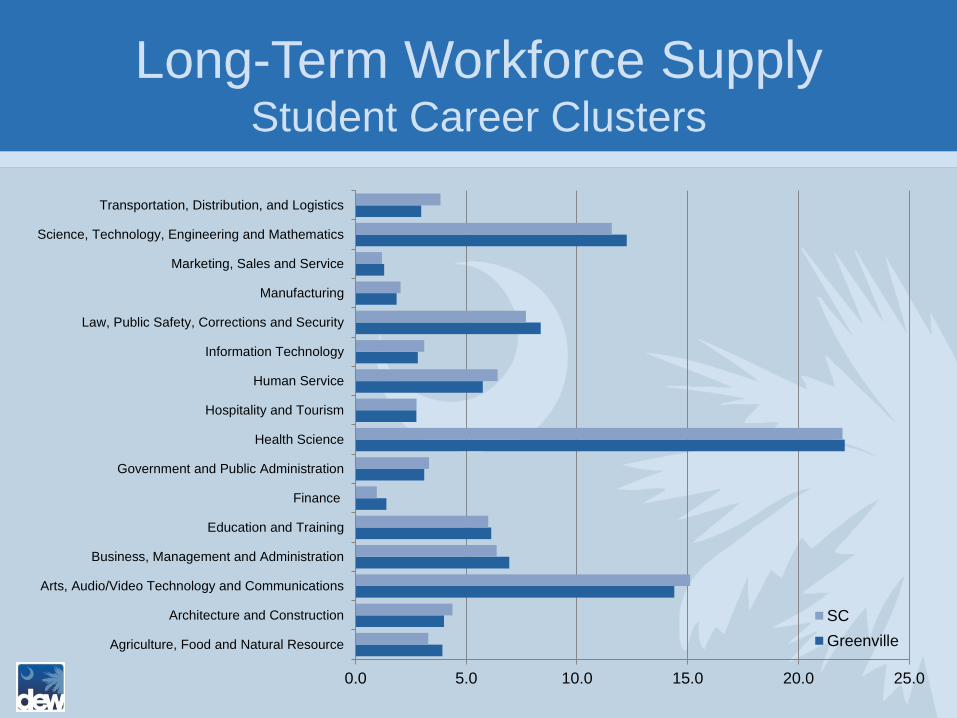
Long-Term Workforce Supply Student Career Clusters
0.0 5.0 10.0 15.0 20.0 25.0
Agriculture, Food and Natural Resource
Architecture and Construction
Arts, Audio/Video Technology and Communications
Business, Management and Administration
Education and Training
Finance
Government and Public Administration
Health Science
Hospitality and Tourism
Human Service
Information Technology
Law, Public Safety, Corrections and Security
Manufacturing
Marketing, Sales and Service
Science, Technology, Engineering and Mathematics
Transportation, Distribution, and Logistics
SC
Greenville
Greenville Workforce Report
• Economics
• Workforce Supply
• Workforce Demand
• Challenges
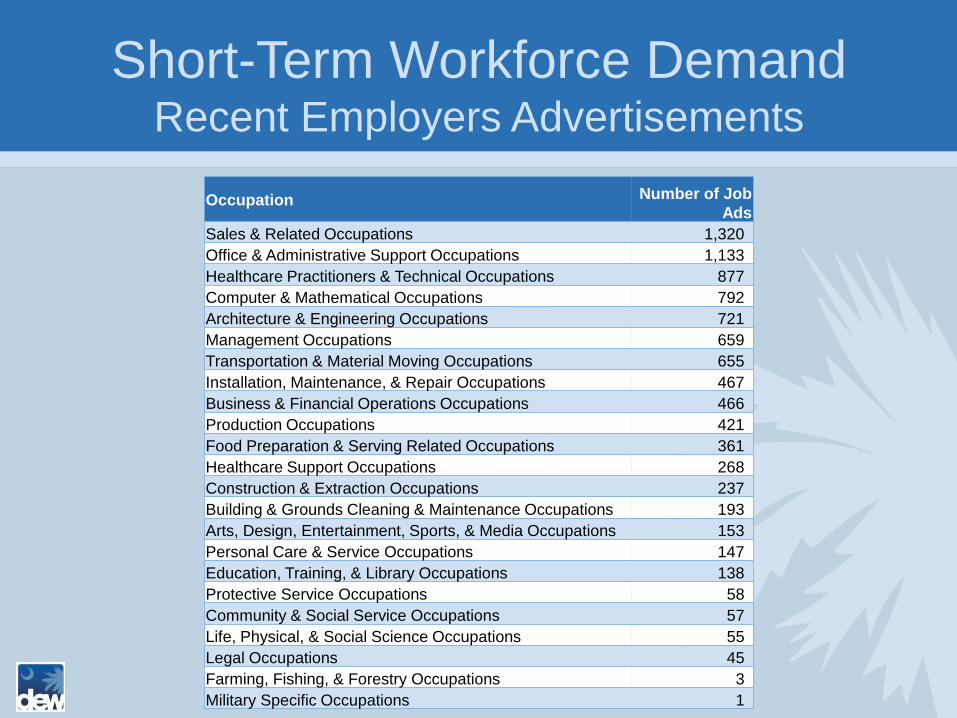
Short-Term Workforce Demand Recent Employers Advertisements
Occupation Number of Job
Ads
Sales & Related Occupations 1,320
Office & Administrative Support Occupations 1,133
Healthcare Practitioners & Technical Occupations 877
Computer & Mathematical Occupations 792
Architecture & Engineering Occupations 721
Management Occupations 659
Transportation & Material Moving Occupations 655
Installation, Maintenance, & Repair Occupations 467
Business & Financial Operations Occupations 466
Production Occupations 421
Food Preparation & Serving Related Occupations 361
Healthcare Support Occupations 268
Construction & Extraction Occupations 237
Building & Grounds Cleaning & Maintenance Occupations 193
Arts, Design, Entertainment, Sports, & Media Occupations 153
Personal Care & Service Occupations 147
Education, Training, & Library Occupations 138
Protective Service Occupations 58
Community & Social Service Occupations 57
Life, Physical, & Social Science Occupations 55
Legal Occupations 45
Farming, Fishing, & Forestry Occupations 3
Military Specific Occupations 1

Long-Term Workforce Demand Top Projected Growing Occupations
Occupation
Estimated
Employment
(2008)
Projected
Employment
(2018)
Personal and Home Care Aides 1,433 2,236
Real Estate Sales Agents 1,001 1,378
Self-Enrichment Education Teachers 590 857
Pharmacy Technicians 648 838
Civil Engineers 604 799
Fitness Trainers and Aerobics Instructors 599 783
Paralegals and Legal Assistants 406 530
Personal Financial Advisors 334 448
Coaches and Scouts 276 351
Bakers 200 273
Veterinary Technologists and Technicians 175 238
Veterinarians 155 203
Financial Analysts 124 162
Food Batchmakers 69 110
Technical Writers 79 110
Medical Equipment Repairers 70 93
Operations Research Analysts 61 84
Athletic Trainers 60 77
Environmental Scientists and Specialists 34 49
Financial Examiners 21 27
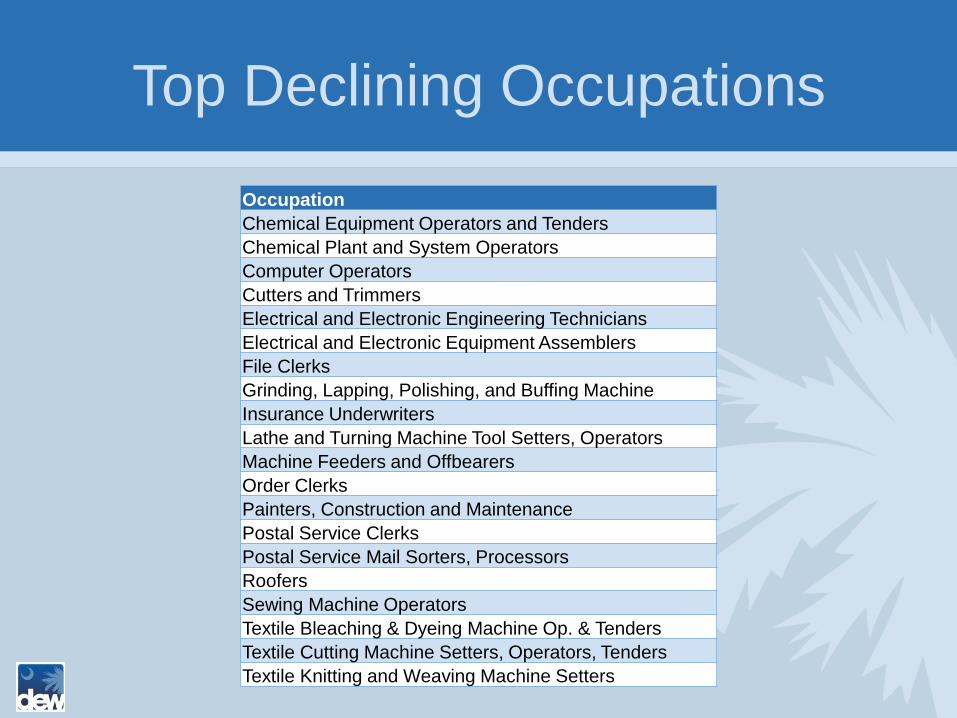
Top Declining Occupations
Occupation
Chemical Equipment Operators and Tenders
Chemical Plant and System Operators
Computer Operators
Cutters and Trimmers
Electrical and Electronic Engineering Technicians
Electrical and Electronic Equipment Assemblers
File Clerks
Grinding, Lapping, Polishing, and Buffing Machine
Insurance Underwriters
Lathe and Turning Machine Tool Setters, Operators
Machine Feeders and Offbearers
Order Clerks
Painters, Construction and Maintenance
Postal Service Clerks
Postal Service Mail Sorters, Processors
Roofers
Sewing Machine Operators
Textile Bleaching & Dyeing Machine Op. & Tenders
Textile Cutting Machine Setters, Operators, Tenders
Textile Knitting and Weaving Machine Setters
Greenville Workforce Report
• Economics
• Workforce Supply
• Workforce Demand
• Challenges
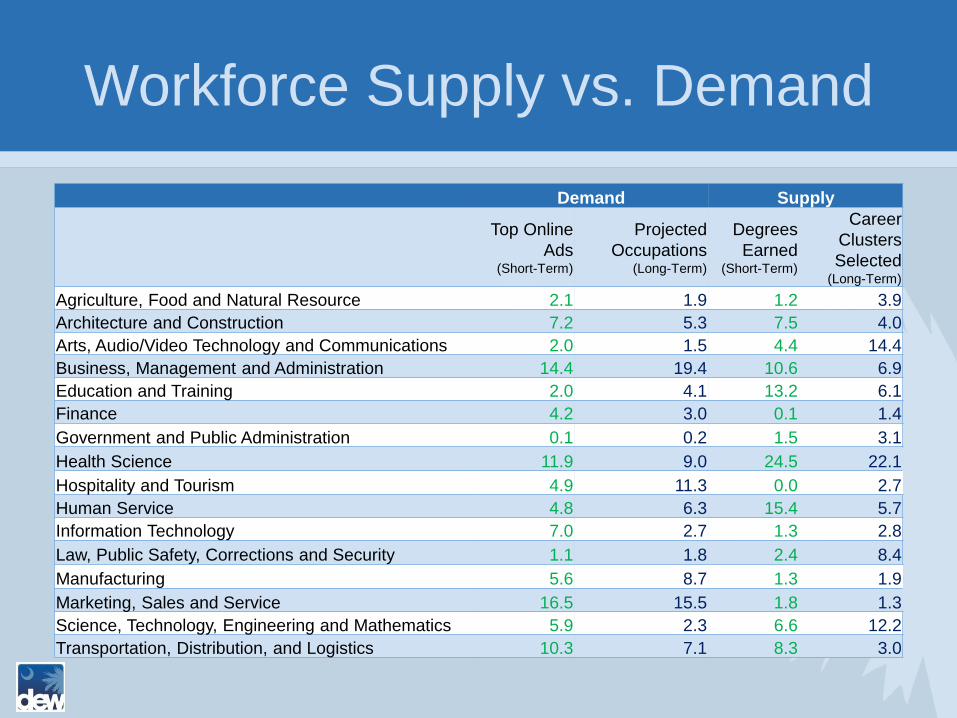
Workforce Supply vs. Demand
Demand Supply
Top Online
Ads (Short-Term)
Projected
Occupations (Long-Term)
Degrees
Earned (Short-Term)
Career
Clusters
Selected (Long-Term)
Agriculture, Food and Natural Resource 2.1 1.9 1.2 3.9
Architecture and Construction 7.2 5.3 7.5 4.0
Arts, Audio/Video Technology and Communications 2.0 1.5 4.4 14.4
Business, Management and Administration 14.4 19.4 10.6 6.9
Education and Training 2.0 4.1 13.2 6.1
Finance 4.2 3.0 0.1 1.4
Government and Public Administration 0.1 0.2 1.5 3.1
Health Science 11.9 9.0 24.5 22.1
Hospitality and Tourism 4.9 11.3 0.0 2.7
Human Service 4.8 6.3 15.4 5.7
Information Technology 7.0 2.7 1.3 2.8
Law, Public Safety, Corrections and Security 1.1 1.8 2.4 8.4
Manufacturing 5.6 8.7 1.3 1.9
Marketing, Sales and Service 16.5 15.5 1.8 1.3
Science, Technology, Engineering and Mathematics 5.9 2.3 6.6 12.2
Transportation, Distribution, and Logistics 10.3 7.1 8.3 3.0
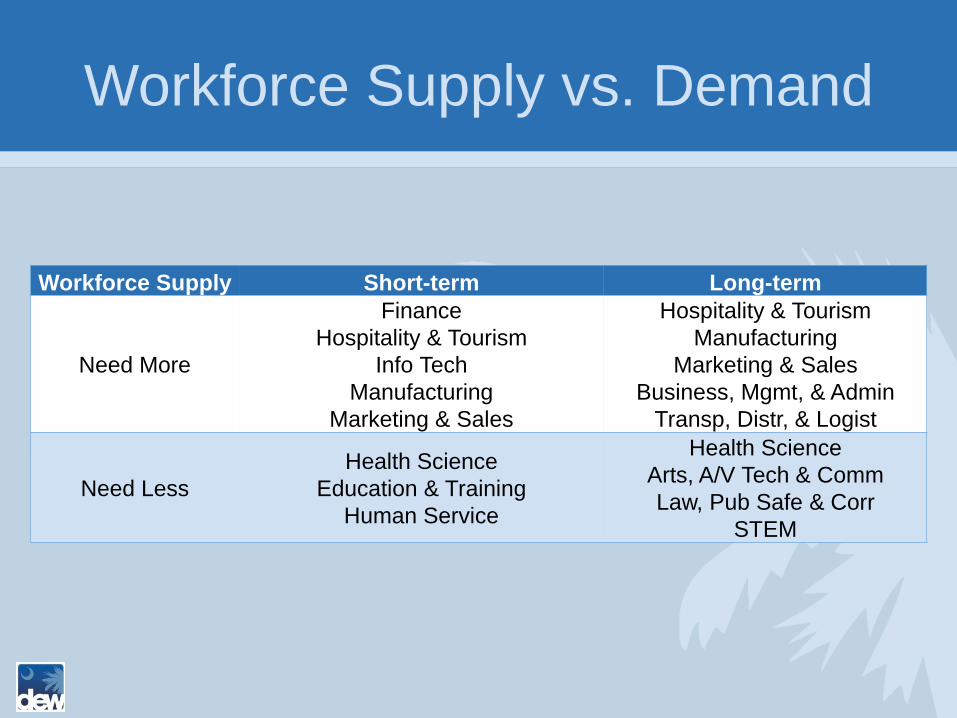
Workforce Supply vs. Demand
Workforce Supply Short-term Long-term
Need More
Finance
Hospitality & Tourism
Info Tech
Manufacturing
Marketing & Sales
Hospitality & Tourism
Manufacturing
Marketing & Sales
Business, Mgmt, & Admin
Transp, Distr, & Logist
Need Less
Health Science
Education & Training
Human Service
Health Science
Arts, A/V Tech & Comm
Law, Pub Safe & Corr
STEM
Conclusions
The workforce in the Greenville LWIA faces
several opportunities and challenges
Opportunities: Growing and Educated
Population, Diverse Economic Base
Challenges: Some workforce supply-
demand flow mismatches

Questions
Contacts
LMI Director: Brenda Lisbon
Workforce Intelligence Manager: Shannon Kinder
Workforce Intelligence Coordinator: Alan Davis
www.SCWorkforceInfo.com