Embed Size (px)
Citation preview
GREENVILLE UTILITIES COMMISSION
Financial Report
December 31, 2016
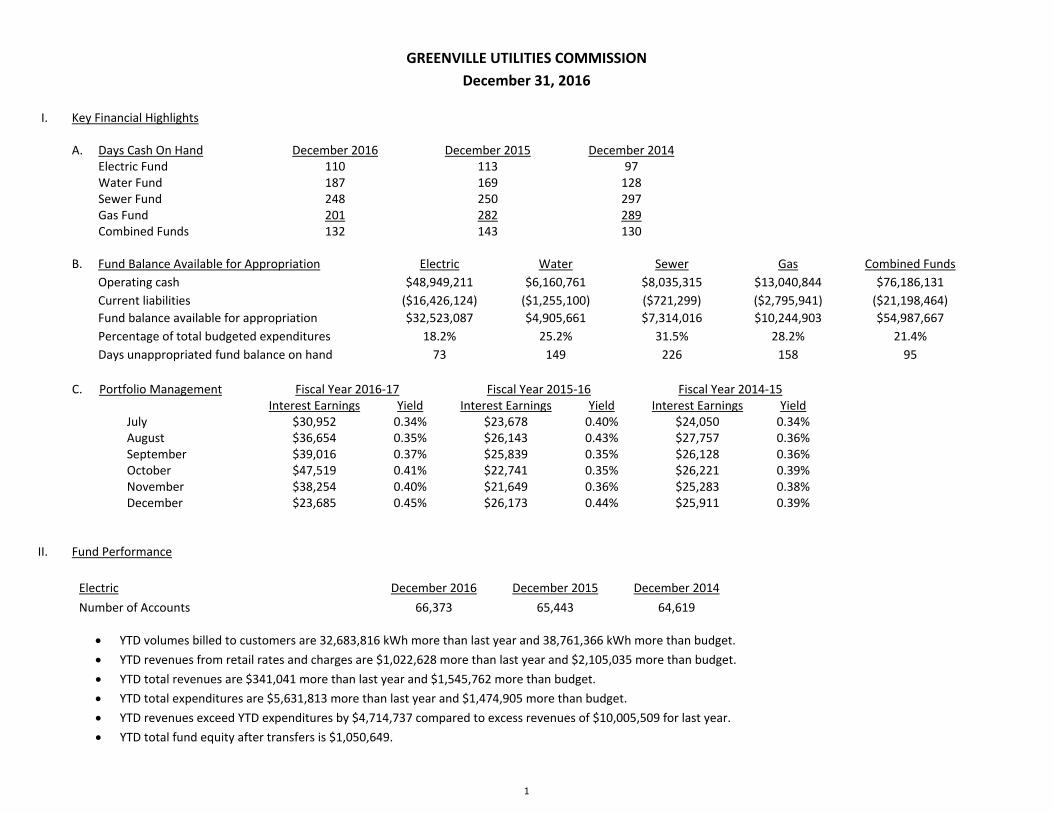
GREENVILLE UTILITIES COMMISSION December 31, 2016
I. Key Financial Highlights
A. Days Cash On Hand December 2016 December 2015 December 2014 Electric Fund 110 113 97 Water Fund 187 169 128 Sewer Fund 248 250 297 Gas Fund 201 282 289 Combined Funds 132 143 130 B. Fund Balance Available for Appropriation Electric Water Sewer Gas Combined Funds Operating cash $48,949,211 $6,160,761 $8,035,315 $13,040,844 $76,186,131 Current liabilities ($16,426,124) ($1,255,100) ($721,299) ($2,795,941) ($21,198,464) Fund balance available for appropriation $32,523,087 $4,905,661 $7,314,016 $10,244,903 $54,987,667 Percentage of total budgeted expenditures 18.2% 25.2% 31.5% 28.2% 21.4% Days unappropriated fund balance on hand 73 149 226 158 95 C. Portfolio Management Fiscal Year 2016‐17 Fiscal Year 2015‐16 Fiscal Year 2014‐15 Interest Earnings Yield Interest Earnings Yield Interest Earnings Yield July $30,952 0.34% $23,678 0.40% $24,050 0.34% August $36,654 0.35% $26,143 0.43% $27,757 0.36% September $39,016 0.37% $25,839 0.35% $26,128 0.36% October $47,519 0.41% $22,741 0.35% $26,221 0.39% November $38,254 0.40% $21,649 0.36% $25,283 0.38% December $23,685 0.45% $26,173 0.44% $25,911 0.39%
II. Fund Performance Electric December 2016 December 2015 December 2014 Number of Accounts 66,373 65,443 64,619
YTD volumes billed to customers are 32,683,816 kWh more than last year and 38,761,366 kWh more than budget. YTD revenues from retail rates and charges are $1,022,628 more than last year and $2,105,035 more than budget. YTD total revenues are $341,041 more than last year and $1,545,762 more than budget. YTD total expenditures are $5,631,813 more than last year and $1,474,905 more than budget. YTD revenues exceed YTD expenditures by $4,714,737 compared to excess revenues of $10,005,509 for last year. YTD total fund equity after transfers is $1,050,649.
1
GREENVILLE UTILITIES COMMISSION December 31, 2016
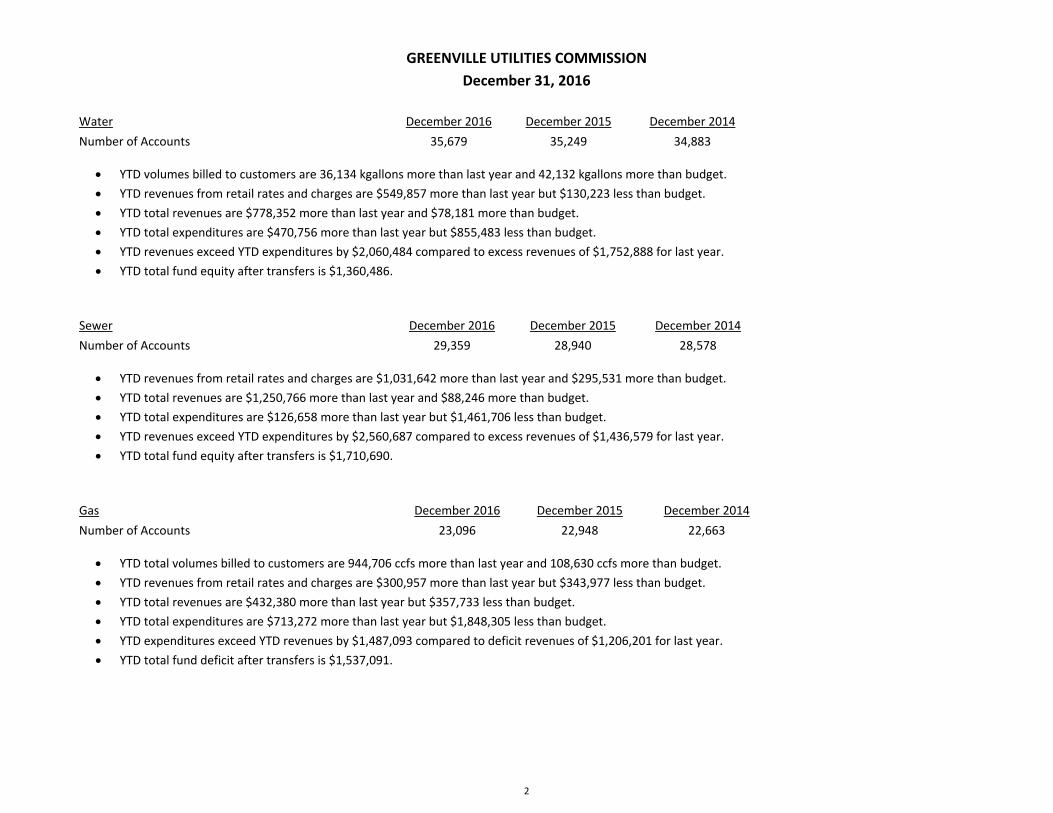
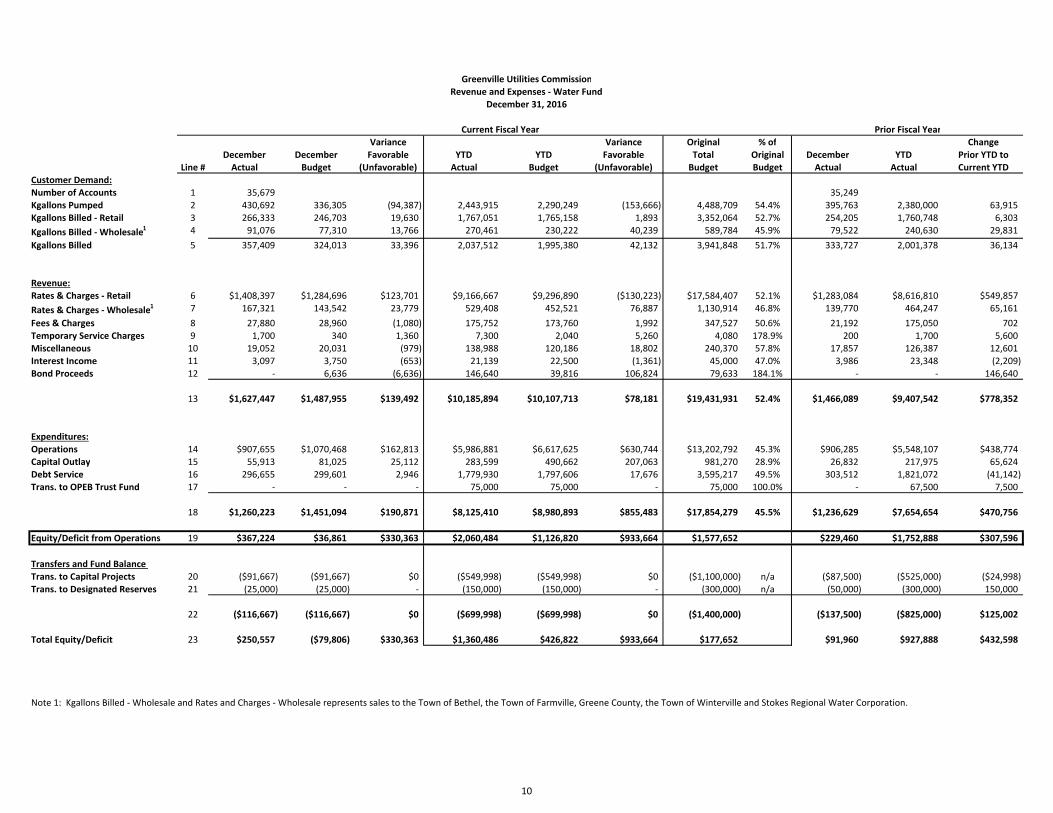
Water December 2016 December 2015 December 2014 Number of Accounts 35,679 35,249 34,883
YTD volumes billed to customers are 36,134 kgallons more than last year and 42,132 kgallons more than budget. YTD revenues from retail rates and charges are $549,857 more than last year but $130,223 less than budget. YTD total revenues are $778,352 more than last year and $78,181 more than budget. YTD total expenditures are $470,756 more than last year but $855,483 less than budget. YTD revenues exceed YTD expenditures by $2,060,484 compared to excess revenues of $1,752,888 for last year. YTD total fund equity after transfers is $1,360,486.
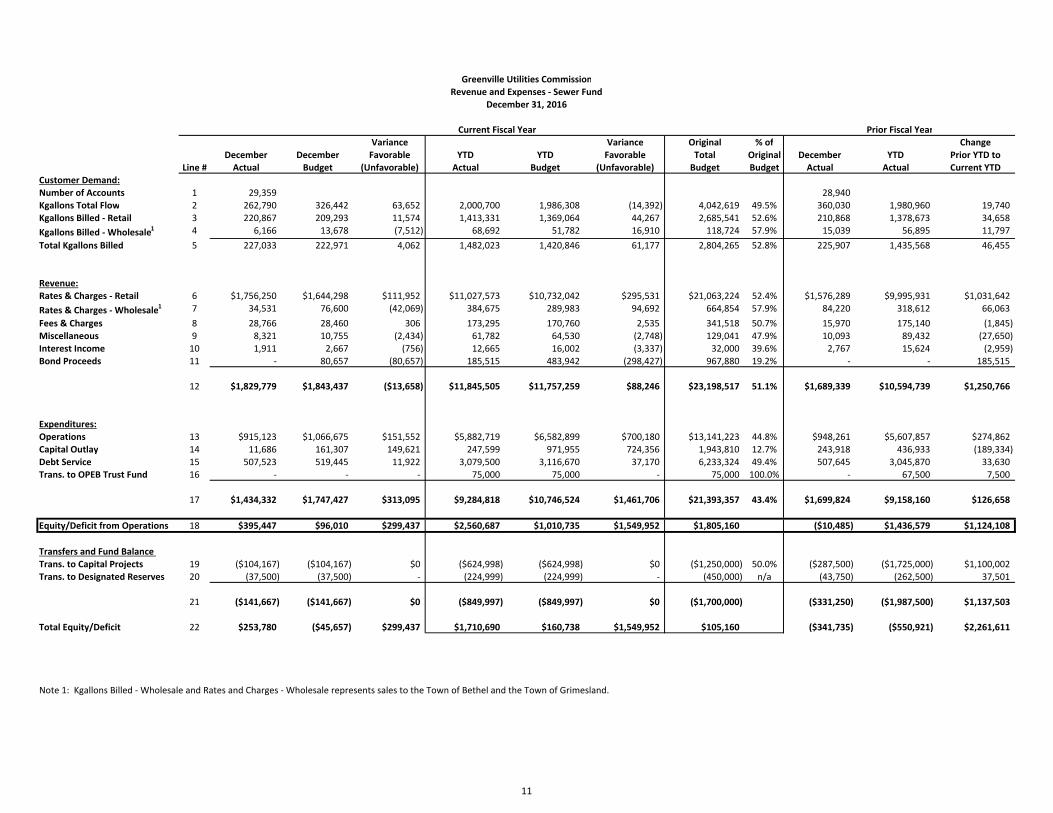
Sewer December 2016 December 2015 December 2014 Number of Accounts 29,359 28,940 28,578
YTD revenues from retail rates and charges are $1,031,642 more than last year and $295,531 more than budget. YTD total revenues are $1,250,766 more than last year and $88,246 more than budget. YTD total expenditures are $126,658 more than last year but $1,461,706 less than budget. YTD revenues exceed YTD expenditures by $2,560,687 compared to excess revenues of $1,436,579 for last year. YTD total fund equity after transfers is $1,710,690.
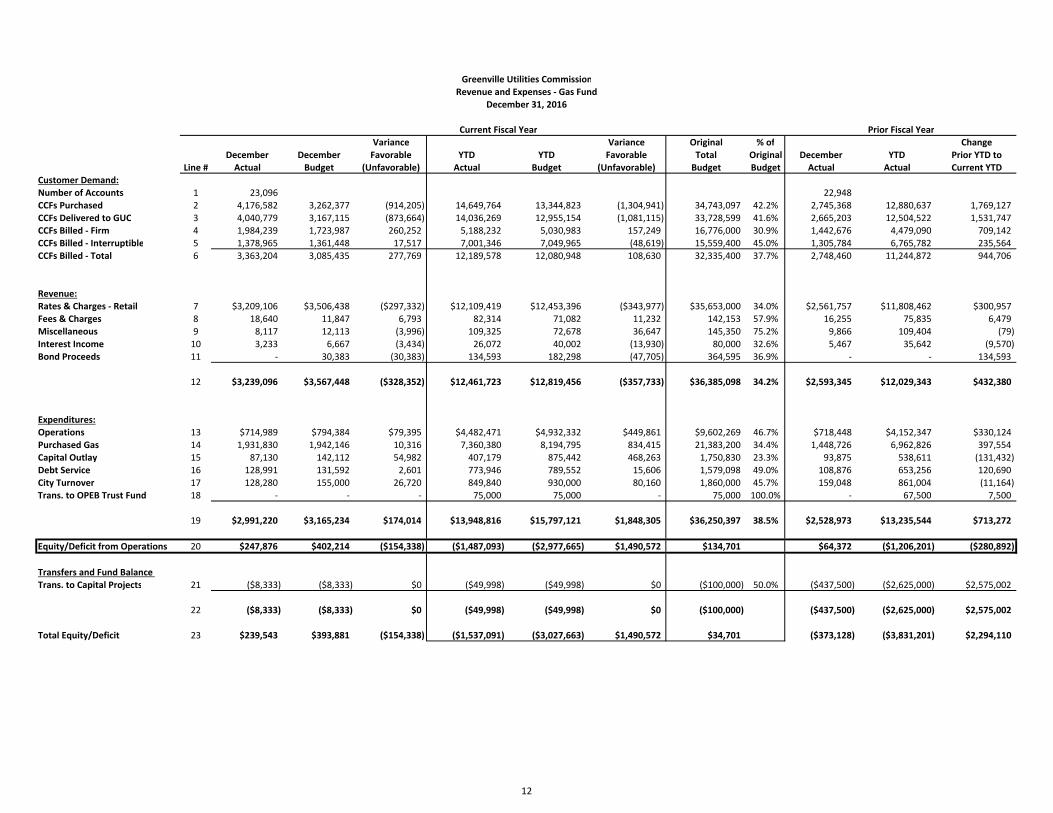
Gas December 2016 December 2015 December 2014 Number of Accounts 23,096 22,948 22,663
YTD total volumes billed to customers are 944,706 ccfs more than last year and 108,630 ccfs more than budget. YTD revenues from retail rates and charges are $300,957 more than last year but $343,977 less than budget. YTD total revenues are $432,380 more than last year but $357,733 less than budget. YTD total expenditures are $713,272 more than last year but $1,848,305 less than budget. YTD expenditures exceed YTD revenues by $1,487,093 compared to deficit revenues of $1,206,201 for last year. YTD total fund deficit after transfers is $1,537,091.
2
GREENVILLE UTILITIES COMMISSION December 31, 2016
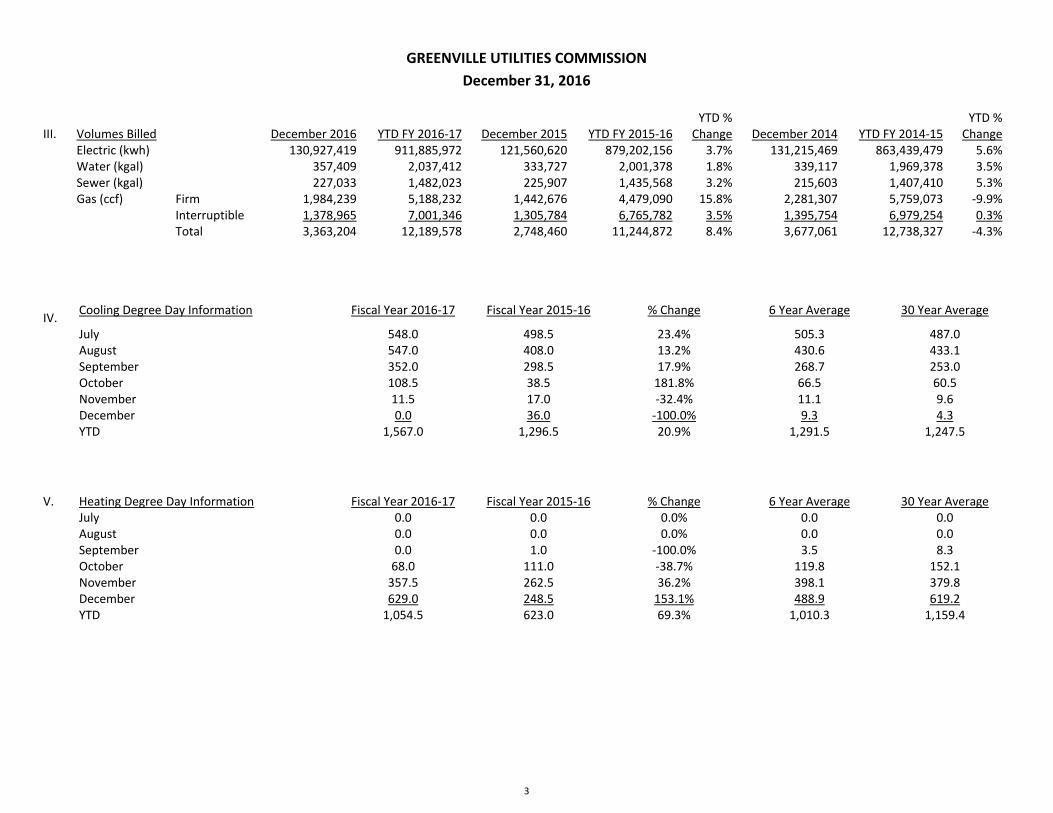
III. Volumes Billed December 2016 YTD FY 2016‐17 December 2015 YTD FY 2015‐16 YTD % Change December 2014 YTD FY 2014‐15
YTD % Change
Electric (kwh) 130,927,419 911,885,972 121,560,620 879,202,156 3.7% 131,215,469 863,439,479 5.6% Water (kgal) 357,409 2,037,412 333,727 2,001,378 1.8% 339,117 1,969,378 3.5% Sewer (kgal) 227,033 1,482,023 225,907 1,435,568 3.2% 215,603 1,407,410 5.3% Gas (ccf) Firm 1,984,239 5,188,232 1,442,676 4,479,090 15.8% 2,281,307 5,759,073 ‐9.9% Interruptible 1,378,965 7,001,346 1,305,784 6,765,782 3.5% 1,395,754 6,979,254 0.3% Total 3,363,204 12,189,578 2,748,460 11,244,872 8.4% 3,677,061 12,738,327 ‐4.3%
IV. Cooling Degree Day Information Fiscal Year 2016‐17 Fiscal Year 2015‐16 % Change 6 Year Average 30 Year Average
July 548.0 498.5 23.4% 505.3 487.0 August 547.0 408.0 13.2% 430.6 433.1 September 352.0 298.5 17.9% 268.7 253.0 October 108.5 38.5 181.8% 66.5 60.5 November 11.5 17.0 ‐32.4% 11.1 9.6 December 0.0 36.0 ‐100.0% 9.3 4.3 YTD 1,567.0 1,296.5 20.9% 1,291.5 1,247.5
V. Heating Degree Day Information Fiscal Year 2016‐17 Fiscal Year 2015‐16 % Change 6 Year Average 30 Year Average July 0.0 0.0 0.0% 0.0 0.0 August 0.0 0.0 0.0% 0.0 0.0 September 0.0 1.0 ‐100.0% 3.5 8.3 October 68.0 111.0 ‐38.7% 119.8 152.1 November 357.5 262.5 36.2% 398.1 379.8 December 629.0 248.5 153.1% 488.9 619.2 YTD 1,054.5 623.0 69.3% 1,010.3 1,159.4
3
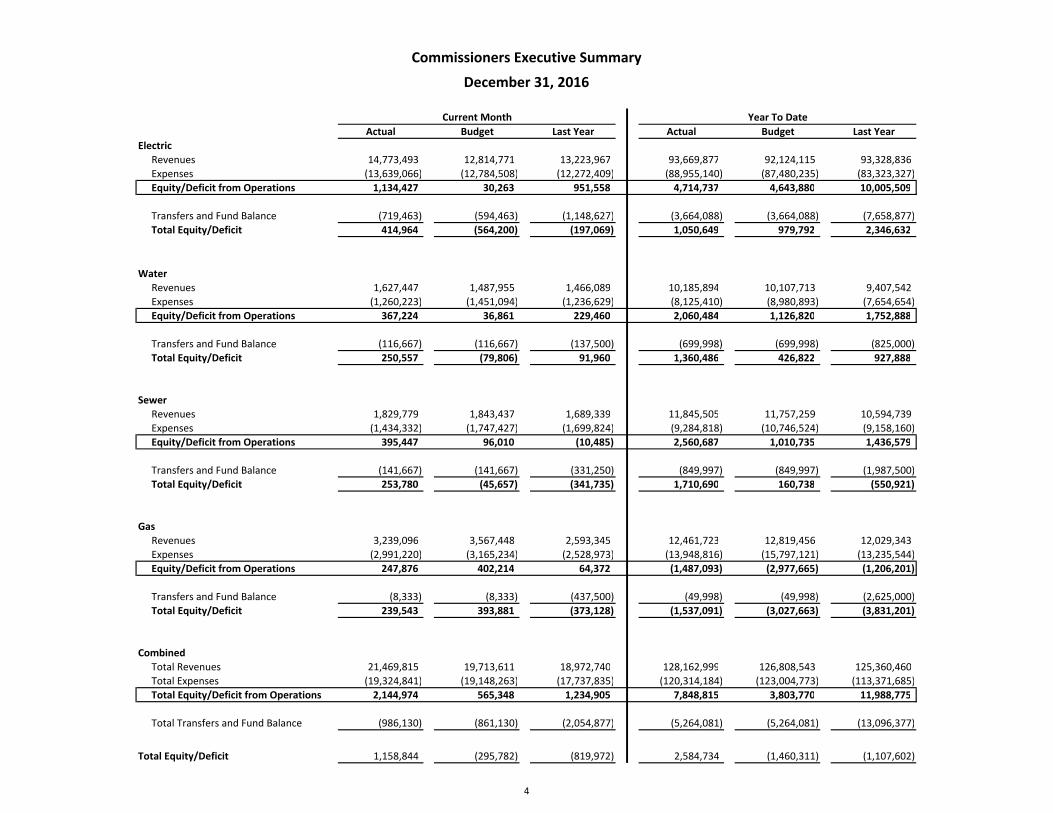
Actual Budget Last Year Actual Budget Last YearElectric
Revenues 14,773,493 12,814,771 13,223,967 93,669,877 92,124,115 93,328,836 Expenses (13,639,066) (12,784,508) (12,272,409) (88,955,140) (87,480,235) (83,323,327) Equity/Deficit from Operations 1,134,427 30,263 951,558 4,714,737 4,643,880 10,005,509
Transfers and Fund Balance (719,463) (594,463) (1,148,627) (3,664,088) (3,664,088) (7,658,877) Total Equity/Deficit 414,964 (564,200) (197,069) 1,050,649 979,792 2,346,632
WaterRevenues 1,627,447 1,487,955 1,466,089 10,185,894 10,107,713 9,407,542 Expenses (1,260,223) (1,451,094) (1,236,629) (8,125,410) (8,980,893) (7,654,654) Equity/Deficit from Operations 367,224 36,861 229,460 2,060,484 1,126,820 1,752,888
Transfers and Fund Balance (116,667) (116,667) (137,500) (699,998) (699,998) (825,000) Total Equity/Deficit 250,557 (79,806) 91,960 1,360,486 426,822 927,888
SewerRevenues 1,829,779 1,843,437 1,689,339 11,845,505 11,757,259 10,594,739 Expenses (1,434,332) (1,747,427) (1,699,824) (9,284,818) (10,746,524) (9,158,160) Equity/Deficit from Operations 395,447 96,010 (10,485) 2,560,687 1,010,735 1,436,579
Transfers and Fund Balance (141,667) (141,667) (331,250) (849,997) (849,997) (1,987,500) Total Equity/Deficit 253,780 (45,657) (341,735) 1,710,690 160,738 (550,921)
GasRevenues 3,239,096 3,567,448 2,593,345 12,461,723 12,819,456 12,029,343 Expenses (2,991,220) (3,165,234) (2,528,973) (13,948,816) (15,797,121) (13,235,544) Equity/Deficit from Operations 247,876 402,214 64,372 (1,487,093) (2,977,665) (1,206,201)
Transfers and Fund Balance (8,333) (8,333) (437,500) (49,998) (49,998) (2,625,000) Total Equity/Deficit 239,543 393,881 (373,128) (1,537,091) (3,027,663) (3,831,201)
Combined Total Revenues 21,469,815 19,713,611 18,972,740 128,162,999 126,808,543 125,360,460
Total Expenses (19,324,841) (19,148,263) (17,737,835) (120,314,184) (123,004,773) (113,371,685) Total Equity/Deficit from Operations 2,144,974 565,348 1,234,905 7,848,815 3,803,770 11,988,775
Total Transfers and Fund Balance (986,130) (861,130) (2,054,877) (5,264,081) (5,264,081) (13,096,377)
Total Equity/Deficit 1,158,844 (295,782) (819,972) 2,584,734 (1,460,311) (1,107,602)
Commissioners Executive Summary
December 31, 2016
Current Month Year To Date
4
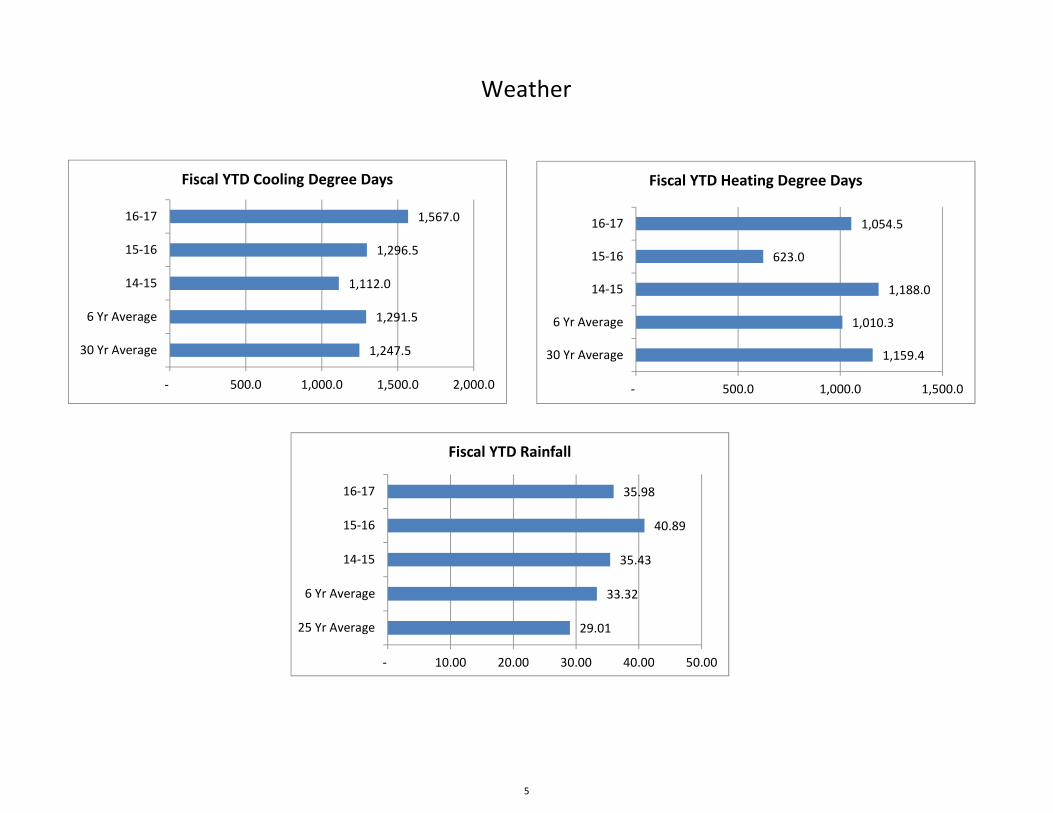
Weather
1,567.0
1,296.5
1,112.0
1,291.5
1,247.5
‐ 500.0 1,000.0 1,500.0 2,000.0
16‐17
15‐16
14‐15
6 Yr Average
30 Yr Average
Fiscal YTD Cooling Degree Days
35.98
40.89
35.43
33.32
29.01
‐ 10.00 20.00 30.00 40.00 50.00
16‐17
15‐16
14‐15
6 Yr Average
25 Yr Average
Fiscal YTD Rainfall
1,054.5
623.0
1,188.0
1,010.3
1,159.4
‐ 500.0 1,000.0 1,500.0
16‐17
15‐16
14‐15
6 Yr Average
30 Yr Average
Fiscal YTD Heating Degree Days
5
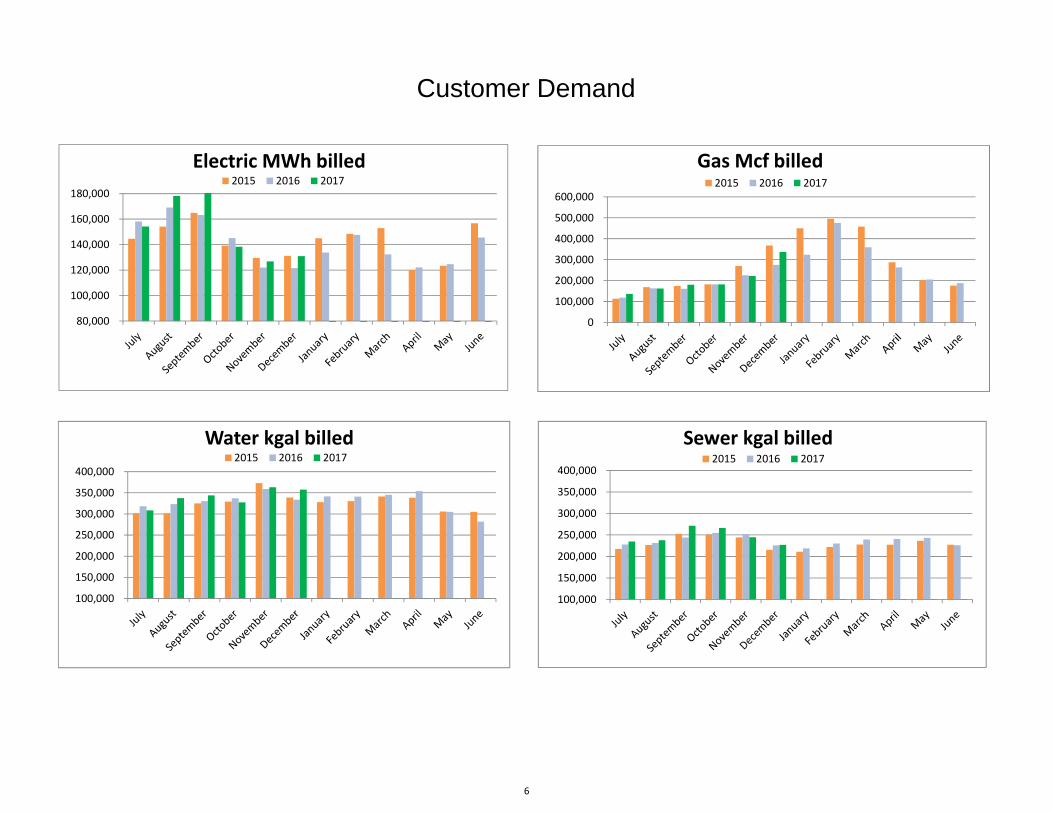
Customer Demand
100,000
150,000
200,000
250,000
300,000
350,000
400,000
Water kgal billed2015 2016 2017
100,000
150,000
200,000
250,000
300,000
350,000
400,000
Sewer kgal billed2015 2016 2017
0
100,000
200,000
300,000
400,000
500,000
600,000
Gas Mcf billed2015 2016 2017
80,000
100,000
120,000
140,000
160,000
180,000
Electric MWh billed2015 2016 2017
6
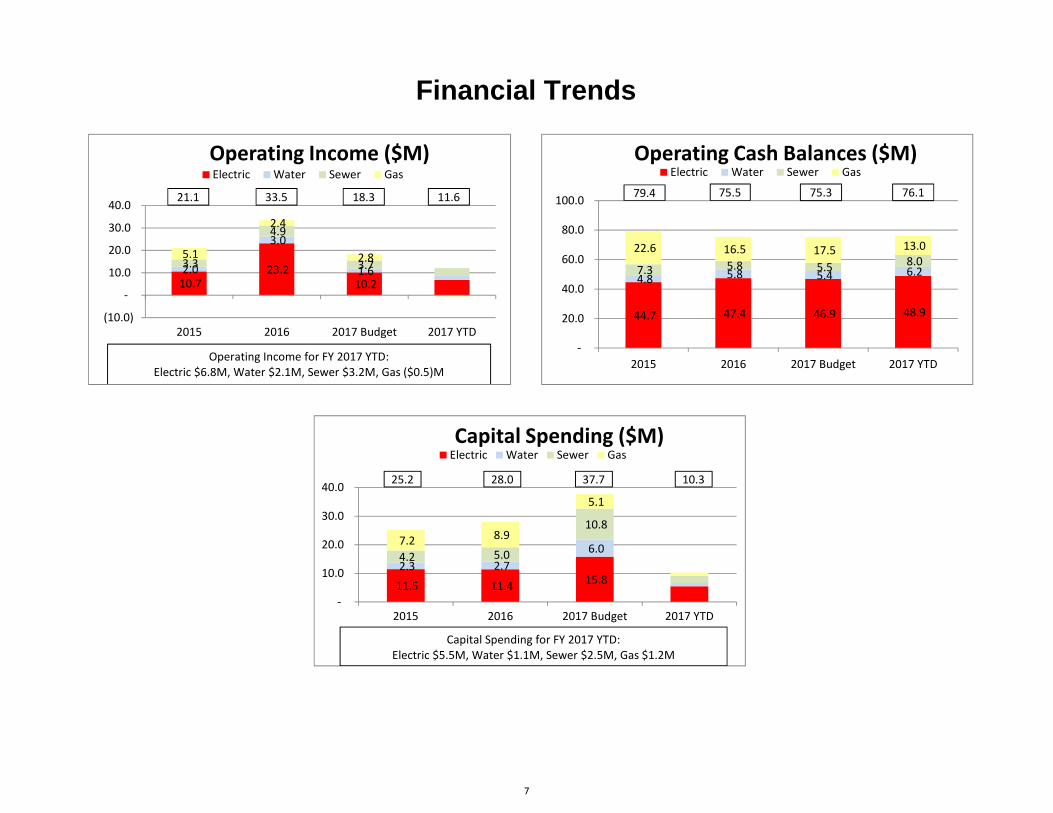
Financial Trends
10.7 23.2
10.2 2.0
3.0
1.6 3.3
4.9
3.7 5.1
2.4
2.8
(10.0)
‐
10.0
20.0
30.0
40.0
2015 2016 2017 Budget 2017 YTD
Operating Income ($M)Electric Water Sewer Gas
Operating Income for FY 2017 YTD:Electric $6.8M, Water $2.1M, Sewer $3.2M, Gas ($0.5)M
11.5 11.4 15.8 2.3 2.7
6.0 4.2 5.0
10.8 7.2 8.9
5.1
‐
10.0
20.0
30.0
40.0
2015 2016 2017 Budget 2017 YTD
Capital Spending ($M)Electric Water Sewer Gas
37.728.025.2 10.3
Capital Spending for FY 2017 YTD:Electric $5.5M, Water $1.1M, Sewer $2.5M, Gas $1.2M
44.7 47.4 46.9 48.9
4.8 5.8 5.4 6.2 7.3 5.8 5.5 8.0 22.6 16.5 17.5 13.0
‐
20.0
40.0
60.0
80.0
100.0
2015 2016 2017 Budget 2017 YTD
Operating Cash Balances ($M)Electric Water Sewer Gas
79.4 75.5 75.3 76.121.1 33.5 18.3 11.6
7
Revised Variance Revised Variance Original % of Change
December December Favorable YTD YTD Favorable Total Original December YTD Prior YTD toLine # Actual Budget (Unfavorable) Actual Budget (Unfavorable) Budget Budget Actual Actual Current YTD
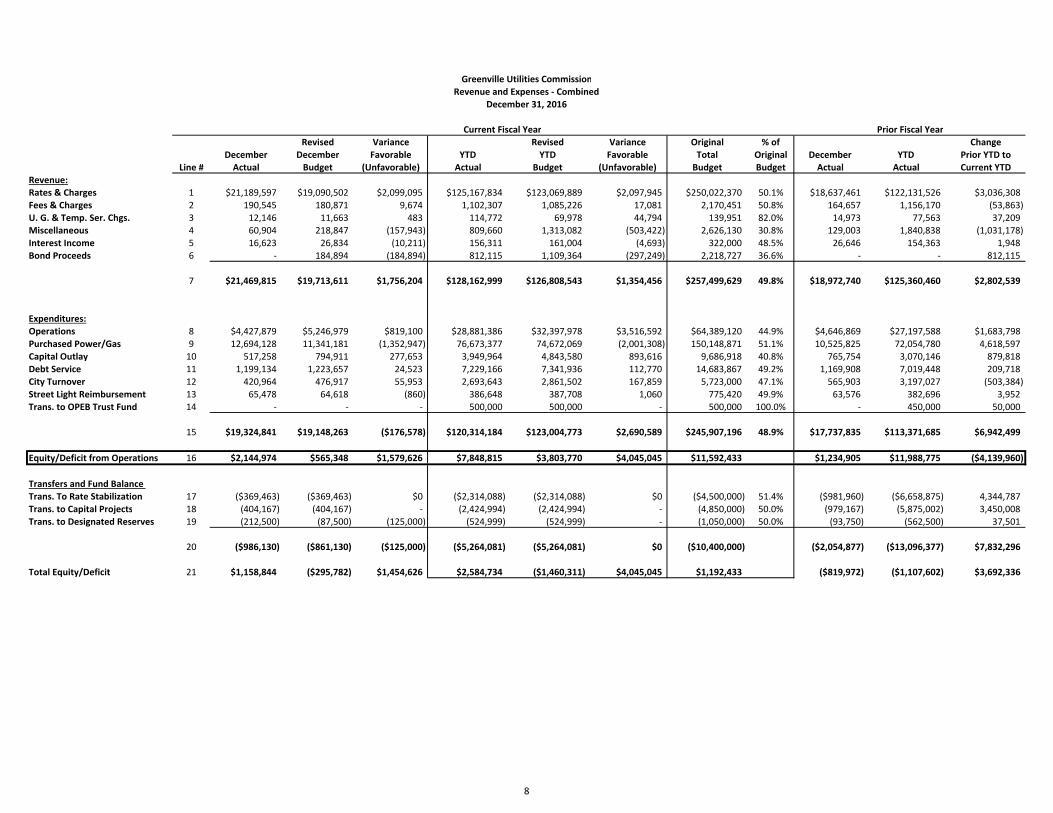
Revenue:Rates & Charges 1 $21,189,597 $19,090,502 $2,099,095 $125,167,834 $123,069,889 $2,097,945 $250,022,370 50.1% $18,637,461 $122,131,526 $3,036,308Fees & Charges 2 190,545 180,871 9,674 1,102,307 1,085,226 17,081 2,170,451 50.8% 164,657 1,156,170 (53,863) U. G. & Temp. Ser. Chgs. 3 12,146 11,663 483 114,772 69,978 44,794 139,951 82.0% 14,973 77,563 37,209 Miscellaneous 4 60,904 218,847 (157,943) 809,660 1,313,082 (503,422) 2,626,130 30.8% 129,003 1,840,838 (1,031,178) Interest Income 5 16,623 26,834 (10,211) 156,311 161,004 (4,693) 322,000 48.5% 26,646 154,363 1,948 Bond Proceeds 6 ‐ 184,894 (184,894) 812,115 1,109,364 (297,249) 2,218,727 36.6% ‐ ‐ 812,115
7 $21,469,815 $19,713,611 $1,756,204 $128,162,999 $126,808,543 $1,354,456 $257,499,629 49.8% $18,972,740 $125,360,460 $2,802,539
Expenditures: Operations 8 $4,427,879 $5,246,979 $819,100 $28,881,386 $32,397,978 $3,516,592 $64,389,120 44.9% $4,646,869 $27,197,588 $1,683,798Purchased Power/Gas 9 12,694,128 11,341,181 (1,352,947) 76,673,377 74,672,069 (2,001,308) 150,148,871 51.1% 10,525,825 72,054,780 4,618,597 Capital Outlay 10 517,258 794,911 277,653 3,949,964 4,843,580 893,616 9,686,918 40.8% 765,754 3,070,146 879,818 Debt Service 11 1,199,134 1,223,657 24,523 7,229,166 7,341,936 112,770 14,683,867 49.2% 1,169,908 7,019,448 209,718 City Turnover 12 420,964 476,917 55,953 2,693,643 2,861,502 167,859 5,723,000 47.1% 565,903 3,197,027 (503,384) Street Light Reimbursement 13 65,478 64,618 (860) 386,648 387,708 1,060 775,420 49.9% 63,576 382,696 3,952 Trans. to OPEB Trust Fund 14 ‐ ‐ ‐ 500,000 500,000 ‐ 500,000 100.0% ‐ 450,000 50,000
15 $19,324,841 $19,148,263 ($176,578) $120,314,184 $123,004,773 $2,690,589 $245,907,196 48.9% $17,737,835 $113,371,685 $6,942,499
Equity/Deficit from Operations 16 $2,144,974 $565,348 $1,579,626 $7,848,815 $3,803,770 $4,045,045 $11,592,433 $1,234,905 $11,988,775 ($4,139,960)
Transfers and Fund Balance Trans. To Rate Stabilization 17 ($369,463) ($369,463) $0 ($2,314,088) ($2,314,088) $0 ($4,500,000) 51.4% ($981,960) ($6,658,875) 4,344,787 Trans. to Capital Projects 18 (404,167) (404,167) ‐ (2,424,994) (2,424,994) ‐ (4,850,000) 50.0% (979,167) (5,875,002) 3,450,008 Trans. to Designated Reserves 19 (212,500) (87,500) (125,000) (524,999) (524,999) ‐ (1,050,000) 50.0% (93,750) (562,500) 37,501
20 ($986,130) ($861,130) ($125,000) ($5,264,081) ($5,264,081) $0 ($10,400,000) ($2,054,877) ($13,096,377) $7,832,296
Total Equity/Deficit 21 $1,158,844 ($295,782) $1,454,626 $2,584,734 ($1,460,311) $4,045,045 $1,192,433 ($819,972) ($1,107,602) $3,692,336
Current Fiscal Year Prior Fiscal Year
Greenville Utilities CommissionRevenue and Expenses ‐ Combined
December 31, 2016
8
Variance Variance Original % of Change
December December Favorable YTD YTD Favorable Total Original December YTD Prior YTD toLine # Actual Budget (Unfavorable) Actual Budget (Unfavorable) Budget Budget Actual Actual Current YTD
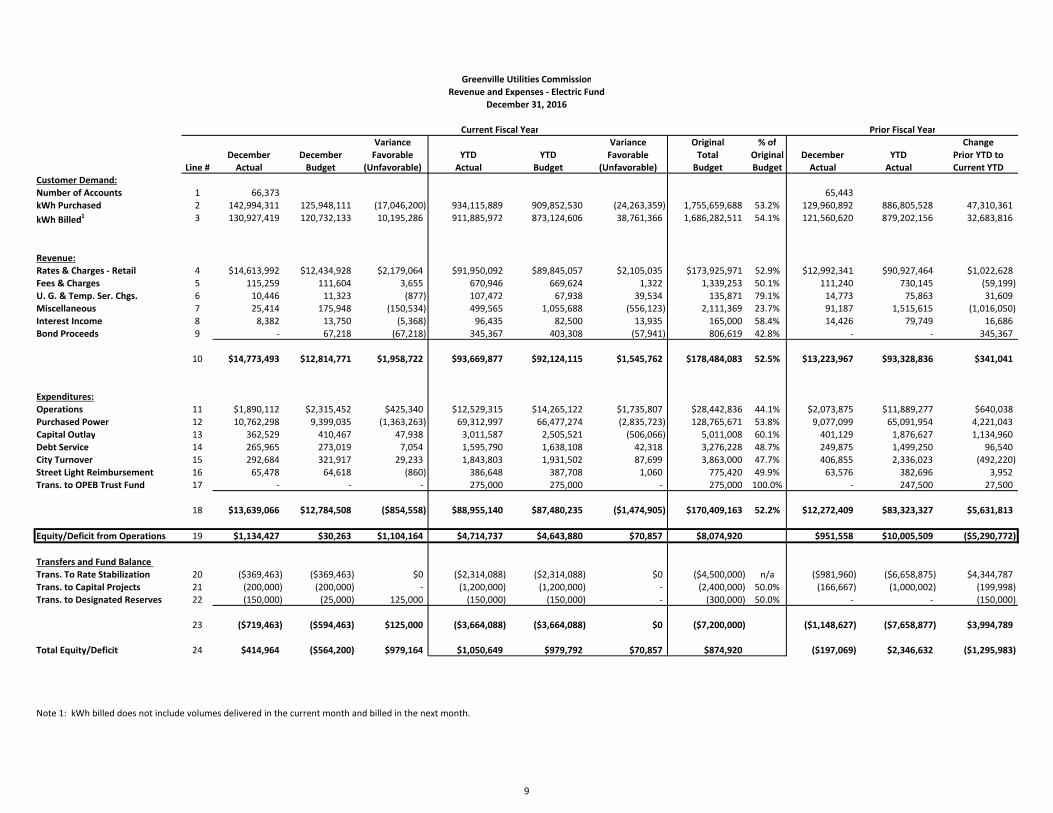
Customer Demand:Number of Accounts 1 66,373 65,443 kWh Purchased 2 142,994,311 125,948,111 (17,046,200) 934,115,889 909,852,530 (24,263,359) 1,755,659,688 53.2% 129,960,892 886,805,528 47,310,361 kWh Billed1 3 130,927,419 120,732,133 10,195,286 911,885,972 873,124,606 38,761,366 1,686,282,511 54.1% 121,560,620 879,202,156 32,683,816
Revenue:Rates & Charges ‐ Retail 4 $14,613,992 $12,434,928 $2,179,064 $91,950,092 $89,845,057 $2,105,035 $173,925,971 52.9% $12,992,341 $90,927,464 $1,022,628Fees & Charges 5 115,259 111,604 3,655 670,946 669,624 1,322 1,339,253 50.1% 111,240 730,145 (59,199) U. G. & Temp. Ser. Chgs. 6 10,446 11,323 (877) 107,472 67,938 39,534 135,871 79.1% 14,773 75,863 31,609 Miscellaneous 7 25,414 175,948 (150,534) 499,565 1,055,688 (556,123) 2,111,369 23.7% 91,187 1,515,615 (1,016,050) Interest Income 8 8,382 13,750 (5,368) 96,435 82,500 13,935 165,000 58.4% 14,426 79,749 16,686 Bond Proceeds 9 ‐ 67,218 (67,218) 345,367 403,308 (57,941) 806,619 42.8% ‐ ‐ 345,367
10 $14,773,493 $12,814,771 $1,958,722 $93,669,877 $92,124,115 $1,545,762 $178,484,083 52.5% $13,223,967 $93,328,836 $341,041
Expenditures: Operations 11 $1,890,112 $2,315,452 $425,340 $12,529,315 $14,265,122 $1,735,807 $28,442,836 44.1% $2,073,875 $11,889,277 $640,038Purchased Power 12 10,762,298 9,399,035 (1,363,263) 69,312,997 66,477,274 (2,835,723) 128,765,671 53.8% 9,077,099 65,091,954 4,221,043 Capital Outlay 13 362,529 410,467 47,938 3,011,587 2,505,521 (506,066) 5,011,008 60.1% 401,129 1,876,627 1,134,960 Debt Service 14 265,965 273,019 7,054 1,595,790 1,638,108 42,318 3,276,228 48.7% 249,875 1,499,250 96,540 City Turnover 15 292,684 321,917 29,233 1,843,803 1,931,502 87,699 3,863,000 47.7% 406,855 2,336,023 (492,220) Street Light Reimbursement 16 65,478 64,618 (860) 386,648 387,708 1,060 775,420 49.9% 63,576 382,696 3,952 Trans. to OPEB Trust Fund 17 ‐ ‐ ‐ 275,000 275,000 ‐ 275,000 100.0% ‐ 247,500 27,500
18 $13,639,066 $12,784,508 ($854,558) $88,955,140 $87,480,235 ($1,474,905) $170,409,163 52.2% $12,272,409 $83,323,327 $5,631,813
Equity/Deficit from Operations 19 $1,134,427 $30,263 $1,104,164 $4,714,737 $4,643,880 $70,857 $8,074,920 $951,558 $10,005,509 ($5,290,772)
Transfers and Fund Balance Trans. To Rate Stabilization 20 ($369,463) ($369,463) $0 ($2,314,088) ($2,314,088) $0 ($4,500,000) n/a ($981,960) ($6,658,875) $4,344,787Trans. to Capital Projects 21 (200,000) (200,000) ‐ (1,200,000) (1,200,000) ‐ (2,400,000) 50.0% (166,667) (1,000,002) (199,998) Trans. to Designated Reserves 22 (150,000) (25,000) 125,000 (150,000) (150,000) ‐ (300,000) 50.0% ‐ ‐ (150,000)
23 ($719,463) ($594,463) $125,000 ($3,664,088) ($3,664,088) $0 ($7,200,000) ($1,148,627) ($7,658,877) $3,994,789
Total Equity/Deficit 24 $414,964 ($564,200) $979,164 $1,050,649 $979,792 $70,857 $874,920 ($197,069) $2,346,632 ($1,295,983)
Note 1: kWh billed does not include volumes delivered in the current month and billed in the next month.
Greenville Utilities CommissionRevenue and Expenses ‐ Electric Fund
December 31, 2016
Current Fiscal Year Prior Fiscal Year
9
Variance Variance Original % of Change
December December Favorable YTD YTD Favorable Total Original December YTD Prior YTD toLine # Actual Budget (Unfavorable) Actual Budget (Unfavorable) Budget Budget Actual Actual Current YTD
Customer Demand:Number of Accounts 1 35,679 35,249 Kgallons Pumped 2 430,692 336,305 (94,387) 2,443,915 2,290,249 (153,666) 4,488,709 54.4% 395,763 2,380,000 63,915 Kgallons Billed ‐ Retail 3 266,333 246,703 19,630 1,767,051 1,765,158 1,893 3,352,064 52.7% 254,205 1,760,748 6,303 Kgallons Billed ‐ Wholesale1 4 91,076 77,310 13,766 270,461 230,222 40,239 589,784 45.9% 79,522 240,630 29,831 Kgallons Billed 5 357,409 324,013 33,396 2,037,512 1,995,380 42,132 3,941,848 51.7% 333,727 2,001,378 36,134
Revenue:Rates & Charges ‐ Retail 6 $1,408,397 $1,284,696 $123,701 $9,166,667 $9,296,890 ($130,223) $17,584,407 52.1% $1,283,084 $8,616,810 $549,857Rates & Charges ‐ Wholesale1 7 167,321 143,542 23,779 529,408 452,521 76,887 1,130,914 46.8% 139,770 464,247 65,161 Fees & Charges 8 27,880 28,960 (1,080) 175,752 173,760 1,992 347,527 50.6% 21,192 175,050 702 Temporary Service Charges 9 1,700 340 1,360 7,300 2,040 5,260 4,080 178.9% 200 1,700 5,600 Miscellaneous 10 19,052 20,031 (979) 138,988 120,186 18,802 240,370 57.8% 17,857 126,387 12,601 Interest Income 11 3,097 3,750 (653) 21,139 22,500 (1,361) 45,000 47.0% 3,986 23,348 (2,209) Bond Proceeds 12 ‐ 6,636 (6,636) 146,640 39,816 106,824 79,633 184.1% ‐ ‐ 146,640
13 $1,627,447 $1,487,955 $139,492 $10,185,894 $10,107,713 $78,181 $19,431,931 52.4% $1,466,089 $9,407,542 $778,352
Expenditures: Operations 14 $907,655 $1,070,468 $162,813 $5,986,881 $6,617,625 $630,744 $13,202,792 45.3% $906,285 $5,548,107 $438,774Capital Outlay 15 55,913 81,025 25,112 283,599 490,662 207,063 981,270 28.9% 26,832 217,975 65,624 Debt Service 16 296,655 299,601 2,946 1,779,930 1,797,606 17,676 3,595,217 49.5% 303,512 1,821,072 (41,142) Trans. to OPEB Trust Fund 17 ‐ ‐ ‐ 75,000 75,000 ‐ 75,000 100.0% ‐ 67,500 7,500
18 $1,260,223 $1,451,094 $190,871 $8,125,410 $8,980,893 $855,483 $17,854,279 45.5% $1,236,629 $7,654,654 $470,756
Equity/Deficit from Operations 19 $367,224 $36,861 $330,363 $2,060,484 $1,126,820 $933,664 $1,577,652 $229,460 $1,752,888 $307,596
Transfers and Fund Balance Trans. to Capital Projects 20 ($91,667) ($91,667) $0 ($549,998) ($549,998) $0 ($1,100,000) n/a ($87,500) ($525,000) ($24,998)Trans. to Designated Reserves 21 (25,000) (25,000) ‐ (150,000) (150,000) ‐ (300,000) n/a (50,000) (300,000) 150,000
22 ($116,667) ($116,667) $0 ($699,998) ($699,998) $0 ($1,400,000) ($137,500) ($825,000) $125,002
Total Equity/Deficit 23 $250,557 ($79,806) $330,363 $1,360,486 $426,822 $933,664 $177,652 $91,960 $927,888 $432,598
Note 1: Kgallons Billed ‐ Wholesale and Rates and Charges ‐ Wholesale represents sales to the Town of Bethel, the Town of Farmville, Greene County, the Town of Winterville and Stokes Regional Water Corporation.
Greenville Utilities CommissionRevenue and Expenses ‐ Water Fund
December 31, 2016
Current Fiscal Year Prior Fiscal Year
10
Variance Variance Original % of Change
December December Favorable YTD YTD Favorable Total Original December YTD Prior YTD toLine # Actual Budget (Unfavorable) Actual Budget (Unfavorable) Budget Budget Actual Actual Current YTD
Customer Demand:Number of Accounts 1 29,359 28,940 Kgallons Total Flow 2 262,790 326,442 63,652 2,000,700 1,986,308 (14,392) 4,042,619 49.5% 360,030 1,980,960 19,740 Kgallons Billed ‐ Retail 3 220,867 209,293 11,574 1,413,331 1,369,064 44,267 2,685,541 52.6% 210,868 1,378,673 34,658 Kgallons Billed ‐ Wholesale1 4 6,166 13,678 (7,512) 68,692 51,782 16,910 118,724 57.9% 15,039 56,895 11,797 Total Kgallons Billed 5 227,033 222,971 4,062 1,482,023 1,420,846 61,177 2,804,265 52.8% 225,907 1,435,568 46,455
Revenue:Rates & Charges ‐ Retail 6 $1,756,250 $1,644,298 $111,952 $11,027,573 $10,732,042 $295,531 $21,063,224 52.4% $1,576,289 $9,995,931 $1,031,642Rates & Charges ‐ Wholesale1 7 34,531 76,600 (42,069) 384,675 289,983 94,692 664,854 57.9% 84,220 318,612 66,063 Fees & Charges 8 28,766 28,460 306 173,295 170,760 2,535 341,518 50.7% 15,970 175,140 (1,845) Miscellaneous 9 8,321 10,755 (2,434) 61,782 64,530 (2,748) 129,041 47.9% 10,093 89,432 (27,650) Interest Income 10 1,911 2,667 (756) 12,665 16,002 (3,337) 32,000 39.6% 2,767 15,624 (2,959) Bond Proceeds 11 ‐ 80,657 (80,657) 185,515 483,942 (298,427) 967,880 19.2% ‐ ‐ 185,515
12 $1,829,779 $1,843,437 ($13,658) $11,845,505 $11,757,259 $88,246 $23,198,517 51.1% $1,689,339 $10,594,739 $1,250,766
Expenditures: Operations 13 $915,123 $1,066,675 $151,552 $5,882,719 $6,582,899 $700,180 $13,141,223 44.8% $948,261 $5,607,857 $274,862Capital Outlay 14 11,686 161,307 149,621 247,599 971,955 724,356 1,943,810 12.7% 243,918 436,933 (189,334) Debt Service 15 507,523 519,445 11,922 3,079,500 3,116,670 37,170 6,233,324 49.4% 507,645 3,045,870 33,630 Trans. to OPEB Trust Fund 16 ‐ ‐ ‐ 75,000 75,000 ‐ 75,000 100.0% ‐ 67,500 7,500
17 $1,434,332 $1,747,427 $313,095 $9,284,818 $10,746,524 $1,461,706 $21,393,357 43.4% $1,699,824 $9,158,160 $126,658
Equity/Deficit from Operations 18 $395,447 $96,010 $299,437 $2,560,687 $1,010,735 $1,549,952 $1,805,160 ($10,485) $1,436,579 $1,124,108
Transfers and Fund Balance Trans. to Capital Projects 19 ($104,167) ($104,167) $0 ($624,998) ($624,998) $0 ($1,250,000) 50.0% ($287,500) ($1,725,000) $1,100,002Trans. to Designated Reserves 20 (37,500) (37,500) ‐ (224,999) (224,999) ‐ (450,000) n/a (43,750) (262,500) 37,501
21 ($141,667) ($141,667) $0 ($849,997) ($849,997) $0 ($1,700,000) ($331,250) ($1,987,500) $1,137,503
Total Equity/Deficit 22 $253,780 ($45,657) $299,437 $1,710,690 $160,738 $1,549,952 $105,160 ($341,735) ($550,921) $2,261,611
Note 1: Kgallons Billed ‐ Wholesale and Rates and Charges ‐ Wholesale represents sales to the Town of Bethel and the Town of Grimesland.
Greenville Utilities CommissionRevenue and Expenses ‐ Sewer Fund
December 31, 2016
Current Fiscal Year Prior Fiscal Year
11
Variance Variance Original % of Change
December December Favorable YTD YTD Favorable Total Original December YTD Prior YTD toLine # Actual Budget (Unfavorable) Actual Budget (Unfavorable) Budget Budget Actual Actual Current YTD
Customer Demand:Number of Accounts 1 23,096 22,948 CCFs Purchased 2 4,176,582 3,262,377 (914,205) 14,649,764 13,344,823 (1,304,941) 34,743,097 42.2% 2,745,368 12,880,637 1,769,127 CCFs Delivered to GUC 3 4,040,779 3,167,115 (873,664) 14,036,269 12,955,154 (1,081,115) 33,728,599 41.6% 2,665,203 12,504,522 1,531,747 CCFs Billed ‐ Firm 4 1,984,239 1,723,987 260,252 5,188,232 5,030,983 157,249 16,776,000 30.9% 1,442,676 4,479,090 709,142 CCFs Billed ‐ Interruptible 5 1,378,965 1,361,448 17,517 7,001,346 7,049,965 (48,619) 15,559,400 45.0% 1,305,784 6,765,782 235,564 CCFs Billed ‐ Total 6 3,363,204 3,085,435 277,769 12,189,578 12,080,948 108,630 32,335,400 37.7% 2,748,460 11,244,872 944,706
Revenue:Rates & Charges ‐ Retail 7 $3,209,106 $3,506,438 ($297,332) $12,109,419 $12,453,396 ($343,977) $35,653,000 34.0% $2,561,757 $11,808,462 $300,957Fees & Charges 8 18,640 11,847 6,793 82,314 71,082 11,232 142,153 57.9% 16,255 75,835 6,479 Miscellaneous 9 8,117 12,113 (3,996) 109,325 72,678 36,647 145,350 75.2% 9,866 109,404 (79) Interest Income 10 3,233 6,667 (3,434) 26,072 40,002 (13,930) 80,000 32.6% 5,467 35,642 (9,570) Bond Proceeds 11 ‐ 30,383 (30,383) 134,593 182,298 (47,705) 364,595 36.9% ‐ ‐ 134,593
12 $3,239,096 $3,567,448 ($328,352) $12,461,723 $12,819,456 ($357,733) $36,385,098 34.2% $2,593,345 $12,029,343 $432,380
Expenditures: Operations 13 $714,989 $794,384 $79,395 $4,482,471 $4,932,332 $449,861 $9,602,269 46.7% $718,448 $4,152,347 $330,124Purchased Gas 14 1,931,830 1,942,146 10,316 7,360,380 8,194,795 834,415 21,383,200 34.4% 1,448,726 6,962,826 397,554 Capital Outlay 15 87,130 142,112 54,982 407,179 875,442 468,263 1,750,830 23.3% 93,875 538,611 (131,432) Debt Service 16 128,991 131,592 2,601 773,946 789,552 15,606 1,579,098 49.0% 108,876 653,256 120,690 City Turnover 17 128,280 155,000 26,720 849,840 930,000 80,160 1,860,000 45.7% 159,048 861,004 (11,164) Trans. to OPEB Trust Fund 18 ‐ ‐ ‐ 75,000 75,000 ‐ 75,000 100.0% ‐ 67,500 7,500
19 $2,991,220 $3,165,234 $174,014 $13,948,816 $15,797,121 $1,848,305 $36,250,397 38.5% $2,528,973 $13,235,544 $713,272
Equity/Deficit from Operations 20 $247,876 $402,214 ($154,338) ($1,487,093) ($2,977,665) $1,490,572 $134,701 $64,372 ($1,206,201) ($280,892)
Transfers and Fund Balance Trans. to Capital Projects 21 ($8,333) ($8,333) $0 ($49,998) ($49,998) $0 ($100,000) 50.0% ($437,500) ($2,625,000) $2,575,002
22 ($8,333) ($8,333) $0 ($49,998) ($49,998) $0 ($100,000) ($437,500) ($2,625,000) $2,575,002
Total Equity/Deficit 23 $239,543 $393,881 ($154,338) ($1,537,091) ($3,027,663) $1,490,572 $34,701 ($373,128) ($3,831,201) $2,294,110
Greenville Utilities CommissionRevenue and Expenses ‐ Gas Fund
December 31, 2016
Current Fiscal Year Prior Fiscal Year
12
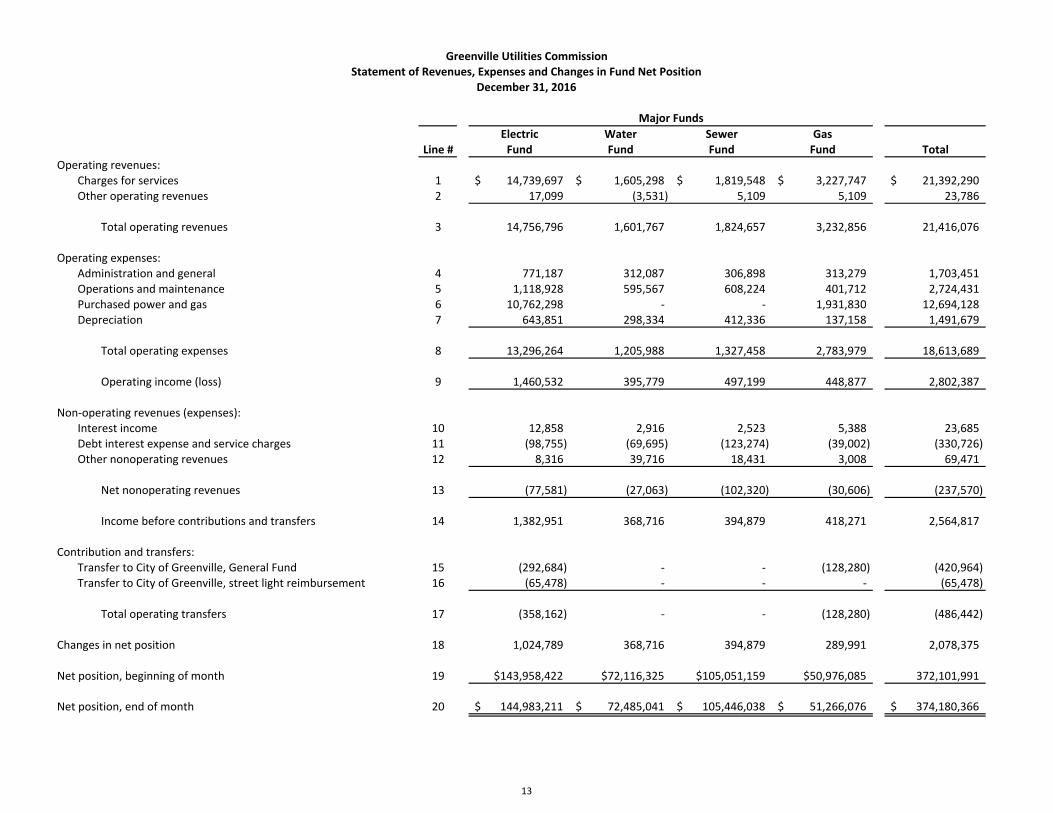
Electric Water Sewer GasLine # Fund Fund Fund Fund Total
Operating revenues:Charges for services 1 14,739,697$ 1,605,298$ 1,819,548$ 3,227,747$ 21,392,290$ Other operating revenues 2 17,099 (3,531) 5,109 5,109 23,786
Total operating revenues 3 14,756,796 1,601,767 1,824,657 3,232,856 21,416,076
Operating expenses:Administration and general 4 771,187 312,087 306,898 313,279 1,703,451 Operations and maintenance 5 1,118,928 595,567 608,224 401,712 2,724,431 Purchased power and gas 6 10,762,298 ‐ ‐ 1,931,830 12,694,128 Depreciation 7 643,851 298,334 412,336 137,158 1,491,679
Total operating expenses 8 13,296,264 1,205,988 1,327,458 2,783,979 18,613,689
Operating income (loss) 9 1,460,532 395,779 497,199 448,877 2,802,387
Non‐operating revenues (expenses):Interest income 10 12,858 2,916 2,523 5,388 23,685 Debt interest expense and service charges 11 (98,755) (69,695) (123,274) (39,002) (330,726) Other nonoperating revenues 12 8,316 39,716 18,431 3,008 69,471
Net nonoperating revenues 13 (77,581) (27,063) (102,320) (30,606) (237,570)
Income before contributions and transfers 14 1,382,951 368,716 394,879 418,271 2,564,817
Contribution and transfers:Transfer to City of Greenville, General Fund 15 (292,684) ‐ ‐ (128,280) (420,964) Transfer to City of Greenville, street light reimbursement 16 (65,478) ‐ ‐ ‐ (65,478)
Total operating transfers 17 (358,162) ‐ ‐ (128,280) (486,442)
Changes in net position 18 1,024,789 368,716 394,879 289,991 2,078,375
Net position, beginning of month 19 $143,958,422 $72,116,325 $105,051,159 $50,976,085 372,101,991
Net position, end of month 20 144,983,211$ 72,485,041$ 105,446,038$ 51,266,076$ 374,180,366$
Major Funds
Greenville Utilities CommissionStatement of Revenues, Expenses and Changes in Fund Net Position
December 31, 2016
13
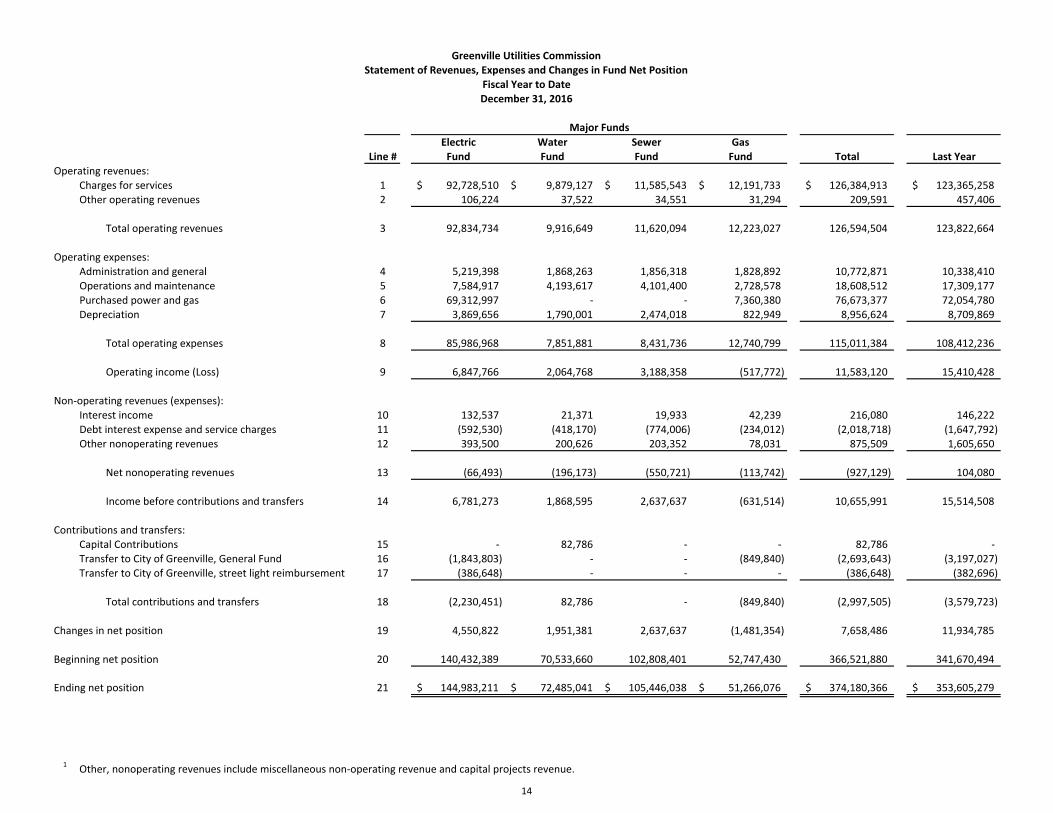
Electric Water Sewer GasLine # Fund Fund Fund Fund Total Last Year
Operating revenues:Charges for services 1 92,728,510$ 9,879,127$ 11,585,543$ 12,191,733$ 126,384,913$ 123,365,258$ Other operating revenues 2 106,224 37,522 34,551 31,294 209,591 457,406
Total operating revenues 3 92,834,734 9,916,649 11,620,094 12,223,027 126,594,504 123,822,664
Operating expenses:Administration and general 4 5,219,398 1,868,263 1,856,318 1,828,892 10,772,871 10,338,410 Operations and maintenance 5 7,584,917 4,193,617 4,101,400 2,728,578 18,608,512 17,309,177 Purchased power and gas 6 69,312,997 ‐ ‐ 7,360,380 76,673,377 72,054,780 Depreciation 7 3,869,656 1,790,001 2,474,018 822,949 8,956,624 8,709,869
Total operating expenses 8 85,986,968 7,851,881 8,431,736 12,740,799 115,011,384 108,412,236
Operating income (Loss) 9 6,847,766 2,064,768 3,188,358 (517,772) 11,583,120 15,410,428
Non‐operating revenues (expenses):Interest income 10 132,537 21,371 19,933 42,239 216,080 146,222 Debt interest expense and service charges 11 (592,530) (418,170) (774,006) (234,012) (2,018,718) (1,647,792) Other nonoperating revenues 12 393,500 200,626 203,352 78,031 875,509 1,605,650
Net nonoperating revenues 13 (66,493) (196,173) (550,721) (113,742) (927,129) 104,080
Income before contributions and transfers 14 6,781,273 1,868,595 2,637,637 (631,514) 10,655,991 15,514,508
Contributions and transfers:Capital Contributions 15 ‐ 82,786 ‐ ‐ 82,786 ‐ Transfer to City of Greenville, General Fund 16 (1,843,803) ‐ ‐ (849,840) (2,693,643) (3,197,027) Transfer to City of Greenville, street light reimbursement 17 (386,648) ‐ ‐ ‐ (386,648) (382,696)
Total contributions and transfers 18 (2,230,451) 82,786 ‐ (849,840) (2,997,505) (3,579,723)
Changes in net position 19 4,550,822 1,951,381 2,637,637 (1,481,354) 7,658,486 11,934,785
Beginning net position 20 140,432,389 70,533,660 102,808,401 52,747,430 366,521,880 341,670,494
Ending net position 21 144,983,211$ 72,485,041$ 105,446,038$ 51,266,076$ 374,180,366$ 353,605,279$
1 Other, nonoperating revenues include miscellaneous non‐operating revenue and capital projects revenue.
Greenville Utilities CommissionStatement of Revenues, Expenses and Changes in Fund Net Position
December 31, 2016
Major Funds
Fiscal Year to Date
14
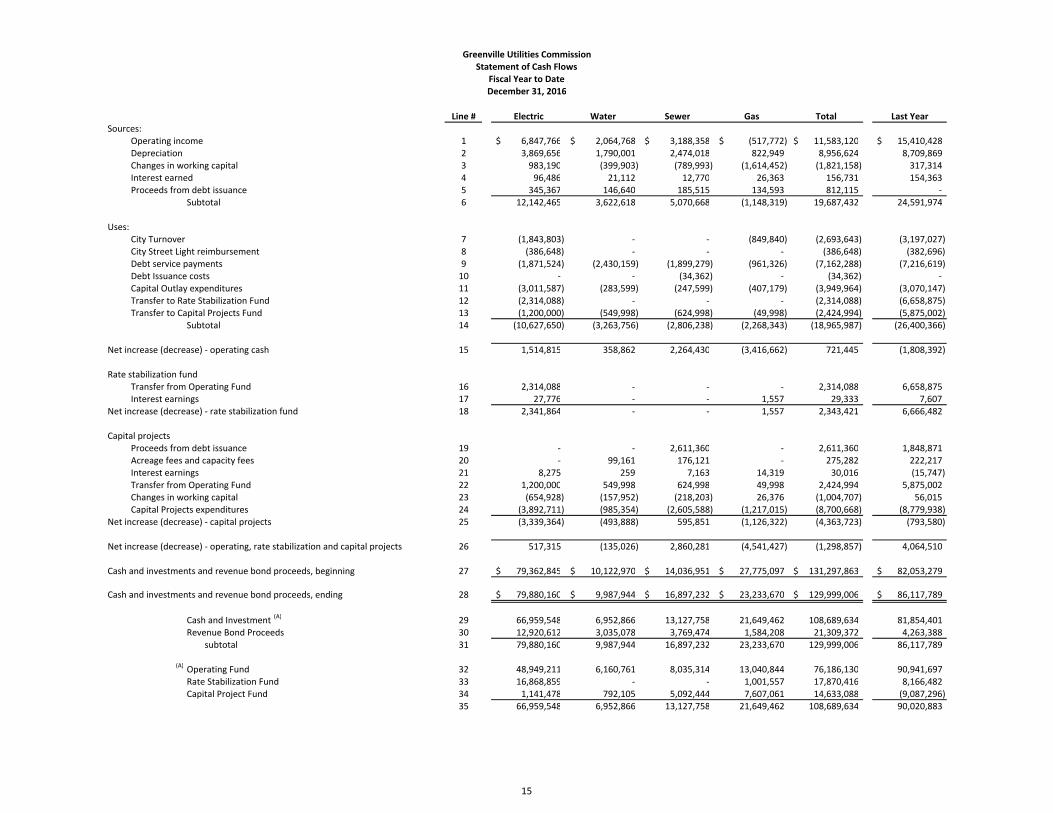
Line # Electric Water Sewer Gas Total Last YearSources:
Operating income 1 6,847,766$ 2,064,768$ 3,188,358$ (517,772)$ 11,583,120$ 15,410,428$ Depreciation 2 3,869,656 1,790,001 2,474,018 822,949 8,956,624 8,709,869 Changes in working capital 3 983,190 (399,903) (789,993) (1,614,452) (1,821,158) 317,314 Interest earned 4 96,486 21,112 12,770 26,363 156,731 154,363 Proceeds from debt issuance 5 345,367 146,640 185,515 134,593 812,115 ‐
Subtotal 6 12,142,465 3,622,618 5,070,668 (1,148,319) 19,687,432 24,591,974
Uses:City Turnover 7 (1,843,803) ‐ ‐ (849,840) (2,693,643) (3,197,027) City Street Light reimbursement 8 (386,648) ‐ ‐ ‐ (386,648) (382,696) Debt service payments 9 (1,871,524) (2,430,159) (1,899,279) (961,326) (7,162,288) (7,216,619) Debt Issuance costs 10 ‐ ‐ (34,362) ‐ (34,362) ‐ Capital Outlay expenditures 11 (3,011,587) (283,599) (247,599) (407,179) (3,949,964) (3,070,147) Transfer to Rate Stabilization Fund 12 (2,314,088) ‐ ‐ ‐ (2,314,088) (6,658,875) Transfer to Capital Projects Fund 13 (1,200,000) (549,998) (624,998) (49,998) (2,424,994) (5,875,002)
Subtotal 14 (10,627,650) (3,263,756) (2,806,238) (2,268,343) (18,965,987) (26,400,366)
Net increase (decrease) ‐ operating cash 15 1,514,815 358,862 2,264,430 (3,416,662) 721,445 (1,808,392)
Rate stabilization fundTransfer from Operating Fund 16 2,314,088 ‐ ‐ ‐ 2,314,088 6,658,875 Interest earnings 17 27,776 ‐ ‐ 1,557 29,333 7,607
Net increase (decrease) ‐ rate stabilization fund 18 2,341,864 ‐ ‐ 1,557 2,343,421 6,666,482
Capital projectsProceeds from debt issuance 19 ‐ ‐ 2,611,360 ‐ 2,611,360 1,848,871 Acreage fees and capacity fees 20 ‐ 99,161 176,121 ‐ 275,282 222,217 Interest earnings 21 8,275 259 7,163 14,319 30,016 (15,747) Transfer from Operating Fund 22 1,200,000 549,998 624,998 49,998 2,424,994 5,875,002 Changes in working capital 23 (654,928) (157,952) (218,203) 26,376 (1,004,707) 56,015 Capital Projects expenditures 24 (3,892,711) (985,354) (2,605,588) (1,217,015) (8,700,668) (8,779,938)
Net increase (decrease) ‐ capital projects 25 (3,339,364) (493,888) 595,851 (1,126,322) (4,363,723) (793,580)
Net increase (decrease) ‐ operating, rate stabilization and capital projects 26 517,315 (135,026) 2,860,281 (4,541,427) (1,298,857) 4,064,510
Cash and investments and revenue bond proceeds, beginning 27 79,362,845$ 10,122,970$ 14,036,951$ 27,775,097$ 131,297,863$ 82,053,279$
Cash and investments and revenue bond proceeds, ending 28 79,880,160$ 9,987,944$ 16,897,232$ 23,233,670$ 129,999,006$ 86,117,789$
Cash and Investment (A) 29 66,959,548 6,952,866 13,127,758 21,649,462 108,689,634 81,854,401 Revenue Bond Proceeds 30 12,920,612 3,035,078 3,769,474 1,584,208 21,309,372 4,263,388 subtotal 31 79,880,160 9,987,944 16,897,232 23,233,670 129,999,006 86,117,789
(A) Operating Fund 32 48,949,211 6,160,761 8,035,314 13,040,844 76,186,130 90,941,697 Rate Stabilization Fund 33 16,868,859 ‐ ‐ 1,001,557 17,870,416 8,166,482 Capital Project Fund 34 1,141,478 792,105 5,092,444 7,607,061 14,633,088 (9,087,296)
35 66,959,548 6,952,866 13,127,758 21,649,462 108,689,634 90,020,883
Greenville Utilities CommissionStatement of Cash Flows
Fiscal Year to DateDecember 31, 2016
15
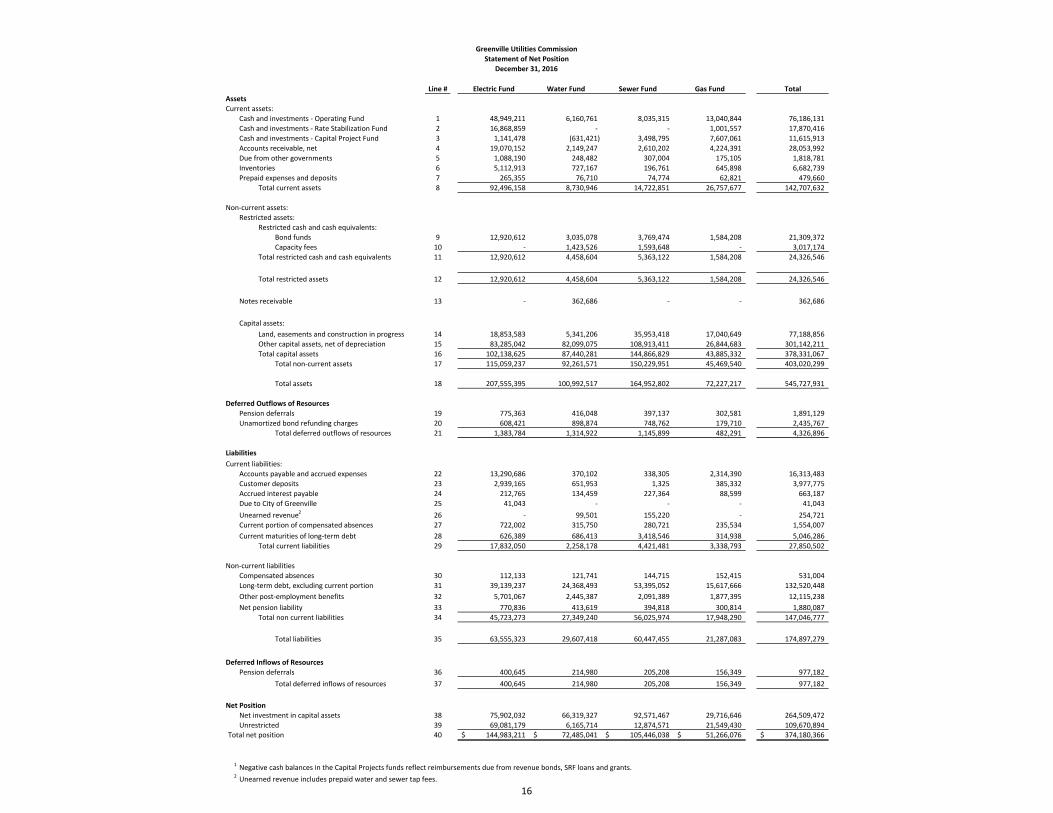
Line # Electric Fund Water Fund Sewer Fund Gas Fund TotalAssetsCurrent assets:
Cash and investments ‐ Operating Fund 1 48,949,211 6,160,761 8,035,315 13,040,844 76,186,131 Cash and investments ‐ Rate Stabilization Fund 2 16,868,859 ‐ ‐ 1,001,557 17,870,416 Cash and investments ‐ Capital Project Fund 3 1,141,478 (631,421) 3,498,795 7,607,061 11,615,913 Accounts receivable, net 4 19,070,152 2,149,247 2,610,202 4,224,391 28,053,992 Due from other governments 5 1,088,190 248,482 307,004 175,105 1,818,781 Inventories 6 5,112,913 727,167 196,761 645,898 6,682,739 Prepaid expenses and deposits 7 265,355 76,710 74,774 62,821 479,660
Total current assets 8 92,496,158 8,730,946 14,722,851 26,757,677 142,707,632
Non‐current assets:Restricted assets:
Restricted cash and cash equivalents:Bond funds 9 12,920,612 3,035,078 3,769,474 1,584,208 21,309,372 Capacity fees 10 ‐ 1,423,526 1,593,648 ‐ 3,017,174
Total restricted cash and cash equivalents 11 12,920,612 4,458,604 5,363,122 1,584,208 24,326,546
Total restricted assets 12 12,920,612 4,458,604 5,363,122 1,584,208 24,326,546
Notes receivable 13 ‐ 362,686 ‐ ‐ 362,686
Capital assets:Land, easements and construction in progress 14 18,853,583 5,341,206 35,953,418 17,040,649 77,188,856 Other capital assets, net of depreciation 15 83,285,042 82,099,075 108,913,411 26,844,683 301,142,211 Total capital assets 16 102,138,625 87,440,281 144,866,829 43,885,332 378,331,067
Total non‐current assets 17 115,059,237 92,261,571 150,229,951 45,469,540 403,020,299
Total assets 18 207,555,395 100,992,517 164,952,802 72,227,217 545,727,931
Deferred Outflows of ResourcesPension deferrals 19 775,363 416,048 397,137 302,581 1,891,129 Unamortized bond refunding charges 20 608,421 898,874 748,762 179,710 2,435,767
Total deferred outflows of resources 21 1,383,784 1,314,922 1,145,899 482,291 4,326,896
LiabilitiesCurrent liabilities:
Accounts payable and accrued expenses 22 13,290,686 370,102 338,305 2,314,390 16,313,483 Customer deposits 23 2,939,165 651,953 1,325 385,332 3,977,775 Accrued interest payable 24 212,765 134,459 227,364 88,599 663,187 Due to City of Greenville 25 41,043 ‐ ‐ ‐ 41,043 Unearned revenue2 26 ‐ 99,501 155,220 ‐ 254,721 Current portion of compensated absences 27 722,002 315,750 280,721 235,534 1,554,007 Current maturities of long‐term debt 28 626,389 686,413 3,418,546 314,938 5,046,286
Total current liabilities 29 17,832,050 2,258,178 4,421,481 3,338,793 27,850,502
Non‐current liabilitiesCompensated absences 30 112,133 121,741 144,715 152,415 531,004 Long‐term debt, excluding current portion 31 39,139,237 24,368,493 53,395,052 15,617,666 132,520,448 Other post‐employment benefits 32 5,701,067 2,445,387 2,091,389 1,877,395 12,115,238 Net pension liability 33 770,836 413,619 394,818 300,814 1,880,087
Total non current liabilities 34 45,723,273 27,349,240 56,025,974 17,948,290 147,046,777
Total liabilities 35 63,555,323 29,607,418 60,447,455 21,287,083 174,897,279
Deferred Inflows of ResourcesPension deferrals 36 400,645 214,980 205,208 156,349 977,182
Total deferred inflows of resources 37 400,645 214,980 205,208 156,349 977,182
Net PositionNet investment in capital assets 38 75,902,032 66,319,327 92,571,467 29,716,646 264,509,472 Unrestricted 39 69,081,179 6,165,714 12,874,571 21,549,430 109,670,894
Total net position 40 144,983,211$ 72,485,041$ 105,446,038$ 51,266,076$ 374,180,366$
1 Negative cash balances in the Capital Projects funds reflect reimbursements due from revenue bonds, SRF loans and grants.2 Unearned revenue includes prepaid water and sewer tap fees.
Greenville Utilities CommissionStatement of Net Position
December 31, 2016
16
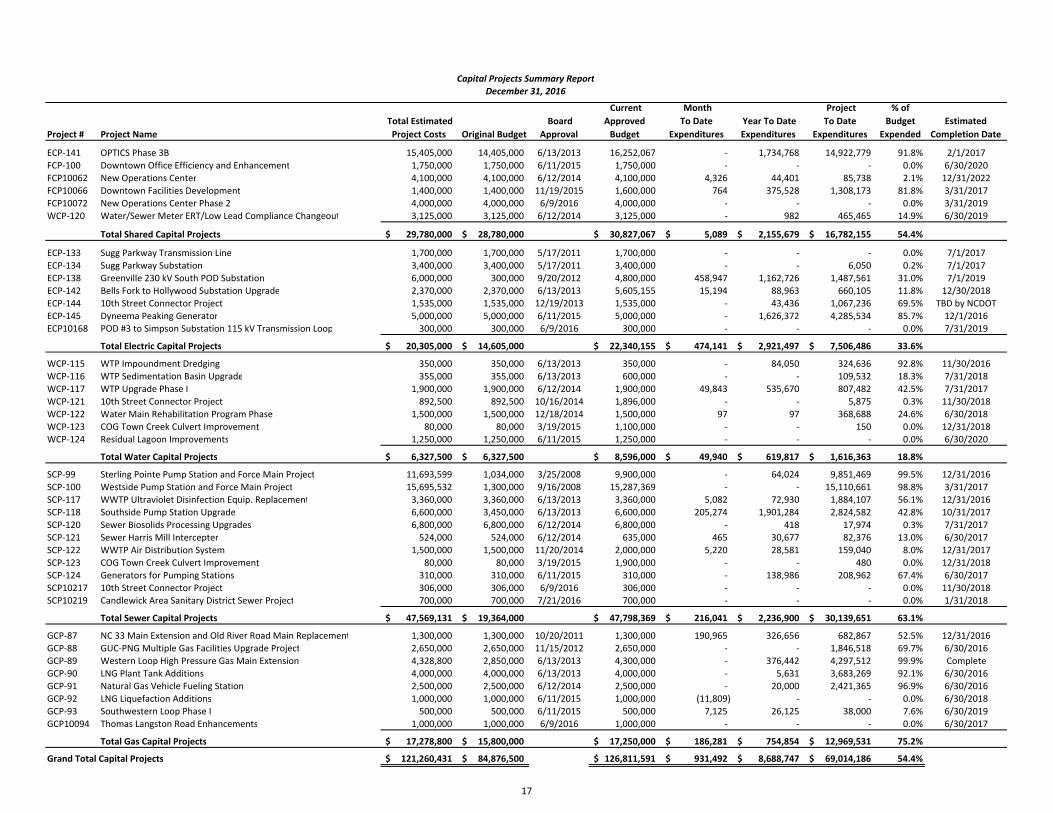
Project # Project Name Total Estimated Project Costs Original Budget
Board Approval
Current Approved Budget
Month To Date
Expenditures Year To Date Expenditures
Project To Date
Expenditures
% of Budget
ExpendedEstimated
Completion Date
ECP‐141 OPTICS Phase 3B 15,405,000 14,405,000 6/13/2013 16,252,067 ‐ 1,734,768 14,922,779 91.8% 2/1/2017FCP‐100 Downtown Office Efficiency and Enhancement 1,750,000 1,750,000 6/11/2015 1,750,000 ‐ ‐ ‐ 0.0% 6/30/2020FCP10062 New Operations Center 4,100,000 4,100,000 6/12/2014 4,100,000 4,326 44,401 85,738 2.1% 12/31/2022FCP10066 Downtown Facilities Development 1,400,000 1,400,000 11/19/2015 1,600,000 764 375,528 1,308,173 81.8% 3/31/2017FCP10072 New Operations Center Phase 2 4,000,000 4,000,000 6/9/2016 4,000,000 ‐ ‐ ‐ 0.0% 3/31/2019WCP‐120 Water/Sewer Meter ERT/Low Lead Compliance Changeout 3,125,000 3,125,000 6/12/2014 3,125,000 ‐ 982 465,465 14.9% 6/30/2019
Total Shared Capital Projects 29,780,000$ 28,780,000$ 30,827,067$ 5,089$ 2,155,679$ 16,782,155$ 54.4%
ECP‐133 Sugg Parkway Transmission Line 1,700,000 1,700,000 5/17/2011 1,700,000 ‐ ‐ ‐ 0.0% 7/1/2017ECP‐134 Sugg Parkway Substation 3,400,000 3,400,000 5/17/2011 3,400,000 ‐ ‐ 6,050 0.2% 7/1/2017ECP‐138 Greenville 230 kV South POD Substation 6,000,000 300,000 9/20/2012 4,800,000 458,947 1,162,726 1,487,561 31.0% 7/1/2019ECP‐142 Bells Fork to Hollywood Substation Upgrade 2,370,000 2,370,000 6/13/2013 5,605,155 15,194 88,963 660,105 11.8% 12/30/2018ECP‐144 10th Street Connector Project 1,535,000 1,535,000 12/19/2013 1,535,000 ‐ 43,436 1,067,236 69.5% TBD by NCDOTECP‐145 Dyneema Peaking Generator 5,000,000 5,000,000 6/11/2015 5,000,000 ‐ 1,626,372 4,285,534 85.7% 12/1/2016ECP10168 POD #3 to Simpson Substation 115 kV Transmission Loop 300,000 300,000 6/9/2016 300,000 ‐ ‐ ‐ 0.0% 7/31/2019
Total Electric Capital Projects 20,305,000$ 14,605,000$ 22,340,155$ 474,141$ 2,921,497$ 7,506,486$ 33.6%
WCP‐115 WTP Impoundment Dredging 350,000 350,000 6/13/2013 350,000 ‐ 84,050 324,636 92.8% 11/30/2016WCP‐116 WTP Sedimentation Basin Upgrade 355,000 355,000 6/13/2013 600,000 ‐ ‐ 109,532 18.3% 7/31/2018WCP‐117 WTP Upgrade Phase I 1,900,000 1,900,000 6/12/2014 1,900,000 49,843 535,670 807,482 42.5% 7/31/2017WCP‐121 10th Street Connector Project 892,500 892,500 10/16/2014 1,896,000 ‐ ‐ 5,875 0.3% 11/30/2018WCP‐122 Water Main Rehabilitation Program Phase I 1,500,000 1,500,000 12/18/2014 1,500,000 97 97 368,688 24.6% 6/30/2018WCP‐123 COG Town Creek Culvert Improvement 80,000 80,000 3/19/2015 1,100,000 ‐ ‐ 150 0.0% 12/31/2018WCP‐124 Residual Lagoon Improvements 1,250,000 1,250,000 6/11/2015 1,250,000 ‐ ‐ ‐ 0.0% 6/30/2020
Total Water Capital Projects 6,327,500$ 6,327,500$ 8,596,000$ 49,940$ 619,817$ 1,616,363$ 18.8%
SCP‐99 Sterling Pointe Pump Station and Force Main Project 11,693,599 1,034,000 3/25/2008 9,900,000 ‐ 64,024 9,851,469 99.5% 12/31/2016SCP‐100 Westside Pump Station and Force Main Project 15,695,532 1,300,000 9/16/2008 15,287,369 ‐ ‐ 15,110,661 98.8% 3/31/2017SCP‐117 WWTP Ultraviolet Disinfection Equip. Replacement 3,360,000 3,360,000 6/13/2013 3,360,000 5,082 72,930 1,884,107 56.1% 12/31/2016SCP‐118 Southside Pump Station Upgrade 6,600,000 3,450,000 6/13/2013 6,600,000 205,274 1,901,284 2,824,582 42.8% 10/31/2017SCP‐120 Sewer Biosolids Processing Upgrades 6,800,000 6,800,000 6/12/2014 6,800,000 ‐ 418 17,974 0.3% 7/31/2017SCP‐121 Sewer Harris Mill Intercepter 524,000 524,000 6/12/2014 635,000 465 30,677 82,376 13.0% 6/30/2017SCP‐122 WWTP Air Distribution System 1,500,000 1,500,000 11/20/2014 2,000,000 5,220 28,581 159,040 8.0% 12/31/2017SCP‐123 COG Town Creek Culvert Improvement 80,000 80,000 3/19/2015 1,900,000 ‐ ‐ 480 0.0% 12/31/2018SCP‐124 Generators for Pumping Stations 310,000 310,000 6/11/2015 310,000 ‐ 138,986 208,962 67.4% 6/30/2017SCP10217 10th Street Connector Project 306,000 306,000 6/9/2016 306,000 ‐ ‐ ‐ 0.0% 11/30/2018SCP10219 Candlewick Area Sanitary District Sewer Project 700,000 700,000 7/21/2016 700,000 ‐ ‐ ‐ 0.0% 1/31/2018
Total Sewer Capital Projects 47,569,131$ 19,364,000$ 47,798,369$ 216,041$ 2,236,900$ 30,139,651$ 63.1%
GCP‐87 NC 33 Main Extension and Old River Road Main Replacement 1,300,000 1,300,000 10/20/2011 1,300,000 190,965 326,656 682,867 52.5% 12/31/2016GCP‐88 GUC‐PNG Multiple Gas Facilities Upgrade Project 2,650,000 2,650,000 11/15/2012 2,650,000 ‐ ‐ 1,846,518 69.7% 6/30/2016GCP‐89 Western Loop High Pressure Gas Main Extension 4,328,800 2,850,000 6/13/2013 4,300,000 ‐ 376,442 4,297,512 99.9% CompleteGCP‐90 LNG Plant Tank Additions 4,000,000 4,000,000 6/13/2013 4,000,000 ‐ 5,631 3,683,269 92.1% 6/30/2016GCP‐91 Natural Gas Vehicle Fueling Station 2,500,000 2,500,000 6/12/2014 2,500,000 ‐ 20,000 2,421,365 96.9% 6/30/2016GCP‐92 LNG Liquefaction Additions 1,000,000 1,000,000 6/11/2015 1,000,000 (11,809) ‐ ‐ 0.0% 6/30/2018GCP‐93 Southwestern Loop Phase I 500,000 500,000 6/11/2015 500,000 7,125 26,125 38,000 7.6% 6/30/2019GCP10094 Thomas Langston Road Enhancements 1,000,000 1,000,000 6/9/2016 1,000,000 ‐ ‐ ‐ 0.0% 6/30/2017
Total Gas Capital Projects 17,278,800$ 15,800,000$ 17,250,000$ 186,281$ 754,854$ 12,969,531$ 75.2%
Grand Total Capital Projects 121,260,431$ 84,876,500$ 126,811,591$ 931,492$ 8,688,747$ 69,014,186$ 54.4%
December 31, 2016Capital Projects Summary Report
17
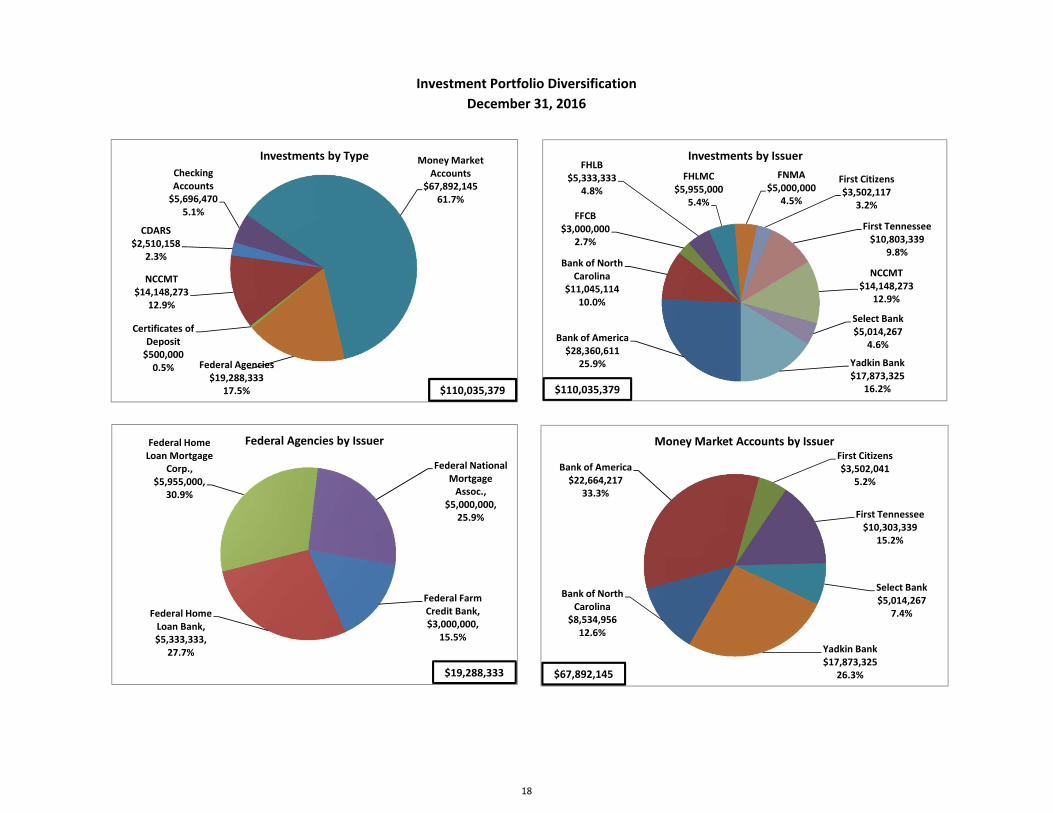
Investment Portfolio DiversificationDecember 31, 2016
Bank of America$28,360,611
25.9%
Bank of North Carolina
$11,045,11410.0%
FFCB$3,000,000
2.7%
FHLB$5,333,333
4.8%FHLMC
$5,955,0005.4%
FNMA$5,000,000
4.5%
First Citizens$3,502,117
3.2%
First Tennessee$10,803,339
9.8%
NCCMT$14,148,273
12.9%
Select Bank$5,014,267
4.6%
Yadkin Bank$17,873,325
16.2%
Investments by Issuer
$110,035,379
Certificates of Deposit$500,0000.5%
NCCMT$14,148,273
12.9%
CDARS$2,510,158
2.3%
Checking Accounts$5,696,470
5.1%
Money Market Accounts
$67,892,14561.7%
Federal Agencies$19,288,333
17.5%
Investments by Type
$110,035,379
Federal Farm Credit Bank, $3,000,000,
15.5%
Federal Home Loan Bank, $5,333,333,
27.7%
Federal Home Loan Mortgage
Corp., $5,955,000,
30.9%
Federal National Mortgage Assoc.,
$5,000,000, 25.9%
Federal Agencies by Issuer
$19,288,333
Bank of North Carolina
$8,534,95612.6%
Bank of America$22,664,217
33.3%
First Citizens$3,502,041
5.2%
First Tennessee$10,303,339
15.2%
Select Bank$5,014,267
7.4%
Yadkin Bank$17,873,325
26.3%
Money Market Accounts by Issuer
$67,892,145
18
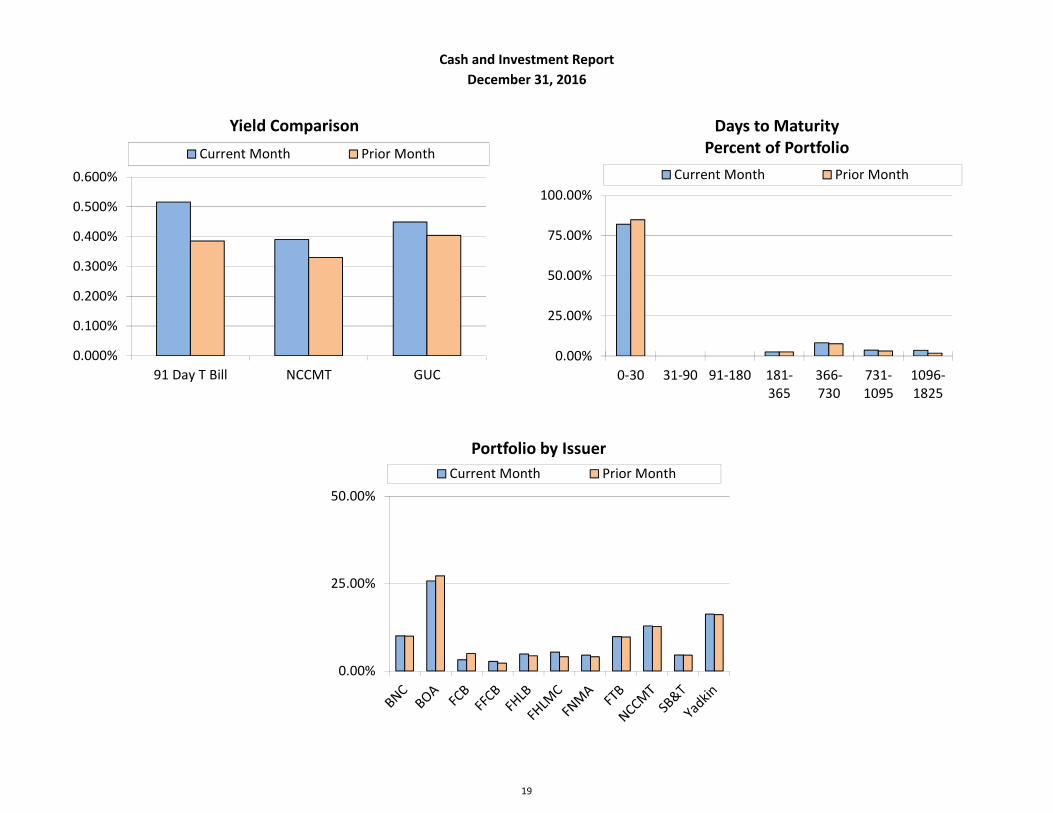
Cash and Investment ReportDecember 31, 2016
0.000%
0.100%
0.200%
0.300%
0.400%
0.500%
0.600%
91 Day T Bill NCCMT GUC
Yield ComparisonCurrent Month Prior Month
0.00%
25.00%
50.00%
75.00%
100.00%
0‐30 31‐90 91‐180 181‐365
366‐730
731‐1095
1096‐1825
Days to MaturityPercent of Portfolio
Current Month Prior Month
0.00%
25.00%
50.00%
Portfolio by IssuerCurrent Month Prior Month
19
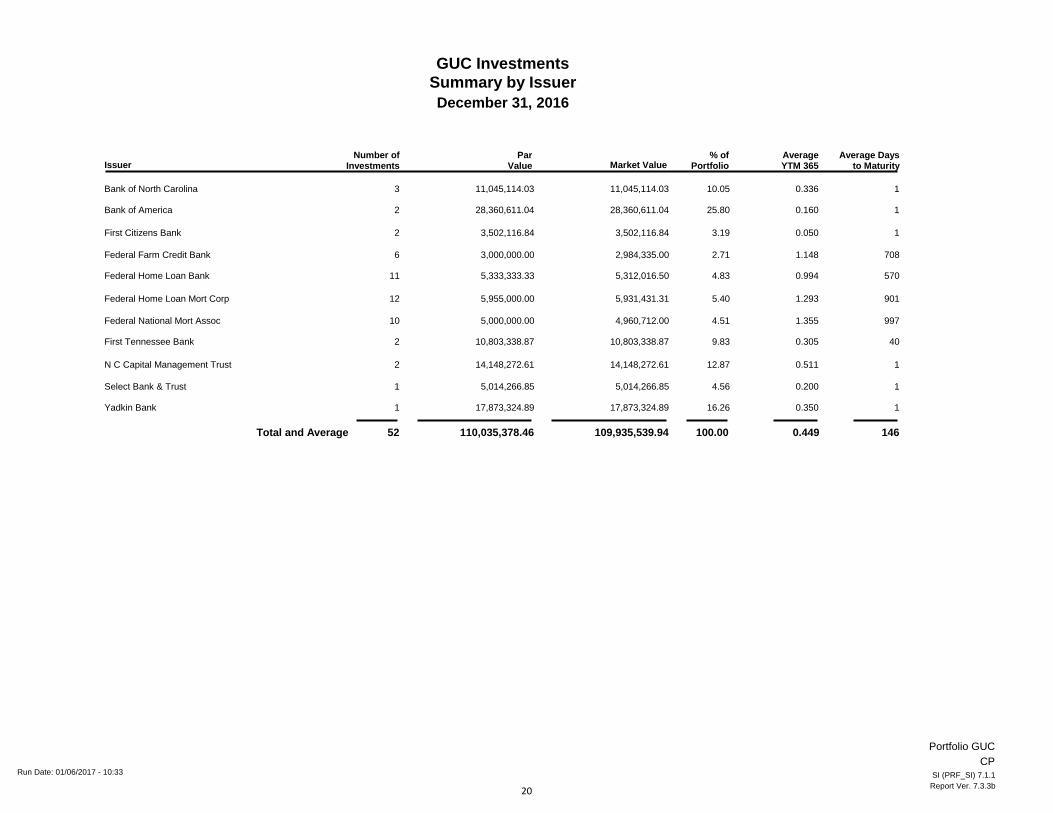
GUC InvestmentsSummary by IssuerDecember 31, 2016
% of Portfolio
Average Daysto Maturity
ParValueIssuer
Number ofInvestments
AverageYTM 365Market Value
Bank of North Carolina 11,045,114.03 10.05 0.3363 111,045,114.03
Bank of America 28,360,611.04 25.80 0.1602 128,360,611.04
First Citizens Bank 3,502,116.84 3.19 0.0502 13,502,116.84
Federal Farm Credit Bank 2,984,335.00 2.71 1.1486 7083,000,000.00
Federal Home Loan Bank 5,312,016.50 4.83 0.99411 5705,333,333.33
Federal Home Loan Mort Corp 5,931,431.31 5.40 1.29312 9015,955,000.00
Federal National Mort Assoc 4,960,712.00 4.51 1.35510 9975,000,000.00
First Tennessee Bank 10,803,338.87 9.83 0.3052 4010,803,338.87
N C Capital Management Trust 14,148,272.61 12.87 0.5112 114,148,272.61
Select Bank & Trust 5,014,266.85 4.56 0.2001 15,014,266.85
Yadkin Bank 17,873,324.89 16.26 0.3501 117,873,324.89
Total and Average 52 109,935,539.94 100.00 0.449 146110,035,378.46
Portfolio GUCCP
Run Date: 01/06/2017 - 10:33 SI (PRF_SI) 7.1.1Report Ver. 7.3.3b20
YTM365
Page 1
Par Value Book ValueMaturity
DateStated
RateMarket Value
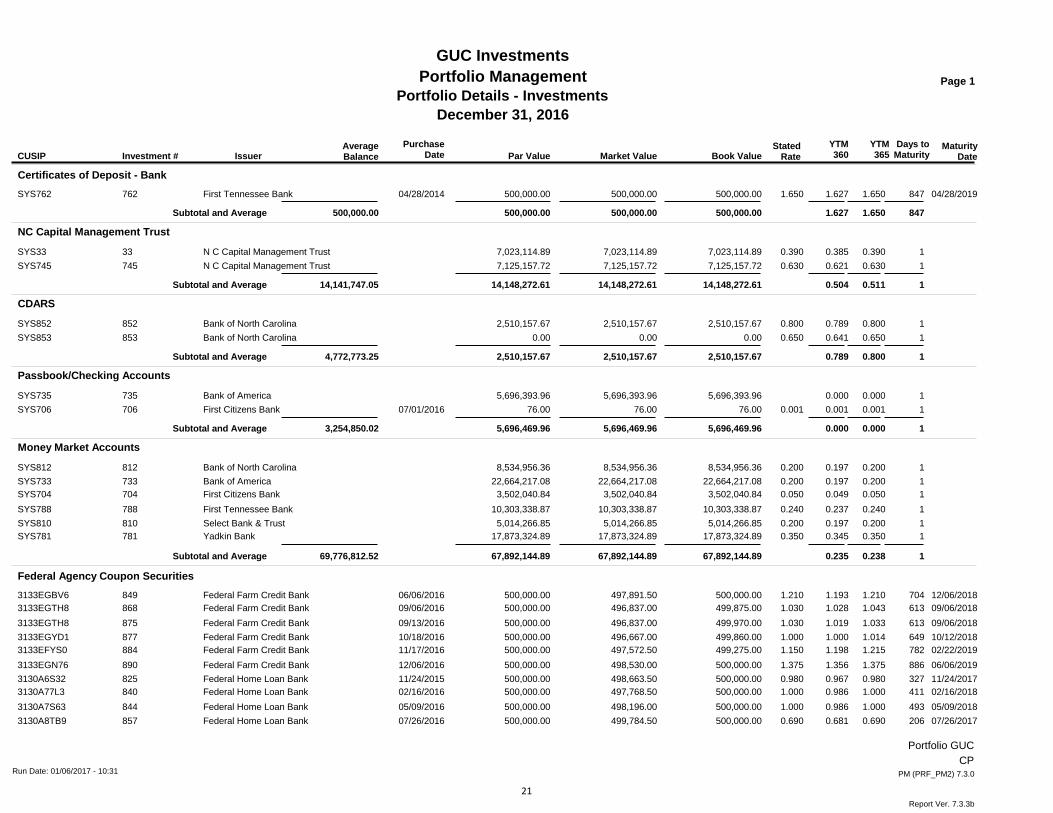
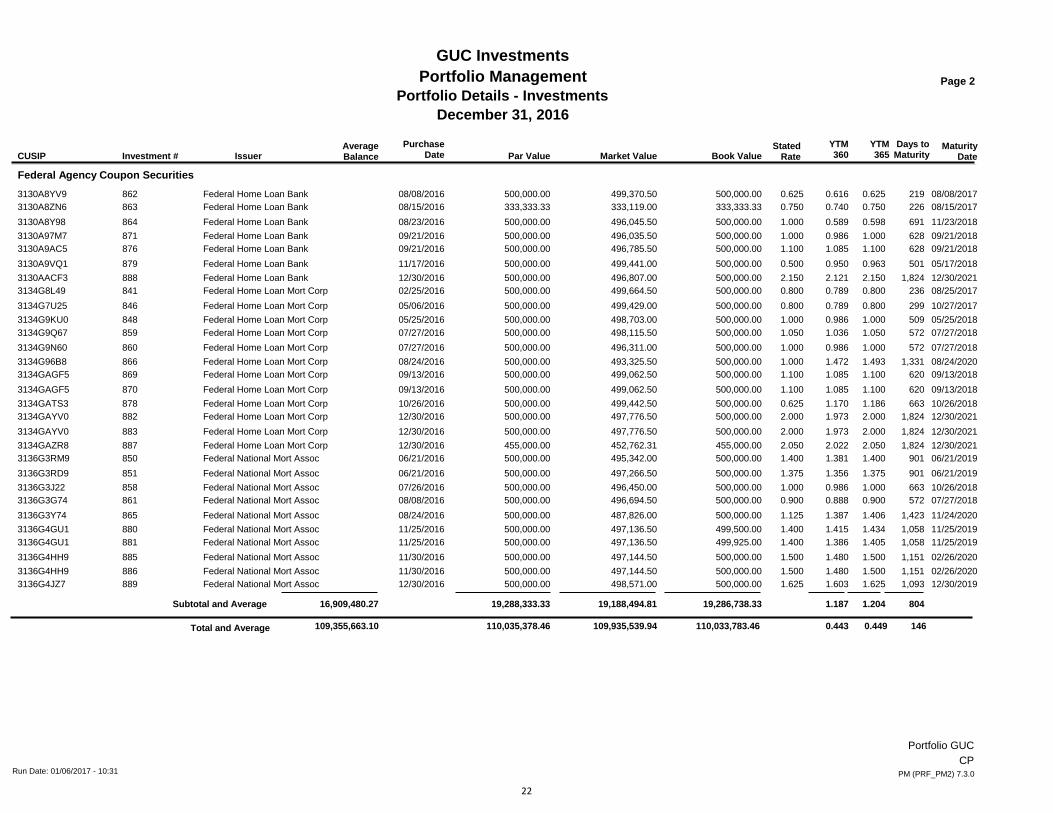
December 31, 2016Portfolio Details - Investments
AverageBalanceIssuer
Portfolio ManagementGUC Investments
Days toMaturity
YTM360 CUSIP Investment #
PurchaseDate
Certificates of Deposit - Bank1.650First Tennessee Bank762 500,000.00 500,000.00 04/28/20191.65004/28/2014 500,000.00 1.627SYS762 847
500,000.00 1.627500,000.00500,000.00500,000.00Subtotal and Average 1.650 847
NC Capital Management Trust
0.390N C Capital Management Trust33 7,023,114.89 7,023,114.89 0.3907,023,114.89 0.385SYS33 10.630N C Capital Management Trust745 7,125,157.72 7,125,157.72 0.6307,125,157.72 0.621SYS745 1
14,148,272.61 0.50414,148,272.6114,148,272.6114,141,747.05Subtotal and Average 0.511 1
CDARS
0.800Bank of North Carolina852 2,510,157.67 2,510,157.67 0.8002,510,157.67 0.789SYS852 10.650Bank of North Carolina853 0.00 0.00 0.6500.00 0.641SYS853 1
2,510,157.67 0.7892,510,157.672,510,157.674,772,773.25Subtotal and Average 0.800 1
Passbook/Checking Accounts
0.000Bank of America735 5,696,393.96 5,696,393.965,696,393.96 0.000SYS735 10.001First Citizens Bank706 76.00 76.00 0.00107/01/2016 76.00 0.001SYS706 1
5,696,469.96 0.0005,696,469.965,696,469.963,254,850.02Subtotal and Average 0.000 1
Money Market Accounts
0.200Bank of North Carolina812 8,534,956.36 8,534,956.36 0.2008,534,956.36 0.197SYS812 10.200Bank of America733 22,664,217.08 22,664,217.08 0.20022,664,217.08 0.197SYS733 10.050First Citizens Bank704 3,502,040.84 3,502,040.84 0.0503,502,040.84 0.049SYS704 10.240First Tennessee Bank788 10,303,338.87 10,303,338.87 0.24010,303,338.87 0.237SYS788 10.200Select Bank & Trust810 5,014,266.85 5,014,266.85 0.2005,014,266.85 0.197SYS810 10.350Yadkin Bank781 17,873,324.89 17,873,324.89 0.35017,873,324.89 0.345SYS781 1
67,892,144.89 0.23567,892,144.8967,892,144.8969,776,812.52Subtotal and Average 0.238 1
Federal Agency Coupon Securities1.210Federal Farm Credit Bank849 500,000.00 500,000.00 12/06/20181.21006/06/2016 497,891.50 1.1933133EGBV6 7041.043Federal Farm Credit Bank868 500,000.00 499,875.00 09/06/20181.03009/06/2016 496,837.00 1.0283133EGTH8 6131.033Federal Farm Credit Bank875 500,000.00 499,970.00 09/06/20181.03009/13/2016 496,837.00 1.0193133EGTH8 6131.014Federal Farm Credit Bank877 500,000.00 499,860.00 10/12/20181.00010/18/2016 496,667.00 1.0003133EGYD1 6491.215Federal Farm Credit Bank884 500,000.00 499,275.00 02/22/20191.15011/17/2016 497,572.50 1.1983133EFYS0 7821.375Federal Farm Credit Bank890 500,000.00 500,000.00 06/06/20191.37512/06/2016 498,530.00 1.3563133EGN76 8860.980Federal Home Loan Bank825 500,000.00 500,000.00 11/24/20170.98011/24/2015 498,663.50 0.9673130A6S32 3271.000Federal Home Loan Bank840 500,000.00 500,000.00 02/16/20181.00002/16/2016 497,768.50 0.9863130A77L3 4111.000Federal Home Loan Bank844 500,000.00 500,000.00 05/09/20181.00005/09/2016 498,196.00 0.9863130A7S63 4930.690Federal Home Loan Bank857 500,000.00 500,000.00 07/26/20170.69007/26/2016 499,784.50 0.6813130A8TB9 206
Portfolio GUCCP
Run Date: 01/06/2017 - 10:31 PM (PRF_PM2) 7.3.0
Report Ver. 7.3.3b21
YTM365
Page 2
Par Value Book ValueMaturity
DateStated
RateMarket Value
December 31, 2016Portfolio Details - Investments
AverageBalanceIssuer
Portfolio ManagementGUC Investments
Days toMaturity
YTM360 CUSIP Investment #
PurchaseDate
Federal Agency Coupon Securities0.625Federal Home Loan Bank862 500,000.00 500,000.00 08/08/20170.62508/08/2016 499,370.50 0.6163130A8YV9 2190.750Federal Home Loan Bank863 333,333.33 333,333.33 08/15/20170.75008/15/2016 333,119.00 0.7403130A8ZN6 2260.598Federal Home Loan Bank864 500,000.00 500,000.00 11/23/20181.00008/23/2016 496,045.50 0.5893130A8Y98 6911.000Federal Home Loan Bank871 500,000.00 500,000.00 09/21/20181.00009/21/2016 496,035.50 0.9863130A97M7 6281.100Federal Home Loan Bank876 500,000.00 500,000.00 09/21/20181.10009/21/2016 496,785.50 1.0853130A9AC5 6280.963Federal Home Loan Bank879 500,000.00 500,000.00 05/17/20180.50011/17/2016 499,441.00 0.9503130A9VQ1 5012.150Federal Home Loan Bank888 500,000.00 500,000.00 12/30/20212.15012/30/2016 496,807.00 2.1213130AACF3 1,8240.800Federal Home Loan Mort Corp841 500,000.00 500,000.00 08/25/20170.80002/25/2016 499,664.50 0.7893134G8L49 2360.800Federal Home Loan Mort Corp846 500,000.00 500,000.00 10/27/20170.80005/06/2016 499,429.00 0.7893134G7U25 2991.000Federal Home Loan Mort Corp848 500,000.00 500,000.00 05/25/20181.00005/25/2016 498,703.00 0.9863134G9KU0 5091.050Federal Home Loan Mort Corp859 500,000.00 500,000.00 07/27/20181.05007/27/2016 498,115.50 1.0363134G9Q67 5721.000Federal Home Loan Mort Corp860 500,000.00 500,000.00 07/27/20181.00007/27/2016 496,311.00 0.9863134G9N60 5721.493Federal Home Loan Mort Corp866 500,000.00 500,000.00 08/24/20201.00008/24/2016 493,325.50 1.4723134G96B8 1,3311.100Federal Home Loan Mort Corp869 500,000.00 500,000.00 09/13/20181.10009/13/2016 499,062.50 1.0853134GAGF5 6201.100Federal Home Loan Mort Corp870 500,000.00 500,000.00 09/13/20181.10009/13/2016 499,062.50 1.0853134GAGF5 6201.186Federal Home Loan Mort Corp878 500,000.00 500,000.00 10/26/20180.62510/26/2016 499,442.50 1.1703134GATS3 6632.000Federal Home Loan Mort Corp882 500,000.00 500,000.00 12/30/20212.00012/30/2016 497,776.50 1.9733134GAYV0 1,8242.000Federal Home Loan Mort Corp883 500,000.00 500,000.00 12/30/20212.00012/30/2016 497,776.50 1.9733134GAYV0 1,8242.050Federal Home Loan Mort Corp887 455,000.00 455,000.00 12/30/20212.05012/30/2016 452,762.31 2.0223134GAZR8 1,8241.400Federal National Mort Assoc850 500,000.00 500,000.00 06/21/20191.40006/21/2016 495,342.00 1.3813136G3RM9 9011.375Federal National Mort Assoc851 500,000.00 500,000.00 06/21/20191.37506/21/2016 497,266.50 1.3563136G3RD9 9011.000Federal National Mort Assoc858 500,000.00 500,000.00 10/26/20181.00007/26/2016 496,450.00 0.9863136G3J22 6630.900Federal National Mort Assoc861 500,000.00 500,000.00 07/27/20180.90008/08/2016 496,694.50 0.8883136G3G74 5721.406Federal National Mort Assoc865 500,000.00 500,000.00 11/24/20201.12508/24/2016 487,826.00 1.3873136G3Y74 1,4231.434Federal National Mort Assoc880 500,000.00 499,500.00 11/25/20191.40011/25/2016 497,136.50 1.4153136G4GU1 1,0581.405Federal National Mort Assoc881 500,000.00 499,925.00 11/25/20191.40011/25/2016 497,136.50 1.3863136G4GU1 1,0581.500Federal National Mort Assoc885 500,000.00 500,000.00 02/26/20201.50011/30/2016 497,144.50 1.4803136G4HH9 1,1511.500Federal National Mort Assoc886 500,000.00 500,000.00 02/26/20201.50011/30/2016 497,144.50 1.4803136G4HH9 1,1511.625Federal National Mort Assoc889 500,000.00 500,000.00 12/30/20191.62512/30/2016 498,571.00 1.6033136G4JZ7 1,093
19,286,738.33 1.18719,188,494.8119,288,333.3316,909,480.27Subtotal and Average 1.204 804
0.443109,355,663.10 110,035,378.46 0.449 146109,935,539.94 110,033,783.46Total and Average
Portfolio GUCCP
Run Date: 01/06/2017 - 10:31 PM (PRF_PM2) 7.3.0
22