Embed Size (px)
Citation preview
1
GREENWICH COMMUNITY COLLEGE CORPORATION STANDARDS COMMITTEE Minutes of a meeting held on Monday, 21st November 2011 at 6.00 pm in Meeting Room 2, Plumstead Centre, 95 Plumstead Road, London, SE18 7DQ. PRESENT
Sheila Elliott (Chair) Cllr Denise Hyland John Brigden
IN ATTENDANCE
Bernadette McAnespie - Vice-Principal of Curriculum Anne Greenall - Director of Quality and Standards Maggi Knights - Vice-Principal, Learner Services & HR David Johnson - Clerk
1. Apologies for absence Apologies were received from Ash Odedra. The Clerk reported that Ricky McMenemy had resigned from the Corporation. The Chair welcomed John Brigden to his first meeting.
2. Declarations of interest
None
3. Minutes of meeting held on 6th June 2011 RESOLVED –
That the minutes of the meeting held on 6th June 2011 be signed as a true record.
4. Matters Arising
Item 4 – Rewards for teaching staff
2
At the last meeting it was resolved that the following methods be implemented in 2011/12;
the Chair asked for an update on any progress. Rewards to departments rather than individuals to avoid divisive situations e.g. new
equipment, bursaries for students etc. Recognition lunches with the Principal. Department of the year award.
Maggi Knights indicated that the College is instituting a joint prize day for staff and students. The Chair asked whether any work was being done to integrate rewards into the HR strategy; after the results from last year are fully processed successful departments can be acknowledged.
Item 4 Key Performance Indicators - Organisational Climate As part of the Securing Our Future consultation process, a staff stress survey has been carried
out. Maggi Knights reported that the results were still not fully processed but there had been 55 respondents. The full report will go to the Standards Committee in March and it can then be compared with the 2010 staff stress survey.
Item 6 Admissions Policy The Committee wanted to know the College’s approach to placing students on courses; this
had been wrongly minuted as request for a report on conversion rates. The Director of Quality will prepare a paper for the next meeting
5. Key College Performance Indicators – C111121 – Director of Quality Anne Greenall spoke to this report which recorded progress made so far against the KPIs. A framework of Key Performance Indicators (KPIs) is used to monitor performance against the College goals and Objectives. The Standards Committee monitors those relating to three of the college goals: Excellence, Relevance and Organisational Climate. This report updates committee members on the college’s progress against Key Performance Indicators (KPI) approved by the Corporation. Areas addressed in this report are highlighted in the KPI framework (pages 4-6 in grey). A short commentary provides information on progress towards the target set.
Background information
In 2008 the Corporation approved the college’s Development Plan ‘Embracing our Future 2008 – 2011’ which sets out the college’s key objectives under the four main aims of Excellence, Relevance, Organisational Climate and Finance of how the college planned to become an outstanding college. These 4 headings were then used to set targets and act as key performance indicators to measure both progress towards the long-term targets and benchmark against national rates. The Finance aims are not covered in this report as they are presented in the monthly management accounts to the finance and general purposes committee.
Since the last report to the committee there have been many changes to the senior management team. In April 2011, the principal Geoff Pine retired and Gary Chin was appointed as the new principal with effect from the 1st May 2011. This was followed by the appointment of a new vice principals for curriculum and business development, replacing Ian Mitton, and Finance and Resources. The Vice Principal Planning and Standards, Maggi
3
Knights takes on a new brief as Vice Principal Learner Services and Human Resources. The new senior leadership team have produced a new Strategic and Quality Improvement Plans (QIP) which, once approved, will replace the existing KPIs.
Commentary
Excellence
KPI 1: Success Rates The college has significantly fallen short of its ambitious and aspirational target of 80% set in March 2011. The self-assessment report explains the reasons for under achievement in detail and sets out the actions already taken under the new leadership team to ensure that GCC meets the targets approved by governors. The college has achieved a headline success rate of 70%, which is being suppressed by 5% following the previous management team’s decision, in 2010, to address the shortfall in-year funding by introducing part-year additional programmes for learners mainly on level 1. This strategy to increase funding was not received well by learners with many not participating sufficiently in the programmes to be successful resulting in a one-off exceptional negative impact on success rates. If this one-off initiative is excluded the college true success rate is 75%. The new senior management team is not complacent about these disappointing results and is confident that results will be much improved for this year. The change of leadership has been welcomed across the college and there is a sense of urgency and appetite for change to quality improvement and success rates. The new Strategic Plan will underpin change providing clear direction and a framework to build a high quality offer to the local community. The challenge for the college is to maintain and improve quality throughout a period of change. KPI 2: Teaching and Learning Grade Profile
The observation team has made good use of LSIS funding to deliver training to all the observation team. Processes have been refined to: Improve the quality and consistency of feedback to teaching staff Monitor completion of the action plans Improve the analysis of the findings to inform training for teachers and further training
for the observation team. Resulting in more realistic observation grades for the college. KPI 3: SAR Grades by SSA At the time of writing, Curriculum SARs have not yet been validated. A verbal updated will be given at the meeting on 21st November. KPI 4: External recognition by support departments The Initial Advice and Guidance team have been successful in maintaining their Matrix kitemark status for independent advice and guidance. Similarly the Learning and Resources Centre have maintained the CoLRic kitemark for high levels of library customer satisfaction.
4
For 2010-11, each business support team has produced an annual performance statement and a critical success factor tool to monitor their performance and impact on the quality of the learner experience. A validation process ensures that teams make realistic judgments and the tool allows them to measure progress within year as well as year on year. This approach will ensure that support teams are better able to monitor performance and are less reliant therefore on external accreditation. Relevance
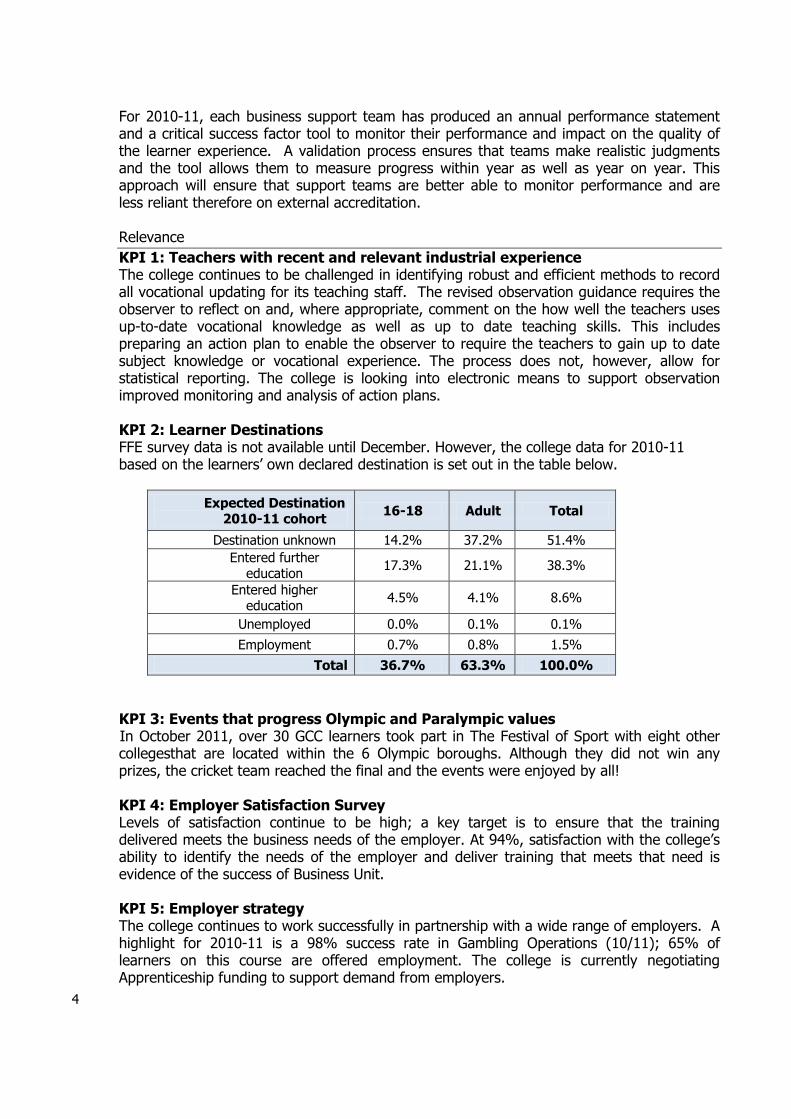
KPI 1: Teachers with recent and relevant industrial experience The college continues to be challenged in identifying robust and efficient methods to record all vocational updating for its teaching staff. The revised observation guidance requires the observer to reflect on and, where appropriate, comment on the how well the teachers uses up-to-date vocational knowledge as well as up to date teaching skills. This includes preparing an action plan to enable the observer to require the teachers to gain up to date subject knowledge or vocational experience. The process does not, however, allow for statistical reporting. The college is looking into electronic means to support observation improved monitoring and analysis of action plans. KPI 2: Learner Destinations FFE survey data is not available until December. However, the college data for 2010-11 based on the learners’ own declared destination is set out in the table below.
Expected Destination 2010-11 cohort
16-18 Adult Total
Destination unknown 14.2% 37.2% 51.4%
Entered further education
17.3% 21.1% 38.3%
Entered higher education
4.5% 4.1% 8.6%
Unemployed 0.0% 0.1% 0.1%
Employment 0.7% 0.8% 1.5%
Total 36.7% 63.3% 100.0%
KPI 3: Events that progress Olympic and Paralympic values
In October 2011, over 30 GCC learners took part in The Festival of Sport with eight other collegesthat are located within the 6 Olympic boroughs. Although they did not win any prizes, the cricket team reached the final and the events were enjoyed by all! KPI 4: Employer Satisfaction Survey Levels of satisfaction continue to be high; a key target is to ensure that the training delivered meets the business needs of the employer. At 94%, satisfaction with the college’s ability to identify the needs of the employer and deliver training that meets that need is evidence of the success of Business Unit. KPI 5: Employer strategy The college continues to work successfully in partnership with a wide range of employers. A highlight for 2010-11 is a 98% success rate in Gambling Operations (10/11); 65% of learners on this course are offered employment. The college is currently negotiating Apprenticeship funding to support demand from employers.
5
KPI6: International Strategy The college continues to attract a number of international students to its programmes. A partnership with Bath University sees 14 learners attending GCC to gain qualifications that will enable them to access Higher Education. The College’s Higher Education Strategy, refreshed in October 2011, ensures that GCC continues to be an attractive choice for learners from overseas to gain qualifications in the UK for industry and access to Higher Education. Organisational climate
KPI 1 and 3: Learner satisfaction rate As stated above the Framework for Excellence Survey is not yet available. This will be reported at the next meeting. KPI 2: Staff survey No further update at this stage KPI 4: Communications with staff Each department holds ‘away-days’ in the June or July to review the year and carry out self assessment activities. This year, the principal attended each one, introducing the agenda for change, presenting long service awards and hearing directly from staff, their concerns and areas of good practice. A new approach for 2011, was to hold a whole college start up meeting immediately before the start of term; at this meeting the principal and the Director Quality set out key objectives and activities for 2011-12.Running concurrently was a half day teaching and learning event focused on ‘What Does Outstanding Teaching and Learning look like? KPI 5: Principal’s briefings Staff briefings have been reviewed by the Senior Management Team; these have been replaced by a process to cascade key SMT decisions through line management arrangements. In addition, SMT are regularly attending team meetings to ensure staff have access to SMT members and can receive responses to their concerns.
The following points were made in the discussion of the report:Can results be correlated by full time and part time staff; can the performance of part time staff be analysed for inclusion in the SAR (2011-12).
The staff development budget is being devoted to activities that will lead to better standards of teaching and learning.
The percentage of classes graded as good is 60%; the attainment for the good teachers should also be good; can this be correlated. The committee were informed that many staff share courses and so the correlation is not straightforward.
The Standards Committee is not sufficiently informed to prevent the slide in success rates. It was agreed that the committee would meet in January to determine what reports it needs to inform governance
The requirement for lecturers of vocational subject to refresh their industrial experience can be part of the normal appraisal system.
The College should focus more efforts on capturing destinations data; as the progression of students is our raison d’être.
6
Greater effort should be made to extend the practices of the departments graded as good (i.e.
HSC, SLT and EAL) to the wider College.
There should be a clear relationship between the KPIs and the objectives within the Self Assessment Report; it was agreed that the documents should be aligned and that the Performance Indicators in the SAR should be within the Ofsted framework Resolved That the report be received but that the KPIs related to the new development plan should be clearly linked to the Self Assessment Report (aligned with the Ofsted Common Inspection Framework) in future.
6. External verification report – C111122
Anne Greenall spoke to her report. Purpose of the report This report summarises the findings of the external verification, sampling, moderation and other checks carried out by the various awarding bodies that accredit the college’s qualification provision. Recommendation That the Committee receives the report
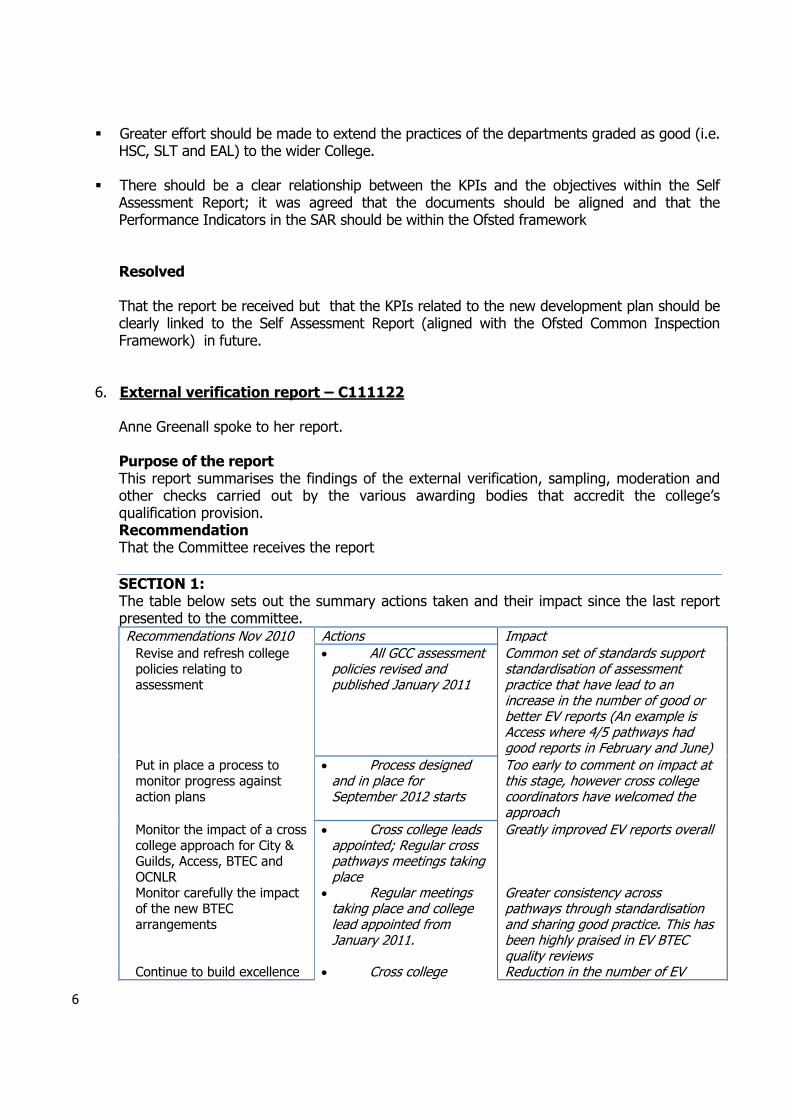
SECTION 1: The table below sets out the summary actions taken and their impact since the last report presented to the committee. Recommendations Nov 2010 Actions Impact
Revise and refresh college policies relating to assessment
All GCC assessment policies revised and published January 2011
Common set of standards support standardisation of assessment practice that have lead to an increase in the number of good or better EV reports (An example is Access where 4/5 pathways had good reports in February and June)
Put in place a process to monitor progress against action plans
Process designed and in place for September 2012 starts
Too early to comment on impact at this stage, however cross college coordinators have welcomed the approach
Monitor the impact of a cross college approach for City & Guilds, Access, BTEC and OCNLR
Cross college leads appointed; Regular cross pathways meetings taking place
Greatly improved EV reports overall
Monitor carefully the impact of the new BTEC arrangements
Regular meetings taking place and college lead appointed from January 2011.
Greater consistency across pathways through standardisation and sharing good practice. This has been highly praised in EV BTEC quality reviews
Continue to build excellence Cross college Reduction in the number of EV
7
in the use of formative feedback within and across curriculum areas.
training event in ‘assessment for learning’ Oct 2010; awarding body training events, internal and external.
reports with negative feedback on the quality of feedback
Communicate more effectively with employer responsive and franchise provision to better monitor standards of assessment in offsite provision
Improved process put in place by Director of Quality to monitor better quality of learner experience in partner provision
Much improved communication with partners resulted in an increased number of reports monitored with zero significant issues evidenced.
Extend this report to include HE external examiner reports and any feedback relating to controlled assessment
HE manager now reports directly to the VP Curriculum and meet regularly and issued Controlled assessment Policy
Controlled assessment policy in place; pilot successful. Zero feedback issued to GCC on controlled assessments 2010-11
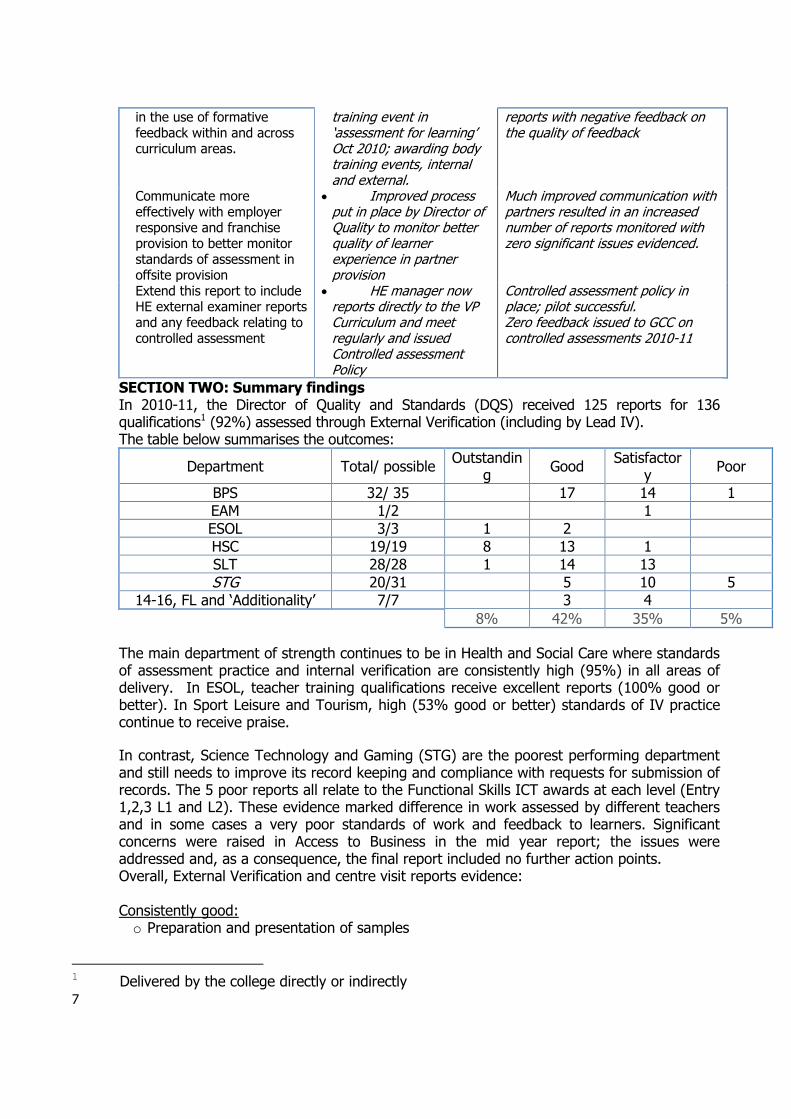
SECTION TWO: Summary findings In 2010-11, the Director of Quality and Standards (DQS) received 125 reports for 136 qualifications1 (92%) assessed through External Verification (including by Lead IV). The table below summarises the outcomes:
Department Total/ possible Outstandin
g Good
Satisfactory
Poor
BPS 32/ 35 17 14 1
EAM 1/2 1
ESOL 3/3 1 2
HSC 19/19 8 13 1
SLT 28/28 1 14 13
STG 20/31 5 10 5
14-16, FL and ‘Additionality’ 7/7 3 4
8% 42% 35% 5%
The main department of strength continues to be in Health and Social Care where standards of assessment practice and internal verification are consistently high (95%) in all areas of delivery. In ESOL, teacher training qualifications receive excellent reports (100% good or better). In Sport Leisure and Tourism, high (53% good or better) standards of IV practice continue to receive praise.
In contrast, Science Technology and Gaming (STG) are the poorest performing department and still needs to improve its record keeping and compliance with requests for submission of records. The 5 poor reports all relate to the Functional Skills ICT awards at each level (Entry 1,2,3 L1 and L2). These evidence marked difference in work assessed by different teachers and in some cases a very poor standards of work and feedback to learners. Significant concerns were raised in Access to Business in the mid year report; the issues were addressed and, as a consequence, the final report included no further action points. Overall, External Verification and centre visit reports evidence:
Consistently good: o Preparation and presentation of samples
1 Delivered by the college directly or indirectly

8
o Internal verification processes that meet the requirements of the awarding bodies and which result in an increasing number of direct claims or remote sampling.
Improved from 2009-10: o Timeliness of returns and communications o Assignment design to make links with employment e.g. real world scenarios. o Practice in each Access programme, exceeding the moderators’ expectations o Feedback to learners that inform progress o Response to feedback from External verifiers to raise standards for the learner o The sharing of good practice across teams o Central recording and RAG rating of report forms to target resources where most
needed and provide evidence of progress year on year
Areas for improvement for 2011-12 include: o Further improve the quality of feedback to learners to support learner progress and
attainment of high grades; o Further develop consistently high standards of Internal Verification practice across every
department o Further improve the confidence of awarding bodies so that increasing numbers of
courses achieve Direct Claim status. o Insufficient liaison with and monitoring of partners and work-placed delivery.
Resolved That the report on external verification be received.
7.0 Self Assessment Report for 2010/11 – C111124
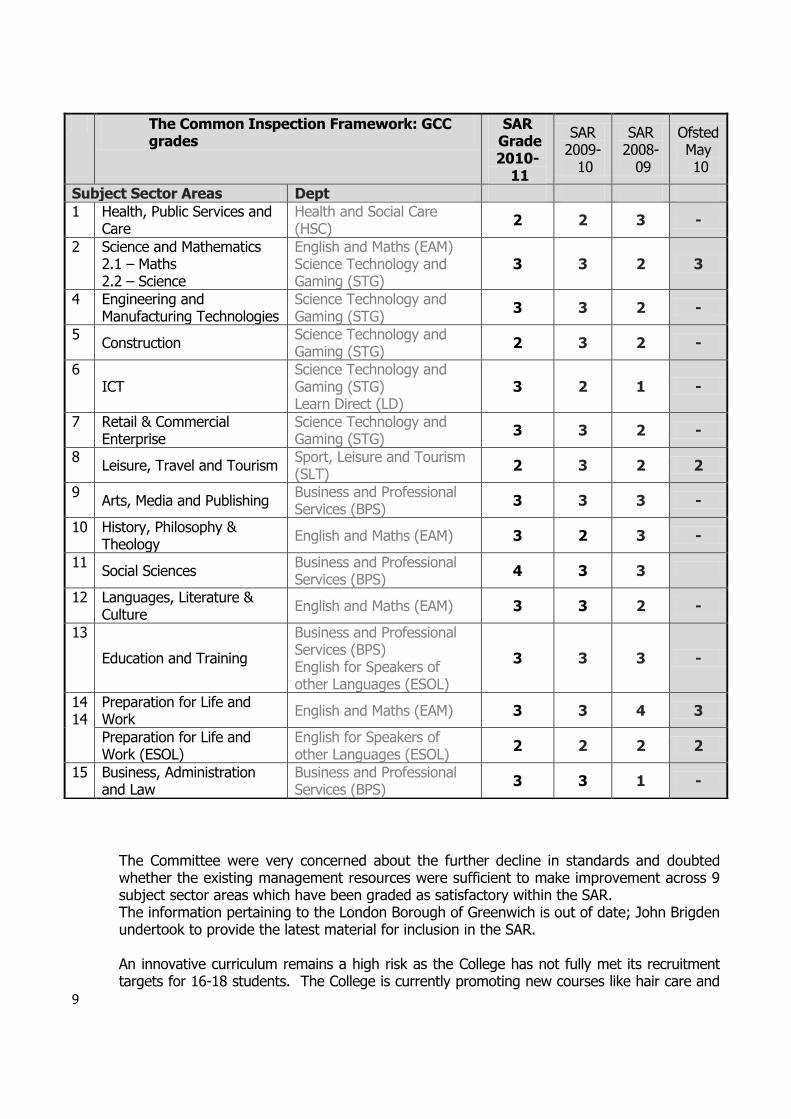
Bernadette McAnespie spoke to this report. As mentioned above the impact of the Employability Award courses has been to decrease success rates by 5 percent. The table below is a summary of Self Assessment Grades by Curriculum Areas
9
The Committee were very concerned about the further decline in standards and doubted whether the existing management resources were sufficient to make improvement across 9 subject sector areas which have been graded as satisfactory within the SAR. The information pertaining to the London Borough of Greenwich is out of date; John Brigden undertook to provide the latest material for inclusion in the SAR. An innovative curriculum remains a high risk as the College has not fully met its recruitment targets for 16-18 students. The College is currently promoting new courses like hair care and
The Common Inspection Framework: GCC grades
SAR Grade 2010-
11
SAR 2009-
10
SAR 2008-
09
Ofsted May 10
Subject Sector Areas Dept 1 Health, Public Services and
Care Health and Social Care (HSC)
2 2 3 -
2 Science and Mathematics 2.1 – Maths 2.2 – Science
English and Maths (EAM) Science Technology and Gaming (STG)
3
3 2 3
4 Engineering and Manufacturing Technologies
Science Technology and Gaming (STG)
3 3 2 -
5 Construction
Science Technology and Gaming (STG)
2 3 2 -
6 ICT
Science Technology and Gaming (STG) Learn Direct (LD)
3 2 1 -
7 Retail & Commercial Enterprise
Science Technology and Gaming (STG)
3 3 2 -
8 Leisure, Travel and Tourism
Sport, Leisure and Tourism (SLT)
2 3 2 2
9 Arts, Media and Publishing
Business and Professional Services (BPS)
3 3 3 -
10 History, Philosophy & Theology
English and Maths (EAM) 3 2 3 -
11 Social Sciences
Business and Professional Services (BPS)
4 3 3
12 Languages, Literature & Culture
English and Maths (EAM) 3 3 2 -
13
Education and Training
Business and Professional Services (BPS) English for Speakers of other Languages (ESOL)
3 3 3 -
14 14
Preparation for Life and Work
English and Maths (EAM) 3 3 4 3
Preparation for Life and Work (ESOL)
English for Speakers of other Languages (ESOL)
2 2 2 2
15 Business, Administration and Law
Business and Professional Services (BPS)
3 3 1 -
10
beauty to appeal to this age group. It was noted that some courses within the Sport and Leisure department lead to interviews with employers. The College needs to offer more courses at lower levels to match the needs of its students.
After discussion of this report the following was resolved
o That the Senior Management Team prepares an additional resources development plan for approval by the Corporation in December.
o Management time needs to be focussed on improving the largest SSAs as this would have the biggest impact on overall success rates.
o That the Self Assessment Report be received subject to the amendments that have been identified.
o That the Standards Committee should increase the frequency of its meetings from three to four times a year; the additional meeting will be in the spring term and it will be used to review the progress of current targets.
o Specialist training was requested for members of Standards Committee so that they could perform more effectively.
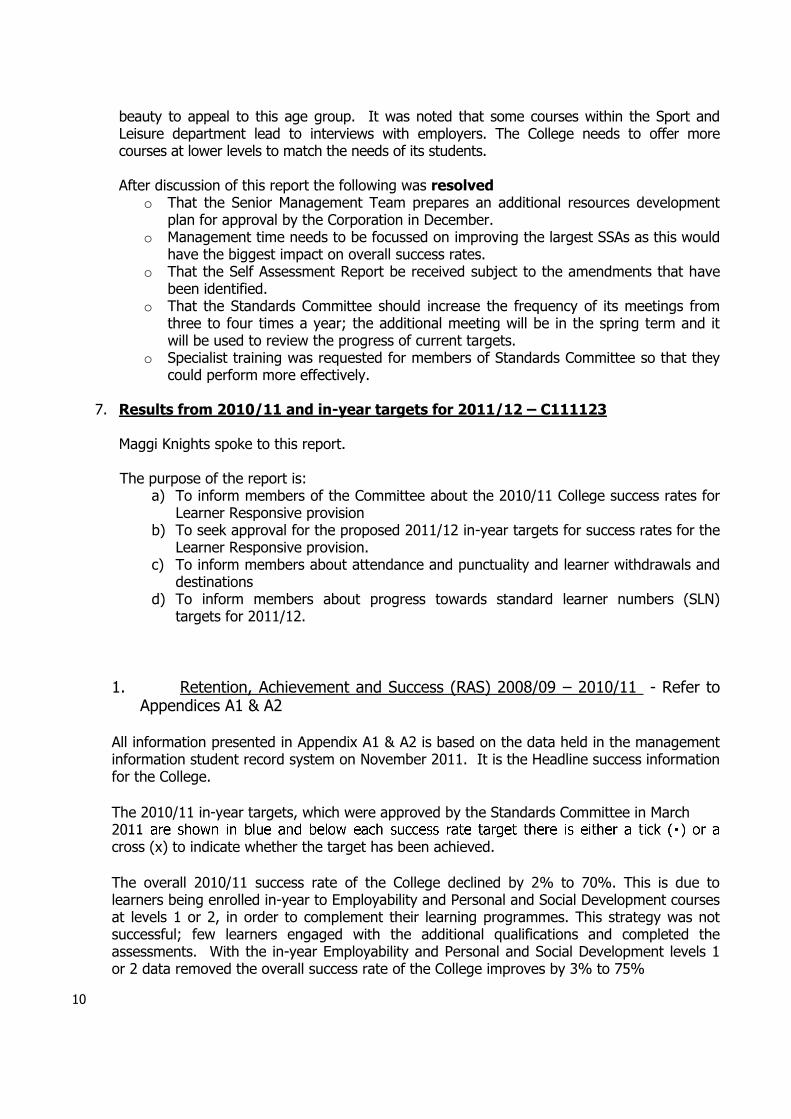
7. Results from 2010/11 and in-year targets for 2011/12 – C111123
Maggi Knights spoke to this report.
The purpose of the report is:
a) To inform members of the Committee about the 2010/11 College success rates for Learner Responsive provision
b) To seek approval for the proposed 2011/12 in-year targets for success rates for the Learner Responsive provision.
c) To inform members about attendance and punctuality and learner withdrawals and destinations
d) To inform members about progress towards standard learner numbers (SLN) targets for 2011/12.
1. Retention, Achievement and Success (RAS) 2008/09 – 2010/11 - Refer to
Appendices A1 & A2 All information presented in Appendix A1 & A2 is based on the data held in the management information student record system on November 2011. It is the Headline success information for the College.
The 2010/11 in-year targets, which were approved by the Standards Committee in March 20cross (x) to indicate whether the target has been achieved.
The overall 2010/11 success rate of the College declined by 2% to 70%. This is due to learners being enrolled in-year to Employability and Personal and Social Development courses at levels 1 or 2, in order to complement their learning programmes. This strategy was not successful; few learners engaged with the additional qualifications and completed the assessments. With the in-year Employability and Personal and Social Development levels 1 or 2 data removed the overall success rate of the College improves by 3% to 75%
11
In Appendix C the success information is presented by subject sector area (SSA). Commentary on the performance in 2010/11, reasons for it and actions taken to ensure improvement are within the 2010/11 SAR.
2. 2011/12 In-Year Targets - Refer to Appendix B Appendix B: “In-year Targets for Retention, Achievement and Success 2011/12”, shows the in-year targets to be discussed and approved by the Standards Committee. The in-year success rate targets for 2011/12 have been set against the 2010/11 performance excluding the additional Employability and Personal and Social Development courses. They are set to ensure that the rates are challenging and drive improvement, and in most cases are at the national rate.
3. Demographic Data - Refer to Appendix D Appendix D consists of tables from the Success Rate for Learner Responsive funded learners summarised by ethnicity, disability and gender. Information presented in Appendix D is based on the data held in the management information student record system on November 2011. Figures below in [ ] relate to 2009/10 for comparison.
Ethnicity
In Greenwich, 29% of the population are from Black and Minority Ethnic backgrounds, compared with 13.0% nationally2. The 2001 census recorded the major Black and Minority Ethnic groups in Greenwich as Black African (7.1%), Indian (4.4%) and Black Caribbean (3.2%). In the College, 77.8%, [71.8%] of the student population, of known ethnicity on learner responsive funded courses, were from Black, Asian and Minority Ethnic (BAME) backgrounds. There was Black African 19.6%, [17.8%], Any Other 16.0%, [14.9%], White Other 10.6%, [7.6%], Other Asian 6.6%, [5.6%], Black Other 6.2%, [6.2%], Black Caribbean 5.5%, [5.1%] and Indian 2.8%, [3.3%].
The target for recording learner ethnicity in 2009/10 was set at 98.0% (2.0% unknown). This was achieved as only 0.5% of learner ethnicity was not provided or collected.
Appendix D: “Success Rates by Ethnicity” shows success rates by ethnicity and age for all lengths and levels of qualification combined together. The 2010/11 national averages are listed for comparison. There are 17 ethnic groups and in 2010/11 the 16-18 age group success rates show the impact of the additional Employability and Personal and Social Development courses that learners were enrolled to in-year. It is not possible to remove those courses from the demographic view of the data; however, the success rate with these courses removed is shown at the bottom of the table. The success rate improved the three year period in only five ethnic groups in 2010/11. These are shown with an * after their name, in Appendix D. There are only two groups where the success rate equals or exceeds the national rate; they are White - Irish and White – any
2 Source: http://neighbourhood.statistics.gov.uk
12
other White Background. These are highlighted in bold in Appendix D. For 19+ learners there is less impact of the additional Employability and Personal and Social Development courses which learners were enrolled to in-year because fewer learners were enrolled to them. The success rates have improved over the three year period in 9 of the ethnic groups, the same number as in 2009/10. These are shown with an * after their name, in Appendix D. In 2010/11, success rates equalled or exceeded the national average in five groups, compared to three groups in 2009/10. The groups were Indian, Pakistani and Mixed - White & Asian, Mixed – White & Black African, and Not provided. These are highlighted in bold in Appendix D. The ethnicity data is analysed by the Equality and Diversity group and at department level by managers and their teams who work closely with the Student Services department to identify “at risk groups of learners”. Such groups receive targeted support to help learners to succeed through mentoring projects and childcare support. Diversity within the learning experience is monitored through the teaching observation process; the learner voice and students’ Individual Learning Plan (ILP).
Disability In 2010 in Greenwich, 4.89% [4.42%] of the population aged between 16 to 69 years claimed a disability living allowance compared to 3.3% [3.3%] in London and 3.59% [3.87%] nationally3. In 2010/11 of those learners of known Difficulty/Disability /Health Status on qualification courses 12.5% [12.9%] declared a disability and or learning difficulty. The Difficulty/Disability /Health Status of 0.38% [1.05%] learners was unknown. Appendix D: “Success Rates by Difficulty/Disability /Health Status and Age 2008/09 – 2010/11” shows success rates (lengths and levels of qualification combined) by disability and/or learning difficulty and/or health issue. The success rate for 16-18 learners that declared a disability or learning difficulty increased by 5% compared to 2009/10. The success rate for 19+ learners that declared a disability or learning difficulty decreased by 1.7% compared to 2009/10.
Only some learners who declare a disability/learning difficulty and/or health issue receive additional learning support (ALS). It has been proven that those who receive Additional Learning Support are retained more than those who do not. The data shows that the number of learners with a disability and or learning difficulty has decreased over the three year period by 19%, but it has increased from 11.4 % to 12.4% of the student population. The success rate for 16-18 year olds with a disability and or learning difficulty has decreased significantly over the three year period. The success rate for 19+ learners with a disability and or learning difficulty improved by 1.5% in 2009/10 compared to 2008/09; however over the three year period, it has decreased by 0.4%. The disability data is analysed by the Equality and Diversity group and at department level by managers and their teams who work closely with the Student Services department to identify
3 Source: http://neighbourhood.statistics.gov.uk
13
appropriate support through the additional learning support (ALS) budget and initiatives such as partnership support projects with the PCT, the RNIB, RNID, MIND and various volunteer groups.
Gender The Greenwich 2001 census recorded the population as 52.1% female and 47.9% male, compared to 51.3% and 48.7% nationally4. In the College in 2010/11, 62.1%, [57.1%] of learners on qualifications were female and 37.9%, [42.9%] were male. The percentages for 16-18 learners were 48.4%, [45.1%] female and 51.6%, [54.9%] male; and for 19+ learners they were 68.5%, [64.6%] female and 31.5%, [35.4%] male. Appendix D: “Success Rates by Age and Gender 2008/09-2010/11”. The 16-18 age group success rates show the impact of the additional Employability and Personal and Social Development courses that learners were enrolled to in-year. It is not possible to remove those courses from the demographic view of the data. It shows that for 16-18 males and females success rates decreased over the three year period. The success rates for females exceeded that of males as opposed to in 2009/10. For 19+ learners there is less impact of the additional Employability and Personal and Social Development courses which learners were enrolled to in-year because fewer older learners were enrolled to them. The success rates for both females and males increased over the three year period and throughout the three year period success rate for females has exceeded that of males.
Supporting Learners to Achieve The college expects all learners to fulfil their potential and in order to address differential performance identified in respect of ethnicity, disability and gender, various processes and practices are undertaken systematically, for example success rates are reviewed by ethnicity, disability and gender and poorly performing groups are targeted for support. Course entry criteria are reviewed annually. When learners apply to join a course they are required to either have relevant qualifications at the appropriate level and/or they are required to take assessment tests in literacy, numeracy or ESOL that will identify the level they are operating at. The results allow learners to be placed on the level of course appropriate for them to be stretched, achieve and to progress. The outcomes of additional tests, such as dyslexia assessment, identify learning needs and inform support plans. Varieties of support are available to learners, who when referred or self refer, are assessed by specialist learning support staff. All learners are interviewed for their course; they are assessed regularly during their learner journey and after half a term their overall performance is formally reviewed through the tutorial system. At the formal review, decisions are taken about their potential success, expected achievement grades and whether or not they continue on their chosen programme of study or swap to another. Learners at risk are identified and mentored. Eligible learners receive financial support such as an Educational Maintenance Allowance (EMA), The Bursary Fund, and Adult Learning Grants (ALG), Childcare or Hardship support. Allowances awarded are strictly based on
4 Source: http://neighbourhood.statistics.gov.uk
14
attendance and progress.
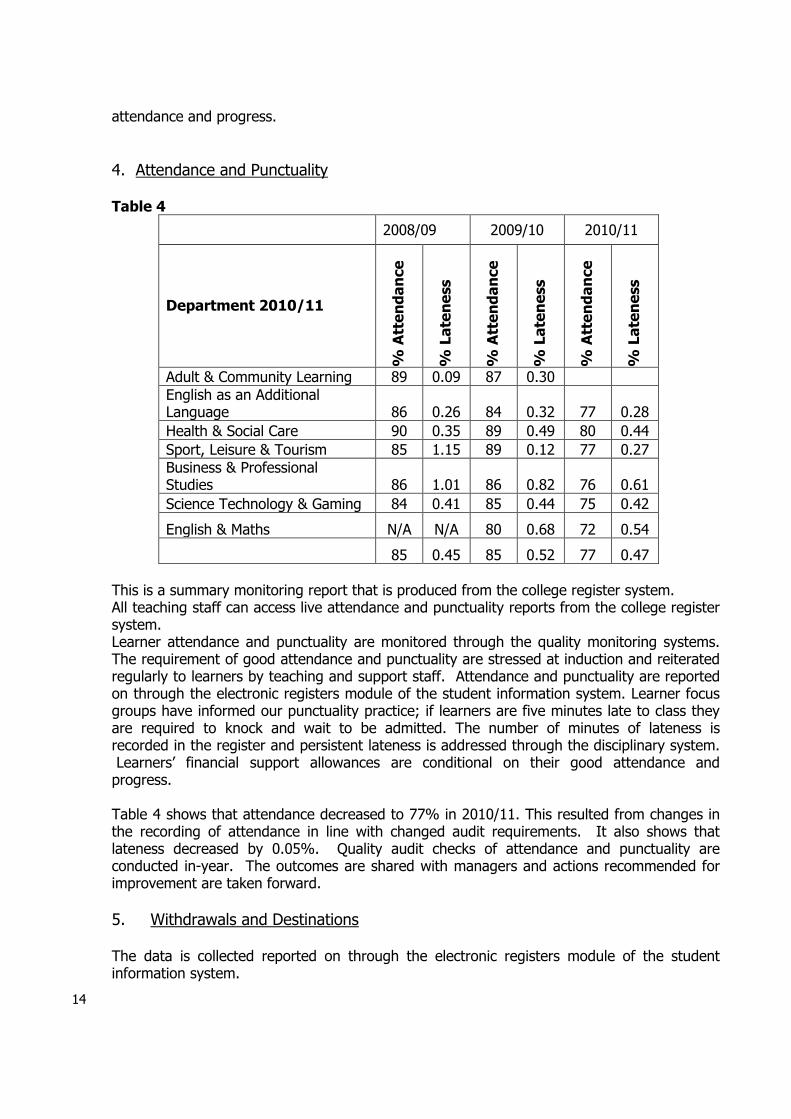
4. Attendance and Punctuality Table 4
2008/09 2009/10 2010/11
Department 2010/11
% A
tte
nd
an
ce
% L
ate
ne
ss
% A
tte
nd
an
ce
% L
ate
ne
ss
% A
tte
nd
an
ce
% L
ate
ne
ss
Adult & Community Learning 89 0.09 87 0.30
English as an Additional Language 86 0.26 84 0.32
77
0.28
Health & Social Care 90 0.35 89 0.49 80 0.44
Sport, Leisure & Tourism 85 1.15 89 0.12 77 0.27
Business & Professional Studies 86 1.01 86 0.82
76
0.61
Science Technology & Gaming 84 0.41 85 0.44 75 0.42
English & Maths N/A N/A 80 0.68 72 0.54
85 0.45 85 0.52 77 0.47
This is a summary monitoring report that is produced from the college register system. All teaching staff can access live attendance and punctuality reports from the college register system. Learner attendance and punctuality are monitored through the quality monitoring systems. The requirement of good attendance and punctuality are stressed at induction and reiterated regularly to learners by teaching and support staff. Attendance and punctuality are reported on through the electronic registers module of the student information system. Learner focus groups have informed our punctuality practice; if learners are five minutes late to class they are required to knock and wait to be admitted. The number of minutes of lateness is recorded in the register and persistent lateness is addressed through the disciplinary system. Learners’ financial support allowances are conditional on their good attendance and progress. Table 4 shows that attendance decreased to 77% in 2010/11. This resulted from changes in the recording of attendance in line with changed audit requirements. It also shows that lateness decreased by 0.05%. Quality audit checks of attendance and punctuality are conducted in-year. The outcomes are shared with managers and actions recommended for improvement are taken forward.
5. Withdrawals and Destinations The data is collected reported on through the electronic registers module of the student information system.
15
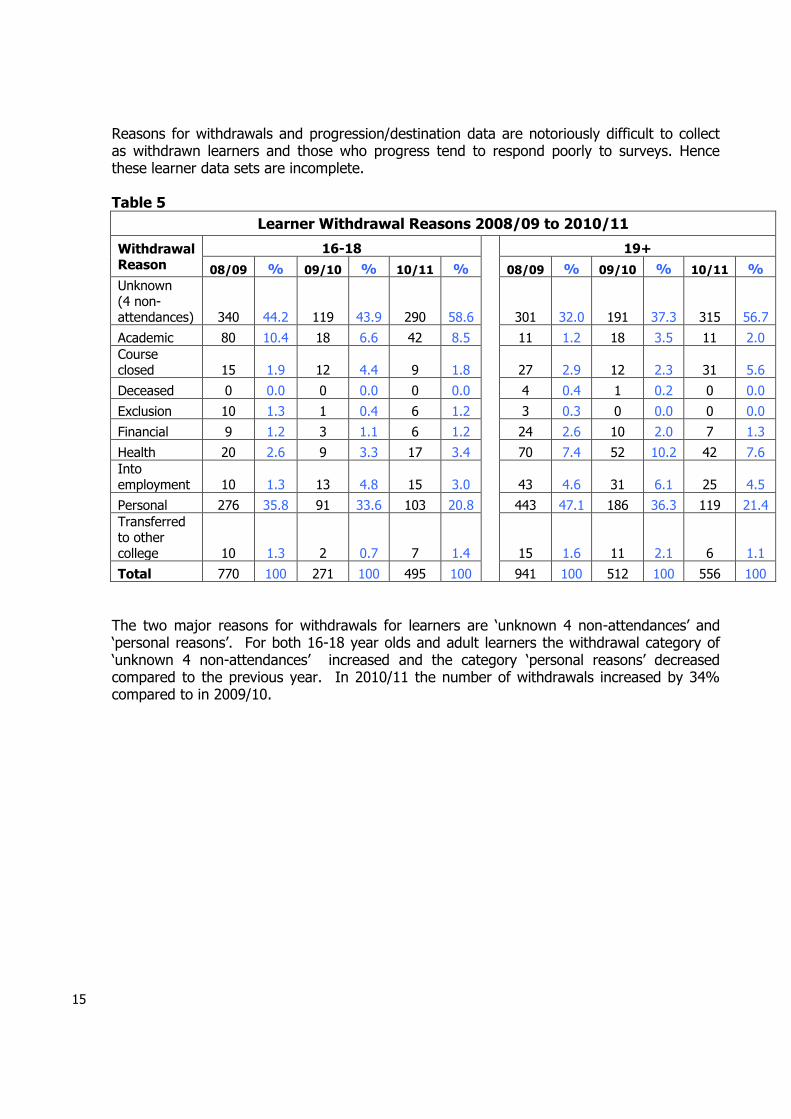
Reasons for withdrawals and progression/destination data are notoriously difficult to collect as withdrawn learners and those who progress tend to respond poorly to surveys. Hence these learner data sets are incomplete. Table 5
Learner Withdrawal Reasons 2008/09 to 2010/11
Withdrawal Reason
16-18 19+
08/09 % 09/10 % 10/11 % 08/09 % 09/10 % 10/11 %
Unknown (4 non-attendances) 340 44.2 119 43.9 290 58.6 301 32.0 191 37.3 315 56.7
Academic 80 10.4 18 6.6 42 8.5 11 1.2 18 3.5 11 2.0
Course closed 15 1.9 12 4.4 9 1.8 27 2.9 12 2.3 31 5.6
Deceased 0 0.0 0 0.0 0 0.0 4 0.4 1 0.2 0 0.0
Exclusion 10 1.3 1 0.4 6 1.2 3 0.3 0 0.0 0 0.0
Financial 9 1.2 3 1.1 6 1.2 24 2.6 10 2.0 7 1.3
Health 20 2.6 9 3.3 17 3.4 70 7.4 52 10.2 42 7.6
Into employment 10 1.3 13 4.8 15 3.0 43 4.6 31 6.1 25 4.5
Personal 276 35.8 91 33.6 103 20.8 443 47.1 186 36.3 119 21.4
Transferred to other college 10 1.3 2 0.7 7 1.4 15 1.6 11 2.1 6 1.1
Total 770 100 271 100 495 100 941 100 512 100 556 100
The two major reasons for withdrawals for learners are ‘unknown 4 non-attendances’ and ‘personal reasons’. For both 16-18 year olds and adult learners the withdrawal category of ‘unknown 4 non-attendances’ increased and the category ‘personal reasons’ decreased compared to the previous year. In 2010/11 the number of withdrawals increased by 34% compared to in 2009/10.
16
Table 6
Progression and Destination by Learner and Age 2008/09 to 2010/11
Progression/ Destination
16-18 19+
08/09 % 09/10 % 10/11 % 08/09 % 09/10 % 10/11 %
Deceased 0 0.0 1 0.1 0 0.0 0 0.0 0 0.0 0 0.0
Employment 24 2.0 58 5.0 38 3.4 533 11.5 805 19.5 45 1.3
FE 569 48.5 573 48.9 567 51.3 1889 40.9 1153 28.0 1179 33.3
HE 85 7.2 79 6.7 153 13.8 244 5.3 270 6.6 231 6.5
Unemployment 2 0.2 5 0.4 2 0.2 18 0.4 4 0.1 5 0.1
Unknown 493 42.0 455 38.9 345 31.2 1931 41.8 1890 45.9 2084 58.8
Total 1173 100 1171 100 1105 100 4615 100 4122 100 3544 100
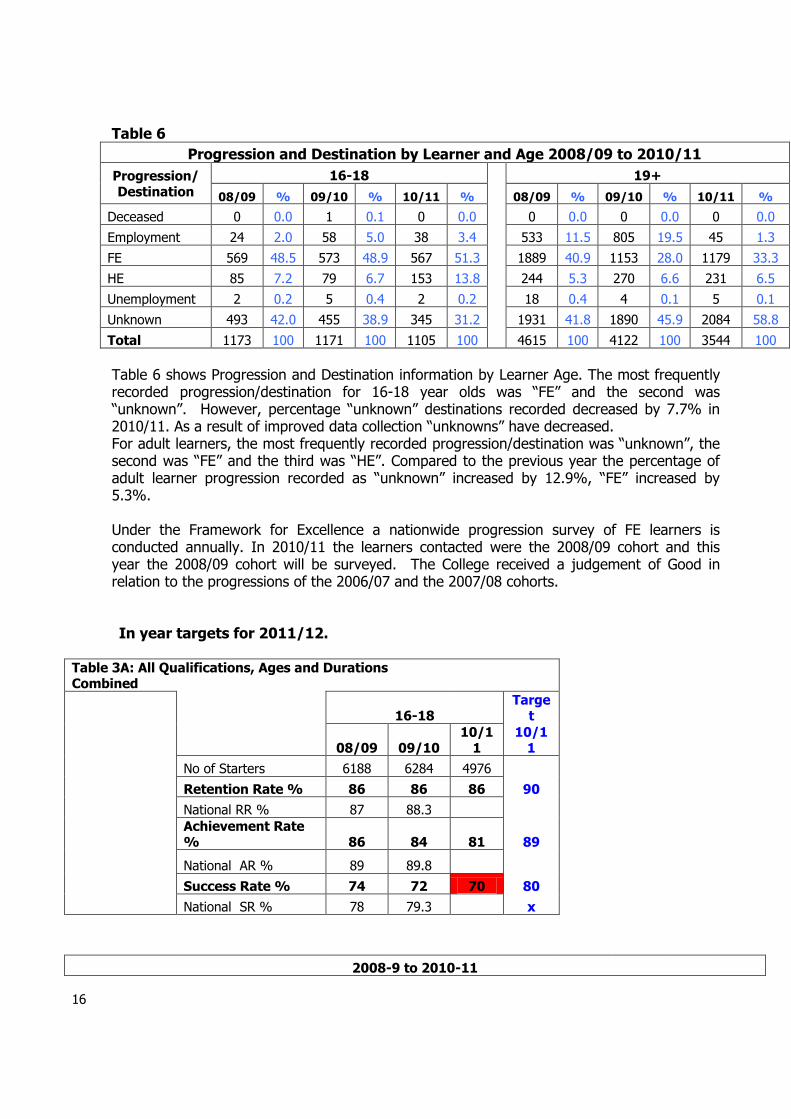
Table 6 shows Progression and Destination information by Learner Age. The most frequently recorded progression/destination for 16-18 year olds was “FE” and the second was “unknown”. However, percentage “unknown” destinations recorded decreased by 7.7% in 2010/11. As a result of improved data collection “unknowns” have decreased. For adult learners, the most frequently recorded progression/destination was “unknown”, the second was “FE” and the third was “HE”. Compared to the previous year the percentage of adult learner progression recorded as “unknown” increased by 12.9%, “FE” increased by 5.3%. Under the Framework for Excellence a nationwide progression survey of FE learners is conducted annually. In 2010/11 the learners contacted were the 2008/09 cohort and this year the 2008/09 cohort will be surveyed. The College received a judgement of Good in relation to the progressions of the 2006/07 and the 2007/08 cohorts.
In year targets for 2011/12.
Table 3A: All Qualifications, Ages and Durations Combined
16-18 Targe
t
08/09 09/10 10/1
1 10/1
1 No of Starters 6188 6284 4976 Retention Rate % 86 86 86 90 National RR % 87 88.3
Achievement Rate % 86 84 81 89
National AR % 89 89.8
Success Rate % 74 72 70 80 National SR % 78 79.3 x
2008-9 to 2010-11
17
Table 3A: All Qualifications and Durations by Age
16-18 Targe
t 19+ Targe
t
08/09 09/10 10/1
1 10/1
1 08/0
9 09/1
0 10/11
10/11
No of Starters 2148 2402 1888 4040 3882 3088
Retention Rate % 86 86 87 82 83 85
National RR % 87 87.9 87 88.6
Achievement Rate % 86 84 74 81 85 86
National AR % 89 90 89 87.9
Success Rate % 74 72 65 66 70 73
National SR % 78 79.1 77 79.4
Table 3B: Long Qualifications 16-18 Targe
t 19+ Targe
t
Level 08/09 09/10 10/1
1 10/1
1 08/0
9 09/1
0 10/11
10/11
No of Starters 630 709 428 1352 1556 1422
Retention Rate % 84 80 86 87 82 83 82 86
Entry National RR % 87 87.8 87 86.4
and Achievement Rate % 81 83 54 88 81 85 85 88
1 National AR % 90 90.7 89 87.9
Success Rate % 68 67 46 77 66 70 70 76
National SR % 78 79.7 x 77 76 x
No of Starters 540 511 435 794 710 519
Retention Rate % 81 82 87 86 87 85 88 85
National RR % 85 85.7 83 83.5
2 Achievement Rate % 86 88 83 90 86 85 82 89
National AR % 90 90.2 88 89.2
Success Rate % 70 73 72 77 75 72 73 76
National SR % 76 77.4 x 74 74.5 x
2008-9 to 2010-11
Table 3B: Long Qualifications 16-18 Targe
t 19+ Targ
et
Level 08/09 09/10 10/1
1 10/1
1 08/0
9 09/1
0 10/1
1 10/11
No of Starters 524 729 698 557 706 527
Retention Rate % 89 88 86 90 87 83 91 87
18
National RR % 86 86.7 83 83.3
3 Achievement Rate % 88 85 82 89 88 86 88 89
National AR % 89 89.6 88 89.6
Success Rate % 78 75 71 80 76 72 80 77
National SR % 77 77.7 x 73 74.6
No of Starters 3 4 49 50 75
Retention Rate % 100 50 82 86 55 85
National RR % 87.1 83 83.6
H Achievement Rate % 67 100 98 51 98 78
National AR % 76.7 75 76.9
Success Rate % 67 50 80 44 53 66
National SR % 66.8 63 64.4 x
2008-9 to 2010-11
Table 3C: Short Qualifications 16-18 Targe
t 19+ Targ
et
Level 08/09 09/10 10/1
1 10/1
1 08/0
9 09/1
0 10/1
1 10/11
No of Starters 242 159 200 1000 601 389
Entry Retention Rate % 92 96 88 94 89 91 87 93
and National RR % 92 92.4 92 92.4
1 Achievement Rate % 85 77 75 86 87 80 85 88
2, 3, National AR % 87 88.1 89 89.4
H Success Rate % 78 74 66 81 77 73 74 82
National SR % 80 81.4 x 82 82.6 x
2008-9 to 2010-11
Table 3D: Very Short Qual’s 16-18 Targe
t 19+ Targ
et
Level 08/09 09/10 10/1
1 10/1
1 08/0
9 09/1
0 10/1
1 10/11
No of Starters 212 294 123 288 259 156
Entry Retention Rate % 90 93 98 99 93 97 100 99
and National RR % 98 98.2 99 99
1 Achievement Rate % 94 78 69 93 93 86 93 95
2, 3, National AR % 93 92.9 96 94.3
H Success Rate % 85 72 68 92 86 83 93 94
19
National SR % 91 91.2 x 94 93.4 x
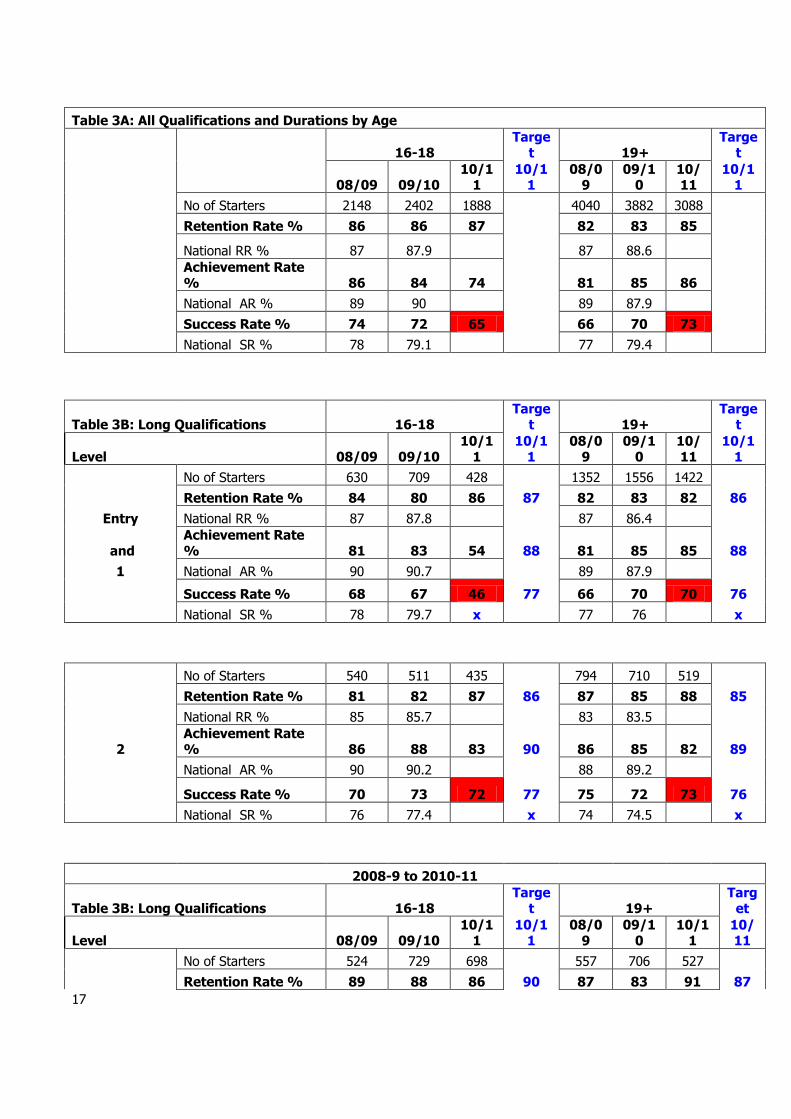
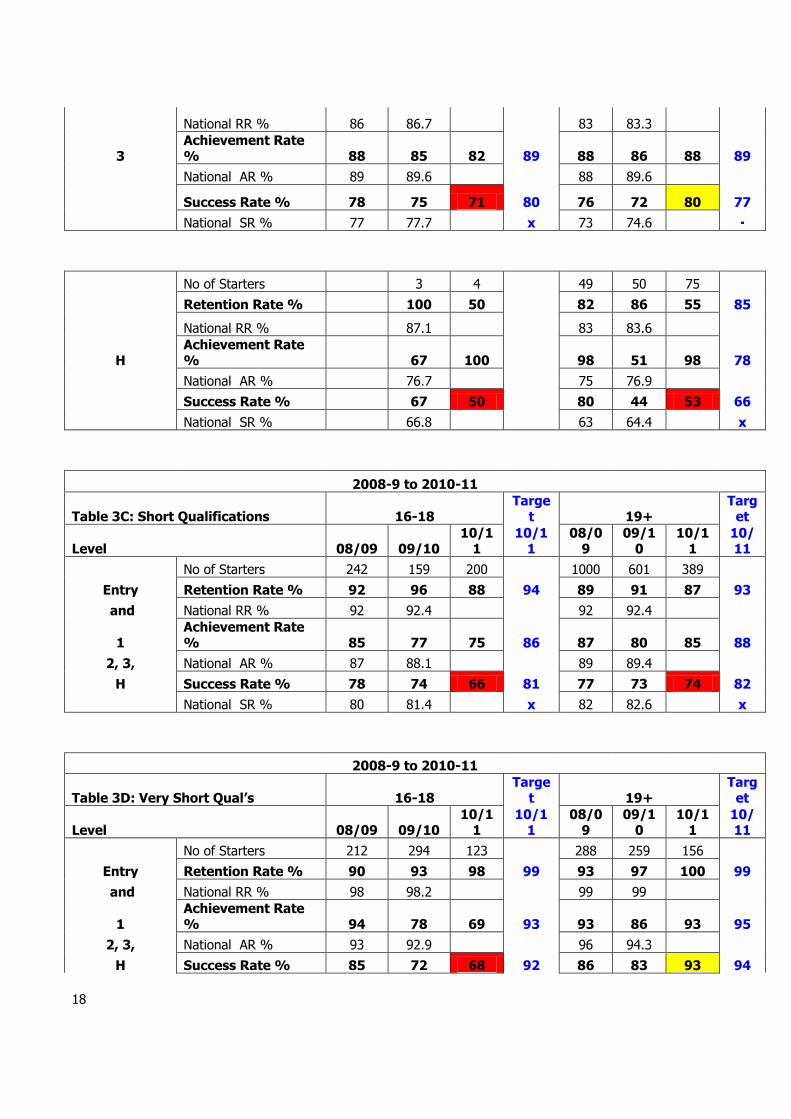
There following points were made in the ensuing discussion of this report: The Committee noted the target for all ages and grades was 80% which meant that the College had to improve on its current performance by 10%. They seriously doubted the capacity for such an improvement to be made. Resolved
That the departmental SARs should outline where improvements will be made to achieve higher success rates.
The outcomes from the Quality Planning Review process are reported to Standards Committee.
In-year projection should be made and reported to Standards Committee.
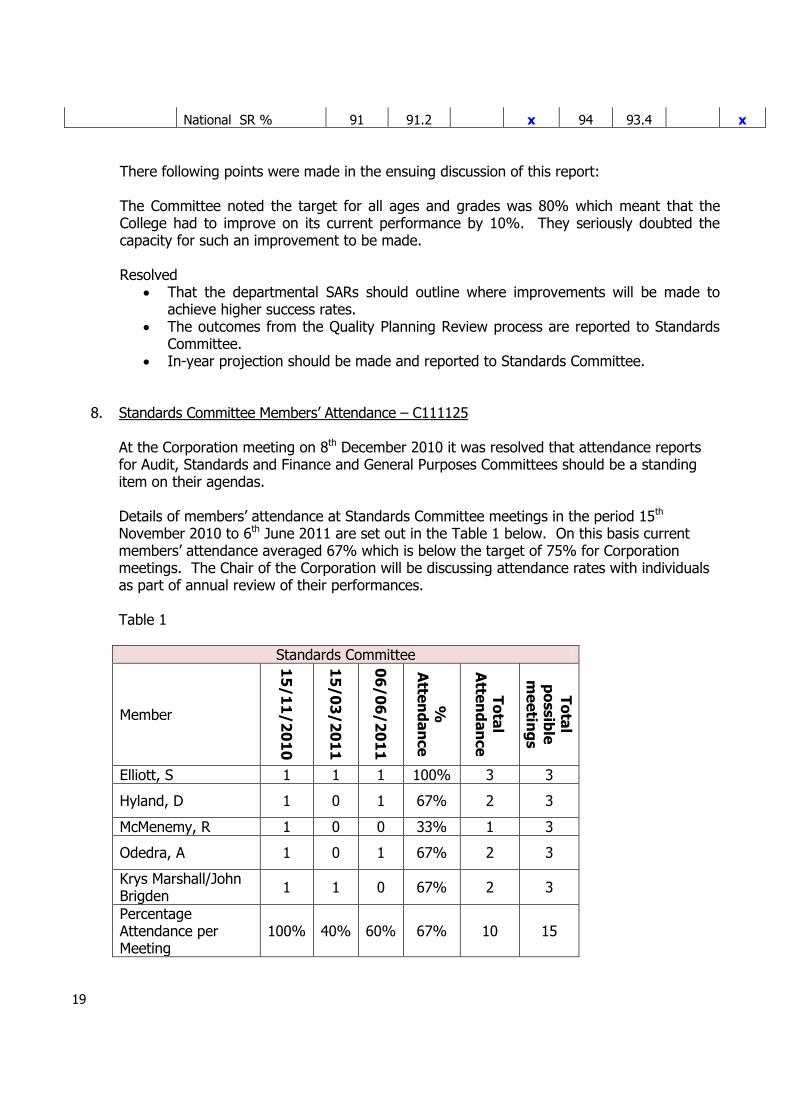
8. Standards Committee Members’ Attendance – C111125
At the Corporation meeting on 8th December 2010 it was resolved that attendance reports
for Audit, Standards and Finance and General Purposes Committees should be a standing item on their agendas.
Details of members’ attendance at Standards Committee meetings in the period 15th
November 2010 to 6th June 2011 are set out in the Table 1 below. On this basis current members’ attendance averaged 67% which is below the target of 75% for Corporation meetings. The Chair of the Corporation will be discussing attendance rates with individuals as part of annual review of their performances.
Table 1
Standards Committee
Member
15
/1
1/2
01
0
15
/0
3/2
01
1
06
/0
6/2
01
1
%
Atte
nd
an
ce
To
tal
Atte
nd
an
ce
To
tal
po
ssib
le
me
etin
gs
Elliott, S 1 1 1 100% 3 3
Hyland, D 1 0 1 67% 2 3
McMenemy, R 1 0 0 33% 1 3
Odedra, A 1 0 1 67% 2 3
Krys Marshall/John Brigden
1 1 0 67% 2 3
Percentage Attendance per Meeting
100% 40% 60% 67% 10 15
20
Resolved
That the report be received.
9. Any other urgent business There was none.
10. Date and time of next meeting
The next meeting of the Committee is scheduled to take place on Monday, 5th March 2012 at 6.00 pm.
End of the meeting
The meeting ended at 8.45 pm.
SCMINS 21_11_11 Signed………………………………………………………………………………………………… Sheila Elliott, Standards Committee, Greenwich Community Corporation Date: ………………………………………………………………………………………………….