Embed Size (px)
Citation preview

March 14, 2012
GREY RIVER PROJECT
Preliminary Economic Assessment
REP
OR
T
Project Number: 1114390003-001-R-Rev1
Distribution:
2 hard copies - Playfair Mining Limited
2 hard copies - Golder Associates Ltd.
Submitted to:Playfair Mining Limited Suite 520 - 470 Granville Street Vancouver, BC V6C 1V5 Attention: Mr. Neil Briggs

GREY RIVER PROJECT PRELIMINARY ECONOMIC ASSESSMENT
March 14, 2012 Project No. 1114390003-001-R-Rev1 i
Study Limitations
Golder Associates Ltd. (Golder) has prepared this document in a manner consistent with that level of care and
skill ordinarily exercised by members of the engineering and science professions currently practising under
similar conditions in the jurisdiction in which the services are provided, subject to the time limits and physical
constraints applicable to this document. No warranty, express or implied, is made.
This document, including all text, data, tables, plans, figures, drawings and other documents contained herein,
has been prepared by Golder for the sole benefit of Playfair Mining Limited. It represents Golder’s professional
judgement based on the knowledge and information available at the time of completion. Golder is not
responsible for any unauthorized use or modification of this document. All third parties relying on this document
do so at their own risk.
The factual data, interpretations, suggestions, recommendations and opinions expressed in this document
pertain to the specific project, site conditions, design objective, development and purpose described to Golder by
Playfair Mining Limited, and are not applicable to any other project or site location. In order to properly
understand the factual data, interpretations, suggestions, recommendations and opinions expressed in this
document, reference must be made to the entire document.
This document, including all text, data, tables, plans, figures, drawings and other documents contained herein,
as well as all electronic media prepared by Golder are considered its professional work product and shall remain
the copyright property of Golder. Playfair Mining Limited may make copies of the document in such quantities as
are reasonably necessary for those parties conducting business specifically related to the subject of this
document or in support of or in response to regulatory inquiries and proceedings. Electronic media is
susceptible to unauthorized modification, deterioration and incompatibility and therefore no party can rely solely
on the electronic media versions of this document.

GREY RIVER PROJECT PRELIMINARY ECONOMIC ASSESSMENT
March 14, 2012 Project No. 1114390003-001-R-Rev1 ii
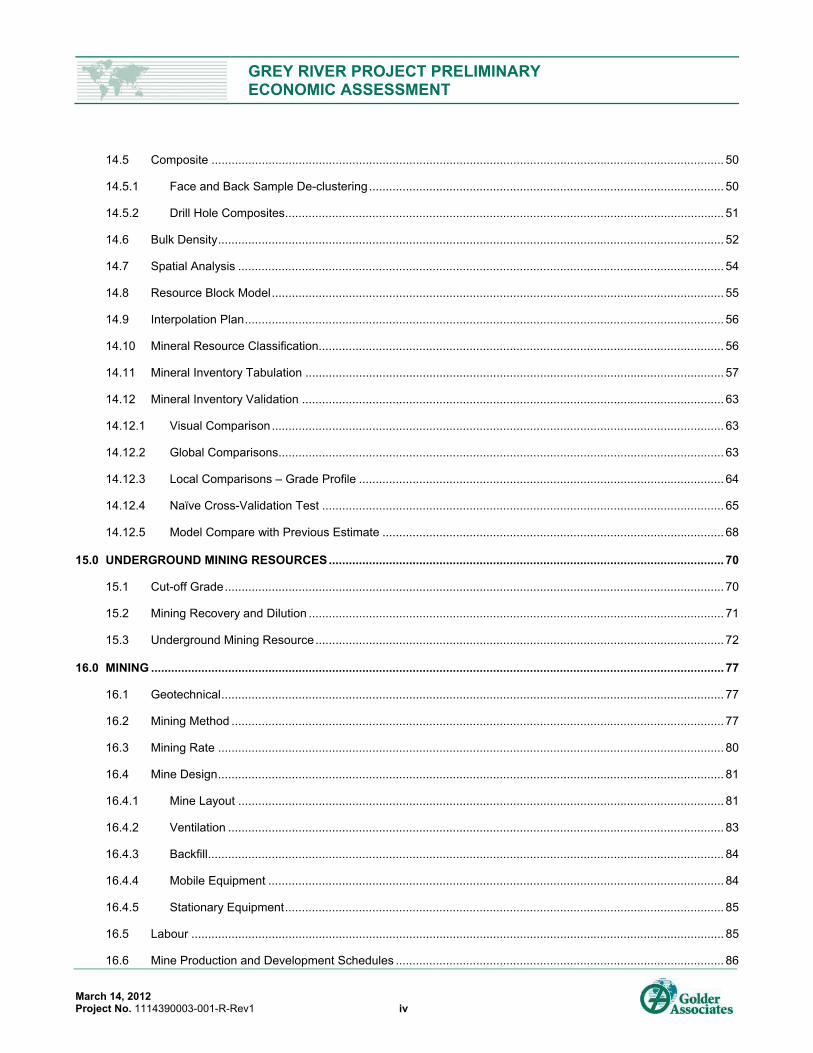
Table of Contents
STUDY LIMITATIONS ................................................................................................................................................................ i
1.0 SUMMARY ........................................................................................................................................................................ 1
2.0 INTRODUCTION ............................................................................................................................................................... 3
2.1 Terms of Reference ............................................................................................................................................. 4
3.0 RELIANCE ON OTHER EXPERTS .................................................................................................................................. 5
3.1 Environmental and Legal ..................................................................................................................................... 5
3.2 Marketing ............................................................................................................................................................. 5
4.0 PROPERTY DESCRIPTION AND LOCATION ................................................................................................................. 6
5.0 ACCESSIBILITY, CLIMATE, LOCAL RESOURCES, INFRASTRUCTURE AND PHYSIOGRAPHY .............................. 8
5.1 Accessibility and Infrastructure ............................................................................................................................ 8
5.2 Physiography, Elevation and Climate .................................................................................................................. 8
6.0 HISTORY .......................................................................................................................................................................... 9
6.1 Historical Resource Estimate ............................................................................................................................. 11
7.0 GEOLOGICAL SETTING AND MINERALIZATION ....................................................................................................... 12
7.1 General Geology and Structure ......................................................................................................................... 12
7.2 Mineralization – Tungsten Veins ........................................................................................................................ 13
7.3 Number 10 Vein ................................................................................................................................................. 14
7.4 Number 6 Vein ................................................................................................................................................... 14
7.5 Other Gold and Silver Rich Veins ...................................................................................................................... 14
8.0 DEPOSIT TYPE .............................................................................................................................................................. 16
9.0 EXPLORATION .............................................................................................................................................................. 18
9.1 Summer 2006 .................................................................................................................................................... 18
9.1.1 Adit ............................................................................................................................................................... 18
9.2 Summer 2008 .................................................................................................................................................... 20
10.0 DRILLING ....................................................................................................................................................................... 21
10.1 Pre-1970 ............................................................................................................................................................ 21
10.2 Playfair 2006 ...................................................................................................................................................... 23
10.2.1 Number 10 Vein ........................................................................................................................................... 24
10.2.2 Number 6 Vein ............................................................................................................................................. 24

GREY RIVER PROJECT PRELIMINARY ECONOMIC ASSESSMENT
March 14, 2012 Project No. 1114390003-001-R-Rev1 iii
10.3 Playfair 2008 ...................................................................................................................................................... 25
10.3.1 Number 10 Vein ........................................................................................................................................... 25
10.3.2 Upper Zone .................................................................................................................................................. 26
11.0 SAMPLE PREPARATION, ANALYSES AND SECURITY ............................................................................................. 28
11.1 Sample Collection .............................................................................................................................................. 28
11.2 Sample Preparation and Analysis ...................................................................................................................... 31
11.3 Comments on the Data Quality and Assay ........................................................................................................ 34
12.0 DATA VERIFICATION .................................................................................................................................................... 35
12.1 Site Visit Summary by Wardrop ......................................................................................................................... 35
12.2 Site Visit Summary by DGL ............................................................................................................................... 35
12.3 Drill Hole Collar Validation ................................................................................................................................. 39
12.4 Digital Data Verification by Wardrop .................................................................................................................. 40
12.5 Digital Data Verification by DGL ........................................................................................................................ 40
12.5.1 Historical Drill Holes ..................................................................................................................................... 40
12.5.2 Historical Channel Samples ......................................................................................................................... 41
12.5.3 Trench and Rock Samples ........................................................................................................................... 41
12.5.4 Assay Validation .......................................................................................................................................... 41
13.0 METALLURGICAL TESTING AND MINERAL PROCESSING ...................................................................................... 42
13.1 Metallurgical Testing .......................................................................................................................................... 42
13.2 Mineral Processing ............................................................................................................................................ 42
13.2.1 Processing Methods..................................................................................................................................... 43
13.2.2 Recoverability .............................................................................................................................................. 43
14.0 MINERAL RESOURCE ESTIMATE ............................................................................................................................... 44
14.1.1 Data ............................................................................................................................................................. 44
14.1.2 South Plainfield Check Sample Assessment ............................................................................................... 45
14.1.3 Bulk Sample Assessment ............................................................................................................................ 45
14.2 Geological Interpretation .................................................................................................................................... 46
14.3 Exploratory Data Analysis .................................................................................................................................. 47
14.3.1 Assays ......................................................................................................................................................... 47
14.4 Capping ............................................................................................................................................................. 49
GREY RIVER PROJECT PRELIMINARY ECONOMIC ASSESSMENT
March 14, 2012 Project No. 1114390003-001-R-Rev1 iv
14.5 Composite ......................................................................................................................................................... 50
14.5.1 Face and Back Sample De-clustering .......................................................................................................... 50
14.5.2 Drill Hole Composites ................................................................................................................................... 51
14.6 Bulk Density ....................................................................................................................................................... 52
14.7 Spatial Analysis ................................................................................................................................................. 54
14.8 Resource Block Model ....................................................................................................................................... 55
14.9 Interpolation Plan ............................................................................................................................................... 56
14.10 Mineral Resource Classification......................................................................................................................... 56
14.11 Mineral Inventory Tabulation ............................................................................................................................. 57
14.12 Mineral Inventory Validation .............................................................................................................................. 63
14.12.1 Visual Comparison ....................................................................................................................................... 63
14.12.2 Global Comparisons..................................................................................................................................... 63
14.12.3 Local Comparisons – Grade Profile ............................................................................................................. 64
14.12.4 Naïve Cross-Validation Test ........................................................................................................................ 65
14.12.5 Model Compare with Previous Estimate ...................................................................................................... 68
15.0 UNDERGROUND MINING RESOURCES ...................................................................................................................... 70
15.1 Cut-off Grade ..................................................................................................................................................... 70
15.2 Mining Recovery and Dilution ............................................................................................................................ 71
15.3 Underground Mining Resource .......................................................................................................................... 72
16.0 MINING ........................................................................................................................................................................... 77
16.1 Geotechnical ...................................................................................................................................................... 77
16.2 Mining Method ................................................................................................................................................... 77
16.3 Mining Rate ....................................................................................................................................................... 80
16.4 Mine Design ....................................................................................................................................................... 81
16.4.1 Mine Layout ................................................................................................................................................. 81
16.4.2 Ventilation .................................................................................................................................................... 83
16.4.3 Backfill .......................................................................................................................................................... 84
16.4.4 Mobile Equipment ........................................................................................................................................ 84
16.4.5 Stationary Equipment ................................................................................................................................... 85
16.5 Labour ............................................................................................................................................................... 85
16.6 Mine Production and Development Schedules .................................................................................................. 86

GREY RIVER PROJECT PRELIMINARY ECONOMIC ASSESSMENT
March 14, 2012 Project No. 1114390003-001-R-Rev1 v
16.7 Mine Services .................................................................................................................................................... 86
17.0 PROJECT INFRASTRUCTURE ..................................................................................................................................... 87
17.1 Site Layout Description ...................................................................................................................................... 87
17.2 Electrical Power System and Site Distribution ................................................................................................... 88
17.3 Other Site Facilities ............................................................................................................................................ 88
17.4 Waste Dumps .................................................................................................................................................... 88
17.5 Stockpiles .......................................................................................................................................................... 88
17.6 Tailings Management Facility ............................................................................................................................ 88
18.0 MARKET STUDIES AND CONTRACTS ........................................................................................................................ 89
19.0 ENVIRONMENTAL STUDIES, PERMITTING, AND SOCIAL OR COMMUNITY IMPACT ............................................ 90
19.1 Identification of Potential Issues and Baseline Studies ...................................................................................... 90
19.2 Primary Issues ................................................................................................................................................... 91
19.2.1 Water Quality and Quantity .......................................................................................................................... 91
19.2.2 Fish and Fish Habitat, and Pond Bathymetry ............................................................................................... 92
19.2.3 Historic Resources (Stage 1) ....................................................................................................................... 92
19.2.4 Rare Plants .................................................................................................................................................. 93
19.3 Secondary Issues .............................................................................................................................................. 93
19.3.1 Vegetation/Habitat Type Classification......................................................................................................... 93
19.3.2 Migratory Birds and Raptors ........................................................................................................................ 93
19.3.3 Species at Risk ............................................................................................................................................ 93
19.3.4 Big Game ..................................................................................................................................................... 94
19.3.5 Socio-Economic Environment ...................................................................................................................... 94
20.0 CAPITAL AND OPERATING COSTS ............................................................................................................................ 95
20.1 Operating Cost Estimates .................................................................................................................................. 95
20.1.1 Mining Costs ................................................................................................................................................ 95
20.1.2 Processing Costs ......................................................................................................................................... 96
20.1.3 General and Administrative Costs ................................................................................................................ 96
20.1.4 Refining and Transportation Costs ............................................................................................................... 96
20.2 Capital Cost Estimates ...................................................................................................................................... 97
20.2.1 Site Infrastructure ......................................................................................................................................... 97

GREY RIVER PROJECT PRELIMINARY ECONOMIC ASSESSMENT
March 14, 2012 Project No. 1114390003-001-R-Rev1 vi
20.2.2 Mine ............................................................................................................................................................. 97
20.2.3 Process Plant ............................................................................................................................................... 99
20.2.4 Project Capital Cost Schedule ................................................................................................................... 101
21.0 ECONOMIC ANALYSIS ............................................................................................................................................... 102
21.1 Methodology .................................................................................................................................................... 102
21.2 Basis of Analysis .............................................................................................................................................. 102
21.3 Results of Cash Flow Analysis ........................................................................................................................ 102
21.4 Sensitivity Analysis .......................................................................................................................................... 102
21.5 Project Payback ............................................................................................................................................... 104
21.6 Project Risks and Opportunities....................................................................................................................... 105
22.0 ADJACENT PROPERTIES ........................................................................................................................................... 106
23.0 OTHER RELEVANT DATA AND INFORMATION ....................................................................................................... 107
24.0 INTERPRETATION AND CONCLUSIONS ................................................................................................................... 108
24.1 Resources ....................................................................................................................................................... 108
24.2 Mining .............................................................................................................................................................. 109
24.3 Processing ....................................................................................................................................................... 109
24.4 Environmental .................................................................................................................................................. 110
25.0 RECOMMENDATIONS ................................................................................................................................................. 111
25.1 Exploration Recommendations ........................................................................................................................ 111
25.1.1 Phase 1 ...................................................................................................................................................... 111
25.1.2 Phase 2 ...................................................................................................................................................... 112
25.2 Mining .............................................................................................................................................................. 114
25.3 Processing ....................................................................................................................................................... 114
25.4 Environmental .................................................................................................................................................. 114
26.0 REFERENCES .............................................................................................................................................................. 116
27.0 CERTIFICATES OF QUALIFIED PERSONS ............................................................................................................... 117
27.1 Certificate for Joseph Rosaire Pierre Desautels, P.Geo. ................................................................................. 117
27.2 Certificate of David Sprott, P.Eng. ................................................................................................................... 118
27.3 Certificate of Andrew Bamber, P.Eng. ............................................................................................................. 119
28.0 CLOSURE ..................................................................................................................................................................... 121

GREY RIVER PROJECT PRELIMINARY ECONOMIC ASSESSMENT
March 14, 2012 Project No. 1114390003-001-R-Rev1 vii
TABLES
Table 2-1: Qualified Person Responsibilities for Various Sections of Report ............................................................................. 4
Table 6-1: Work History.............................................................................................................................................................. 9
Table 10-1: Pre 1970 Diamond Drill Hole Summary for Grey River Pre 1970 .......................................................................... 22
Table 10-2: 2006 Diamond Drill Hole Summary for Grey River ................................................................................................ 24
Table 10-3: 2008 Diamond Drill Hole Summary for Grey River ................................................................................................ 25
Table 12-1: Character Sample Results .................................................................................................................................... 36
Table 12-2: Collar Coordinate Validation ................................................................................................................................. 39
Table 12-3: Data Verification .................................................................................................................................................... 40
Table 13-1: Metallurgical Design Criteria ................................................................................................................................. 43
Table 14-1: Drilling Data Records used for the Resource Estimate ......................................................................................... 44
Table 14-2: Non-drilling Data Records used for the Resource Estimate .................................................................................. 45
Table 14-3: Total Wireframe Volume ....................................................................................................................................... 46
Table 14-4: Raw Assay Statistics (WO3) .................................................................................................................................. 49
Table 14-5: Composite Statistics (%WO3) ................................................................................................................................ 51
Table 14-6: Bulk Density Samples in Number 10 Vein ............................................................................................................. 53
Table 14-7: Sample Search Parameters .................................................................................................................................. 55
Table 14-8: Block Matrix Definition ........................................................................................................................................... 55
Table 14-9: Mineral inventory at 0.2% WO3 Cut-off. ................................................................................................................ 58
Table 14-10: Global Inferred Mineral Inventories ..................................................................................................................... 59
Table 14-11: Global Inferred Mineral Inventory (Vein No10) .................................................................................................... 59
Table 14-12: Global Inferred Mineral Inventory (Vein No 10a) ................................................................................................. 60
Table 14-13: Global Inferred Mineral Inventory (Vein No6) ...................................................................................................... 60
Table 14-14: Global Grade Comparisons at 0.00 Cut-off ......................................................................................................... 63
Table 14-15: All Veins Compared to the Wardrop June 2007 Resource .................................................................................. 68
Table 14-16: Vein 10 Compared to the Wardrop June 2007 Resource .................................................................................... 69
Table 15-1: Economic Parameters Used to Determine the Grey River Cut-off Grade ............................................................. 71
Table 15-2: Comparison of GEMS™ Mineral Resource Model to Minesight™ Model at a 0.30% Cut-off ................................ 72
Table 15-3: The Total Underground Mining Resource by Zone (0.35% cut-off) ....................................................................... 76
Table 16-1: Estimated Total Life-of-mine Development Quantities .......................................................................................... 82
Table 16-2: Estimated Total Mine Air Ventilation Requirements .............................................................................................. 84
Table 16-3: Underground Mobile Equipment Requirements .................................................................................................... 85
Table 16-4: Underground Mine Stationary Equipment Requirements ...................................................................................... 85

GREY RIVER PROJECT PRELIMINARY ECONOMIC ASSESSMENT
March 14, 2012 Project No. 1114390003-001-R-Rev1 viii
Table 20-1: Process Plant Cost Breakdown ............................................................................................................................. 96
Table 20-2: Site Infrastructure Capital Cost Estimate (LOM) ................................................................................................... 97
Table 20-3: Mine Development Capital Cost Estimate (LOM) .................................................................................................. 98
Table 20-4: Mine Equipment Capital Cost Estimate (LOM) ...................................................................................................... 99
Table 20-5: Process Plant Capital Cost Estimate ................................................................................................................... 100
Table 20-6: LOM Capital Cost Schedule ................................................................................................................................ 101
Table 20-7: Total LOM Capital Cost Breakdown .................................................................................................................... 101
Table 21-1: Summary of Base Case Project Parameters used in the Cash Flow Analysis .................................................... 102
Table 25-1: Budget Estimate for Validating Underground Samples ....................................................................................... 111
Table 25-2: Proposed Budget for Additional Fill-in Drilling on the Number 10 Vein ............................................................... 112
FIGURES
Figure 4.1: Location map for the Grey River Tungsten Property ................................................................................................ 6
Figure 4.2: Playfair Mining Ltd. Licence 015686M ..................................................................................................................... 7
Figure 8.1: Grey River Regional Geology Deposit Types ......................................................................................................... 17
Figure 9.1: Underground adit photographs............................................................................................................................... 19
Figure 10.1: Drill hole plan map for the Number 6 and Number 10 veins ................................................................................. 27
Figure 11.1: Example of a portion of the ASARCO underground back sampling program ....................................................... 29
Figure 11.2: Flooring arrangement for bulk sample collection .................................................................................................. 30
Figure 11.3: Copper standard CDN-W-1 .................................................................................................................................. 33
Figure 11.4: Tungsten Standard CDN-W-1 .............................................................................................................................. 33
Figure 12.2: Scheelite flourite and Wolframite in quartz ........................................................................................................... 37
Figure 12.1: Number 10 vein in core ........................................................................................................................................ 37
Figure 12.3: Site visit photographs ........................................................................................................................................... 38
Figure 14.1: Position of the 3-D wireframe volume with contours ............................................................................................ 47
Figure 14.2: Population distribution of various sample types ................................................................................................... 48
Figure 14.3: Decile analysis result ........................................................................................................................................... 50
Figure 14.4: Representative plan view through the %WO3 grade model (capped) at the drift elevation .................................. 61
Figure 14.5: Representative section through the resource %WO3 grade model (capped) ....................................................... 62
Figure 14.6: Global grade comparison at 0.00% WO3 cut-off ................................................................................................... 64
Figure 14.7: Y-axis swath plots for Vein 10 - Northing ............................................................................................................. 66
Figure 14.8: Z-axis swath plots for Vein 10 - Elevation ............................................................................................................ 67
Figure 14.9: Naive cross validation regression results ............................................................................................................. 68
GREY RIVER PROJECT PRELIMINARY ECONOMIC ASSESSMENT
March 14, 2012 Project No. 1114390003-001-R-Rev1 ix
Figure 15.1: Three-year historic prices for Tungsten APT (USD/MTU). (bloomberg.com) ....................................................... 70
Figure 15.2: Methodology used to develop mineable LHOS stope shapes and dilution (planned and unplanned) .................. 72
Figure 15.3: The Minesight™ mineral resource model used to generate the underground mining resources (no cut-off). .......................................................................................................................................................................... 73
Figure 15.4: Potential mining zones above a 0.35% cut-off (light blue zones) ......................................................................... 74
Figure 15.5: Underground mining resource zones used for mine design and economic analysis (Looking west and Zone 8 is offset to the west in front of Zone 4) ........................................................................................................ 75
Figure 16.1: Cross section of the Grey River deposit illustrating the typical dip of mineralization ............................................ 78
Figure 16.2: The proposed longhole open stoping mining method (Atlas Copco) .................................................................... 79
Figure 16.3: Relationship between tpd mined and the deposit vertical tonnes per meter (McCarthy, 1993) ............................ 80
Figure 16.4: Conceptual mine development layout (looking northwest with no scale) ............................................................. 81
Figure 16.5: Typical main level plan ......................................................................................................................................... 83
Figure 17.1: Isometric view of the Grey River project site infrastructure and underground mine workings (no scale) .............. 87
Figure 20.1: Canadian underground mining cost model data (MineCost 2009) ....................................................................... 95
Figure 20.2: Isometric view looking towards the east of the LOM mine development .............................................................. 98
Figure 21.1: Sensitivity of the project NPV to changes to the key base case parameters ...................................................... 103
Figure 21.2: The sensitivity of project NPV to the metal price (base case at $16/lb) .............................................................. 104
Figure 25.1: Proposed drilling plan for the Grey River project ................................................................................................ 113
APPENDICES
APPENDIX A ASARCO Analytical Procedure
APPENDIX B Plant Flow Sheets
Feed Preparation
Spiral Plant, Tailings, Concentrate Handling
Paste Plant
APPENDIX C Preliminary Site Layout Plans
APPENDIX D Preliminary Pre-tax Cash Flow
Base Case - $16/lb
Spot Price - $21/lb

GREY RIVER PROJECT PRELIMINARY ECONOMIC ASSESSMENT
March 14, 2012 Project No. 1114390003-001-R-Rev1 1
1.0 SUMMARY Playfair Mining Ltd (Playfair) commissioned Golder Associates Limited (Golder) to produce an updated
National Instrument 43-101 compliant Preliminary Economic Assessment (PEA) for the Number 10 and
Number 6 veins on the Grey River Tungsten property.
The property consists of 154 claims owned by Playfair that have been grouped into one mineral license
(Number 015686M). The mineral license covers ground adjacent to the Local Service District of Grey River
(community of Grey River) on the south coast of Newfoundland. Granitic rocks underlie the northern part of the
claim group while amphibolites, quartz-mica schists, pelites and gneisses occupy the southern part. Younger
pegmatites cut all rock types and can be locally abundant. Quartz veins hosting the tungsten mineralization
commonly occupy a post-tectonic north to northeast trending fault orientation. Wolframite is the dominant
tungsten-bearing mineral within the Number 10 Vein although scheelite (a calcium tungstate) is present in minor
amounts.
The Number 10 Vein was discovered by a local prospector in the early-1950s. Later work done by the American
Smelting and Refining Company (ASARCO) consisted of diamond drilling, trenching, sampling and the
development of an underground adit. This work halted in 1970 when tungsten prices dropped. Playfair bought
the property in 2004 from South Coast Ventures and drilled 15 HQ size holes on the Number 6 and 10 Veins in
2006 and added an additional 10 holes in 2008 targeting the lower portion of the Number 10 Vein. Geological
mapping and sampling of other veins on the property accompanied the drilling.
A bulk sample was taken from one of the ASARCO trenches and submitted to SGS Lakefield Research Europe
for metallurgical tests. Insufficient work has been done to this stage to develop a specific flowsheet for the
deposit. Further metallurgical testwork is required to demonstrate that an acceptable grade concentrate at an
acceptable metallurgical recovery can be achieved. There is a potential upside to the metallurgical results that
have been completed to date, especially in terms of maximizing the mass pull to a 65% WO3 concentrate.
However, this must be demonstrated in the next phase of testwork.
During the data validation process and as part of the exploratory data analysis (EDA), a marked difference in the
grade distribution between the historical data and the newer drill results was observed. Playfair assays
generally returned lower WO3 values. The difference is currently assumed to be related to the analytical
procedure but needs to be evaluated by Playfair.
All indicated blocks in the resource were downgraded due to the lack of original assay certificates for the
underground sampling, the difference in grade between the historical data and the newer Playfair data and the
difficulty in capturing a representative sample with the small historical EX size drill core.
At the 0.2% Wo3 cut-off and excluding all mineralization grading less than 0.2% WO3 over a 1.0 minimum mining
width, the updated undiluted mineral inventory indicated 1.2 million tonnes of Inferred mineralization grading
0.730% WO3 containing 18.8 million pounds of tungsten trioxide or 853,000 metric tonne units (MTU). The bulk
of this tonnage is in the Number 10 Vein which contained an Inferred mineral inventory of 1.06 million tonnes
grading at 0.760% WO3 for a total of 804,800 metric tonne units of tungsten trioxide.
The complete undiluted mineral inventory was exported to Golder's Engineering team for further economic
assessment.

GREY RIVER PROJECT PRELIMINARY ECONOMIC ASSESSMENT
March 14, 2012 Project No. 1114390003-001-R-Rev1 2
The assessment of environmental and socio-economic considerations is preliminary at this stage and will require
further study and development as project details and additional regional and site details become available.
Grey River is proposed as a low-tonnage, high grade operation, with a relatively free-milling ore, shown to be
amenable to gravity separation methods, producing a potential concentrate of 60% with a tungsten recovery of
75%. A typical gravity/flotation-based plant processing material such as at Grey River would generally obtain
between 85% to 92% recovery to a 65% to 70% concentrate. For this study a recovery of 85% to a
65% concentrate grade was assumed.
The underground mining resource is estimated to be 1,268,306 tonnes at a grade of 0.524% WO3 using a
minimum mining width of 2 m and 0.35% WO3% cut-off grade and a blasthole open stoping mining method with
pastefill. With about 2,400 tonnes per vertical meter of underground mining resource a 400 tpd operation is
proposed at this level of engineering study. Using the base case economic parameters the pre-tax cash flow is
estimated to be positive at $15.5 million over a mine life of about 9 years (price of $355 per MTU or $16/lb). The
net present value for the base case using a 5% discount rate is $2.9 million. The project would generate a NPV
(5%) of $47 million at an IRR of 27% at the current metal price of around $440 per MTU ($21 per lb)
(at December 2011). The current size of the underground mining resource at Grey River limits the potential
production rate and annual cash flow. To achieve higher production rates the deposit strike length needs to be
longer but that would also necessitate additional decline, level and ventilation development thus increasing
pre-production capital costs.
All of the resources used to develop the underground mining resource in this study are in the Inferred category.
The Inferred mineral resources are considered too speculative geologically to have the economic considerations
applied to them that would enable them to be categorized as mineral reserves, and there is no certainty that this
preliminary economic assessment will be realized. In order to develop mineral reserves for the
Grey River Project as part of a pre-feasibility study the majority of Inferred mineral resources, and all of the
underground mining resource as defined here, will have to be upgraded to the Indicated category.
No technical fatal flaws have been identified at this preliminary stage of study for the Grey River property.

GREY RIVER PROJECT PRELIMINARY ECONOMIC ASSESSMENT
March 14, 2012 Project No. 1114390003-001-R-Rev1 3
2.0 INTRODUCTION The Grey River Tungsten property is located on the south coast of Newfoundland adjacent to the community of
Grey River. The property consists of one mineral licence (Number 12723M) held by Playfair Mining Ltd. of
Vancouver, British Columbia, Canada. All of the claims within the licence (142 in all) are in good standing with
excess credits sufficient for renewal until September 25, 2013. The tungsten deposit of interest is known as the
Number 10 Vein and it is exposed in the eastern part of map sheet NTS 11P/11 (Ramea).
Tungsten mineralization was discovered on the property in 1954. Between 1954 and 1970 the ASARCO
explored the Number 10 Vein using surface trenching, sampling and assaying techniques followed by surface
diamond drilling and the establishment of 1703.5 metres (m) of underground workings. ASARCO also sampled
25 underground raises.
An in-house historical resource of 473,000 tonnes grading 0.97% WO3 was estimated by ASARCO for the
mineralization above the adit level of the Number 10 Vein. This historical estimate pre-dates the requirements of
NI 43-101 and therefore it is not compliant with NI 43-101 and it should not be relied upon.
A diamond drilling program on the Number 10 Vein was carried out by Playfair in the summer of 2006. Sixteen
HQ holes (37 millimetres (mm) core diameter) were completed for a total of 2922 m. Twelve of these holes were
designed to replicate the results of the historic ASARCO drilling while the remaining four tested the exploration
potential of the deposit.
A resource estimate was produced by Wardrop on June 2007 (Wardrop 2007) incorporating the result of the
2006 drill program. The NI43-101 compliant resources reported 852,000 tonnes of Inferred resources
grading 0.858% WO3 at a 0.2% WO3 cut-off grade. The resource estimate was authored by
Christopher Moreton, P.Geo. and the resource reported tonnages and grade at vein width with no dilution added.
The Wardrop 2007 resources were subsequently used in a PEA study titled, Preliminary Economic Assessment
of the Grey River Property, authored by Christopher Moreton P.Geo., Wardrop, David Sprott, P.Eng.
Golder Associates Limited (Golder) and Andrew Bamber P.Eng., Minesense Technologies Limited, and dated
January 15, 2008 (Golder 2008). Golder reported an underground mining resource of 901,911 tonnes at
0.66% WO3 determined from the Wardrop 2007 estimate. Golder used a longhole open stoping mining method
with a 0.4% WO3 cut-off and a minimum mining width of 2 meters.
In the summer 2008, Playfair added an additional 10 holes amounting to 3854 meter of NQ core drilling. All
holes targeting the extension of the Number 10 Vein below the adit level.
In 2011, Playfair commissioned Golder to produce an updated Preliminary Economic Assessment
(Scoping Study) on the Grey River property. The data from the 2008 program, as well as that from the historical
programs, is used in the current report to estimate a NI 43-101 compliant underground mining resource for
Grey River.

GREY RIVER PROJECT PRELIMINARY ECONOMIC ASSESSMENT
March 14, 2012 Project No. 1114390003-001-R-Rev1 4
2.1 Terms of Reference Golder Associates Ltd. (Golder) and Desautels Geoscience Ltd. (DGL) were retained by Playfair Mining Ltd. to
complete an updated resource estimate and to update the Preliminary Economic Assessment (Scoping Study) of
the Grey River property that is compliant with National Instrument 43-101 (NI 43-101).
The persons taking responsibility for specific sections of this report, and the extent of their responsibility for the
purposes of NI 43-101 are shown in Table 2-1.
Table 2-1: Qualified Person Responsibilities for Various Sections of Report
Responsible Person
Independent QP
Company Primary Area of Responsibility
Sections of Responsibility
Pierre Desautels,
P.Geo. Yes
Desautels Geoscience Ltd.
Site visit, resource estimate, geological sections
Inputs to Sections 1.0 to3.0, Sections 4.0 to 12.0, 14, 22 and Sections 24.1 and 25.1
David Sprott, P.Eng.
Yes Golder Associates Limited
Study compilation, mine design, mining costs, mine and site capital costs, underground mining resource, economic analysis
Inputs to Sections 1.0 to 3.0 and 16.5 Sections 15, 16, 17, 18, 20 (except 20.1.2 and 20.2.3), 21, 24.2 and 25.2.
Andrew Bamber, P.Eng.
Yes Minesense Technologies Limited
Metallurgy, processing, plants and associated costs
Inputs to Section 1.0 and 16.5, Section 13.0, 20.1.2, 20.2.3, 24.3 and 25.3.

GREY RIVER PROJECT PRELIMINARY ECONOMIC ASSESSMENT
March 14, 2012 Project No. 1114390003-001-R-Rev1 5
3.0 RELIANCE ON OTHER EXPERTS
3.1 Environmental and Legal Neither Golder nor DGL have verified the legal status or legal title of any of the claims and has not verified the
legality of any underlying agreements for the subject property.
Michael Moore, P.Geo. of Playfair and manager of the exploration program provided input to Sections 4.0 and
11.0. The Environmental and Socio-economic considerations presented in Sections 19.0, 24.4 and 25.4 rely on
work done by Bruce Bennett of Stantec. Mr. Bennett visited the Grey River project site in 2007.
3.2 Marketing Marketing information in this report (Section 18.0) relies on information by Roskill Information Services Ltd. titled
“Tungsten: Market Outlook to 2016 (10th edition)” (August 2011) (www.roskill.com). A specific marketing study
was not done for this report.

GREY RIVER PROJECT PRELIMINARY ECONOMIC ASSESSMENT
March 14, 2012 Project No. 1114390003-001-R-Rev1 6
4.0 PROPERTY DESCRIPTION AND LOCATION The property is located adjacent to the fishing community of Grey River on the south coast of Newfoundland
(Figure 4.1). The town of Grey River is situated at approximately latitude 47o34’N and longitude 57 o6’W.
Figure 4.1: Location map for the Grey River Tungsten Property
The Grey River Tungsten property consists of 154 contiguous mining claims grouped into one mineral license
(015686M) held by Playfair through a purchase agreement with South Coast Ventures. Since December 2008,
this license replaces license 013436M and license 012723M. A review of the Newfoundland and Labrador
government website by DGL shows that the mineral license is in good standing with the next report of work due
November 24, 2011 and a renewal date of September 25, 2015. The mineral license overlaps the boundary of
NTS map sheets 11P/10 and 11P/11 (Figure 4.2).

GREY RIVER PROJECT PRELIMINARY ECONOMIC ASSESSMENT
March 14, 2012 Project No. 1114390003-001-R-Rev1 7
Figure 4.2: Playfair Mining Ltd. Licence 015686M

GREY RIVER PROJECT PRELIMINARY ECONOMIC ASSESSMENT
March 14, 2012 Project No. 1114390003-001-R-Rev1 8
5.0 ACCESSIBILITY, CLIMATE, LOCAL RESOURCES, INFRASTRUCTURE AND PHYSIOGRAPHY
5.1 Accessibility and Infrastructure Grey River has a daily coastal boat service and a bi-weekly car ferry service from Burgeo, Newfoundland.
Burgeo is a port town located approximately 40 kilometres (km) to the west of the property and is connected to
the Trans Canada Highway by a paved road. The town of Stephenville is located approximately 130 km
northwest of Burgeo. Both Stephenville and Deer Lake, located 170 km north of Burgeo, have airport facilities
while Pasadena (20 km south of Deer Lake) is the base for two helicopter companies.
The mineral claims can be reached on foot from Grey River although a helicopter is the preferred mode of
transport due to the rugged terrain in vicinity of the claims. The portal to the adit of the Number 10 Vein
(developed by ASARCO) is accessible on foot using a short gravel trail from Grey River. The elevation of the
portal is approximately 13 m (42 feet) above sea level.
ASARCO engineering drawings indicate that some infrastructure was designed in anticipation of mining the
Number 10 Vein. None of this infrastructure was visible during the site visit except for a possible waste rock pad
outside the portal. Local dock facilities exist at Grey River although it is speculated that these will need to be
expanded when mining commences.
Grey River has a diesel generator that supplies electricity, internet service through a satellite link as well as a
wharf owned by the Government of Newfoundland and Labrador.
5.2 Physiography, Elevation and Climate The central part of the Grey River Tungsten property has an average elevation of 245 m (800 feet) above sea
level (ASL). Topographic relief within the immediate vicinity of the Number 10 Vein varies from 200 to 275 m
(650 to 900 feet) ASL. Sheer cliffs drop off directly to the sea level along the south and east sides of the
property creating numerous hanging river valleys.
Scrub brush is intermixed with up to 60% outcrop in the higher elevations of the property while larger trees tend
to be restricted to the valleys; the steep cliffs are virtually 100% outcrop. Overburden is less than one to five
meters deep and it consists of various types of glacial tills.
The local climate for Grey River is temperate maritime (typical of the south coast of the island of Newfoundland).
In general, the summers are mild although there are often days of thick fog that tend to moderate the
temperature (highs of only 16°C are typical). The winters are cold but not as severe as mainland Canada with
temperatures typically around the freezing mark (annual minimum temperature of -5.9°C). In contrast to the
moderate temperatures the annual precipitation averages 1310 mm and this tends to fall between the months of
July and November.

GREY RIVER PROJECT PRELIMINARY ECONOMIC ASSESSMENT
March 14, 2012 Project No. 1114390003-001-R-Rev1 9
6.0 HISTORY This section is taken directly from two reports supplied by Playfair (Dearin and Harris, 2006; Dadson, 2007).
The first mineral exploration in the Grey River area was carried out by the Buchans Mining Company Ltd. in
1955. Subsequent exploration by ASARCO (between 1957 and 1970) included: surface geological mapping,
trenching and diamond drilling on five veins. In addition, an exploration adit was driven by ASARCO along the
Number10 Vein which permitted the development of 20 raises and the collection of a 275 ton bulk sample for
metallurgical tests by both ASARCO and CANMET. During these programs the only element of interest was
tungsten.
ASARCO planned to produce tungsten from the adit in 1970 but this was postponed due to a drop in world
tungsten prices. After 1970, the property changed hands several times but no further work was done. The
claims expired in June 2000 and were map staked by South Coast Ventures after the Newfoundland government
released the ground for staking.
Summarized below (Table 6-1) is a brief history of geological and exploration work carried out since 1955.
Table 6-1: Work History
Pre-1955 Tungsten mineralization was apparently discovered by a Mr. Rose of Grey River
some years previously and was submitted to the Buchans Mining Company Ltd. in
1954-55 for analysis.
1955 July to October, a six man party carried out reconnaissance mapping and
prospecting immediately north of Grey River and located numerous quartz-tungsten veins cutting granite gneiss. Trenching and sampling along the two more significant veins (Vein 10 and Vein 6) was carried out.
1956 June to October, a 16 man crew carried out mapping, prospecting, plane-table
surveying, trenching and detailed trench sampling on Veins 10 and 6. This work formed the basis for future programs.
1957 A 25 man crew carried out a program of detailed mapping, trenching and sampling
and defined the extent and grades of Veins 10 and 6. Twelve EX core holes (5913 feet) were drilled along Vein 10. Eleven of these holes in Vein 10 intersected ‘ore grade’ WO3 values. A few parallel veins carry WO3 values.
1958 – 1964 No work done on tungsten veins (Holes GR-17 to GR-19 were molybdenum exploration holes drilled away from the known veins).
1965 Seven EX core holes (GR-20 to GR-26 totalling 3078 feet) were drilled at the
northern extremity of Vein 10 and 6 supposedly to intersect the veins near sea level in preparation for the proposed adit development.
1966
Two EX core holes (GR-27 and GR-28 totalling 1381 feet) were drilled on the northern section of Vein 10. Vein 10 extended an additional 1,200 feet to the north where it pinches out about 5,300 feet from the adit portal. WO3 values appear to die out at the northern limit of the vein.
March 30: government authorization is approved for the driving of an adit. Development expenditure of $450,000 is approved for this work.
May: temporary camp set up. Topographic and triangulation survey network setup.
October: Bunkhouse and mess hall built in Grey River. A 38-foot long timber portal and 54 feet of adit is advanced by December 15.

GREY RIVER PROJECT PRELIMINARY ECONOMIC ASSESSMENT
March 14, 2012 Project No. 1114390003-001-R-Rev1 10
1967
January 30 to December. 20: the adit is advanced by 1,292 feet. Seven underground core test holes (TH-1 to TH-7 totalling 582 feet) are drilled.
Generator building, repair shop, dry, dumping trestle, magazine and cap house completed. Cribbed wharf is started at the adit site. A mine lease application of 6.61 miles is applied for and boundaries are surveyed.
The Continental Ore Corp assessed the silica unit in the Gulch Cove area where silica values range from 96.98 to 99.21%.
1968
January 4 to December 16: the adit is advanced by 1,973 feet.
The adit wharf, compressor house and 240 feet of timbered dumping trestle were built. Six underground test holes (TH-8 to TH-13) are drilled horizontally. Nine adit core holes (GR-29 to GR-37) are drilled horizontally in the adit.
1969
Jan 4 to August 20: the adit is advanced 1,952 feet for a total adit length of 5,271 feet. The adit stopped as the tungsten-rich vein died out into a parallel fault zone.
Four underground EX core holes (GR-38 to GR-41 totalling 1,132 feet) were drilled from the crosscuts downward to test the extent of Vein 10 below the adit (results unknown).
Prior to May 15, eight raises averaging 27 feet high were driven for bulk sampling purposes along 820 feet of the southern part of Vein 10 (Section Lines 7950N to 8700N). Results ranged from 0.82% to 1.30% WO3% with an average value of 1.07% WO3.
Seven underground EX core holes (GR-42 to GR-48 totalling 680 feet) drilled. All collared in the adit face around Section line 8960N and they were drilled to locate the vein in advance of the adit. One section of Vein 10 was sampled twice by back-channel samples and once by face chip sampling. Results were comparable. Vein 10 was also re-sampled on surface in places by 12’ by 12’ channels (locations and results are unknown).
Seven surface EX drill holes (GR-49 to GR-55 totalling 1,643 feet) tested for tungsten in a series of parallel structures west of Veins 10 and 6.
1970
January to August: no exploration or development work is carried out.
September 5 to October 6: 25 six foot long raises were cut at 50 foot intervals along the vein. All broken rock, totalling 274.5 tons was carefully collected and shipped to the Mines Branch metallurgical Laboratory in Ottawa for detailed pilot plant studies.
1971 Pilot plant test work is completed at the Ottawa lab.
1976 Newfoundland Department of Mines and Energy assessed 12 million short tons of
the silica unit by drilling. An average grade of 95.5% SiO2 and 1.9% Al2O3 was quoted.
1979
September 10-13: channel sampling along the walls of four crosscuts ranging from 89 to 99 feet long. Some 81 channels each 5 feet long checked for low level tungsten values adjacent and away from Vein 10. Most samples are low but crosscut 8000N had one five foot assay of 1.4% WO3 while crosscut 8400N had an assay of 0.40%. No follow-up work has been done.
A low grade resource of 25 million tons grading 0.1 to 0.2% WO3 was postulated from this work and mapping in the southern end of the adit. This historic resource pre-dates NI 43-101 and should not be relied upon.
1985 – 1986 BP-Selco exploring for gold, locate values >1 g/t Au, with high Bi and Sb in the “quartz vein-silica body” on the eastern claims.

GREY RIVER PROJECT PRELIMINARY ECONOMIC ASSESSMENT
March 14, 2012 Project No. 1114390003-001-R-Rev1 11
1995 – 1996 Several Grey River prospectors located base metal rich quartz veins with anomalous
precious metals, moderate to high base metals but low tungsten values. This first independent-type exploration indicated the existence of a separate phase of veining with significant Au and Ag values.
1996 – 1997
Copper Hill Resources and Pearl Resources Ltd. of St. John’s, Newfoundland option the prospector’s claims and sample a number of newly discovered quartz veins. A number of grab samples on the current claims return high Au, Ag +/- Cu, Pb, Zn plus anomalous Bi. Copper Hill carries out an airborne EM and magnetic survey over a large area including the current claims area.
2003 – 2004 The claims expire due to a lack of funding. South Coast Ventures immediately
stakes the current claims covering the high-grade Au-Ag rock samples. South Coast Ventures completes the first digital compilation of the 1960’s Asarco work, the BP work and the 1996-97 rock sampling results.
2004 The property was sold to Playfair Mining Ltd. in 2004. During 2003-05 Fortis
GeoServices Inc. compiled the 1986 to 2002 assessment work listed above and added it to the earlier digital compilation of work on the tungsten veins.
2006 Playfair Mining Ltd. completes 16 drill holes on the Number 10 and 6 veins to confirm grades and fill-in previously widely spaced drilling.
2007 Wardrop Engineering completes NI 43-101 inferred resource calculation on
Number 10 Vein (852,000 tonnes of 0.858% WO3 @ 0.2% cut off) for Playfair Mining Ltd.
2008 Playfair Mining Ltd. completes 10 drill holes on the Number 10 and 6 veins to
delineate additional tonnage and confirm Number 6 Vein. Golder & Assoc. completed a preliminary economic assessment on Number 10 Vein
6.1 Historical Resource Estimate ASARCO estimated in 1970 a proven and probable "reserve" in one vein (the Number 10 Vein) using data from
surface trenching and drilling as well as underground drifting, raising and bulk sampling. These figures are for
the volume of rock between the adit level (40 feet ASL) and surface. Historical literature indicated a mineable,
diluted "reserves" of 473,000 short? Tons grading 0.97% WO3.
Golder and Playfair do not treat the "reserve" discussed in this section as current mineral resources or reserves.
These estimates are historical in nature and are non-compliant with NI 43-101. They are discussed here purely
for a record. These estimates are no longer relevant as they are being replaced by the NI 43-101
Mineral Resource estimate presented in this report.

GREY RIVER PROJECT PRELIMINARY ECONOMIC ASSESSMENT
March 14, 2012 Project No. 1114390003-001-R-Rev1 12
7.0 GEOLOGICAL SETTING AND MINERALIZATION The project area is underlain by the Silurian-Devonian Burgeo Intrusive Suite and an east – west trending belt of Precambrian metamorphic rocks referred to as the Grey River Enclave. The contact between the intrusion in the north and the metamorphic rocks in the south is marked by a mylonitic shear zone. The Grey River Enclave typically consists of amphibolites, quartz-mica schists, pelites and gneisses. The schists and gneisses are believed to be derived from quartzites, sandstones, felsic tuffs and gabbro (relicts of these rock types are locally observed). Any bedding, along with the metamorphic foliation/banding, generally strikes E-W and dips steeply to the north. Minor post-tectonic ultramafic or mafic plugs and dikes intrude the metasedimentary rocks.
The Devonian Francois Granite intrudes the Enclave to the east of the property. Pegmatites cut all rock types
and can be locally abundant. Three prominent fault sets have been documented: an E-W set is the most visible
and it brings metasedimentary rocks into contact (which is typically mylonitic) with the granitic rocks. Quartz
veins hosting the tungsten mineralization commonly occupy a younger north to northeast trending fault set.
Figure 7.1 is a recent geological compilation showing the mineralized veins occurring directly north of Grey River
within the boundaries of the old ASARCO surface grid (the claim outline on this map is out of date).
7.1 General Geology and Structure The following description is modified from a report written by Dearin and Harris (2006):
“The area is divided into two main zones, metamorphosed sediments in the south and granites in the north. The sediments, which have been subjected to both regional and local metamorphism, strike east-west and dip steeply to the north. They represent a transition zone grading from high quartz members at the top to the more argillaceous members at the base. The upper members consist of quartzites, grits, greywackes, hornfels, slates and narrow limestone bands. The lower zone makes up the bulk of the formation and is composed of quartz-mica schists and hornblende gneisses. Cutting these sediments are several small ultrabasic plugs, narrow basic dykes and a great number of aplitic, pegmatitic and granitic dykes. Along the south margin of the sediments the granitic dykes and pegmatites constitute over 50% of the exposed outcrops. The granite bordering the sediments to the north is a coarse-grained pink variety with a low mafic content. The contact zone is highly contaminated with partially digested sedimentary remnants.”
The metamorphic package consists of a unit of felsic tuff, (quartz–sericite schist) to the north and interlayered pelitic sediments and quartzites to the south. Amphibolite schist and meta-gabbro are evident locally, especially to the southwest. A 10 m to 400 m wide siliceous unit trends through the property from about 2.5 km west of Gulch Cove to the east end. This unit has previously been mapped as quartzite and/or quartz vein. Granular quartzite is evident locally but the unit is mainly fine-grained banded quartz with some white mica and >1% magnetite. Shearing is common and sheared pelite and mafic dyke occurs between silica ‘lenses’. The unit likely represents a sheared quartzite but some hydrothermal silicification and/or quartz veining may be present.
The most prominent structural feature of the Grey River area is faulting. It occurs in the metamorphic and igneous rocks and is characterised by both normal and reverse senses of movement. The faults in the metamorphic rocks can be grouped into two main sets: an east-west set parallel to the schistosity and a south-east set cross-cutting the schistosity. A third set occurs only in the granites. Arising from this set of faults is a prominent fissure system of tensional origin striking north to northeast. These tension fissures act as the structural control for the tungsten veins. In general there is an absence of major movement along these fissures.

GREY RIVER PROJECT PRELIMINARY ECONOMIC ASSESSMENT
March 14, 2012 Project No. 1114390003-001-R-Rev1 13
7.2 Mineralization – Tungsten Veins The Grey River tungsten veins are typical fluorite-rich, wolframite-quartz greisen vein deposits. Wolframite is the
dominant tungsten-bearing mineral although a number of small scheelite occurrences are known.
The quartz-wolframite veins cross-cut the metamorphic rocks but are also exposed within the granitic rocks to
the north. Over 300 veins and lenses have been mapped on surface though only two or three have been
aggressively evaluated. One of these, the Number 10 Vein, varies in width from 0.9 m to over 4.3 m, with
average widths around 1.2 m (based on underground mapping). The Number 10 Vein has a strike length of at
least 1600 m with the known mineralized shoot having a length of around 775 m. The vein is connected to the
exposed mineralized veins on the surface (giving a minimum 240 m down-dip length) and it appears to increase
in width with depth.
Higgins & Swanson (1956) give a more detailed summary on the mineralization based on their mapping and
detailed observations of the mineralized veins exposed in trenches:
“Tungsten bearing veins of economic interest occur in the area shaded in red as shown on plan No. 2150. In
this area several hundred veins have been found of which 300 were mapped and 300 others examined. The
bulk of these veins are small lenses 40 to 50 feet in length and from one to two inches in width. Nine veins, two
feet or more in width were stripped and sampled and of these only numbers 6 and 10 appear to be economically
significant.”
“The narrow quartz veins tend to hold a uniform thickness throughout their length while wide veins are
characterized by quite irregular widths. The vein walls are sharp with a band of phlogopite mica separating the
veins from the country rock.”
”Fluorite is the most abundant non-metallic mineral (other than quartz) in the veins and may, in some cases run
as high as one percent. Other non-metallic gangue minerals noted are apatite, beryl, scapolite, orthoclase,
albite, muscovite and vesuvianite. Pyrite is the most abundant sulphide and, in the major veins, may account for
over one percent. Chalcopyrite occurs sporadically in the wider veins but overall they will average less than
0.1% copper. Other sulphides noted were stibnite, molybdenite, arsenopyrite, sphalerite, galena and
bismuthinite.”
“Wolframite (WO3) is the only important mineral in the veins of the Grey River area. The variety is
manganese-rich with the ratio of MnO to FeO, in one sampled analyzed, being 15 to 9
(Note: this would be a huebnerite type from the wolframite mineral series (Fe,Mn)WO4 ranging from FeWO4
(ferberite) to MnWO4 (huebnerite). The wolframite crystals are coarse grained and occur as irregular masses,
well-defined monoclinic crystals or in radiating groups of bladed crystals. Scheelite is present but only in small
quantities. It often replaces wolframite along the crystal surfaces and cleavage planes. Secondary minerals are
fairly common on the exposed surfaces of the veins; limonite from the alteration of pyrite, tungstite secondary
after scheelite, powellite after molybdenite and manganese hydroxides.”
“Early in the field season a zonal arrangement of the mineralization was apparent; particularly the
wolframite-molybdenite distribution. After several hundred veins had been examined the distribution of the
wolframite, scheelite, molybdenite, chalcopyrite and galena were plotted and zonal curves calculated”
(note that this data has never been updated and the various mineral distributions
[tungsten, molybdenum, chalcopyrite in addition to relatively newly discovered gold mineralization] are now

GREY RIVER PROJECT PRELIMINARY ECONOMIC ASSESSMENT
March 14, 2012 Project No. 1114390003-001-R-Rev1 14
known to occur at significant distances from this 1956-era plot). “Pyrite, which is the most abundant metallic
mineral, occurs everywhere and therefore has not been included in the zoning. It can be seen from the sketch
that clear-cut zoning based on the temperature of formation of different minerals is not well defined as individual
distribution curves cross each other. However, it appears that the high temperature mineralization decreases
away from the centre of the mineralized area taken to be just west of vein number 10. The zonal arrangement
also suggests that the mineralization is not directly related to the northern granite but to a source directly below
the mineralized area.”
7.3 Number 10 Vein “This is by far the most important vein found in the area. It occurs in a three thousand foot long fissure and has
been exposed by intermittent trenches for approximately 2,000 feet. One hundred and sixteen channel samples
were taken from the vein on the exposed sections between coordinates N593 & N1920”.
7.4 Number 6 Vein “This vein lies two thousand feet northeast of vein number 10. Two sections of the vein were stripped; a 50 foot
section and a 125 foot section separated by a gap of forty feet.”
7.5 Other Gold and Silver Rich Veins During 1956 ASARCO located a quartz vein with high gold values (although no tungsten) in the Dog Cove
Brook-Beaver Brook vicinity approximately 3.5 km north of Grey River (Bahyrycz, 1956). This showing, referred
to as the Galena Vein Number 1, occurs in a shear zone cutting granitic rocks. Channel sampling of the vein
returned values of up to 2.90 ounces per tonne gold (oz/t Au), 4.2 ounces per tonne silver (oz/t Ag), and
averages of less than 0.5% copper (Cu), 15% lead (Pb) and 3% zinc (Zn) over a vein width of 2’ 2”.
Later re-sampling of this vein by ASARCO-Abitibi Price returned gold values of 0.74 oz/t Au.
A graduate thesis by Gray (1958) noted occurrences of galena mineralization (with significant amounts of silver,
gold and bismuth) in quartz veins cutting granitic rocks immediately east of Long Pond. No further exploration
work was ever reported in this area. During 1995-97 and 2001 local prospectors located a number of high-grade
sulphide-rich quartz veins, with assays exceeding 30 grams per tonne gold (g /t Au), cutting intrusive rocks
immediately north of Long Pond.
Between 1995 and 1997 Grey River prospectors located sulphide-rich (10 to 15%) quartz veins west and south
of Grey River. Precious metal values exceeded 9 to 21 g /t Au and 200 to 332 grams per tonne silver (g/t Ag)
with high bismuth (greater than 440 parts per million) and anomalous to high base metal values (Jacobs, 1997).
The following is modified from Jacobs (1997) who summarized the rock sampling results on and adjacent to the
property as follows:
“Assays for gold showed slightly anomalous to highly anomalous results, including ten samples in the range of
17 parts per billion (ppb) to 251 ppb Au, two samples between 541 ppb (GR-2) and 755 ppb Au (GR-29) and
four samples with values of 1,530 ppb (GR-9), 9,008 ppb (GR-26), 13,280 ppb (GR-24) and 21,355 ppb Au
(GR-27). All anomalous gold values showed a general correlation with either of the base metals (Cu, Pb, Zn)
and/or Ag; the best values, however, corresponded with the higher Pb and Ag values.”

GREY RIVER PROJECT PRELIMINARY ECONOMIC ASSESSMENT
March 14, 2012 Project No. 1114390003-001-R-Rev1 15
Jacobs cautions that conclusions drawn on sample results, regarding maximum values and element correlations,
are premature, as complete assay determinations have not yet been made for many samples. As well, assay
correlations, in this sense, have only limited value due to the fact that most samples are taken from veins where
mineralization is often inconsistent and of a generally localized nature.
The Grey River Tungsten Property contains multiple tungsten-rich quartz veins within undeformed, linear
fractures. These fractures cross-cut the local metasedimentary and metavolcanic rocks and they appear to be
spatially (but not necessarily genetically) associated with the northern granitic suite. All of the tungsten-carrying
veins are oriented north-northeast. The better known mineralization is restricted to two veins called the
Number 6 and Number 10 Veins.
Wolframite and scheelite are the dominant tungsten-bearing minerals in the veins although scheelite is better
developed in the northern sections of the property where limey units are more common. Typically, wolframite
crystals occur as coarse-grained, steel grey to black coloured clusters and disseminations within white-coloured
quartz veining. Pyrite, pyrrhotite, chalcopyrite, bismuthinite, molybdenite, galena and fluorite may also be
present. Sericitic alteration of wallrock is common on the hanging wall side of the Number 10 Vein and country
rock inclusions have also been documented.
To date, the genetic model for the tungsten veins at Grey River is poorly understood. Although the deposits are
in discrete veins, and appear to be spatially associated with the northern granitoids, there lacks conclusive
evidence that the veins are linked to the exposed granite.

GREY RIVER PROJECT PRELIMINARY ECONOMIC ASSESSMENT
March 14, 2012 Project No. 1114390003-001-R-Rev1 16
8.0 DEPOSIT TYPE The Grey River Tungsten Property contains multiple tungsten-rich quartz veins within undeformed, linear
fractures. These fractures cross-cut the local metasedimentary and metavolcanic rocks and they appear to be
spatially (but not necessarily genetically) associated with the northern granitic suite. All of the tungsten-carrying
veins are oriented north-northeast. The better known mineralization is restricted to two veins called the
Number 6 and Number 10 Veins. Figure 8.1 shows the Grey River regional geology compilation.

GREY RIVER PROJECT PRELIMINARY ECONOMIC ASSESSMENT
March 14, 2012 Project No. 1114390003-001-R-Rev1 17
Figure 8.1: Grey River Regional Geology Deposit Types
Wolframite and scheelite are the dominant tungsten-bearing minerals in the veins although scheelite is better developed in the northern sections of the
property where limey units are more common. Typically, wolframite crystals occur as coarse-grained, steel grey to black coloured clusters and
disseminations within white-coloured quartz veining. Pyrite, pyrrhotite, chalcopyrite, bismuthinite, molybdenite, galena and fluorite may also be present.
Sericitic alteration of wallrock is common on the hanging wall side of the Number 10 Vein and country rock inclusions have also been documented.
To date, the genetic model for the tungsten veins at Grey River is poorly understood. Although the deposits are in discrete veins, and appear to be
spatially associated with the northern granitoids, there lacks conclusive evidence that the veins are linked to the exposed granite.

GREY RIVER PROJECT PRELIMINARY ECONOMIC ASSESSMENT
March 14, 2012 Project No. 1114390003-001-R-Rev1 18
9.0 EXPLORATION
9.1 Summer 2006 In 2006, Playfair completed 16 HQ size holes (including one wedge hole). Of those, twelve holes targeted the
Number 10 Vein and four holes targeted the Number 6 Vein. The programs main goal was to confirm the grade
seen in the historical drill holes. In addition, Playfair re-sampled the ASARCO trenches on the Number 10 Vein
(119 samples taken).
9.1.1 Adit
A brief inspection (by Playfair personnel) of the adit on the Number 10 Vein was carried out during the 2006 drill
program and re-inspected during the 2011 site visit. Figure 9.1 shows a selection of photographs of the adit
taken during the most recent site visit by the author.
A generator powering an underground fan is still in place. Playfair replaced the galvanized metal ventilation
ducking with modern yellow polyethylene vent tubing that is now in need of minor repair. The adit is in
surprisingly good condition with only minor falls of loose material over most of its length with exception to the
fault area where a significant amount of loose material as accumulated on the drift floor. During the site visit, it
was deemed unsafe to proceed through this area without rehabilitation. ASARCO did not routinely rock bolt the
back of the drift but only supported selected areas as needed. The adit dimension is approximately 2.4 m by
2.4 m in size with a narrow gauge rail that appears in good condition.
The adit can be rehabilitated with some minor scaling, rock bolting and clean up. About one dozen rail cars, a
cache of sample drums and galvanized ducting remains in the workings.

GREY RIVER PROJECT PRELIMINARY ECONOMIC ASSESSMENT
March 14, 2012 Project No. 1114390003-001-R-Rev1 19
Adit entrance showing ventilation fan Access drift showing old rail cars
Narrow section of the No 10 vein showing ASARCO sample location
Bulk sample raise in No 10 Vein
Figure 9.1: Underground adit photographs

GREY RIVER PROJECT PRELIMINARY ECONOMIC ASSESSMENT
March 14, 2012 Project No. 1114390003-001-R-Rev1 20
9.2 Summer 2008 During the summer of 2008, Playfair completed an additional 10 NQ size holes targeting the Number 10 Vein
below the adit level.
Playfair also commissioned Yates and Woods Limited (Yates and Woods) of Cornerbrook, Newfoundland to
complete an accurate GPS survey of the Grey River Property. Yates and Woods conducted the survey using a
Topcon GB500 Base station and a Topcon Hyper Plus Rover. The initial static survey was carried out on
July 13, 2008, placing the Topcon GB 500 on point No. 2000 (on site). Yates and Woods surveyor traveled to
Ramea and placed the Topcon Hyper plus on Monument No. 89G6164 and recorded at five second intervals for
37 min 15 sec. The survey team then traveled to Monument No. 89G6162 and recorded at five second intervals
for 39 min 55 sec. The information collected was post processed later in the Topcon Tools Version 7.1.
All other points were surveyed using Topcon BG500 on point No. 2000 and standard RTK surveying practices
with Hyper Plus Rover on July 14 and July 19, 2008.
The historical drill holes were originally surveyed in a local mine grid coordinate system. The new detailed
survey allowed the correct placement of the historical holes in the NAD 27, Zone 21 coordinate system.
This work also allowed the geo-referencing and digitizing of a historical topographic map surveyed by
Buchans Mining Co. Ltd. and dated September 14, 1957 (Dwg No. 2251 scale 1"-200') by Alicia Korpach, GIS
specialist. With the digital map, 29 additional historical holes could now be added to the database, including
12 underground holes that were drilled by ASARCO in 1968 and 1969.

GREY RIVER PROJECT PRELIMINARY ECONOMIC ASSESSMENT
March 14, 2012 Project No. 1114390003-001-R-Rev1 21
10.0 DRILLING
10.1 Pre-1970 The drill campaign in the Grey River area was carried out by the Buchans Mining Company Ltd. in 1955, which
was followed by ASARCO between 1957 and 1970. With the exception of 13 test holes drilled from
underground (TH1 to TH13), a total of 55 holes were recovered from historical logs. Holes during that period
were drilled using coring equipment with no retrievable inner core barrel. Mostly EX (22.2 mm core) in size were
used for short holes or a combination of AX (28.5 mm core) followed by EX for the longer holes.
Core recovery data is available on the logs. Considering the size of the holes and the equipment used at the
time drilling was conducted, the core recovery appears to be moderate to good (> 75%) for the holes that were
reviewed and is consistent with drilling in competent rocks.
Although not indicated on all logs, the down survey instrument used on longer holes appears to be a Tropari
(from Pajari instruments Ltd.), which measure the azimuth and dip of the holes with a magnetic compass.
As shown in Table 10-1, thirteen historical holes were located in the field by Yates and Wood during the summer
2008 program. The remaining UTM coordinates for the holes were derived from the geo-referenced 1957
historical map or from a geo reference map of the ASARCO underground adit.

GREY RIVER PROJECT PRELIMINARY ECONOMIC ASSESSMENT
March 14, 2012 Project No. 1114390003-001-R-Rev1 22
Table 10-1: Pre 1970 Diamond Drill Hole Summary for Grey River Pre 1970
Hole Number UTM Coordinate Elevation
(m.) Azimuth/Dip
Length (m.)
Survey East North
DDH-? 492695.0 5271813.0 300.0 0 / -90 100.0 Map
DDH3?-45d 492693.6 5271815.1 244.4 0 / -90 100.0 Y and W
GR-1 492792.1 5271592.6 236.0 120 / -60 143.6 Map
GR-2 492605.8 5271292.3 270.7 120 / -57 136.3 Map
GR-3 492699.8 5271383.3 258.0 120 / -57 30.2 Map
GR-4 492763.5 5271482.8 263.2 120 / -56 18.3 Map
GR-5 492645.2 5271269.2 265.4 120 / -57 23.2 Map
GR-6 492733.8 5271500.1 262.5 120 / -57 107.0 Map
GR-7 492687.9 5271362.8 258.3 120 / -70 23.2 Map
GR-8 492668.1 5271400.8 262.0 120 / -58 96.9 Map
GR-9 492575.5 5271309.4 276.0 120 / -62.5 343.6 Map
GR-10 492628.3 5271559.5 262.5 120 / -60 354.2 Map
GR-11 492222.3 5271048.3 248.0 55 / -64 19.5 Map
GR-12 492006.8 5271099.5 276.0 90 / -45 26.8 Map
GR-13 492411.5 5271026.9 300.0 90 / -45 12.8 Map
GR-14 492493.0 5271069.6 260.0 110 / -45 190.5 Map
GR-15 493214.1 5271858.7 231.0 292 / -37 23.8 Map
GR-16 492748.3 5271619.0 237.7 120 / -79 335.6 Y and W
GR-17 491962.0 5270710.5 300.0 45 / -30 30.5 Map
GR-18 491923.4 5271201.6 300.0 45 / -40 30.5 Map
GR-19 491930.9 5271258.9 300.0 300 / -30 27.4 Map
GR-20 493250.7 5272034.5 242.6 83 / -60 53.9 Y and W
GR-21 493249.9 5272034.4 242.6 0 / -90 89.3 Y and W
GR-22 493152.9 5272038.3 264.3 90 / -65 183.5 Y and W
GR-23 493152.6 5272038.3 264.3 88 / -83 253.3 Y and W
GR-24 493089.7 5271830.1 265.9 93 / -60 136.9 Y and W
GR-25 493009.8 5271896.2 251.5 120 / -60 74.7 Y and W
GR-26 493009.2 5271896.5 251.4 0 / -90 146.6 Y and W
GR-27 492834.6 5271746.2 257.4 121 / -46 182.9 Y and W
GR-28 492834.2 5271746.5 257.6 121 / -70 238.1 Y and W
GR-29 492494.8 5270899.5 14.0 90 / 0 51.5 Adit
GR-30 492491.0 5270899.2 14.0 40 / 0 62.5 Adit

GREY RIVER PROJECT PRELIMINARY ECONOMIC ASSESSMENT
March 14, 2012 Project No. 1114390003-001-R-Rev1 23
Hole Number UTM Coordinate Elevation
(m.) Azimuth/Dip
Length (m.)
Survey East North
GR-31 492494.1 5270900.3 14.0 270 / 0 24.7 Adit
GR-32 492534.2 5271179.7 14.0 265.5 / 0 43.9 Adit
GR-33 492536.9 5271181.0 14.0 14 / 0 32.3 Adit
GR-34 492537.5 5271181.0 14.0 31 / 0 28.7 Adit
GR-35 492537.5 5271179.7 14.0 87 / 0 38.7 Adit
GR-36 492571.0 5271213.8 14.0 90 / 0 25.0 Adit
GR-37 492593.9 5271235.0 14.0 49 / 0 26.2 Adit
GR-38 492590.6 5271341.2 13.0 105.37 / -77 142.0 Adit
GR-39 492641.5 5271463.9 12.0 90 / -65 79.2 Adit
GR-40 492641.5 5271463.8 12.0 90 / -83 77.7 Adit
GR-41 492696.9 5271597.7 12.0 90 / -64.5 46.0 Adit
GR-42 492735.2 5271616.2 14.0 106 / 0 14.3 Adit
GR-43 492725.7 5271597.1 14.0 116 / 0 27.1 Adit
GR-44 492732.3 5271626.7 14.0 317 / 0 12.5 Adit
GR-45 492732.3 5271626.7 14.0 37 / 0 21.9 Adit
GR-46 492738.4 5271634.0 14.0 101 / 0 36.0 Adit
GR-49 492439.2 5271908.7 244.1 111 / -45 93.9 Map
GR-50 492137.4 5271878.3 244.1 115 / -45 75.9 Map
GR-51 492612.9 5271829.5 243.8 115 / -45 55.2 Map
GR-52 492612.9 5271829.5 243.8 115 / -65 61.0 Map
GR-53 492696.7 5271783.8 243.8 115 / -45 63.1 Map
GR-54 492481.4 5271529.9 291.9 115 / -45 61.0 Y and W
GR-55 492480.9 5271530.1 291.9 115 / -65 75.6 Y and W
Total Meter in Database 4,809
10.2 Playfair 2006 Playfair carried out a diamond drilling program on the Grey River Tungsten property in the summer of 2006.
Twelve holes, including one wedged hole, tested the Number 10 Vein while four other holes tested the Number 6
Vein to the north. Core was drilled to HQ (63.5 mm core) by Petro Drilling Co. Recovery was not indicated on
the Playfair logs but appears to be good to excellent (>85%) in the holes that were examined during the site visit.
Table 10-2 lists the 2006 collar location, length and drill direction. Down hole deviation surveys consisted of
tropary tests typically taken at the end of the hole.

GREY RIVER PROJECT PRELIMINARY ECONOMIC ASSESSMENT
March 14, 2012 Project No. 1114390003-001-R-Rev1 24
Table 10-2: 2006 Diamond Drill Hole Summary for Grey River
Hole Number UTM Coordinate Elevation
(m.) Azimuth/Dip
Length (m.)
Survey East North
GR-06-100 492589.2 5271366.9 271.3 120 / -50 156.2 Y and W
GR-06-101 492588.7 5271367.2 271.4 120 / -70 242.0 Y and W
GR-06-102 492643.1 5271476.9 265.6 120 / -50 125.0 Y and W
GR-06-103 492642.7 5271477.1 265.4 120 / -70 179.0 Y and W
GR-06-104 492704.0 5271565.9 249.4 120 / -52 152.0 Y and W
GR-06-105 492703.4 5271566.3 249.6 120 / -75 194.0 Y and W
GR-06-106 492795.9 5271665.5 235.2 120 / -60 179.0 Y and W
GR-06-106W 492795.9 5271665.5 235.2 120 / -60 119.0 Y and W
GR-06-107 492795.2 5271666.0 235.3 120 / -85 224.0 Y and W
GR-06-108 493157.3 5271980.5 270.2 90 / -50 153.0 Y and W
GR-06-109 493156.6 5271980.5 270.1 90 / -70 233.0 Y and W
GR-06-110 493182.1 5272079.2 254.3 90 / -51 164.0 Y and W
GR-06-111 493181.4 5272078.9 254.5 90 / -69 221.0 Y and W
GR-06-112 492533.8 5271254.8 278.5 120 / -50 196.0 Y and W
GR-06-113 492533.3 5271255.0 278.4 120 / -70 236.0 Y and W
GR-06-114 492627.3 5271415.3 263.8 120 / -64 149.0 Y and W
Total Meters in Database 2,922 meters
10.2.1 Number 10 Vein
Drill holes GR-06-100 to 107 and GR-06-112 to GR-06-114 tested the tungsten mineralization in Vein 10. These
holes were planned to intersect the vein at approximately 100 m and 200 m below surface in a position
approximately half way between the sections drill-tested by ASARCO. The Number 10 Vein structure was
intersected in all holes. From the drill logs the vein widths along the core varied from 0.5 m to 4.8 m and WO3
assays varied from a low of 0.0003% (3 ppm) over 0.5 m to a high of 1.70% over 1.5 m.
10.2.2 Number 6 Vein
Holes GR-06-109 to 111 tested the down dip portion of the surface mineralization exposed in the Number 6 Vein
area. Previous EX sized drilling on the Number 6 Vein returned lower grade results than the trenches. This may
be due to low core recoveries (grinding of the core is common with standard drilling). Although alteration and
veining was intersected in all four holes the results were disappointing with a high value of 0.40% WO3 over
0.4 m.
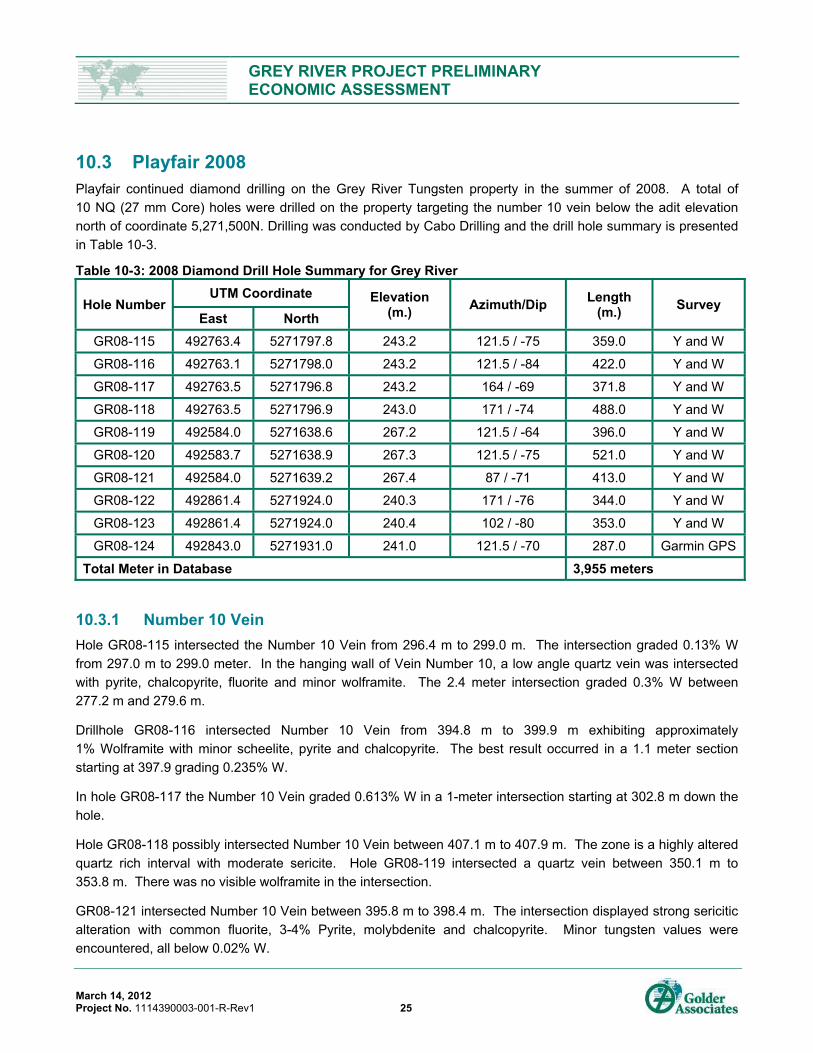
GREY RIVER PROJECT PRELIMINARY ECONOMIC ASSESSMENT
March 14, 2012 Project No. 1114390003-001-R-Rev1 25
10.3 Playfair 2008 Playfair continued diamond drilling on the Grey River Tungsten property in the summer of 2008. A total of
10 NQ (27 mm Core) holes were drilled on the property targeting the number 10 vein below the adit elevation
north of coordinate 5,271,500N. Drilling was conducted by Cabo Drilling and the drill hole summary is presented
in Table 10-3.
Table 10-3: 2008 Diamond Drill Hole Summary for Grey River
Hole Number UTM Coordinate Elevation
(m.) Azimuth/Dip
Length (m.)
Survey East North
GR08-115 492763.4 5271797.8 243.2 121.5 / -75 359.0 Y and W
GR08-116 492763.1 5271798.0 243.2 121.5 / -84 422.0 Y and W
GR08-117 492763.5 5271796.8 243.2 164 / -69 371.8 Y and W
GR08-118 492763.5 5271796.9 243.0 171 / -74 488.0 Y and W
GR08-119 492584.0 5271638.6 267.2 121.5 / -64 396.0 Y and W
GR08-120 492583.7 5271638.9 267.3 121.5 / -75 521.0 Y and W
GR08-121 492584.0 5271639.2 267.4 87 / -71 413.0 Y and W
GR08-122 492861.4 5271924.0 240.3 171 / -76 344.0 Y and W
GR08-123 492861.4 5271924.0 240.4 102 / -80 353.0 Y and W
GR08-124 492843.0 5271931.0 241.0 121.5 / -70 287.0 Garmin GPS
Total Meter in Database 3,955 meters
10.3.1 Number 10 Vein
Hole GR08-115 intersected the Number 10 Vein from 296.4 m to 299.0 m. The intersection graded 0.13% W
from 297.0 m to 299.0 meter. In the hanging wall of Vein Number 10, a low angle quartz vein was intersected
with pyrite, chalcopyrite, fluorite and minor wolframite. The 2.4 meter intersection graded 0.3% W between
277.2 m and 279.6 m.
Drillhole GR08-116 intersected Number 10 Vein from 394.8 m to 399.9 m exhibiting approximately
1% Wolframite with minor scheelite, pyrite and chalcopyrite. The best result occurred in a 1.1 meter section
starting at 397.9 grading 0.235% W.
In hole GR08-117 the Number 10 Vein graded 0.613% W in a 1-meter intersection starting at 302.8 m down the
hole.
Hole GR08-118 possibly intersected Number 10 Vein between 407.1 m to 407.9 m. The zone is a highly altered
quartz rich interval with moderate sericite. Hole GR08-119 intersected a quartz vein between 350.1 m to
353.8 m. There was no visible wolframite in the intersection.
GR08-121 intersected Number 10 Vein between 395.8 m to 398.4 m. The intersection displayed strong sericitic
alteration with common fluorite, 3-4% Pyrite, molybdenite and chalcopyrite. Minor tungsten values were
encountered, all below 0.02% W.

GREY RIVER PROJECT PRELIMINARY ECONOMIC ASSESSMENT
March 14, 2012 Project No. 1114390003-001-R-Rev1 26
Number 10 Vein was intersected in hole GR08-122 between 319.85 m to 325.1 m. The 5.3 m intersection
graded 0.287% W which includes a 0.6 m intersection grading 0.826% W from 319.8 to 320.4 and a 1.5 m
intersection grading 0.551% W starting at 323.6 m. A structure exists in the hanging wall of Number 10 Vein
between 294.4 m to 297.1 m. The 2.4 m intersection graded 0.895% W with copper values in excess of
0.5% copper.
Hole GR08-124 intersected Number 10 Vein between 250.5 m to 254.2 m. The 2.5 meter intersection graded
0.382% W
Hole GR08-120, GR08-123 failed to intersect a definitive Number 10 Vein although hole GR08-123 intersected a
number of low angle quartz veins with significant tungsten values between 0.15 W to 0.8% W.
10.3.2 Upper Zone
Most holes drilled during the 2008 campaign intersected a zone of mineralization near the collar of the holes.
The zone, typically in schist and gabbro contain 5% pyrite or less with minor fluorite, scheelite and wolframite
and anomalous copper, lead, zinc and silver values. Figure 10.1 shows the drill hole plan map for the Number 6
and Number 10 veins.
Most notable intersection are in hole GR08-115 which returned 0.16% W from 35.5 m to 46 m. including a
3 meter section grading 0.51% W between 37.0 m to 40.0 m. A high angle section in hole GR08-116 graded
0.36% W from 43.9 to 46.4m. Anomalous copper, lead zinc and silver values were intersected between 35.0 m.
to 38.9 m. in hole GR08-117. The intersection included a 0.5 meter section grading 0.468% W from 37.4 m. to
37.9 m.
In hole GR08-118, a high angle quartz vein with wolframite was intersected between 22.5 m to 23.7 m grading
1.180% W. This intersection was followed by a zone of anomalous silver, copper, lead and zinc between 23.7 m
to 35.8 m containing significant tungsten. Most veins carrying wolframite are low angle fractures between
15 to 20 degrees to core angle. Best values occurs between 28.3 m to 29.2 m grading 0.217% W and between
33.8 m and 35.8 m grading 0.136% W.
Hole GR08-119 intersected a zone from 32.5 m to 47.0 m and again from 57.7 m to 66.0 m with anomalous
silver, copper, lead and zinc but no significant tungsten results. Similar results was obtained in hole GR08-120
from 11.2 m to 34.7 m.

GREY RIVER PROJECT PRELIMINARY ECONOMIC ASSESSMENT
March 14, 2012 Project No. 1114390003-001-R-Rev1 27
Figure 10.1: Drill hole plan map for the Number 6 and Number 10 veins

GREY RIVER PROJECT PRELIMINARY ECONOMIC ASSESSMENT
March 14, 2012 Project No. 1114390003-001-R-Rev1 28
11.0 SAMPLE PREPARATION, ANALYSES AND SECURITY
11.1 Sample Collection Data from various sample types have been collected over the years at the Grey River Tungsten property:
a) ASARCO drill core samples from the pre-1970s exploration program.
b) ASARCO surface trench samples (channel samples).
c) ASARCO surface grab samples.
d) ASARCO underground face samples.
e) ASARCO underground back samples (two campaigns).
f) ASARCO raise/bulk samples.
g) Playfair drill core samples from the 2006 and 2008 drilling program.
Pre-1970 Drilling ASARCO drilled 55 core holes on the Grey River Tungsten property, of those, 25 were drilled to intersect the Number 10 or Number 6 Vein. Most holes were drilled with an EX sized core or combination of AX followed by EX on longer holes. This drilling technique does not use wire-line equipment and is more prone to poor recovery. An examination of the preserved drill core in Buchans shows that the complete core from the mineralized sections were taken as samples. Consequently, there are no representative samples to check for any of the mineralized zones tested by the pre-1970s holes.
Trench Samples and Grab Samples ASARCO excavated a total of 26 trenches over the Number 6 and 10 Veins. Seventeen of these trenches
tested the mineralization in the Number 10 Vein. The method of sample collection and/or aggregation is
unknown. Playfair collected a series of grab samples for portions of the Number 10 Vein as part of the 2006
exploration effort.
Underground Face and Back Samples Face samples dating back to March 1969 were collected every 2 to 2.5 meter intervals, while the first campaign
of back samples dated February 1970 were collected at 1 to 1.5 meter interval. ASARCO recorded the WO3%,
Cu% assays along with the vein width. No details regarding the methodology used in the collection of these
samples were available, however a document dated Nov. 16, 1979 describes a cross-cut sampling program and
the procedure used for these samples is assumed to be similar to what was used by ASARCO. The Sampling
was reportedly done with hammer and moils. The equipment was changed to a chisel-pointed bit during the
cross cut sampling program due to contamination with the tungsten carbide circular point bit originally used.
Samples were chipped onto a plastic sheet laying on a canvas then bagged within protective canvas bags. The
exact equipment used for the back and face samples by ASARCO is unknown however during the site visit, it
was apparent that the back samples were collected by hand tools and power saws were not used to cut
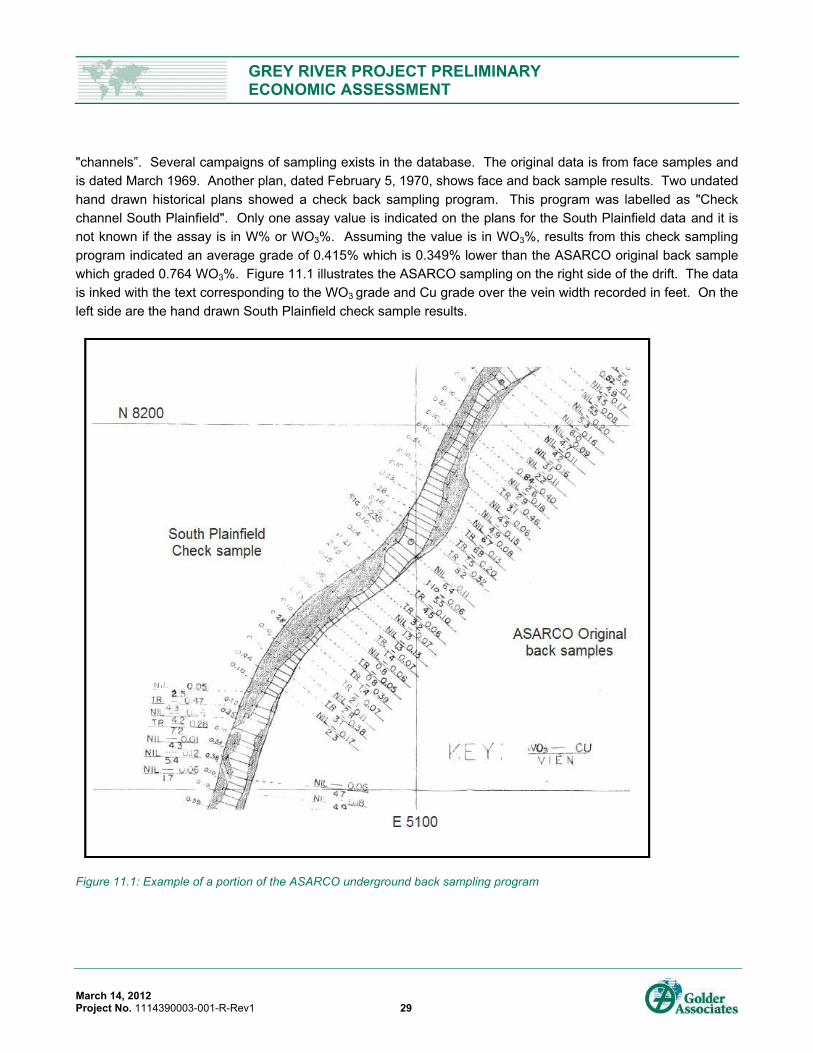
GREY RIVER PROJECT PRELIMINARY ECONOMIC ASSESSMENT
March 14, 2012 Project No. 1114390003-001-R-Rev1 29
"channels”. Several campaigns of sampling exists in the database. The original data is from face samples and
is dated March 1969. Another plan, dated February 5, 1970, shows face and back sample results. Two undated
hand drawn historical plans showed a check back sampling program. This program was labelled as "Check
channel South Plainfield". Only one assay value is indicated on the plans for the South Plainfield data and it is
not known if the assay is in W% or WO3%. Assuming the value is in WO3%, results from this check sampling
program indicated an average grade of 0.415% which is 0.349% lower than the ASARCO original back sample
which graded 0.764 WO3%. Figure 11.1 illustrates the ASARCO sampling on the right side of the drift. The data
is inked with the text corresponding to the WO3 grade and Cu grade over the vein width recorded in feet. On the
left side are the hand drawn South Plainfield check sample results.
Figure 11.1: Example of a portion of the ASARCO underground back sampling program

GREY RIVER PROJECT PRELIMINARY ECONOMIC ASSESSMENT
March 14, 2012 Project No. 1114390003-001-R-Rev1 30
Raise/bulk samples: Raise samples were also collected from underground (37 in total); there is no data for 25 of
these samples. A document exists regarding the sampling collection of the bulk sampling program conducted by
ASARCO. The document is a memorandum to Mr. E. M. Martin General Manager and is dated August 7, 1970.
The procedure used for the collection of the bulk sampling program is summarized from this document as
follows:
Each raise is marked and mapped in detail. The minimum width of the raise is 1.2 m x 1.5 m x 1.8 m to the
width of the vein where necessary. A floor was built consisting of a 10 mil plastic sheet followed by a
10.2 cm x 20.3 cm x 2.4 m plank floor resting on 10.1 cm x 10.1 cm sleepers. Drilling was conducted along the
dip of the vein then blasted. Each round was mucked into drums with the fines collected by sweeping the plank
floor. Any fine material collected by the 10 mil plastic was placed in the drums. Plank and plastics were to be
washed before been re-use for the next raise. Figure 11.2 shows the layout of the floor used in the collection of
the samples.
Figure 11.2: Flooring arrangement for bulk sample collection

GREY RIVER PROJECT PRELIMINARY ECONOMIC ASSESSMENT
March 14, 2012 Project No. 1114390003-001-R-Rev1 31
Playfair 2006 and 2008 Drill Samples Playfair completed a drilling program in 2006 on the Number 10 Vein that tested the vein above the adit level
and replicated some of the ASARCO drill holes. All core samples were collected under the supervision of
Mr. James Harris, P.Geo. of Playfair. HQ diameter core (63.5 mm) drilled by Petro Drilling Co. was descriptively
logged on site, aligned, marked for sampling and then split in half, longitudinally, using a diamond saw blade.
The 2008 drill program was conducted under the supervision of Mr. James Harris P. Geo of Playfair and
targeted the Number 10 Vein mineralization below the adit level. The NQ diameter core (47.6 mm) drilled by
Cabot Drilling Co. was descriptively logged on site, aligned, marked for sampling and then split in half,
longitudinally, using a diamond saw blade.
The remaining half of the drill core for the 2006 and 2008 drill program is stored in core boxes, cross stacked on
wooden pallets in proximity to the drill pad for verification and future reference.
Playfair 2006 Bulk Sample During the 2006 drilling program a bulk sample of approximately 4,550 kilogram (kg) was collected from the
trench on the Number 10 Vein. The sample is stored on site in large tote bags for future metallurgical test work.
11.2 Sample Preparation and Analysis
Pre-2006 Drilling The available documentation indicates that all of the samples for the pre-1970’s drilling program, the trenching
program and the underground sampling program, were shipped to, and analysed by, the ASARCO laboratory in
Buchans, central Newfoundland. Some check samples were also assayed at an ASARCO laboratory in
New Jersey (USA). A description of the method of analysis used in Buchans is given in Appendix A. The
available documentation does not mention the use of blanks or Certified Reference Materials although there are
a few comments on duplicate analyses. Pulps and/or sample rejects are not available for examination.
According to information supplied by Playfair, ASARCO analysed the tungsten samples using a colorimetric
thiocyanate method. This procedure, explained in Appendix A, consists of fusing a sample with a sodium
peroxide-sodium carbonate mixture, water leached and diluted to volume. An aliquot of the clear solution is
acidified with sulfuric and hydrochloric acid. The tungsten ion is reduced with stannous chloride, potassium
thiocyanate is added, and the color measured spectrophotometrically. The methodology dates back to 1943 and
its stated that the main advantage of this method is the non-interference of Vanadium and the higher tolerance
limit of Molybdenum (S.C Srivastava and al.). As of 1997, the spectrophotometric methods based on the
thiocyanate were still popular. The method was reported to be sensitive and accurate as long as all tungsten is
put in the solution.

GREY RIVER PROJECT PRELIMINARY ECONOMIC ASSESSMENT
March 14, 2012 Project No. 1114390003-001-R-Rev1 32
2006 Drilling
One half of the sampled drill core was bagged, sealed and delivered to Eastern Analytical Ltd. in Springdale,
Newfoundland where it was dried, crushed and pulped. Samples were crushed to -10 mesh and split using a
riffle splitter to approximately 300 grams. A sample split was pulverized using a ring-mill to approximately 98%
passing minus 150 mesh. The resulting pulp was then shipped to Acme Analytical Laboratories Ltd. of
Vancouver, British Columbia, an ISO 9001:2000 accredited laboratory, where a 0.5 gm split was
subjected to a phosphoric acid leach followed by tungsten analysis of the leachate by ICP-ES
(Induced Couple Plasma Emission Spectroscopy). Any values higher than 100 ppm were assayed for tungsten.
All coarse rejects are currently stored at Eastern Analytical Ltd. facilities and sample pulps are currently stored at
the Acme Analytical Laboratories Ltd. (Acme) facilities in Vancouver.
Blanks, certified reference materials or field duplicates were not inserted into the sample stream therefore there
is no independent way to monitor any quality control issues for the 2006 drilling program. Nevertheless, new
pulps of the drill hole samples were created from the Acme coarse rejects and re-analyzed by SGS laboratories.
A review of the data from the two laboratories shows that 7% (19 out of 285) of the samples have significantly
different values. Wardrop attributed the difference to the nugget effect however; it may also be related to the
analytical method used by Acme and SGS laboratories. Only the Acme dataset was used for the current
resource estimate.
2008 Drilling
Core samples were collected under the supervision of Mr. James Harris, P.Geo. NQ diameter core was
descriptively logged on site, aligned, marked for sampling and then split in half, longitudinally, using a diamond
saw blade. One-half of the core is preserved on site in core boxes for verification and future reference.
The samples comprising the other half of the core were bagged, sealed and delivered to Eastern Analytical Ltd.
in Springdale Newfoundland where they were dried, crushed and pulped. Samples were crushed to
approximately -10 mesh and split using a riffle splitter to approximately 300 grams. The sample split was
pulverized using a ring mill to approximately 98% minus 150 mesh.
The resulting pulp was then shipped to Eco Tech (Alex Stewart Geochemical) of Kamloops BC, an
ISO 9001:2000 accredited laboratory, where a 0.2 gm split was subjected to a fusion digestion, then analyzed
for tungsten by ICP-MS (Inductively coupled plasma mass spectrometry). All coarse rejects are currently stored
at Playfair Newfoundland facilities and sample pulps have been discarded.
Blanks were not inserted into the sample stream so cross contamination cannot be independently monitored
between sample batches. No field duplicates were inserted in the sampling chain however, new to the 2008
sampling program, Playfair introduce the use of standard reference material. The CDN-W-1 standard was
purchased from CDN Laboratory Ltd. of Delta, BC. The recommended values and the "Between Lab"
two-standard deviation are indicated on the certificate as 1.04 +/- 0.10% Tungsten and 0.458 +/- 0.042%
Copper. According to CDN Laboratory, the material was sourced from the Cantung mine and consists primarily
of pyrite, chalcopyrite and tungsten as scheelite.

GREY RIVER PROJECT PRELIMINARY ECONOMIC ASSESSMENT
March 14, 2012 Project No. 1114390003-001-R-Rev1 33
The laboratory results for the standard shows excellent performance against the standard for both tungsten and
copper with no failure as shown in Figure 11.3 and 11.4.
Figure 11.4: Tungsten Standard CDN-W-1
Figure 11.3: Copper standard CDN-W-1

GREY RIVER PROJECT PRELIMINARY ECONOMIC ASSESSMENT
March 14, 2012 Project No. 1114390003-001-R-Rev1 34
11.3 Comments on the Data Quality and Assay ASARCO invested significant amounts of money into the Grey River Tungsten property based on the quality of
the tungsten data supplied by their laboratories. A great deal of preliminary work has been performed by
ASARCO on the property including diamond drilling, the development of an adit, the extraction of raise samples
and the development of some of the infrastructure around the portal. The historical data that was collected
under ASARCO's supervision appear to follow the best industry practice at the time it was collected.
The probability plots for the various sample type (Section 14) indicates that the Playfair 2006 and 2008 drill
results average are significantly lower grade than the historical samples. Check samples collected during the
site visit also returned higher grade than Playfair samples. Since the determination of tungsten in low grade
ores and geological samples is known to be difficult and challenging to assay. DGL suspect that wet analysis
method used for the 2006 and 2008 drill core samples may leave some of the tungsten un-assayed.
For tungsten assay, ALS Chemex recommends using pressed pellet XRF for drill core while ActLabs
recommend a neutron activation technique. The difference in these two methods is summarized below:
XRF is using 15g of sample press into a pellet then using X-ray to make the electrons jump to another orbital.
Once the electrons go back to the original state it will emit an energy. By specific energy emitted as florescent
the XRF detector is able to determine the elements and concentration.
Neutron Activation uses a high energy radioactive source to create isotope of the elements analyzed, followed
by using the isotope radioactive decay to determine the elements and concentration. Usually there is a cool
down period involved after activation and different isotopes will have different decay rates therefore the
turnaround is usually longer.
Both methods are non destructive and don't involve the dissolution of the tungsten and are recommended by
Srivastava and al (1996).
DGL recommend Playfair to re-run a portion of the Number 10 Vein pulp reject with either a XRF or INAA
method. If the results of the check analysis indicate a different grade than the original samples, then the
remaining vein material would need re-assaying. For the historical samples, a program of underground check
assays can be initiated in the next exploration program along with a few twin holes. This program would also
eliminate the lack of QA/QC on the historical samples.
DGL would also recommend Playfair to implement the submission of blanks and field duplicate in the sample
string.
Based on the vein continuity, the number of samples collected and the fact that the Number 10 vein can be
observed underground and on the surface, DGL believes that the supplied data are of sufficient quantity and
quality to delineate an inferred resource. The lack of confidence in the analytical technique prevents the
mineralization to be up-class to the indicated category.

GREY RIVER PROJECT PRELIMINARY ECONOMIC ASSESSMENT
March 14, 2012 Project No. 1114390003-001-R-Rev1 35
12.0 DATA VERIFICATION DGL has examined the records from the historical exploration and development work carried out on the
Grey River Tungsten property. These records, which were made available by Playfair, consists of printed and
digital data pertaining to exploration work carried out between 1954 and 2008.
12.1 Site Visit Summary by Wardrop Wardrop visited the Newfoundland government core storage facility in Buchans, Newfoundland to examine the
historical ASARCO drill core. Holes GR-1, GR-2, GR-8 and GR-10 were reviewed and it was also confirmed
that the remaining holes were present in the storage facility. A variety of mineralized sections were checked and
two issues are apparent:
1) The entire drill core within the mineralized zones were used for the ASARCO sample. This was the
common practice for EX core due to its small diameter.
2) Re-drilling and grinding of the core is relatively common. This is a function of the standard drilling
(non-wireline) technique used at the time. It is easily identified by footage tags that do not have the
appropriate amount of drill core between them.
Wardrop also visited the Grey River Tungsten property to establish the coordinates of the drill collars for the
2006 program. In addition, the coordinates of the adit and one trench were determined and an attempt was
made to gather the coordinates of the ASARCO drill pads. Due to snow coverage, it was not possible to
examine the Number 10 Vein on surface.
12.2 Site Visit Summary by DGL Mr. Pierre Desautels (P.Geo.) visited the Playfair’ Grey River deposit, accompanied by Mr. Wallace Lushman, a
local prospector residing in the community of Grey River, on October 05, 2011. Drilling was not active during the
site visit since Playfair's exploration activity on the property stopped in 2008 following the completion of the drill
program.
The 2011 site visit entailed reviews of the following:
Overview of the geological setting of the Number 10 Vein.
Surveying (topography and drill collar).
Inspection of the higher grade core section from the 2006 and 2008 drill program.
Core recovery.
Inspect the ASARCO adit.
Independent collection of character samples.

GREY RIVER PROJECT PRELIMINARY ECONOMIC ASSESSMENT
March 14, 2012 Project No. 1114390003-001-R-Rev1 36
During the 2011 visit, DGL collected 3 character samples consisting of three half-core samples replicating the Playfair samples in hole GR08-115, 117 and 124, one core sample of approximately 10 cm long collected at 227.6 m in hole GR08-124 and one channel sample across the Number 10 Vein. DGL retained full custody of the sample from the Grey River deposit to Barrie, Ontario, where the samples were shipped to Activation Laboratories Ltd. located at 1428 Sandhill Drive, Ancaster, Ontario. The main intent of analyzing these samples was to confirm the presence of tungsten, copper, bismuth and molybdenum in the deposit by an independent laboratory not previously used by Playfair. Less relevant to the deposit, zinc and silver were also assayed.
At Activation Laboratories the samples were crushed (< 5 kg), split, and a 100 g cut was pulverized with mild steel (Activation Laboratories Code RX2).
Copper, silver, zinc, and molybdenum were analyzed by four acid digestion followed by ICP-OES (Activation Laboratories Code 8). Bismuth was analyzed by peroxide fusion followed by ICP-MS.
Tungsten was analyze by Wolfram Bergbau - WO3 Induced Neutron Activation Analysis (INAA) which, according to Activation Laboratory, gives better results than wet chemistry such as fusion digestion, followed by ICP-MS because in most cases the method only requires the preparation of representative samples, i.e., pulverization or homogenization and this reduces the danger of contamination to a minimum and accelerates the whole analytical process. Solubilization of the sample is no longer necessary, which is difficult for tungsten since wolframite and ferberite tend to be resistant to the acid attack. From the assay results shown in Table 12-1, DGL character samples all returned higher tungsten concentration likely due to the difference in the analytical method used and the fact that the samples are 1/2 core splits and not pulp duplicates.
Table 12-1: Character Sample Results
Sample Type Sample Number WO3 (%)
Bi (ppm)
Cu (%)
Mo (%)
Ag (ppm)
Zn (%)
GR08-124 (1/2 core)
DGL-001 0.840 508 0.285 < 0.003 13.0 0.03
Playfair-83935 0.595 390 0.312 -- 13.7 --
GR08-124 at 227.6
DGL-002 0.009 4 0.104 0.004 <3.0 0.02
Playfair-83923 0.005 5 0.050 -- 0.7 --
GR08-117 (1/2 core)
DGL-003 2.500 23 0.008 < 0.003 4.0 0.00
Playfair-84344 0.773 75 0.017 -- 0.9 --
GR08-115 (1/2 core)
DGL-004 0.175 665 0.054 0.015 10.0 0.02
Playfair-84290 0.115 405 0.110 -- 6.8 --
Across No10 Vein
DGL-005 5.180 416 0.006 <0.003 5.0 0.00
No Playfair Equiv. -- -- -- -- -- --
Despite the difference seen, the character samples were within an acceptable range with Playfair’s original
results and confirm the presence of tungsten in the original assay. However, the difference in the analytical
method should be investigated further.
Geologists responsible for logging the core have no difficulty identifying the Number 10 Vein
(shown on Figure 12.1) since the brecciated quartz is very distinct. During the site visit, sulphide was found to
be present in minor amounts consisting mainly of pyrite with trace chalcopyrite. Wolframite was observed to
occur in isolated clusters and sometimes large crystals rendering the mineralization difficult to sample with small

GREY RIVER PROJECT PRELIMINARY ECONOMIC ASSESSMENT
March 14, 2012 Project No. 1114390003-001-R-Rev1 37
diameter core. The hanging wall of Number 10 Vein was inspected by DGL in hole GR08-124. The zone
consisted of quartz veinlets carrying fluorite and scheelite. The veinlets displayed a low core angle indicating
that they may be dipping sub-parallel to the drill direction or strike in a E-W direction.
Scheelite was observed to be present with fluorite, apparently replacing wolframite along the crystal surfaces
and cleavage planes. Figure 12.2 shows a sample collected between 302.8 m and 303.8 m in hole GR08-117
under UV light.
Figure 12.2: Scheelite flourite and Wolframite in quartz
Figure 12.1: Number 10 vein in core

GREY RIVER PROJECT PRELIMINARY ECONOMIC ASSESSMENT
March 14, 2012 Project No. 1114390003-001-R-Rev1 38
Playfair only sampled the mineralized sections of the core, which is considered appropriate for this deposit.
Figure 12.3 shows a few selected images from the most recent site visit.
The underground inspection is described in Section 9.1.1 of this report and will not be repeated here.
Local Service District of Grey River GR-08-115 casing
Coarse grained Wolframite GR-08-117 @ 303.8m Number 10 Vein surface outcrop
Channel sample cut with power saw Playfair bulk sample
Figure 12.3: Site visit photographs

GREY RIVER PROJECT PRELIMINARY ECONOMIC ASSESSMENT
March 14, 2012 Project No. 1114390003-001-R-Rev1 39
12.3 Drill Hole Collar Validation Collar coordinates were validated with the aid of a hand-held Garmin GPS map model 60CSx. A series of
collars were randomly selected and the GPS position was recorded. The difference between these values and
those recorded in the Gems database was calculated in an X-Y 2D plane with the following formula:
∆East ∆North 2
Wardrop GPS coordinates were also added to the dataset since the position of the holes were adjusted after the
2008 survey conducted by Yates and Wood. There is good agreement between the historical drill collar
coordinates and the coordinates determined during the site visit. As shown on Table 12-2, results indicated an
average difference of 17.5 m in the X-Y plane and -2.8 m in the Z plane for the 10 hole collars where the
instrument was located near the casing. The calculated differences in the X-Y plane are well within the accuracy
of the hand held GPS unit used, which is typically influenced by the number of satellites seen by the instrument
on the day of the survey.
Table 12-2: Collar Coordinate Validation
Gemcom Database Entry GPS Point Recorded during Site Visit Differences
between GEMS and GPS
Point-ID East North Elev. Origin East North Elev X-Y Plane
(m.) Z Plane
(m.)
GR-06-102, 103
492643 5271477 265 Wardrop 492625 5271485 272 19.6 -6.5
GR-06-114
492627 5271415 264 Wardrop 492612 5271424 269 17.6 -5.2
GR-06-104, 105
492704 5271566 249 Wardrop 492684 5271576 266 22.1 -16.5
GR-16 492748 5271619 238 Wardrop 492731 5271625 240 18.3 -2.3
GR-06-106,107
492796 5271666 235 Wardrop 492781 5271670 238 15.2 -2.8
GR-27,28 492834 5271746 258 Wardrop 492819 5271755 260 17.7 -2.5
GR-1 492792 5271593 236 Wardrop 492775 5271596 240 17.4 -4.0
Portal 492441 5270469 14 Wardrop 492422 5270471 9 18.8 4.7
GR08-122 492861 5271924 240 DGL 492857 5271923 234 4.5 6.3
GR08-115 to 118
492763 5271797 243 DGL 492744 5271802 246 19.9 -2.8
GR06-114 492627 5271415 264 DGL 492610 5271423 271 19.0 -7.2
Portal 492441 5270469 14 DGL 492426 5270482 8 19.4 5.7
Average Difference 17.5 -2.8

GREY RIVER PROJECT PRELIMINARY ECONOMIC ASSESSMENT
March 14, 2012 Project No. 1114390003-001-R-Rev1 40
12.4 Digital Data Verification by Wardrop Wardrop validated four of the holes in the database by comparing the original drill log data with the summary sheets supplied by the client. This sample population represents 9% of the total holes in the database (4 out of 45 holes).
Data verification validated the collar co-ordinates, length of holes, down-the-hole survey measurements (including azimuth and dip), as well as footage intervals of the assay samples and the lithological units. Tungsten values from non-drill hole samples were checked against the data on printed maps (for the trenches and grab samples) as well as plots of the underground sampling diagrams (for the back, face, raise and bulk samples). Minor errors are present in the lithology data set; two of the checked intervals differed by 0.1 metre while the other two intervals had a difference of 0.2 metre.
The coordinates for the four holes could not be confirmed because no field grid sketch is available for cross-reference. This is not critical given that the drill holes in the database are in UTM space (NAD 27 Zone 21) rather than grid coordinate space. As indicated above, the UTM coordinates for selected holes were confirmed during the site visit which suggests that all of the collar coordinates in the database are correct. Details of the verification are given in Table 12-3.
Table 12-3: Data Verification
Database Portion
Total Records
Error Records
Records with Errors
Records Validated
Collar 8 0 0% Coordinates (easting, northing, elevation and depth).
Survey 16 0 0% Survey depths, survey dips and survey azimuths.
Geology 132 8 6% Names of units and downhole depths.
Assay 104 0 0% Tungsten values and distances down hole.
Underground 993 1 0.1% Tungsten and copper values. Width of samples.
Total 1253 9 0.72%
12.5 Digital Data Verification by DGL 12.5.1 Historical Drill Holes
For this resource estimate and for reasons of completeness, the Playfair digital database was improved with the addition of forty one, pre-1970 drill holes on the property. Twenty three holes consisted of surface exploration drilling away from the Number 10 or Number 6 Veins. The remaining additional eighteen holes were underground definition drilling targeted at the Number 10 Vein ahead of the drift face with a few holes, drilled from the underground cross-cut, and targeted the Number 10 Vein below the adit level. Of these, nine definition holes were not sampled by ASARCO despite intersecting the Number 10 Vein. Only three holes collared from the underground cross-cut, GR-39, GR-40 and GR-41 had assay results that influenced the grade of the model below the adit level. Two holes GR-47 and GR-48 with available drill logs did not have collar coordinates and could not be located on any of the plans reviewed. Holes TH-1 to TH-13 were known to have been drilled but no logs existed for these holes. They are assumed to be definition holes drilled with extension steel attached to a Jackleg drill.

GREY RIVER PROJECT PRELIMINARY ECONOMIC ASSESSMENT
March 14, 2012 Project No. 1114390003-001-R-Rev1 41
12.5.2 Historical Channel Samples
During the data validation process, one additional historical channel sample plan was located. The plan showed
ASARCO channel samples and the South Plainfield check samples. The data from that plan was added to the
database as part of this resource estimate. For the South Plainfield data, the sample width was assumed to be
the same as the closest ASARCO sample. A total of 65 additional samples were added to the database. DGL
also added the sample width and copper assays which were previously not entered in the database by Wardrop.
12.5.3 Trench and Rock Samples
Out of the 17 trench samples in the database only 11 had a sample width. The grade from the trenches originated from a plan view that was geo-referenced and digitized in the GEMS database. The WO3% value on
the plan appears to be an average of a number of channel samples and no assay certificates were available for
review.
12.5.4 Assay Validation
The validation against the official, signed electronic version of the certificates in PDF format consisted of
comparing the values on the certificate against the GEMS database entry. Certificates were obtained from
Playfair for the 2006 and 2008 drill campaign. For the historical holes, some ASARCO assay certificate were
located but not for all holes. For the holes that no certificate existed, the database value was compared to the
value entered in the logs.
A total of 373 assay results were compiled from the certificates into an Excel spreadsheet (39% of the database)
and matched against the sample number in the GEMS database. Hole GR-06-110 originally showed an import
error originated by the author the validation rate was escalated to include all assays intersecting the number
10 and number 6 Vein for the 2006 and 2008 drill program. During the validation, a number of errors were encountered related to using the W% value in the WO3% column, which, if left uncorrected, lowers the grade
by 1.2611. Other issues were minor in nature and are related to rounding. The 2008 drill results were free of
any errors.
All assays showing a grade variation in excess of 0.005 WO3% when compared to the laboratory certificate
were corrected. The assay validated and corrected by DGL, amounted to a total of 373 assays covering 37% of
all assays for the 2006 and 2008 drill campaign and 69% of all historical drill core assays.
Notwithstanding the possible issue related to the analytical technique used, the Qualified Person regards the
database to be free of major errors insofar as the assays in the database match the laboratory certificates or the
valued entered on drill logs and plans.

GREY RIVER PROJECT PRELIMINARY ECONOMIC ASSESSMENT
March 14, 2012 Project No. 1114390003-001-R-Rev1 42
13.0 METALLURGICAL TESTING AND MINERAL PROCESSING
13.1 Metallurgical Testing Two metallurgical reports were completed by SGS Mineral Services to derive a preliminary flow sheet and cost
estimate: ‘Metallurgical Scoping Test work Report on a Sample of Wolframite Ore’ dated May 31, 2006 and
‘Phase 2 Metallurgical Scoping Test work Report on a Sample of Wolframite Ore’, dated November 6, 2006.
Further metallurgical test work is required to demonstrate that an acceptable grade concentrate at an acceptable
metallurgical recovery can be achieved. Individual gravity separation tests indicate that the quality of the sample
preparation was insufficient to produce consistent metallurgical results. The test work indicates that testing was
undertaken on a ‘bulk sample’, however, the indicated grade was relatively high compared to the current
estimated feed grade. The potential mine feed is highly diluted compared to the sample tested by SGS and so
metallurgical results from those reports are potentially optimistic compared to results achieved from a fully
diluted sample.
The back-calculated feed grades vary from 2.32% to 4.01% WO3, whereas the current underground mining
resource has an estimated grade of 0.52%. Concentrate specification needs to be addressed in future test work.
Furthermore, WO3 cons destined for APT plants have a target size distribution specification. Further
metallurgical work is strongly recommended in order to; establish a firm specification on the head grade for the
feed; maximize recovery to an acceptable WO3 concentrate; and, move beyond the scoping stage and simulate
the unit processes of the proposed flow sheet on a representative sample of the feed material. This will help
establish firm criteria for the metallurgical performance to produce an acceptable concentrate.
13.2 Mineral Processing Grey River is proposed as a low-tonnage, high grade operation, with a relatively free-milling ore, shown to be
amenable to gravity separation methods, producing a potential concentrate of 60% with a tungsten recovery of
75%. The concentrate is destined for Ammonium Para Tungstate (APT) plants either on the Continental US or
alternately customers in Europe. However, the concentrate produced thus far does not yet meet typical feed
grade or particle size specifications for conversion to Ammonium Paratungstate and it may be advantageous to
produce a concentrate meeting these specifications directly in order to maximize value. It is generally accepted
that concentrates grading >65% WO3 attract a price premium on the market, and a further price premium is
achieved in meeting the feed size specifications to the APT plant. Therefore, it is recommended that further test
work be undertaken to meet these criteria. A generally applicable tungsten processing flow sheet has thus been
selected for costing purposes, and flexibility to meet this option has been built into the flows sheet through the
inclusion of a rod milling circuit as an alternative to an impact crushing option, in advance of the spiral plant.
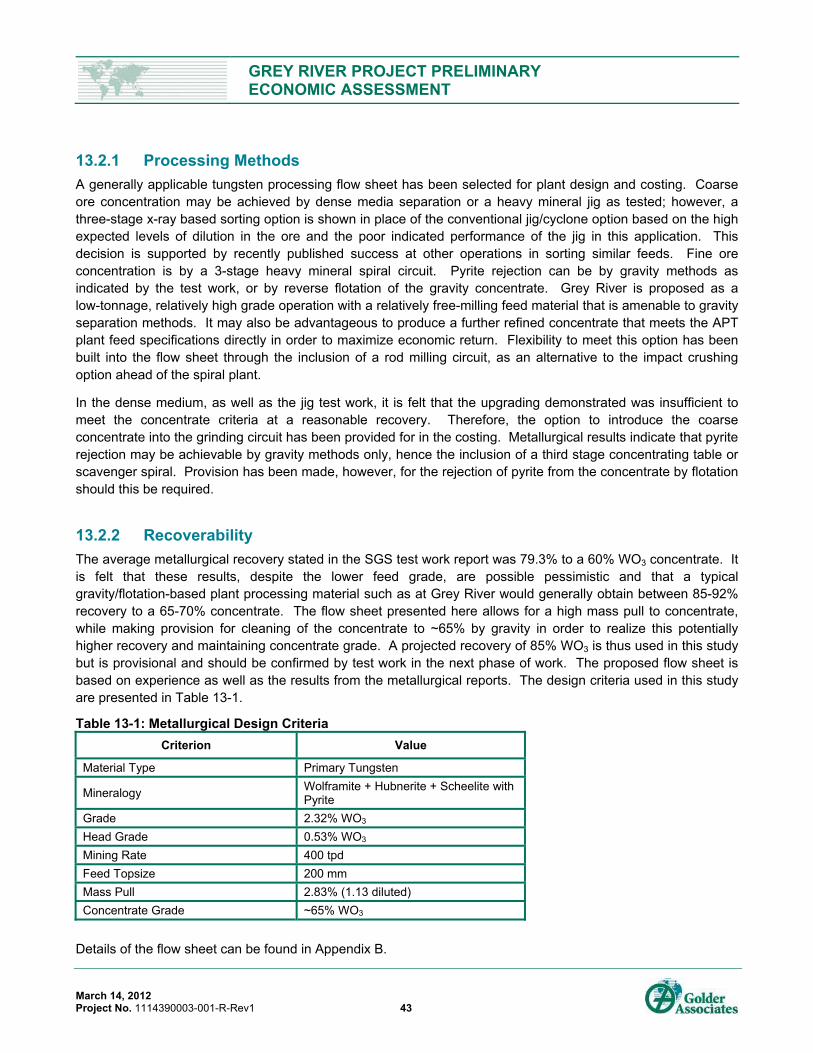
GREY RIVER PROJECT PRELIMINARY ECONOMIC ASSESSMENT
March 14, 2012 Project No. 1114390003-001-R-Rev1 43
13.2.1 Processing Methods
A generally applicable tungsten processing flow sheet has been selected for plant design and costing. Coarse ore concentration may be achieved by dense media separation or a heavy mineral jig as tested; however, a three-stage x-ray based sorting option is shown in place of the conventional jig/cyclone option based on the high expected levels of dilution in the ore and the poor indicated performance of the jig in this application. This decision is supported by recently published success at other operations in sorting similar feeds. Fine ore concentration is by a 3-stage heavy mineral spiral circuit. Pyrite rejection can be by gravity methods as indicated by the test work, or by reverse flotation of the gravity concentrate. Grey River is proposed as a low-tonnage, relatively high grade operation with a relatively free-milling feed material that is amenable to gravity separation methods. It may also be advantageous to produce a further refined concentrate that meets the APT plant feed specifications directly in order to maximize economic return. Flexibility to meet this option has been built into the flow sheet through the inclusion of a rod milling circuit, as an alternative to the impact crushing option ahead of the spiral plant.
In the dense medium, as well as the jig test work, it is felt that the upgrading demonstrated was insufficient to meet the concentrate criteria at a reasonable recovery. Therefore, the option to introduce the coarse concentrate into the grinding circuit has been provided for in the costing. Metallurgical results indicate that pyrite rejection may be achievable by gravity methods only, hence the inclusion of a third stage concentrating table or scavenger spiral. Provision has been made, however, for the rejection of pyrite from the concentrate by flotation should this be required.
13.2.2 Recoverability
The average metallurgical recovery stated in the SGS test work report was 79.3% to a 60% WO3 concentrate. It is felt that these results, despite the lower feed grade, are possible pessimistic and that a typical gravity/flotation-based plant processing material such as at Grey River would generally obtain between 85-92% recovery to a 65-70% concentrate. The flow sheet presented here allows for a high mass pull to concentrate, while making provision for cleaning of the concentrate to ~65% by gravity in order to realize this potentially higher recovery and maintaining concentrate grade. A projected recovery of 85% WO3 is thus used in this study but is provisional and should be confirmed by test work in the next phase of work. The proposed flow sheet is based on experience as well as the results from the metallurgical reports. The design criteria used in this study are presented in Table 13-1.
Table 13-1: Metallurgical Design Criteria
Criterion Value
Material Type Primary Tungsten
Mineralogy Wolframite + Hubnerite + Scheelite with Pyrite
Grade 2.32% WO3
Head Grade 0.53% WO3
Mining Rate 400 tpd
Feed Topsize 200 mm
Mass Pull 2.83% (1.13 diluted)
Concentrate Grade ~65% WO3
Details of the flow sheet can be found in Appendix B.

GREY RIVER PROJECT PRELIMINARY ECONOMIC ASSESSMENT
March 14, 2012 Project No. 1114390003-001-R-Rev1 44
14.0 MINERAL RESOURCE ESTIMATE 14.1.1 Data
A mineral resource estimate has been completed by DGL for the Number 10 and Number 6 Vein on the
Grey River Tungsten property in southern Newfoundland. Gemcom software GEMS 6.3 was used for the
resource estimate. The metal of interest at the Grey River project is tungsten with possible copper, zinc and
lead credits. Since approximately 85% of the raw data was also assayed for copper, the model was interpolated
for that element; however since the metallurgical test work did not evaluate the possibility of extracting copper,
the mineral resource will only report for tungsten.
Playfair provided a digital drill hole database in a Gemcom project that originated from the June 2007, NI43-101
report from Wardrop. Digital scan copies of the ASARCO adit, sampling plan and various historical reports were
also provided by Playfair. The Playfair 2008 drill data, along with changes to the hole coordinates resulting from
the Yates and Wood survey were added to the database along with other minor changes described in Section 12
of this report.
A total of fifty-five historical holes now exist in the database of which twenty-five holes were used for the
resource estimation. The remaining thirty holes that were not used in the resource estimate consisted of
twenty-one surface exploration holes not targeting the Number 10 or Number 6 Vein, eight underground holes
that were discarded because of lack of sampling by ASARCO even though some of the holes intersected the
Number 10 Vein and one underground hole that had 2 assays that did not line up with the expected position of
the Number 10 Vein in relation to its position in the adit. Playfair 2006 and 2008 drill campaigns added an
additional twenty-six holes, all of them used in the resource estimation. Table 14-1 summarizes the drill hole
data used for the estimate.
Table 14-1: Drilling Data Records used for the Resource Estimate
Drill Core Holes Origin Number used in
Resource Total Meter Assays
Used in Resources
Historical 25 3388.43 25
Playfair 2006 16 2922.2 267
Playfair 2008 10 3954.8 616
Not Used
Historical 30 1420.45 2
Playfair 2006 0 n/a n/a
Playfair 2008 0 n/a n/a
Total in Database 81 11685.88 910
Other data types were also used for the resource estimate. There were two campaigns of back sampling and
one series of face samples completed by ASARCO and all three sets have been used in the resource model.
The south Plainfield check samples were not use in the resource due to the missing sample length on plan and
the lack of indication as to the unit (W% or WO3%) used to express the assay and the analytical technique used.

GREY RIVER PROJECT PRELIMINARY ECONOMIC ASSESSMENT
March 14, 2012 Project No. 1114390003-001-R-Rev1 45
ASARCO collected the underground face samples at a nominal average spacing of 2.7 m while the two series of
back samples were collected at a nominal average spacing of 1 m. In order to minimize any bias in the search
and interpolation procedures, these samples were de-clustered using a polygonal method.
Trench and grab samples were only used if the original data had a sample length associated with the assays.
A total of 12 grade originating from the ASARCO bulk sample program was also used for the area north of
coordinate 5,271,650 N. Table 14-2 summarizes the data from other the source used in the resource estimate.
Table 14-2: Non-drilling Data Records used for the Resource Estimate
ASARCO Face and Back
Samples
South Plainfield Check Samples
ASARCO Bulk
Samples
Rock Samples
Trench Samples
Total in Database 424 284 12 22 17
Used in Resource (De-clustered Data)
40 0 12 2 11
14.1.2 South Plainfield Check Sample Assessment
The 284 check back samples from the South Plainfield average 0.415 (%W or %WO3) compared to an average
of 0.764% WO3 for the 308 ASARCO back samples and 1.204% WO3 for the 116 ASARCO face samples. If the
South Plainfield check samples were in %W the grade difference would still be large once converted to %WO3.
The possible explanation for the difference in grade could be related to the sample length as South Plainfield
may have sampled the entire drift as oppose to ASARCO, which sampled only the vein. The difference could
also be due to the analytical technique, which is not specified in the South Plainfield data. Unfortunately, there is
no recent or historical drill holes in the immediate vicinity of the drift which would allow for comparison of the
grade. Therefore, DGL elected not to use the South Plainfield assays in the resource estimate but
recommended Playfair to conduct a limited campaign of underground check sampling to confirm the grade of the
ASARCO samples.
14.1.3 Bulk Sample Assessment
For the bulk sample grade assessment, data was filtered within a corridor of +50 / -50 meter from the drift
elevation north of co-ordinates 5,271,650 N. The length weighted average grade for the bulk samples A and B
were compared to the length weighted grade of the intersection of the Number 10 Vein in drill hole GR-06-107.
Results indicated a bulk sample grade of 0.297% WO3 which compared well with the drill hole grade of 0.339%
WO3. This was not the case for bulk Sample E and F when compared with hole GR-08-115 which showed a
0.271% WO3 difference between the bulk sample grade of 0.610% WO3 and the drill hole grade of 0.339% WO3.
Despite the difference, DGL believes that the bulk sample grade is likely more representative of the vein grade
at the location the sample was taken, simply due to the sheer size of the sample and the fact that the bulk
samples would not be affected by the difficulty in sampling coarse wolframite in drill core.

GREY RIVER PROJECT PRELIMINARY ECONOMIC ASSESSMENT
March 14, 2012 Project No. 1114390003-001-R-Rev1 46
14.2 Geological Interpretation The 3D wireframes developed to control the grade interpolation of the resource model were based primarily
upon lithologies and partially on tungsten grades.
The geological wireframe was constructed using all drill hole intercepts within the quartz breccia vein typically
logged as Vein 10, Vein 6 or quartz vein. During the construction of the wireframe, continuous zones of
mineralization within Number 10 and Number 6 Vein favouring areas where the tungsten grade exceeded
0.05 WO3. In rare cases, exception was made to include lower grade intercepts to allow zonal continuity. The
wireframe model was also reconciled with the vein width in the ASARCO adit and the mapping of the vein on the
surface plan. The wireframe construction was carried out in multiple steps as follows:
The surface expression of the Number 6 and Number 10 as surveyed by ASARCO was digitized on a plan
view, and the contacts were elevated to the topographical surface.
Polylines describing the upper and lower contacts of the zones were digitized on the sections using the
lithology as the primary guiding principle.
The geological maps for the ASARCO exploration adit were geo-referenced in GEMS, and the geological
interpretation was digitized from these plans.
The digitized level plan polylines were connected to the sectional interpretation of the zone. Adjustment
and re-interpretation were made to the sections if needed.
The resulting plan and section polylines were both used to construct the wireframes.
The model was validated in 3D against the drill holes, and adjusted once more if necessary.
Accessory wireframe on the hanging wall of vein 10 was constructed if a minimum 3 drill intercepts on at least
2 sections with a minimum of 2 assay exceeding 0.2% WO3 were encountered. Of all the assays present on the
hanging wall, only one zone (Vein 10a) could be constructed following these guidelines.
In all cases, the vein model was drawn at the vein width as indicated by the drill or map data with no minimum
mining width added to the model.
Total un-diluted wireframe volume for the three wireframe constructed is shown in Table 14-3 below.
Table 14-3: Total Wireframe Volume
Vein Name Volume in Cubic Meter
Vein 10 507,668
Vein 6 40,660
Vein 10A 37,001
The topography surface was constructed using the CanVec topographical data obtained from the Ministry of
Natural resources, sheet 11P11 and merged with topographic contours originating from a 1"-200' scale map
dated September 14, 1957 that was geo-referenced and digitized.

GREY RIVER PROJECT PRELIMINARY ECONOMIC ASSESSMENT
March 14, 2012 Project No. 1114390003-001-R-Rev1 47
Figure 14.1 illustrates the model for the Grey River deposit.
Figure 14.1: Position of the 3-D wireframe volume with contours
14.3 Exploratory Data Analysis Exploratory data analysis is the application of various statistical tools to characterize the statistical behaviour or
grade distributions of the data set. In this case, the objective is to understand the population distribution of the
grade elements in the various units using such tools as histograms, descriptive statistics, and probability plots.
14.3.1 Assays
The raw assay statistics were evaluated by grouping all assays intersecting the Number 10, Number 10A and
Number 6 Veins. Statistical analysis compared the trench, back and faces samples with the limited drill core
assays, to verify whether a different sample type could be mixed with drill data and used in the resource
interpolation.
Figure 14.2 shows probability plots for the various raw data types.

GREY RIVER PROJECT PRELIMINARY ECONOMIC ASSESSMENT
March 14, 2012 Project No. 1114390003-001-R-Rev1 48
Figure 14.2: Population distribution of various sample types
The population distribution for trench, back, face and bulk samples all show higher grade than the drill hole
distribution. The face and back samples distribution is virtually the same therefore the face and back samples
were treated as one population in the remaining statistics presented in this report. For this study, the
explanation related to the higher grade seen in the face, back, trench and bulk sample population is unknown
but suspected to be an analytical procedure issue. It could also be attributed to the sample size because as
stated earlier in this report, the coarse wolframite mineralization is difficult to assay with small diameter core
drilling. The grade discrepancy could easily be resolved with limited re-sampling program by Playfair.

GREY RIVER PROJECT PRELIMINARY ECONOMIC ASSESSMENT
March 14, 2012 Project No. 1114390003-001-R-Rev1 49
The frequency distribution of all samples shows a near log normal distribution with 98% of the WO3% values
below 10%. Table 14-4 provides descriptive statistics for the underground back and face samples along with the
drill hole, trench and bulk samples for tungsten trioxide.
Table 14-4: Raw Assay Statistics (WO3)
All Sample
All DDH
Bulk Rock Trench Face + Back
All Type No10
All Type No 6
All Type
No10a
Valid Cases 543 99 12 2 11 424 520 12 11
Mean 0.813 0.456 0.954 0.650 0.875 0.884 0.838 0.151 0.321
Variance 3.496 0.652 0.418 0.029 0.549 4.274 3.628 0.040 0.295
Std. Dev. 1.870 0.808 0.647 0.170 0.741 2.067 1.905 0.201 0.543
Var. Coeff. 2.300 1.771 0.678 0.261 0.846 2.339 2.272 1.333 1.691
Minimum 0.000 0.000 0.120 0.530 0.000 0.000 0.000 0.003 0.005
Maximum 19.070 6.000 2.370 0.770 2.270 19.070 19.070 0.555 1.892
1st perc. 0.000 0.000 ---- ---- ---- 0.000 0.000 ---- ----
5th perc. 0.000 0.003 ---- ---- ---- 0.000 0.000 ---- ----
10th perc. 0.000 0.006 0.201 ---- 0.010 0.000 0.000 0.004 0.006
25th perc. 0.000 0.029 0.460 ---- 0.050 0.000 0.000 0.006 0.013
Median. 0.050 0.173 0.775 0.650 0.680 0.010 0.050 0.055 0.130
75th perc. 0.840 0.555 1.430 ---- 1.550 0.918 0.900 0.280 0.372
90th perc. 2.020 1.350 2.166 ---- 2.162 2.340 2.048 0.540 1.605
95th perc. 4.022 1.800 ---- ---- ---- 4.720 4.039 ---- ----
99th perc. 10.090 6.000 ---- ---- ---- 10.307 10.169 ---- ----
14.4 Capping A combination of decile analysis and a review of probability plots were used to determine the potential risk of
grade distortion from higher-grade assays. A decile is any of the nine values that divide the sorted data into ten
equal parts so that each part represents one tenth of the sample or population. In a mining project, high-grade
outliers can contribute excessively to the total metal content of the deposit.
Typically, in a decile analysis, capping is warranted if:
The last decile has more than 40% metal.
The last decile contains more than 2.3 times the metal quantity contained in the one before last.
The last centile contains more than 10% metal.
The last centile contains more than 1.75 times the metal quantity contained in the one before last.

GREY RIVER PROJECT PRELIMINARY ECONOMIC ASSESSMENT
March 14, 2012 Project No. 1114390003-001-R-Rev1 50
The decile analysis results shown in Figure 14.3 indicated that grade capping was warranted.
After conducting a careful examination of the data set, DGL elected to use an 8.5% WO3 cap value for all assays
prior to compositing. A total of 8 samples were capped.
14.5 Composite 14.5.1 Face and Back Sample De-clustering
The spatial locations of the face and back samples are not randomly or regularly spaced in relation to the entire
model. If data is preferentially sampled when it is spatially auto correlated, the resulting histogram from the
sample may not reflect the histogram of the entire population. For this reason, it is best to de-cluster the data.
The face and back samples were de-clustered using a "pseudo" polygonal technique.
Polygons were drawn to be between 5 to 10 meters in length along the drift with their boundaries targeted at
separating the high and low grade areas. No strict cut-off rule was used, the high/low grade areas were visually
estimated based on a color-coding of the sample values. All drift and back samples within the polygons were
length weighted average to produce one data point, located at the center of the polygon, for the block model
input file. This methodology is different than Wardrop where every fifth sample were used in the de-clustering
algorithm. There are two benefits to this methodology:
All samples are considered in the average.
The width of the sample is use as a weight maintaining the metal balance.
Figure 14.3: Decile analysis result

GREY RIVER PROJECT PRELIMINARY ECONOMIC ASSESSMENT
March 14, 2012 Project No. 1114390003-001-R-Rev1 51
A total of 40 polygons were digitized averaging 10.6 samples per polygons with a 3.1 standard deviation.
Samples were tagged with the polygon name, extracted into an XLS spreadsheet and the calculation of the
average grade was performed outside Gemcom using a pivot table.
14.5.2 Drill Hole Composites
The average width of the underground sampling is 1.12 m with a 0.55 standard deviation. On surface, the
trench and rock samples average 1.24 m with a 0.76 standard deviation. The drillhole sampling interval along
the vein averaged 1.03 m in core length with a 0.69 standard deviation and a upper third quartile value of
1.30 m. Due to the narrow vein width and the number of single point composites generated by the de-clustering
algorithm applied to the face and back samples, DGL elected to use a single vein composite for all drill holes
intersecting the wireframe.
Assays were length-weighted averaged across the entire intersection with the vein and any grade capping was
applied to the raw assay data prior to compositing. Gaps in sampling, if present, were composited at zero grade.
Once the composite file was populated with the drillhole composites, the surface and underground samples were
added to the file. Table 14-5 presents the composite statistics.
Table 14-5: Composite Statistics (%WO3)
All Sample
All DDH
Bulk Rock TrenchFace + Back
All Type No10
All Type No 6
All Type
No10a
Valid Cases 110 45 12 2 11 40 101 6 3
Mean 0.773 0.662 0.954 0.650 0.875 0.821 0.818 0.180 0.441
Variance 0.089 0.160 0.187 0.120 0.223 0.148 0.096 0.079 0.285
Std. Dev. 0.879 1.149 0.418 0.029 0.549 0.872 0.925 0.038 0.243
Var. Coeff. 0.938 1.072 0.647 0.170 0.741 0.934 0.962 0.194 0.493
Minimum 1.213 1.620 0.678 0.261 0.846 1.137 1.176 1.081 1.118
Maximum 0.000 0.000 0.120 0.530 0.000 0.000 0.000 0.006 0.084
1st perc. 6.000 6.000 2.370 0.770 2.270 3.490 6.000 0.504 1.004
5th perc. 0.000 ---- ---- ---- ---- ---- 0.000 ---- ----
10th perc. 0.000 0.000 ---- ---- ---- 0.001 0.000 ---- ----
25th perc. 0.005 0.003 0.201 ---- 0.010 0.004 0.005 ---- ----
Median. 0.137 0.095 0.460 ---- 0.050 0.127 0.144 0.009 0.084
75th perc. 0.465 0.263 0.775 0.650 0.680 0.429 0.550 0.124 0.236
90th perc. 1.123 0.836 1.430 ---- 1.550 1.425 1.150 0.358 1.004
95th perc. 1.875 1.620 2.166 ---- 2.162 2.319 1.967 ---- ----
99th perc. 2.604 3.024 ---- ---- ---- 3.404 2.803 ---- ----

GREY RIVER PROJECT PRELIMINARY ECONOMIC ASSESSMENT
March 14, 2012 Project No. 1114390003-001-R-Rev1 52
14.6 Bulk Density The available documentation for the ASARCO resource estimate suggests that a bulk density of 3.10 grams per
cubic centimetre (g/cc) was used. Wardrop calculated a predicted density of 2.71 g/cc based on the WO3%
values returned for the assays. The calculation assumed a quartz/wolframite mixed with no other mineral such
as fluorite, pyrite and scheelite. Based on the predicted value and experience with other similar deposit a value
of 2.8 g/cc was used by Wardrop.
In 2008, Playfair submitted 18 samples went to Eco Tech for density measurements and supplemented the
Eco Tech data with 40 additional field measurements.
The Eco Tech used approximately 50 grams of dry reject weighed into a dry phosphoric acid flask and the
weight was recorded. Reverse osmosis water was added to cover the sample and it is swirled to ensure
complete wetting of the sample and absence of all air. Once the sample has degassed, water was added to the
200ml line and then reweighed.
The field measurements used a conventional Ohaus Scout Pro balance. The balance was elevated and levelled
with a thin wire suspended from the hook beneath the balance. The sample was then weighed in air suspended
beneath the balance and weighed again suspended in a container of water. Playfair reported some difficulty
weighting the sample outside due to the sensitivity of the balance.
The average of 2.73 g/cc for the Number 10 Vein returned by the Eco Tech laboratory is lower than the field
measurement of 2.89 g/cc by Playfair. The difference is likely due to using reject as oppose to using full core
samples.
For the purpose of this resource estimate, an average bulk density of 2.81 g/cc that has been derived by
averaging all 21 Number 10 Vein samples (EcoTech and Playfair). Two outliers were omitted. Table 14-6
shows the data used in the bulk density determination.

GREY RIVER PROJECT PRELIMINARY ECONOMIC ASSESSMENT
March 14, 2012 Project No. 1114390003-001-R-Rev1 53
Table 14-6: Bulk Density Samples in Number 10 Vein
Hole # Meterage
(m) Material Type
Playfair(g/cm3)
Eco Tech (g/cm3)
Vn 10 (less Outliers)
(g/cm3)
GR-102 at 108.2m vein 10, approx 5% sulphides & wolframite 2.88 2.88
GR-103 at 155.1m vein 10, 5% sulphides and wolframite 2.90 2.90
GR-105 at 173.7m Vein 10, approx 1% wolframite 2.77 2.77
GR-105 at 172.5m sericitic alteration & vein 10, 1% wolframite 2.91 2.91
GR-106w at 111.0m quartz vein 10, <1% wolframite, 1% sulphide 2.66 2.66
GR-117 302.9-303.3 Quartz Vein (minor pyrite and wolframite) 2.64 2.64
GR-117 303.3-303.7 Quartz Vein (moderate wolframite) 2.78 2.72 2.78
GR-118 407.0-407.5 Quartz Vein (minor pyrite and molybdenite) 2.70 2.70
GR-119 350.7-350.95 Quartz Vein (heavy sulfide mineralization) 3.36 3.36
GR-119 352.5-352.75 Quartz Vein (moderate sulfide mineralization) 2.92 2.83 2.92
GR-122 295.3-295.5 Quartz Vein, 10-15% sulphides & WO3 3.22 3.22
GR-122 at 295.0 Quartz Vein, 30% sulphides & WO3 4.13
GR-124 252.0-253.0 Quartz Vein #10; with py, W, cpy & po 2.62 2.62
GR-124 253.0-254.0 Quartz Vein 10 (?) 2.60
GR-115 297.0-297.6 Quartz Vein 10 2.71 2.71
GR-115 298.2-299.0 Quartz Vein 10 2.61 2.61
GR-116 397.9-399.0 Quartz Vein 10 2.74 2.74
GR-117 302.8-303.8 Quartz Vein 10 2.61 2.61
GR-119 350.1-351.6 Quartz Vein 10 2.82 2.82
GR-119 351.6-353.1 Quartz Vein 10 2.68 2.68
GR-121 395.8-396.7 Quartz Vein 10 2.72 2.72
GR-122 294.7-296.0 Quartz Vein 10 2.91 2.91
GR-122 319.8-320.4 Quartz Vein 10 2.77 2.77
2.81
Cavey and Gunning (2006) used a bulk density of 2.8 g/cc for a resource estimate at the Panasqueira mine in
Portugal. At this deposit the wolframite is developed in sheets of flat-lying quartz veins. Mineralogically, this
mine is similar to the Number 10 Vein so the choice of 2.8 g/cc is deemed appropriate.

GREY RIVER PROJECT PRELIMINARY ECONOMIC ASSESSMENT
March 14, 2012 Project No. 1114390003-001-R-Rev1 54
14.7 Spatial Analysis Geostatisticians use a variety of tools to describe the pattern of spatial continuity, or strength of the spatial
similarity of a variable with separation distance and direction. The correlogram measures the correlation
between data values as a function of their separation distance and direction. If we compare samples that are
close together, it is common to observe that their values are quite similar, and the correlation coefficient for
closely spaced samples is near 1.0. As the separation between samples increases, there is likely to be less
similarity in the values, and the correlogram tends to decrease toward 0.0. The distance at which the
correlogram reaches zero is called the “range of correlation,” or simply the “range.” The range of the
correlogram corresponds roughly to the more qualitative notion of the "range of influence" of a sample; it is the
distance over which sample values show some persistence or correlation. The shape of the correlogram
describes the pattern of spatial continuity. A very rapid decrease near the origin indicates short scale variability.
A more gradual decrease moving away from the origin suggests longer-scale continuity.
Variography was conducted for the Number 10 Vein using Sage 2001 software. Directional sample
correlograms were calculated for tungsten in this single statistical domain along horizontal azimuths of 0, 30, 60,
90, 120, 150, 180, 210, 240, 270, 300, and 330 degrees. For each azimuth, a series of sample correlograms
were also calculated at 15° dip increments. Lastly, a correlogram was calculated in the vertical direction. Using
the complete suite of correlograms, an algorithm determined the best-fit model. This model is described by the
nugget (C0) which was derived using down hole variograms; one or two nested structure variance contribution
(C1, C2), ranges for the variance contributions and the model type (spherical or exponential). After fitting the
variance parameters, the algorithm then fits an ellipsoid to all ranges from the directional models for each
structure. The lengths and orientations of the axes of the ellipsoids give the final models of anisotropy.
In general terms, the variogram models were difficult to generate, due to the low point count. The "best"
variogram was obtained at azimuth 030 degree, dip 0 degree, which coincided fairly well with the overall
orientation of the Number 10 Vein indicating a range close to 50 meter. The remaining variograms were very
poor.
Due to the unreliable variogram analysis, the search parameters were defined with respect to the orebody
geometry.
The model was interpolated with a 3-pass scenario, the first pass was sized to reach at least the next drill
section spacing, along the main axis of the mineralization. A second and third multiplier was used to set the
subsequent search dimension for Pass 2 and Pass 3, leaving the ratio between the X Y and Z axis consistent
with the vein geometry.
Due to the undulating nature of the deposit, three sub-domains were delineated for the Number 10 Vein. The
sub-domains allowed for the rotation of the search ellipsoid, in order to optimize the sample search with the
orientation of the vein, without resorting to any unfolding methodology. This was not necessary for Number 10a
and Number 6 Vein.
Table 14-7 lists the final values used in the resource model for the range of the major, semi-major, and minor
axis.

GREY RIVER PROJECT PRELIMINARY ECONOMIC ASSESSMENT
March 14, 2012 Project No. 1114390003-001-R-Rev1 55
Table 14-7: Sample Search Parameters
Vein Sub-Domain GEM ZXZ
Range (Major, Semi-minor, Minor)
Pass1 (m)
Pass2 (m)
Pass3 (m)
No10 Vein
Sub Domain 1 -71,74,0 50, 50, 15 75, 75, 18 180, 180, 22
Sub Domain 2 -87,75,0 50, 50, 15 75, 75, 18 180, 180, 22
Sub Domain 2 90,-66,0 50, 50, 15 75, 75, 18 180, 180, 22
No 10A Vein N/A 90,-66,0 50, 50, 15 75, 75, 18 180, 180, 22
No 6 Vein N/A -75,67,0 50, 50, 15 75, 75, 18 180, 180, 22
14.8 Resource Block Model The block model was constructed using Gemcom’s GEMS version 6.3™ software. A non-conventional model
was considered for this deposit. The model would have a matrix of 1 single block along the model row of
100 m wide using the percentage ore to resolve the tonnage. However, due to the presence of the Number 10a
Vein in the hanging wall of the Number 10 Vein, and in consultation with the underground engineering team, a
conventional model using a matrix size 2 x 10 x 10 m was selected for mining selectivity considerations and the
density of the dataset. The model replicated the matrix used in the Wardrop study and allows for easier
comparison.
The block model was defined on the project coordinate system (UTM - NAD 27 ZONE 21) with a
30 rotation - counter clockwise. Table 14-8 lists the upper southeast corner of the model, and is defined on the
block edge.
Table 14-8: Block Matrix Definition
Vein and Fill Model Parameters
Easting 492,060
Northing 5,270,850
Top Elevation 300
Rotation Angle (counter clockwise) -30
Block Size (X, Y, Z) 2 x 10 x 10
Number of Blocks in the X Direction 260
Number of Blocks in the Y Direction 175
Number of Blocks in the Z direction 50
The rock type model was coded by combining the geology model code with the sub-domain code, controlling the
search ellipsoid orientation. The 1000 series code represents the Number 10 Vein, series 1100 the Number 10a
Vein and the 2000 series represents the Number 6 Vein. The sub-domains were simply assigned a code of
1 to 3. A block-model manipulation-script calculated the final rock type code by adding the sub-domain code to
the main geology code.

GREY RIVER PROJECT PRELIMINARY ECONOMIC ASSESSMENT
March 14, 2012 Project No. 1114390003-001-R-Rev1 56
14.9 Interpolation Plan The only element modeled are tungsten (as WO3%) and copper (as Cu%) using nearest neighbour and inverse
distance squared interpolation routines.
The interpolation was carried out in a multi-pass approach, with an increasing search dimension coupled with
decreasing sample restriction, interpolating only the blocks that were not interpolated in the earlier pass.
Pass 1 uses an ellipsoid search with 6 samples minimum, and 15 maximum.
Pass 2 uses an ellipsoid search with 4 samples minimum, and a 15 maximum.
Pass 3 uses an ellipsoid search with 2 samples minimum, and 15 maximum.
A maximum number of samples per hole did not apply in this model due to the single composite per holes per
vein.
Copper was interpolated similarly but used a minimum of 0.0001% Cu essentially discarding the data location
where copper was not assayed.
Number 10, 10a and 6 Veins were treated as hard boundaries to each other's meaning that only the samples
within the vein were used in the interpolation of that vein.
All sub-domain boundaries within the Number 10 Vein were treated as soft boundaries, allowing samples from
one sub-domain to be used in the interpolation of the adjacent sub-domain. This is the correct methodology,
since the sub-domains were only used to control the orientation of the sample search ellipsoids, and do not
correspond to any known lithological contact or fault.
No blocks were interpolated outside the wireframe and a series of special models were created to facilitate the
resource classification and validation of the model.
14.10 Mineral Resource Classification Several factors are considered in the definition of a resource classification:
CIM requirements and guidelines;
Experience with similar deposits;
Spatial continuity;
Confidence limit analysis; and
Geology.

GREY RIVER PROJECT PRELIMINARY ECONOMIC ASSESSMENT
March 14, 2012 Project No. 1114390003-001-R-Rev1 57
No environmental, permitting, legal, title, taxation, socio-economic, marketing or other relevant issues are known
to the author that may affect the estimate of mineral resources. Mineral reserves can only be estimated on the
basis of an economic evaluation that is used in a preliminary feasibility study of a mineral project, thus no
reserves have been estimated. As per NI 43-101, mineral resources that are not mineral reserves do not have
demonstrated economic viability.
The sampling density allowed Indicated and Inferred category. A block was considered indicated if the search
ellipse (pass 1) must have found at least six, and no more than 15, composites. In addition, the distance to the
nearest composite has to be less than 50 m. All other blocks were considered inferred.
A special Code 4 exists in the model. This non-reportable NI43-101 category is solely used for drill targeting and
to provide guidance to the exploration effort. Material in this category originated from the downgrading of
inferred material in the fringe of the deposit outside the core of the Number 10 Vein.
Following a discussion with Playfair and the statistical analysis of the raw assays, all blocks with an Indicated
category were downgraded to Inferred for the following reasons:
Face, back, trench and bulk samples are typically not as good of quality as drill core samples, due to bias
that can be introduced in the sampling process. In this particular case, due to recovery in the small
diameter historical drill core, one can argue that the face, back and especially the bulk samples may give a
more representative grade.
No original assay certificates for the face, back, bulk and trench sample program were found to validate the
grade of the samples.
There is a known issue regarding the low-grade assays from the South Plainfield check sample program
that remains to be investigated.
The lower grade in the drill core samples when compared to the historical surface and underground
samples. This is possibly related to the assay methodology that needs to be investigated further.
The difficulty of capturing a representative sample in the historical small diameter EX and AQ core.
Additional diamond drilling and an underground check sample program is required to improve the confidence
level of all categories in the model.
14.11 Mineral Inventory Tabulation Effective December 29, 2011 Desautels Geoscience Ltd (DGL) has estimated the mineral inventory for the Grey
River Property utilizing data from 52 diamond drill holes. The Mineral inventory estimate takes into account all
drilling information from the historical drill campaign conducted by ASARCO in the 60's and the more recent
drilling by Playfair Mining in 2006 and 2008. The drill data was supplemented with historical underground
channel and face samples, surface trench samples along with results from the ASARCO bulk sampling program.

GREY RIVER PROJECT PRELIMINARY ECONOMIC ASSESSMENT
March 14, 2012 Project No. 1114390003-001-R-Rev1 58
For the purpose of this report, an Inferred global mineral inventory is presented in Table 14-9 within the entire
Grey River deposit which includes material from the Number 10, 10a and 6 Veins combined. Tungsten prices
are usually quoted per metric ton unit ("MTU" = 10 kilograms or one hundredth of a metric tonne) of contained
tungsten trioxide (WO3). One MTU therefore contains 10 kilograms of WO3 or 7.93 kilograms of tungsten metal.
In the following tables, rounding of tonnes as required by reporting guidelines may result in apparent differences
between tonnes, grade and contained metal.
Excluding mineralization grading less than 0.2% WO3 over a 1.0 minimum mining width, the updated undiluted
mineral inventory indicated 1.2 million tonnes of Inferred mineralization grading 0.730% WO3 containing
18.8 million pounds of tungsten trioxide or 853,000 metric tonne units (MTU). The bulk of this tonnage is in the
Number 10 Vein which contained an Inferred mineral inventory of 1.06 million tonnes grading at 0.760% WO3 for
a total of 804,800 metric tonne units of tungsten trioxide as shown in table 14-9.
Table 14-9: Mineral inventory at 0.2% WO3 Cut-off.
WO3% Grade cut-off
Tonnage (T)
WO3
% WO3
lbs. WO3
MTU's
Vein 10 >= 0.2 1,060,000 0.760 17,743,000 804,800
Vein 10a >= 0.2 87,000 0.478 916,000 41,600
Vein 6 >= 0.2 22,000 0.320 155,000 7,000
Total 1,169,000 0.730 18,815,000 853,400
There is a possible copper credit that is not included in the mineral inventory since the metallurgical test work
done so far did not consider the extraction of copper and, there is a lack of copper assays in some of the
historical holes. DGL estimates the copper values could range between 0.13% and 0.14% as determined by
selecting the estimated copper grade in the model at the 0.2% and 0.5% WO3 cut-off and comparing this grade
to the average grade of the composites.
Table 14-10, 14-11, 14-12 and 14-13 show the global mineral inventory by veins with all mineralization grading
less than 0.2% WO3 over a 1.0 minimum mining width removed from the inventory.
The entire mineral inventory was subsequently exported to Golder's Engineering team for further economic
assessment.

GREY RIVER PROJECT PRELIMINARY ECONOMIC ASSESSMENT
March 14, 2012 Project No. 1114390003-001-R-Rev1 59
Table 14-10: Global Inferred Mineral Inventories
Vein WO3% Grade Cut-off
Tonnage (Tonnes)
WO3 grade %
Contained WO3
(pounds) WO3 MTU's
(Metric tonne units) **
No10 Vein No6 Vein No10a Vein
>= 4.0 7,000 4.656 691,000 7,000
>= 3.0 12,000 4.150 1,101,000 31,000
>= 2.0 28,000 3.153 1,972,000 50,000
>= 1.0 192,000 1.532 6,470,000 89,000
>= 0.9 269,000 1.365 8,084,000 293,000
>= 0.8 361,000 1.233 9,803,000 367,000
>= 0.7 458,000 1.130 11,407,000 445,000
>= 0.6 627,000 0.999 13,808,000 517,000
>= 0.5 796,000 0.905 15,894,000 626,000
>= 0.4 927,000 0.841 17,189,000 721,000
>= 0.3 1,058,000 0.781 18,210,000 780,000
>= 0.2 1,169,000 0.730 18,815,000 826,000
Table 14-11: Global Inferred Mineral Inventory (Vein No10)
Vein %WO3 Grade Cut-off
Tonnage (Tonnes)
WO3 Grade %
Contained WO3
(pounds) WO3 MTU's
(Metric Tonne Units) **
No 10 Vein
>= 4.0 7,000 4.656 691,000 31,000
>= 3.0 12,000 4.150 1,101,000 50,000
>= 2.0 28,000 3.153 1,972,000 89,000
>= 1.0 192,000 1.532 6,470,000 293,000
>= 0.9 260,000 1.379 7,902,000 358,000
>= 0.8 347,000 1.246 9,523,000 432,000
>= 0.7 439,000 1.141 11,051,000 501,000
>= 0.6 603,000 1.007 13,378,000 607,000
>= 0.5 765,000 0.912 15,375,000 697,000
>= 0.4 879,000 0.852 16,509,000 749,000
>= 0.3 987,000 0.797 17,351,000 787,000
>= 0.2 1,060,000 0.760 17,743,000 805,000
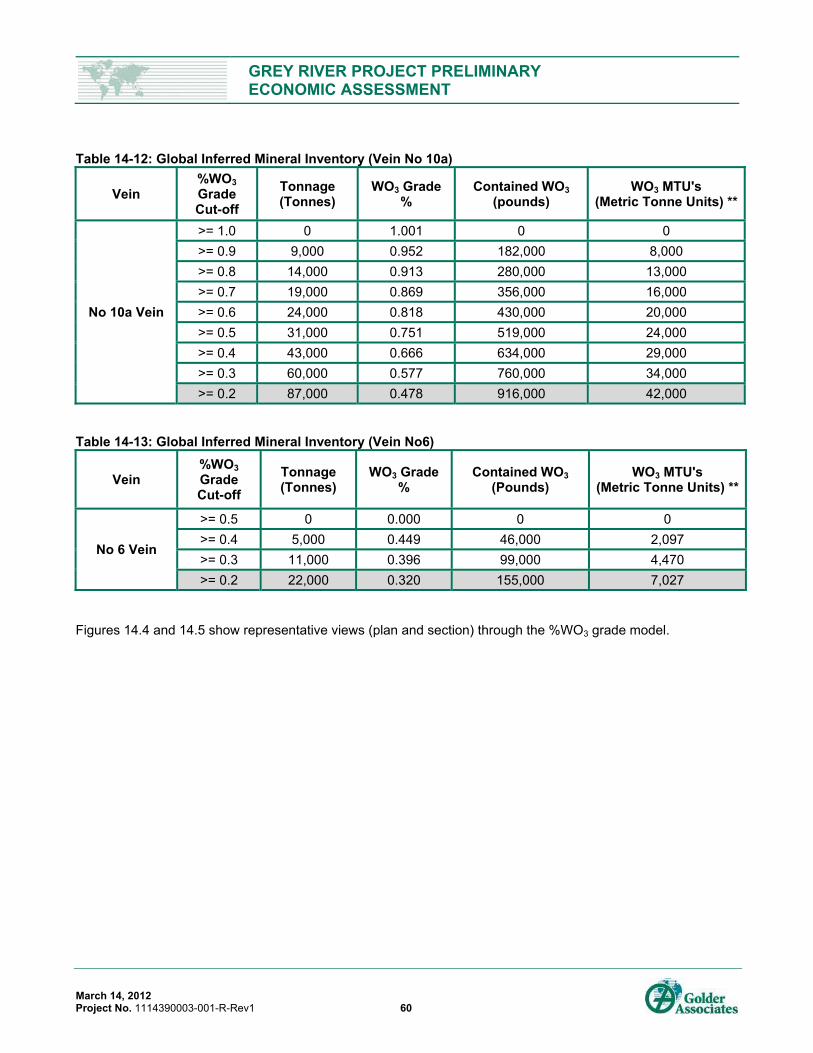
GREY RIVER PROJECT PRELIMINARY ECONOMIC ASSESSMENT
March 14, 2012 Project No. 1114390003-001-R-Rev1 60
Table 14-12: Global Inferred Mineral Inventory (Vein No 10a)
Vein %WO3 Grade Cut-off
Tonnage (Tonnes)
WO3 Grade %
Contained WO3
(pounds) WO3 MTU's
(Metric Tonne Units) **
No 10a Vein
>= 1.0 0 1.001 0 0
>= 0.9 9,000 0.952 182,000 8,000
>= 0.8 14,000 0.913 280,000 13,000
>= 0.7 19,000 0.869 356,000 16,000
>= 0.6 24,000 0.818 430,000 20,000
>= 0.5 31,000 0.751 519,000 24,000
>= 0.4 43,000 0.666 634,000 29,000
>= 0.3 60,000 0.577 760,000 34,000
>= 0.2 87,000 0.478 916,000 42,000
Table 14-13: Global Inferred Mineral Inventory (Vein No6)
Vein %WO3 Grade Cut-off
Tonnage (Tonnes)
WO3 Grade%
Contained WO3
(Pounds) WO3 MTU's
(Metric Tonne Units) **
No 6 Vein
>= 0.5 0 0.000 0 0
>= 0.4 5,000 0.449 46,000 2,097
>= 0.3 11,000 0.396 99,000 4,470
>= 0.2 22,000 0.320 155,000 7,027
Figures 14.4 and 14.5 show representative views (plan and section) through the %WO3 grade model.
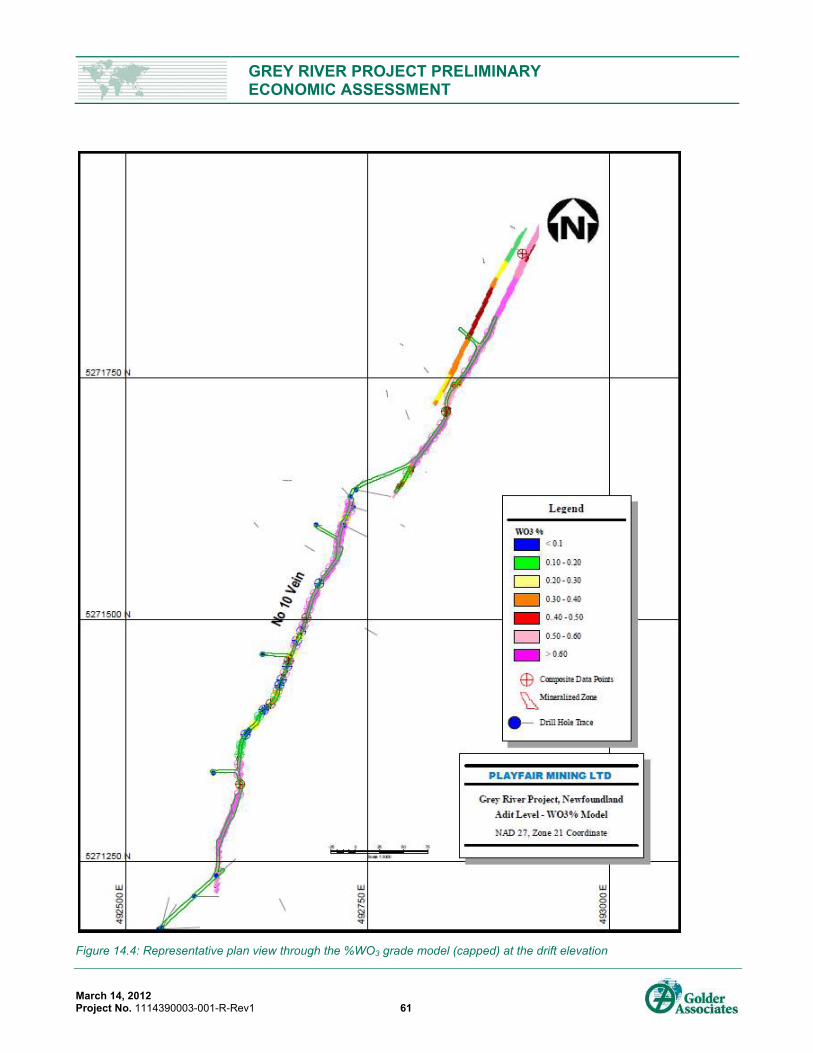
GREY RIVER PROJECT PRELIMINARY ECONOMIC ASSESSMENT
March 14, 2012 Project No. 1114390003-001-R-Rev1 61
Figure 14.4: Representative plan view through the %WO3 grade model (capped) at the drift elevation

GREY RIVER PROJECT PRELIMINARY ECONOMIC ASSESSMENT
March 14, 2012 Project No. 1114390003-001-R-Rev1 62
Figure 14.5: Representative section through the resource %WO3 grade model (capped)

GREY RIVER PROJECT PRELIMINARY ECONOMIC ASSESSMENT
March 14, 2012 Project No. 1114390003-001-R-Rev1 63
14.12 Mineral Inventory Validation The grade models were validated by five methods:
1) Visual comparison of colour-coded block model grades with composite grades on section plots.
2) Comparison of the global mean block grades for inverse distance, nearest neighbour models, and
composite and raw assay grades.
3) Comparison using grade profiles at 75 m spacing in the Y direction and 50 m spacing in the
Z direction, looking for local bias in the estimate.
4) Naive cross validation test with composite grade versus block model grade.
5) Model compared with previous estimate.
14.12.1 Visual Comparison
The visual comparison of block model grades with composite grades shows a reasonable correlation between
the values for the majority of the blocks. No significant discrepancies were apparent from the reviewed sections
and plans. The orientation of the estimated grades on the sections follows well with the projection angles
defined by the search ellipsoid.
14.12.2 Global Comparisons
The grade statistics for the raw assays, composites, nearest neighbour and inverse distance models were
tabulated in Table 14-14 and Figure 14.6 shows the differences. Statistics for the composite mean grade when
compared to the raw assay grade show a very small reduction in value attributed to the fact that the composites
were not diluted to a minimum mining width. It is also a result of the fact that the entire vein width is sampled
and the compositing process does not add any zero value from un-sampled interval. On a global basis,
regardless of the methodology employed for the interpolation, the un-diluted composite grade average of
0.818% WO3 is 20% higher than the interpolated grade of 0.667% WO3. More importantly, the grade of the
nearest neighbour and inverse distance at 0.00% WO3 cutoff are within 3.9% of each other, showing that no
global bias was introduced from the interpolation method used.
Table 14-14: Global Grade Comparisons at 0.00 Cut-off
Method %WO3 Capped
Raw Assays 0.838
Composite (un-diluted) 0.818
Nearest Neighbor 0.667
Inverse Distance 0.693

GREY RIVER PROJECT PRELIMINARY ECONOMIC ASSESSMENT
March 14, 2012 Project No. 1114390003-001-R-Rev1 64
Figure 14.6: Global grade comparison at 0.00% WO3 cut-off
14.12.3 Local Comparisons – Grade Profile
The comparison of the grade profiles (swath plots) of the raw assay, diluted composites and estimated grade for the main No. 10 Vein allows for a visual verification of an over or under-estimation of the model at the global and local scales. A qualitative assessment of the smoothing and variability of the estimates can also be observed from the plots. The output consists of three swath plots generated at 50 m intervals in the X direction, 75 m in the Y direction, and 50 m vertically for WO3 capped model.
The Inverse distance estimate should be smoother than the nearest neighbour estimate; thus, the nearest neighbour estimate should fluctuate around the Inverse Distance estimate on the plots, or display a slightly higher grade. The undiluted composite line is generally located between the assay and the interpolated grade if there are a significant number of composites. A model with good composite distribution should show very few crossovers between the composite and the interpolated grade line on the plots. In the fringes of the deposits, as composite data points become sparse, crossovers are often unavoidable. The swath size also controls this effect to a certain extent; if the swaths are too small then fewer composites will be encountered, which usually results in a very erratic line pattern on the plots.
Due to the elongated nature of the No. 10 Vein, the best orientations for the swath plots are in the Y and Z axis, since the X axis is oriented parallel to the strike of the deposit, which is not ideal. The Wardrop un-diluted block model grade from the 2006 NI43-101 report was also plotted for comparison.
In general, the swath plots show agreement between the two interpolation methodologies used, with no major local bias. The assay line on the plots should normally be position above the composite line. In the charts presented in this report, this is not always the case. The assay line crosses over the composite line. The areas in questions were investigated and issue originated from the uneven raw assay sample length which has not been length weighted for the plots. On the Y Chart, the Wardrop capped %W03 model grade follows a similar pattern to the 2011 undiluted vein grade line confirming the use of an un-diluted composite in the Wardrop model. The areas South of 5,270,000 on the Y chart and between -30 and 30 elevation on the Z Chart are influenced greatly by the addition of the underground channel samples in 2011. Unfortunately the data on the chart does not show a clear trend as to the effect of the additional samples on the resource. Grade profiles are presented in Figures 14.6 and 14.7.
0.200
0.300
0.400
0.500
0.600
0.700
0.800
0.900
1.000
Raw Assays Composite Undiluted Nearest Neighbour Inverse Distance
WO3%
All Lithologies at 0.00 Cut‐off
WO3% Cap

GREY RIVER PROJECT PRELIMINARY ECONOMIC ASSESSMENT
March 14, 2012 Project No. 1114390003-001-R-Rev1 65
14.12.4 Naïve Cross-Validation Test
This methodology can be described as a statistical approach to the visual comparison method. It compares the
average grade of the composites within a block with the estimated grade, which provides an assessment of the
estimation process similar to the measured data. Pairing of these grades on a scattered plot gives a statistical
evaluation of the estimates (see Figures 14.7 and 14.8). This methodology differs from "Jack-Knifing", which
replaces a composite with a pseudo block at the same location. Jack-Knifing evaluates, and compares the
estimated grade of the pseudo block against that of the composite grade.
It is anticipated that the estimated block grades should be somewhat similar to the composite grades within the
block, without being of exactly the same value. The procedure typically returns a better correlation with inverse
distance interpolation since the weights applied to the composite points are directly controlled by the distance of
the composite to the block center.
A high correlation coefficient will indicate satisfactory results in the interpolation process, while a low correlation
coefficient will be indicative of larger differences in the estimates and would suggest a further review of the
process. Results from the pairing of the composited and estimated grades within blocks classified as inferred
and pierced by a drill hole are presented in Figure 14.9. The R2 value shows a low correlation of 0.944 with no
outliers removed. The composite versus Inverse Distance regression equation residuals were evaluated, and
showed a distribution that is very slightly skewed positively.

GREY RIVER PROJECT PRELIMINARY ECONOMIC ASSESSMENT
March 14, 2012 Project No. 1114390003-001-R-Rev1 66
Figure 14.7: Y-axis swath plots for Vein 10 - Northing
0
2
4
6
8
10
12
14
16
18
0
0.5
1
1.5
2
2.5
5,270,670
5,270,720
5,270,798
5,270,871
5,270,927
5,271,029
5,271,083
5,271,168
5,271,237
5,271,316
5,271,384
5,271,457
5,271,531
5,271,598
5,271,678
5,271,749
5,271,827
5,271,891
5,271,946
Tonnes
Millions
WO3 (%)
Northing
Grey River ‐ Y Axis Swath Plotstonnage Assays UC Composite C NN_WO3 ID_WO3 WA_WO3
Area most influence by additional samples

GREY RIVER PROJECT PRELIMINARY ECONOMIC ASSESSMENT
March 14, 2012 Project No. 1114390003-001-R-Rev1 67
Figure 14.8: Z-axis swath plots for Vein 10 - Elevation
0
5
10
15
20
25
30
35
0
0.2
0.4
0.6
0.8
1
1.2
1.4
‐153
‐107
‐63
‐17
27
81
130
174
226
258
Tonnes
Millions
WO3 (%)
Elevation
Grey River‐ Z Axis Swath Plots
tonnage Assays UC Composite C NN_WO3C ID_WO3C WA_WO3C
Influence of UG drift (13.0

GREY RIVER PROJECT PRELIMINARY ECONOMIC ASSESSMENT
March 14, 2012 Project No. 1114390003-001-R-Rev1 68
Figure 14.9: Naive cross validation regression results
14.12.5 Model Compare with Previous Estimate
The current resource was compared with the Golder Associate, grade estimate from PEA study dated
January 15, 2008. The resource used in the PEA study replicated the resource published by Wardrop in
June 2007, authored by Chris Moreton.
As shown in Table 14-15 at the greater than 0.2% WO3 cut-off, the current global mineral inventory for vein 10,
10a and 6 returned 25% more pounds of metal that the Wardrop Resource. The grade is lower, 0.705% WO3 in
the current model versus 0.860% WO3 in the Wardrop study. The changes are attributed to the inclusion of one additional sampling plan in 2011, which negatively affected the grade in the area of the ASARCO underground
drift combined with the sample de-clustering methodology used.
Table 14-15: All Veins Compared to the Wardrop June 2007 Resource
Desautels Geoscience 2011 WARDROP NI43-101
Metal Diff.
(DGL-Ward.)
% Metal Change (DGL-
Ward.)/Ward.
WO3% Cut-off Tonnage
(tonnes) WO3 %
WO3
(lbs) Tonnage (tonnes)
WO3 %
WO3 (lbs) Vein 10,
10a and 6
>= 5.0 1,347 5.511 163,609 6,000 5.350 707,684 -544,075 -77%
>= 3.0 12,035 4.150 1,101,045 23,000 4.410 2,236,149 -1,135,104 -51%
>= 1.0 193,972 1.527 6,530,204 216,000 1.750 8,333,475 -1,803,271 -22%
>= 0.6 657,183 0.989 14,324,161 470,000 1.240 12,848,543 1,475,618 11%
>= 0.2 1,294,096 0.705 20,119,478 852,000 0.860 16,153,714 3,965,764 25%
0
1
2
3
4
5
6
0 1 2 3 4 5 6
Co
mp
-W
O3
%
Block Model - WO3 %
Data Y = -3.70433E-02 + 1.05429*X 95% Confidence (Data) 95% Confidence (Line)

GREY RIVER PROJECT PRELIMINARY ECONOMIC ASSESSMENT
March 14, 2012 Project No. 1114390003-001-R-Rev1 69
Since Wardrop only modelled the No. 10 Vein, Table 14-16 compares the change in resources for that vein
alone. At the 0.2% cut-off reported by Wardrop, the model returned 18% more metal, the tonnage increased by
39% or 331,000 tonnes. The grade was reduced by 0.130% WO3 from 0.860% WO3 in the Wardrop study to
0.730% WO3 in the current model. The change in grade is directly attributed to the inclusion of a new sampling plan in 2011 which affected the grade negatively in the area of the ASARCO underground drift south of
5,271,000. The additional tonnage originated from the increase in size of the model below the Adit level
originating from the new 2008 drill results.
Table 14-16: Vein 10 Compared to the Wardrop June 2007 Resource
Desautels Geoscience 2011 WARDROP NI43-101 Metal diff.
(DGL-Ward.)
% Metal Change
(DGL-
Ward.)/Ward.
%WO3 Cut-off Tonnage
T %WO3
WO3 Lbs
TonnageT
%WO3
WO3 Lbs Vein 10 Only
>= 5.0 1,347 5.511 163,609 6,000 5.350 707,684 -544,075 -77%
>= 3.0 12,035 4.150 1,101,045 23,000 4.410 2,236,149 -1,135,104 -51%
>= 1.0 193,967 1.527 6,530,092 216,000 1.750 8,333,475 -1,803,383 -22%
>= 0.6 633,328 0.995 13,894,071 470,000 1.240 12,848,543 1,045,528 8%
>= 0.2 1,183,059 0.730 19,036,720 852,000 0.860 16,153,714 2,883,006 18%

GREY RIVER PROJECT PRELIMINARY ECONOMIC ASSESSMENT
March 14, 2012 Project No. 1114390003-001-R-Rev1 70
15.0 UNDERGROUND MINING RESOURCES
15.1 Cut-off Grade The cut-off grade for the Grey River Project was determined from the key economic parameters including
production operating costs, metal price and milling recovery. The underground mining cost of $80 per tonne was
estimated using experience with other similar projects and the MineCost model for North American underground
mines as described in Section 20.1.1.
The milling cost used in the cut-off calculation is $11.50 per tonne milled and the derivation of this value is
described in Section 20.1.2. General and administration costs and concentrate shipment charges are estimated
to be $15 and $1 per tonne, respectively. These costs are also described in Sections 20.1.3 and 20.1.4,
respectively.
A metal price of $355 per Metric Tonne Unit (MTU), or $16 per pound, is used in this study for the base case
economic model. This value is shown in Figure 15.1 in relation to the three-year historic Tungsten APT prices as
derived from the Bloomberg website for the period December 2009 to December 2011 (bloomberg.com). The
prices at +30% ($465 per MTU) and -30% ($240 per MTU) are also shown on the Figure.
Figure 15.1: Three-year historic prices for Tungsten APT (USD/MTU). (bloomberg.com)
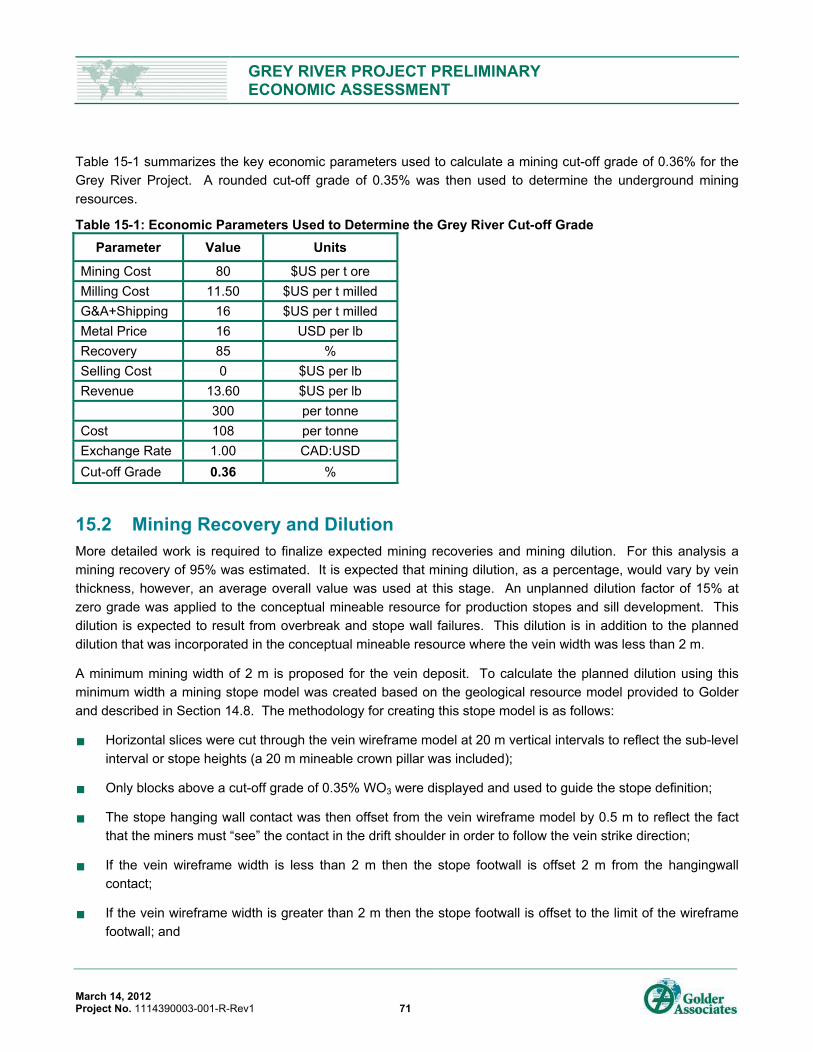
GREY RIVER PROJECT PRELIMINARY ECONOMIC ASSESSMENT
March 14, 2012 Project No. 1114390003-001-R-Rev1 71
Table 15-1 summarizes the key economic parameters used to calculate a mining cut-off grade of 0.36% for the
Grey River Project. A rounded cut-off grade of 0.35% was then used to determine the underground mining
resources.
Table 15-1: Economic Parameters Used to Determine the Grey River Cut-off Grade
Parameter Value Units
Mining Cost 80 $US per t ore
Milling Cost 11.50 $US per t milled
G&A+Shipping 16 $US per t milled
Metal Price 16 USD per lb
Recovery 85 %
Selling Cost 0 $US per lb
Revenue 13.60 $US per lb
300 per tonne
Cost 108 per tonne
Exchange Rate 1.00 CAD:USD
Cut-off Grade 0.36 %
15.2 Mining Recovery and Dilution More detailed work is required to finalize expected mining recoveries and mining dilution. For this analysis a
mining recovery of 95% was estimated. It is expected that mining dilution, as a percentage, would vary by vein
thickness, however, an average overall value was used at this stage. An unplanned dilution factor of 15% at
zero grade was applied to the conceptual mineable resource for production stopes and sill development. This
dilution is expected to result from overbreak and stope wall failures. This dilution is in addition to the planned
dilution that was incorporated in the conceptual mineable resource where the vein width was less than 2 m.
A minimum mining width of 2 m is proposed for the vein deposit. To calculate the planned dilution using this
minimum width a mining stope model was created based on the geological resource model provided to Golder
and described in Section 14.8. The methodology for creating this stope model is as follows:
Horizontal slices were cut through the vein wireframe model at 20 m vertical intervals to reflect the sub-level
interval or stope heights (a 20 m mineable crown pillar was included);
Only blocks above a cut-off grade of 0.35% WO3 were displayed and used to guide the stope definition;
The stope hanging wall contact was then offset from the vein wireframe model by 0.5 m to reflect the fact
that the miners must “see” the contact in the drift shoulder in order to follow the vein strike direction;
If the vein wireframe width is less than 2 m then the stope footwall is offset 2 m from the hangingwall
contact;
If the vein wireframe width is greater than 2 m then the stope footwall is offset to the limit of the wireframe
footwall; and

GREY RIVER PROJECT PRELIMINARY ECONOMIC ASSESSMENT
March 14, 2012 Project No. 1114390003-001-R-Rev1 72
The stope outlines on each 20 m vertical slice were then connected to form a single stope model solid.
The above methodology is depicted as a drawing in Figure 15.2 for vein widths less than, and greater than, the
minimum mining width of 2 m.
Figure 15.2: Methodology used to develop mineable LHOS stope shapes and dilution (planned and unplanned)
15.3 Underground Mining Resource The underground mining resource was determined using the mineral resources as presented in Section 14. The
DGL GEMS™ mineral resource block model was imported into Minesight™ software and a comparison of the
resources is tabulated in Table 15-2 at a 0.30% cut-off.
Table 15-2: Comparison of GEMS™ Mineral Resource Model to Minesight™ Model at a 0.30% Cut-off
Model Tonnes Grade, %WO3 Metal, Tonnes
DGL GEMS™ Model 1,157,700 0.759 8,785
Golder Minesight™ Model 1,158,689 0.759 8,791
Difference +0.09% -0.02% +0.06%

GREY RIVER PROJECT PRELIMINARY ECONOMIC ASSESSMENT
March 14, 2012 Project No. 1114390003-001-R-Rev1 73
The difference between the two models is less than ±0.1% and is considered acceptable.
The Minesight™ mineral resource block model is also shown in Figure 15.3.
Figure 15.3: The Minesight™ mineral resource model used to generate the underground mining resources (no cut-off).
To define the underground mining resource the overall stope shape envelope created using the process
described in Section 15.2 was divided into mining zones so that a preliminary production schedule could be
produced. Figure 15.4 illustrates these zones as they are applied to the stope envelope (0.35% cut-off) and
relative to the mineral resource model.

GREY RIVER PROJECT PRELIMINARY ECONOMIC ASSESSMENT
March 14, 2012 Project No. 1114390003-001-R-Rev1 74
Figure 15.4: Potential mining zones above a 0.35% cut-off (light blue zones)
The mining zones were then further assessed for proximity to mining access and Zones 1 and 7 were both
excluded due to their distance from the main ramp. Zone 7 would require either a separate portal and ramp or
excessively long LHD haul distances of over 350 m. Zone 1 is too small to justify developing waste access to
recover it. Finally, of the crown pillar (Zone 9), the portion above Zone 7 was also removed. The final
underground mining resource is shown in Figure 15.5.

GREY RIVER PROJECT PRELIMINARY ECONOMIC ASSESSMENT
March 14, 2012 Project No. 1114390003-001-R-Rev1 75
Figure 15.5: Underground mining resource zones used for mine design and economic analysis (Looking west and Zone 8 is offset to the west in front of Zone 4)
The final underground mining resource is also tabulated by zone in Table 15-3. These numbers were derived
from the stope model and include all material and metal within the defined stope zones. So, even material below
the 0.35% cut-off but within a defined stope shape would be included since, just as with waste material, there is
no practical way to separate this material in the mining process. All material within the stope envelope is sent to
the plant.
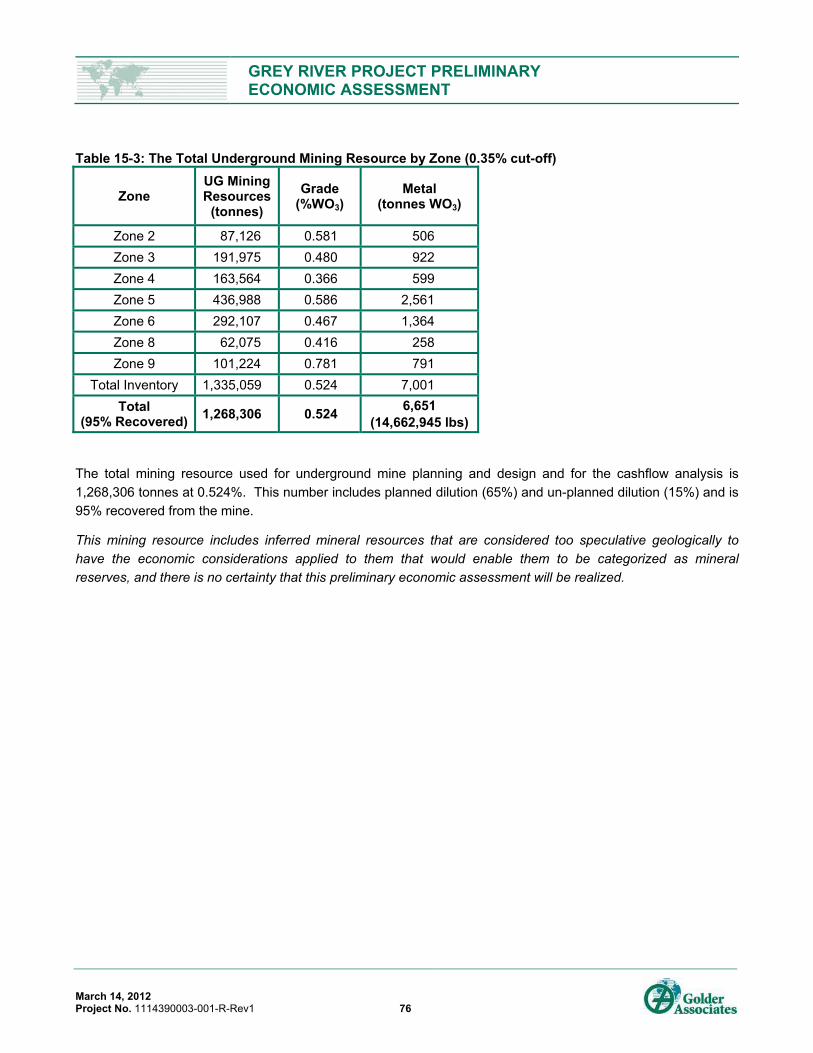
GREY RIVER PROJECT PRELIMINARY ECONOMIC ASSESSMENT
March 14, 2012 Project No. 1114390003-001-R-Rev1 76
Table 15-3: The Total Underground Mining Resource by Zone (0.35% cut-off)
Zone UG Mining Resources
(tonnes)
Grade (%WO3)
Metal (tonnes WO3)
Zone 2 87,126 0.581 506
Zone 3 191,975 0.480 922
Zone 4 163,564 0.366 599
Zone 5 436,988 0.586 2,561
Zone 6 292,107 0.467 1,364
Zone 8 62,075 0.416 258
Zone 9 101,224 0.781 791
Total Inventory 1,335,059 0.524 7,001
Total (95% Recovered)
1,268,306 0.524 6,651
(14,662,945 lbs)
The total mining resource used for underground mine planning and design and for the cashflow analysis is
1,268,306 tonnes at 0.524%. This number includes planned dilution (65%) and un-planned dilution (15%) and is
95% recovered from the mine.
This mining resource includes inferred mineral resources that are considered too speculative geologically to
have the economic considerations applied to them that would enable them to be categorized as mineral
reserves, and there is no certainty that this preliminary economic assessment will be realized.

GREY RIVER PROJECT PRELIMINARY ECONOMIC ASSESSMENT
March 14, 2012 Project No. 1114390003-001-R-Rev1 77
16.0 MINING
16.1 Geotechnical Limited geotechnical data is available for the Grey River deposit at this stage. A review of ground conditions
was completed by AMEC in December 2007 and concluded that the section of adit that was surveyed could be
classified as having a “fair” rock mass rating under the Q system (Q = 7.5). In general, the rock mass examined
is considered to be sound and was estimated to have an intact uni-axial compressive strength value of
approximately 210 MPa. Also, numerous half-barrels were observed throughout and there was rare evidence of
rockfall debris within the surveyed section (AMEC 2007). Sericitic alteration of wall rock is common on the
hanging wall side of the Number 10 Vein which will require further geotechnical investigation in relation to
maximum stope spans and potential for waste dilution. A more detailed geotechnical investigation and design
exercise must be done for the next level of study.
Since the deposit outcrops at surface, a crown pillar 20 meters thick is assumed for this preliminary design. This
pillar dimension is a conservative estimate based on the thickness of the mineralized zones at this elevation and
empirical design methods for crown pillar design. This 20 m width is up to 3 times the width of the widest stope
at the top of the deposit. It would also account for any weathered rock conditions and minimize any water inflow
from the ground surface. The crown pillar remains part of the overall mineable resource since it could likely be
mined to surface at the end of mine life. A more detailed geotechnical investigation and design exercise for the
mining of this crown must be done in future studies.
16.2 Mining Method The Grey River deposit is generally narrow-vein and steeply dipping with vein dip ranging from 70 to 80 degrees
as shown in Figure 16.1.

GREY RIVER PROJECT PRELIMINARY ECONOMIC ASSESSMENT
March 14, 2012 Project No. 1114390003-001-R-Rev1 78
Figure 16.1: Cross section of the Grey River deposit illustrating the typical dip of mineralization
A longitudinal blasthole open-stoping method using delayed backfill was selected as the preferred mining
method. Blasthole stope development would consist of sublevels on 20 metre vertical intervals (floor-to-floor).
Stope development would include sill drives along the mineralized zone using 2.5 m by 3 m drifts. Slot raises
would be developed in each stope panel to provide a free face for production blasting. As stated earlier in
Section 15.2, a minimum planned mining width of 2 meters is used for stope dimensions. At this stage, it is
envisaged that open stopes could be mined to three sub-levels high (60 meters) and around 15 meters along
strike. Stope widths would vary depending on actual vein widths and range from 2 m to 4.5 m. Stope
dimensions will have to be studied in greater detail as improved geotechnical data becomes available. A general
depiction of the proposed mining method is shown in Figure 16.2.

GREY RIVER PROJECT PRELIMINARY ECONOMIC ASSESSMENT
March 14, 2012 Project No. 1114390003-001-R-Rev1 79
Figure 16.2: The proposed longhole open stoping mining method (Atlas Copco)
Access will be available at every third sub-level from the main decline, or at 60 m vertical intervals. Small
longhole drills capable of drilling 64 mm diameter holes will be used to drill 18 m long holes along the vein
(at an average dip of 75 degrees). Holes would be charged with packaged emulsion explosive and 3 to 6 blast
rings will be blasted in sequence along the stope strike length, retreating from the outer regions of the deposit
towards the center access location. Where possible the ramp access levels are located around the midpoint of
each mining block to permit mining on both sides of the access. This is required to have up to 4 working fronts
required to obtain the proposed production rate.
Blasted material will be removed at every third sub-level, or every 60 meters vertically, using small and narrow
(1.5 m3) diesel-powered load-haul-dump (LHD) machines. These loaders will transport the material along the
sub-levels and out to a re-muck bay at the level access near the ramp. At this point, a larger loader (3 m3) will
re-handle this material and load it into 20-tonne haul trucks. These trucks will transport the material to surface
within the main decline and then to the plant site located near the portal. Waste material from mine development
will be handled similarly but will be trucked to a surface waste storage dump, also near the portal.

GREY RIVER PROJECT PRELIMINARY ECONOMIC ASSESSMENT
March 14, 2012 Project No. 1114390003-001-R-Rev1 80
16.3 Mining Rate The Grey River deposit has a narrow vein configuration that will limit the mining rate.
The proposed mining rate for the Grey River mine is 400 tpd or 146,000 tonnes per year. Figure 16.3 shows an
empirical relationship between the tpd mined and the estimated tonnes per vertical meter of the underground
mining resources. Another “rule-of-thumb” relationship is also plotted on Figure 16.3 and is based on a mining
“rule-of-thumb” indicating that a maximum of 15 cm of a deposit can be mined vertically per day. The mining
resources at Grey River have approximately 2,400 tonnes per vertical meter which translates to about 350 tpd
from Figure 16.3. The data point for the proposed mine production of 400 tpd is plotted on the figure.
Figure 16.3: Relationship between tpd mined and the deposit vertical tonnes per meter (McCarthy, 1993)
Based on this data, the proposed production rate of 400 tpd is reasonable at this preliminary level of study. To
obtain the proposed production rate it is estimated that a minimum of 4 workplaces will be required. These
workplaces include all mining activities; drilling, blasting, mucking, support and backfilling.

GREY RIVER PROJECT PRELIMINARY ECONOMIC ASSESSMENT
March 14, 2012 Project No. 1114390003-001-R-Rev1 81
16.4 Mine Design 16.4.1 Mine Layout
There is an existing underground adit at Grey River. It extends from Oceanside into the hillside within the host
rock and then traverses into and along the mineralized vein. This adit was developed by ASARCO between
1966 and 1969 as an exploration drift and has been used to obtain bulk samples from the deposit. The total
length of the drive is 1.9 kilometres and it has dimensions 2.5 meters by 2 meters. The mine plan uses the
waste portion of this drift to provide an exhaust ventilation airway, as well as a secondary egress from the mine.
Since the adit entrance is at the bottom of the cliff at Oceanside it would not be used for material haulage from
the mine. Instead, a new decline with dimensions 4 m by 5 m would be developed from the surface of the
deposit and down to the lowest mineralized extents to provide access for men, equipment and materials to each
sub-level. This decline would be developed at a grade of 15% (1:6.6) and would be suitable for truck haulage
using 20 tonne trucks (at dimensions 4.5 m by 4.5 m). Figure 16.4 shows an isometric view of the conceptual
mine development.
Figure 16.4: Conceptual mine development layout (looking northwest with no scale)

GREY RIVER PROJECT PRELIMINARY ECONOMIC ASSESSMENT
March 14, 2012 Project No. 1114390003-001-R-Rev1 82
Mining the conceptual resource could commence once the main decline reached about the 200 m elevation
(60 m below surface). At this point a bottom-up mining sequence could commence with trucks hauling
mineralized material to surface and then to the plant site. At this elevation, good quality pastefill would be placed
to permit mining from below. Mining on each sub-level will proceed from the outer extents inwards to the ramp
access. Due to the relatively shallow depth of the deposit, ground stress induced problems are not expected in
the final stopes (regional pillars) to be mined. However, this will require additional assessment at the next level
of study. The next mining front could commence from 60 m below the first one and so on until the mining
reached the bottom of the deposit. The ramp will be developed just in advance of mining.
The existing adit was considered for material haulage, however, the logistics of transporting material from the
adit opening, and up the cliffside to the plant site were deemed unsuitable for several reasons including cost,
exposure and visibility. For example, a cliffside hoisting system could be employed to move run-of-mine material
up the hillside to the plant site. If the adit were used for primary haulage then the main decline could be
developed smaller. This method would utilize raises within the deposit to transport mineralized material from the
mining horizons and down to the adit elevation. Alternatively, a small underground hoisting system could also be
used to move material to surface from the adit elevation. Trade-off studies on several possible material handling
options could be completed in the next study.
Development quantities have been estimated based on the mine plan presented above to access each
mineralized zone considered economically mineable. These quantities are summarized in Table 16-1. Sill
development within the veins will amount to 220,621 tonnes or about 17% of the total underground mining
resource. The majority of development waste will be hauled to surface and placed in a waste dump located near
the portal. Further assessment is required to assess a suitable location for this dump and the potential for acid
generation (Acid Rock Drainage, ARD) from this material on surface. Due to the planned mining and paste
backfill methods there will be limited opportunity to dispose of waste rock in the mined out stopes.
Table 16-1: Estimated Total Life-of-mine Development Quantities
Dimensions
(m)
Total Length
(m)
Total Tonnes
Main Ramp 4.5 x 4.5 2,555 129,547
Level Access 4 x 4 279 9,479
Ventilation Raise 2.5 383 5,598
Ventilation Raise Access 4 x 4 71 2,479
Re-muck Bays 4.5 x 4.5 71 2,479
Contingency 4 x 4 504 22,579
Total 3,358 172,161
Sills (in vein) (average) 2.5 x 3.5 10,080 220,621
Sills (in waste) (average) 2.5 x 3.5 680 15,290
Figure 16.5 shows a typical main level plan.

GREY RIVER PROJECT PRELIMINARY ECONOMIC ASSESSMENT
March 14, 2012 Project No. 1114390003-001-R-Rev1 83
Figure 16.5: Typical main level plan
16.4.2 Ventilation
Mine ventilation is designed as a “pull-system” where a surface fan at the top of a 383 m long ventilation raise (~2.5 m diameter) “pulls” fresh air through the ramp and sub-level drives. The ventilation raise is situated in proximity to the main decline to provide ventilation during the development phase. The existing adit will be used as an exhaust opening and exhaust air would be divided between the main vent raise and the bottom adit. As the main decline commences development a raisebore machine or Alimak crew will develop the ventilation raise from the existing adit level to surface. A ladder way system will be installed inside the raise to facilitate personnel movement. This raise will then be accessed (developed to) as the main decline and level access development advances downward. This connection to the existing adit tunnel also provides a secondary egress for the mine before the main ramp also reaches the adit tunnel
Ventilation along the sub-levels will be done using smaller auxiliary fans and ventilation ducting that will flush ventilate to the ends of these drives. About 30 m3/s of fresh air is required on each producing sub-level, sufficient for one 3 m3 LHD and a truck. Total mine ventilation requirements would be expected to be in the range of 100 m3/s (215,000 CFM) based on the diesel-powered mobile equipment needs (factored for utilization). The total un-factored estimate is 120 m3/s. The estimate for air requirements is tabulated in Table 16-2.

GREY RIVER PROJECT PRELIMINARY ECONOMIC ASSESSMENT
March 14, 2012 Project No. 1114390003-001-R-Rev1 84
Table 16-2: Estimated Total Mine Air Ventilation Requirements
Area Equipment Size Quantity Engine Size
(kw) Utilization
Ventilation Demand (m3/s)
Development Jumbo Single boom 2 110 33% 4.6
LHD 1.5 m3 1 72 65% 3.0
Truck 20 t 1 375 100% 23.6
Production LHD 1.5 m3 1 72 65% 3.0
LHD 3 m3 1 150 65% 6.1
Truck 20 t 1 375 100% 23.6
Service Vehicles
Scissor Lifts 2 110 50% 6.9
Grader 1 110 50% 3.5
Jeeps 3 110 65% 13.5
Contingency 15% 13
Total (m3/s) 100
Total (cfm) 215,000
* Ventilation factor used = .063 m3/s/kwhr (100 cfm/bhp)
16.4.3 Backfill
With limited geotechnical data or experience it is assumed that backfill will be placed in mined open stopes. The
fill would act to stabilize stope walls, permit 95% recovery without leaving pillars, and provide regional stability to
the mine. It would also keep stope mucking areas to a manageable size with less risk to, and more efficient use
of, remote underground loaders. A preferred backfill material would be a cemented pastefill produced from the
mill tailings. Further investigation and testwork will be required to confirm that the tailings are suitable for
producing a pastefill. A paste backfill plant would be constructed on surface above the deposit and a pipeline
would be used to deliver the paste to the mined stoping blocks as required. It is expected that 50% of the mill
tailings could be sent back underground. This has the added benefit of reducing the size of the surface tailings
deposition site.
16.4.4 Mobile Equipment
The mobile equipment requirements for the underground mine are listed in Table 16-3. This equipment is
specified for narrow vein mining and is sized to fit within the drift dimensions presented in Section 16.4.1. The
drilling equipment and small LHD’s will need to be hoisted through raises onto captive sub-levels.

GREY RIVER PROJECT PRELIMINARY ECONOMIC ASSESSMENT
March 14, 2012 Project No. 1114390003-001-R-Rev1 85
Table 16-3: Underground Mobile Equipment Requirements
Area Equipment Size Quantity
Development Jumbo/Long Tom
Single boom 2
LHD 1.5 m3 1
Truck 20 t 1
Production LHD 1.5 m3 1
LHD 3 m3 1
Truck 20 t 1
Service Vehicles
Scissor Lifts 2
Grader 1
Jeeps 3
16.4.5 Stationary Equipment
Stationary equipment and installations in the underground mine workings includes items such as fans, pumps,
electrical distribution and pastefill line. A list of items is provided in Table 16-4.
Table 16-4: Underground Mine Stationary Equipment Requirements
Equipment Size Quantity
Electrical Distribution System
n/a 1
Pumps 11 – 45 kW 4
Main Fan 200 kW 1
Auxiliary fans 55 kW 4
Portable Refuge Chamber
16 person 2
Pastefill Line 400 m 2
16.5 Labour Total site labour is estimated to be approximately 106 persons with 84 in the mine, 10 in administration and 12 in
the plant. 32 persons are staff and 74 are hourly. The estimate is based on 24 hour/7 days per week schedule
using a four-shift-on and four-shift-off crew rotation (two shifts per day). Some staff labour would be one shift per
day only (engineering, office, etc).

GREY RIVER PROJECT PRELIMINARY ECONOMIC ASSESSMENT
March 14, 2012 Project No. 1114390003-001-R-Rev1 86
16.6 Mine Production and Development Schedules Detailed mine production and development schedules have not been generated for this preliminary study. The mine production schedule assumes 400 tpd for 365 days per year for 146,000 tonnes per annum. The plan is to commence mining in the upper levels in Zones 2, 6 and then 3. Then in Year 5, Zone 5 and 8 begin and Zone 4 commences in Year 6. The crown pillar, Zone 9, starts in Year 5 and continues until the end of mine life, Year 10. The grades associated to each zone were used to develop the preliminary schedule that generated the cashflow.
Mine development is completed as mining progresses downwards. That is, the main decline is extended below the current mining horizon in order to establish sills in the next stopes down. Main level access, re-mucks and ventilation access drifts are completed as the ramp descends. The main ventilation raise would be developed from the adit drift to surface when the main decline development starts. Then the raise would be developed into at each main access as the ramp descends. This will establish flow-through ventilation as each mining level is developed.
16.7 Mine Services The underground mine will require compressed air and mine dewatering infrastructure in addition to the items
listed below. The design of these items was not completed for this study.
Secondary Egress
Each mining zone requires two exit points; one main access/egress and the other in case of emergency. The
mining zones are designed with ramp access and a ventilation raise connecting each main level. In addition,
there will be small raises within the stopes and between sub-levels for personnel and equipment access.
Secondary egress of the underground will be possible through the FAR down to the existing adit tunnel and then
via the main ramp once it advances down to connect to the adit tunnel.
Refuge Stations
Portable refuge stations equipped with communications, emergency supplies and battery power will be positioned at a suitable location central to the mining activity. It can be re-located as mining progresses through the mine life. Two 16-person chambers will suffice for the underground workforce during one shift.
Shop
All of the major equipment repairs and routine maintenance will be handled by a shop on surface. The shop will share duties between the underground and surface equipment. A small repair bay will also be developed at a central underground location for small repairs and breakdowns.
Underground Communication
Communications underground will be through a leaky feeder radio system that will be installed in the main and
internal ramps. At suitable locations (electrical substation, refuge stations) hard wired telephones will be also be
installed.

GREY RIVER PROJECT PRELIMINARY ECONOMIC ASSESSMENT
March 14, 2012 Project No. 1114390003-001-R-Rev1 87
17.0 PROJECT INFRASTRUCTURE
17.1 Site Layout Description An isometric drawing of the proposed site layout is shown in Figure 17.1 and a plan view of the site layout is provided in Appendix C.
Figure 17.1: Isometric view of the Grey River project site infrastructure and underground mine workings (no scale)
The operation will be primarily travel-in, travel-out (with the exception of any local Grey River labour) with a camp and cafeteria on-site for all personnel. An access road is proposed from the community of Grey River to the top of the plateau where the site is located. This road will be about 2 km long at grades less than 10%. Other site access roads include access to the tailings facility, camp, plant site and mine portal. The total length of roads required is about 7 km.
Portable water, process water and water for other uses is required and will be drawn from nearby rivers and lakes. There is a Protected Water Supply nearby that is designated and regulated by the Provincial government. This approximate area is highlighted on the site plan figure. Overall site water management and hydrology studies will be needed at the next level of study.
All maintenance of mobile equipment will be done in a surface shop situated near the plant facility. A general warehouse will stock all materials required by the whole operation. An office building is required for managerial, administrative and technical personnel. First aid, training and security rooms are attached to the main building. A change house will be constructed for personnel lockers and a mine dry.

GREY RIVER PROJECT PRELIMINARY ECONOMIC ASSESSMENT
March 14, 2012 Project No. 1114390003-001-R-Rev1 88
17.2 Electrical Power System and Site Distribution The overall site power requirement is estimated to be about 2 MW with 1 MW for the underground mine, of which
about half is needed for mine ventilation fans. The remaining 1 MW would supply the plant, camp and offices.
For this study it is assumed that site power is generated on-site using diesel-powered generators. There is
potential to tap into the power supply for the community of Grey River or to develop local hydro-electric
generation. These options will require further study.
17.3 Other Site Facilities A compressed air plant will be needed for the plant, mine and maintenance shops. Most underground mobile
equipment will be diesel-powered, electro-hydraulic-type with on-board compressors. Underground operations
and facilities will require a nominal supply of compressed air.
17.4 Waste Dumps A 250,000 tonne waste dump (assuming a 30% swell factor) is situated close to the portal and will be used to
permanently store underground development waste. There have been no acid mine drainage studies completed
to date and an assessment of this waste material will be required.
17.5 Stockpiles A small incremental stockpile will be located near the plant site. This is material that is excavated to access
economic underground stope material, is below the economic mining cut-off, but is above the milling
cut-off. It could be milled as low grade material at the end of mine life.
17.6 Tailings Management Facility A tailings management area (TMA) will be required for the tails that are not sent underground as paste backfill.
A possible location for these tails is identified on the site plan, however, no studies were done by Golder or
others to confirm a suitable TMA. A conceptual tailings pipeline is also shown to transport the tails from the mill
site to the TMA. It is estimated that there will be approximately 500,000 cubic meters of tails over the life of mine
(assuming that 50% of the tails are sent underground as backfill).

GREY RIVER PROJECT PRELIMINARY ECONOMIC ASSESSMENT
March 14, 2012 Project No. 1114390003-001-R-Rev1 89
18.0 MARKET STUDIES AND CONTRACTS More than 20 tungsten-bearing minerals are known, but the principle minerals to produce ammonium
paratungstate (APT) powder and tungsten metal powder are wolframite (the Grey River material), ferberite, and
scheelite. The Grey River tungsten-bearing mine material will be upgraded to a concentrate on-site which will be
shipped to an APT plant. Then it will be reduced to tungsten metal powder and further processed into tungsten
carbide powder or ferrotungsten. Tungsten is produced from APT by reduction using hydrogen, followed by a
second step using aluminum, potassium and silicon. The metal is then washed with hydrochloric acid and cast
into ingots. End uses of tungsten include metalworking, mining, construction machinery and equipment,
electrical and electronic machinery and equipment, transportation, lamps and lighting and chemicals.
The following section is from the website roskill.com and is a summary of their report titled “Tungsten: Market
Outlook to 2016 (10th edition)” (August 2011):
“The tungsten market in the 1990s was characterised by oversupply from China and low prices, which meant
that most western producers ceased production as prices were well below costs of production. However, in
2000 the Chinese government began the process of controlling its tungsten industry through the imposition of
production and export quotas, and the removal of export rebates on tungsten products.
Over the years of excess supply, stockpiles of tungsten were built up by producers and also governmental
organisations. These stockpiles overhung the tungsten market and tended to act as a brake on price rises.
Most of the material contained in these stockpiles has now been sold and trends in tungsten prices have
correlated more closely to the underlying supply/demand fundamentals since 2005/2006. Tungsten prices have
risen strongly throughout 2010 and most of 2011, as most of the economies outside China recovered from the
credit crisis-induced recession and demand for tungsten increased in parallel. At the end of September 2011,
prices for Chinese APT had reached US$450-460 per metric tonne unit (MTU), compared to US$330 per MTU at
the beginning of the year and US$200 per MTU at the beginning of 2010. APT prices are now well above the
levels that were last seen in June 2005, when APT peaked at US$300 per MTU.
The outlook for the tungsten market is relatively positive as demand is expected to increase at almost 6%py to
2016, driven on by strong growth in China. Supply of tungsten will struggle to match demand growth at least
until 2013, when some of the potential tungsten-producing projects are expected to begin production. However,
any delays in commissioning of these projects would quickly see a growing deficit in the market with a resultant
upward pressure on prices.
Very few of the significant new tungsten projects are expected to deliver any substantial tonnages of tungsten in
2012, so the market will be relying on existing producers to cope with any growth in demand. As a result, Roskill
predicts a further tightening in supplies of tungsten and, therefore, further price rises, with an average APT price
of US$475 per MTU. It is possible that the market will test the US$500 per MTU level at some point in 2012.
Prices are then expected to ease between 2013 and 2015 as the bulk of planned new tungsten production
capacity is expected to enter the market. Demand for tungsten is expected to continue to grow to 2016 and
beyond, putting further pressure on the supply side and requiring more new capacity.”
Playfair Mining Ltd. currently does not have any contracts to sell metal from the Grey River Project as it is still
early in the development stages of the project. It is assumed in this study that tungsten concentrate, grading
65% WO3, will be produced and shipped to an APT plant in either Europe or the American mid-west.

GREY RIVER PROJECT PRELIMINARY ECONOMIC ASSESSMENT
March 14, 2012 Project No. 1114390003-001-R-Rev1 90
19.0 ENVIRONMENTAL STUDIES, PERMITTING, AND SOCIAL OR COMMUNITY IMPACT
This section of the report was completed by Bruce Bennett of Stantec Limited who visited the Grey River project
site in 2007.
The specific requirements for environmental assessment will ultimately be determined by the scope of the
project, known, or assumed, environmental sensitivities, and public and stakeholder response to the project
information in the registration document.
The following sections are provided to indicate what could be involved at different stages of the project.
19.1 Identification of Potential Issues and Baseline Studies Following is a list of potential issues, in no particular order that could be raised in the environmental assessment
process for the proposed project:
Historic resources;
Fish and fish habitat (freshwater);
Fish and fish habitat (marine);
Water resources (quality and quantity);
Rare plants;
Migratory birds (waterfowl and songbirds);
Raptors;
Vegetation/habitat type classification;
Species at risk;
Big game (moose, caribou, and black bear);
Furbearers (otter, mink, Arctic hare, and others);
Socio-economic environment; and
Air quality.
GREY RIVER PROJECT PRELIMINARY ECONOMIC ASSESSMENT
March 14, 2012 Project No. 1114390003-001-R-Rev1 91
Of these, we anticipate that baseline data will need to be collected for:
High Probability
Fish and fish habitat (freshwater and marine);
Water quality and quantity, and pond bathymetry (for proposed tailings/ sedimentation ponds if they are
natural waterbodies);
Historic resources (marine archaeology);
Migratory birds (waterfowl and songbirds); and
Rare plants.
Lower Probability
Big game (caribou, moose and black bear); and
Raptors.
The required level of effort will vary by issue and the project description will influence the profile of any issue.
19.2 Primary Issues Two primary issues apply under most circumstances. The scope is determined by the size and extent of the
proposed project.
19.2.1 Water Quality and Quantity
Detailed information is required on stream flow and the hydrological regime of water bodies that will be affected
by the proposed project. This would apply to any requirements for water withdrawal or water releases.
The provincially protected water supply for the community of Grey River will require careful consideration and
cannot be impacted by the project.
Water quality sampling should be conducted on a regular or seasonal basis. Water samples should be analyzed
for metals, mercury, nitrate, total organic carbon, sulphate, ammonia, total suspended solids and pH. The list
could be reduced or expanded following a review of the initial sample results. It is recommended that baseline
water quality conditions be documented by monthly or at least quarterly water sampling, pending discussions
with government agencies. Sampling may be conducted by Playfair or by others if independent data collection is
preferred. Either way, standard procedures for collection and analysis of samples will need to be followed.

GREY RIVER PROJECT PRELIMINARY ECONOMIC ASSESSMENT
March 14, 2012 Project No. 1114390003-001-R-Rev1 92
19.2.2 Fish and Fish Habitat, and Pond Bathymetry
Current information on fish and fish habitat will be required for the environmental assessment and for the
determination of harmful alteration, disruption or destruction (HADD) of productive habitat. This will apply to the
marine area (if there is to be wharf construction or extension) and the ponds and streams at the top of the hill in
areas to be developed for mining or processing.
A fish and fish habitat study for all affected water bodies would involve a review of available fisheries information
followed by field studies as required. Potential field studies include determination of quality and quantity of
stream habitat, (including water flow (depth and velocity) and substrate), and pond habitat. Sampling and
surveys in July, August and September would likely represent natural seasonal hydrological variations at the
project site.
Fish sampling in freshwater would consist of spot electrofishing selectively conducted at different locations in
streams to determine the presence of fish and an indication of size class and areas of recruitment if fish are
present. Index electrofishing (where the time fished is recorded and fishing effort is confined to a localized area)
could be used to establish a comparative indication of fish density (i.e., standing stock). Short-term (tended) or
overnight gillnet sets are conducted in ponds for the same purpose. Fish sampling would be conducted in
July or August. Electrofishing is not permitted before 15 June, because fingerlings are still in the substrate and
unable to swim about. To protect the breeding stock, electrofishing is not permitted during fall spawning. Areas
that can be gillnetted are also restricted during the fall spawning period (after mid-September).
Surveys in the marine environment may be limited to visual surveys of the substrate (visual in shallow water and
ROV or scuba in deeper water). This depends on the proposed activities in the marine environment and the
presumed sensitivity of the area that will be affected. To determine fish (including shellfish) presence, sampling
can be conducted or local informant knowledge can be obtained to characterize fish presence on a seasonal
basis.
Marine aquaculture and marine fisheries, if present in the area will have to be considered from the
perspective of potential disturbance by shipping or other activities and of potential for contaminant release
(TSS, chemicals, fuel).
If Fisheries and Oceans Canada (DFO) determine that there will be a HADD (e.g., as a result of a tailings basin
or marine wharf), compensation is usually determined on an area basis or sometimes on a productive capacity
basis. Corresponding information will be required for the final determination of HADD and compensation.
Habitat will be quantified using DFO guidelines and procedures that include bathymetry, substrate, flow and
aquatic vegetation characterization. The HADD will be quantified on the basis of what is there and how much
the Project will change things, based on the final project description.
19.2.3 Historic Resources (Stage 1)
While it may be unlikely that on-land archaeology surveys will be required, any proposal to infill marine areas for
wharf construction could require an assessment of the potential for historic resources. There may be a
requirement for surveys.

GREY RIVER PROJECT PRELIMINARY ECONOMIC ASSESSMENT
March 14, 2012 Project No. 1114390003-001-R-Rev1 93
19.2.4 Rare Plants
A survey for rare plants within areas that would be affected by the project footprint might be required. Unique or
rare vegetation communities and other areas with high potential to support rare plants would be targeted within
the areas that would be physically disturbed. This work would need to be completed in mid-July to mid-August.
The South Coast vegetative communities have been poorly studied, so it is difficult to judge the potential for
issues at this stage.
19.3 Secondary Issues These issues are no less important than those listed above; however, a smaller scale project (in size and extent)
may not trigger a need to investigate original research or surveys on some of these issues. Some issues would
likely be addressed through desk-top exercises and meetings with stakeholders and local informants.
19.3.1 Vegetation/Habitat Type Classification
To understand the existing environment and to assess the potential environmental effects of the proposed
project on the terrestrial environment, terrestrial habitat classification might be required. The classification would
be used to assess the relative availability of various habitat types in the region and within the area of the
proposed project footprint. The classification would also be used to determine the scope of rare plant surveys
and migratory bird surveys. Any existing vegetation inventory could be augmented by aerial photography and
ground-truthing, as required.
19.3.2 Migratory Birds and Raptors
The proposed project may disturb habitat that provides nesting and forage for migratory birds. It is likely that a
ground-based survey for songbirds (passerine birds), and an aerial survey for nesting raptors, particularly osprey
and bald eagle, and waterfowl will be required. Surveys for migratory birds would need to be completed from
mid-May to mid-June and from mid-June to July for raptors.
19.3.3 Species at Risk
There are species listed under the Species at Risk Act (SARA) and the provincial Endangered Species Act that
may use habitat within the project area. Under Section 33 of SARA, damage or destruction of the residences of
a species that is listed as endangered or threatened is prohibited. However, the minister having authority can
enter into an agreement or issue a permit to engage in an activity affecting a listed wildlife species. Similar
restrictions are identified under provincial legislation and would apply on all Crown lands. The implication of
these Acts with respect to development of the proposed project would depend on the results of baseline data
collection for listed species and the assessment of project effects. The need for dedicated baseline data
collection for SARA species is not anticipated; however, this should be confirmed through the proposed
consultation with the Inland Fish and Wildlife Division and Canadian Wildlife Service.

GREY RIVER PROJECT PRELIMINARY ECONOMIC ASSESSMENT
March 14, 2012 Project No. 1114390003-001-R-Rev1 94
19.3.4 Big Game
There could be a requirement to assess potential effects on big game in the area, particularly for activities on the
plateau. Focus could be on moose and caribou, but may also include black bear.
Moose
Moose would be present in suitable habitat throughout the area. The most sensitive issue with moose would be
disturbance to wintering yards (areas where moose congregate during the deep snow periods). These are
generally within forested areas and offer shelter and regenerating balsam fir for forage. It is assumed that a
large amount of forested area will not be removed as a result of the project. However, if a large forested area is
proposed to be removed, a winter aerial survey for moose yards may be required. Such a survey would be
conducted in late February.
Woodland Caribou
The area of the proposed project is east of the identified range of caribou from the Buchans Plateau. Boreal
woodland caribou are listed as Threatened under Schedule 1 of the SARA. However, under the provincial
Endangered Species Act, only Labrador woodland caribou populations are listed as Threatened. Regardless,
caribou populations on the Island are managed for hunting and are considered sensitive to disturbance during
critical periods of their life cycle. Therefore, a requirement to consider caribou in an environmental assessment
is likely.
The South Coast Barrens provides wintering habitat for caribou from the Middle Ridge and Sandy Lake/Grey
River areas. Consultation with the Inland Fish and Wildlife Division would be required to determine the latest
distribution information for caribou. The likelihood that a field program will be required may depend on the size
of your proposed project; how much area, how many people and how does that compare with current activity
levels such as snowmobiling, hunting, etc.
19.3.5 Socio-Economic Environment
An overview of the socio-economic environment in the area would obviously focus on Grey River because of its
isolation. Aspects of the socio-economic environment to be considered would include labour and economy,
employment equity, and land use, among other potential issues. Most required information should be available
from existing sources including Statistics Canada, DFO, regional development groups, and provincial
government databases.

GREY RIVER PROJECT PRELIMINARY ECONOMIC ASSESSMENT
March 14, 2012 Project No. 1114390003-001-R-Rev1 95
20.0 CAPITAL AND OPERATING COSTS
20.1 Operating Cost Estimates The operating cost estimates for mining, processing and general site administration are considered accurate to
+/-40% in this preliminary study. Detailed first-principle engineering cost estimation has not been done and no
actual quotations for equipment or consumables were used. The estimates are based on models, experience
from similar operations and preliminary calculations.
20.1.1 Mining Costs
The underground mine operating cost was estimated from the MineCost model for Canadian underground
mines. (MineCost 2009). The proposed longhole open stoping mining rate is 400 tpd, or 146,000 tonnes per
annum, which is at the lowest extents of these models. The proposed method is also less of a bulk method and
nearer to a cut-and-fill approach (very small drifts, small equipment and captive sub-levels) so the costs are
likely to be higher than the Open Stoping data in Figure 20.1. A cost of $80 per tonne is estimated for this study
as indicated in the figure by the red square.
Figure 20.1: Canadian underground mining cost model data (MineCost 2009)

GREY RIVER PROJECT PRELIMINARY ECONOMIC ASSESSMENT
March 14, 2012 Project No. 1114390003-001-R-Rev1 96
20.1.2 Processing Costs
Estimated operating costs for the concentrator include for power, water, consumables and labour. Unit costs are
based on the basic design criteria using estimated labour and power rates factored for the planned capacity of
the Grey River Project. Power supply is presently planned via diesel-powered generators located on site.
Power costs are thus estimated for an estimated load of 410 kW (installed) at a diversity factor of 0.6 with no
load factor and a power cost of $0.28/kWh for diesel-generated power. Labour costs include three operators,
one supervisor and two maintenance personnel seven days per week. Consumables and spares are accounted
for at 5% of initial capital cost per annum. The process plant cost breakdown is provided in Table 20-1.
Table 20-1: Process Plant Cost Breakdown
Item $/t Milled
Diesel Power (410 kW installed) 4.10
Water 0.40
Labour 4.00
Consumables and Spares 3.00
Total 11.50
20.1.3 General and Administrative Costs
General and administration costs include general site staff (manager, clerks, accounting, purchasing and human
resources), office and camp costs, and annual safety, security and environmental costs. These are estimated to
be $2.2 million per annum or about $15 per tonne milled.
20.1.4 Refining and Transportation Costs
The APT product produced from the Grey River site is a saleable product and so further refining charges are not
considered in this study. There will be costs for transporting this product to an APT plant in either Europe or the
American mid-west. Three potential transport options are possible from the Grey River property situated on the
southern coast of Newfoundland and with access to the St. Lawrence shipping route; short-range coastal
transport to an Atlantic seaboard port, followed by rail transport overland to the American mid-west; shipping
through the Great Lakes to the mid-west; or, transatlantic shipping to potential customers in Europe. Annual
shipments from the mine would be less than 1000 tonnes of concentrate so sealed 23-tonne metal shipping
containers would best suit the low tonnage, high value product. These containers also facilitate transporting by
ship, rail and even by truck near the final destination.
For costing purposes a containerized cargo shipping rate between the Eastern US and continental Europe of
$122 per tonne is used (Infomine Cost Database, 2011). This translates to a cost of $0.60 per tonne milled. In
addition there will be costs associated with wharfage fees, drayage to loading, fuel surcharges, any overland
trucking and insurance. A total shipping cost of $1.00 per tonne milled is assumed.
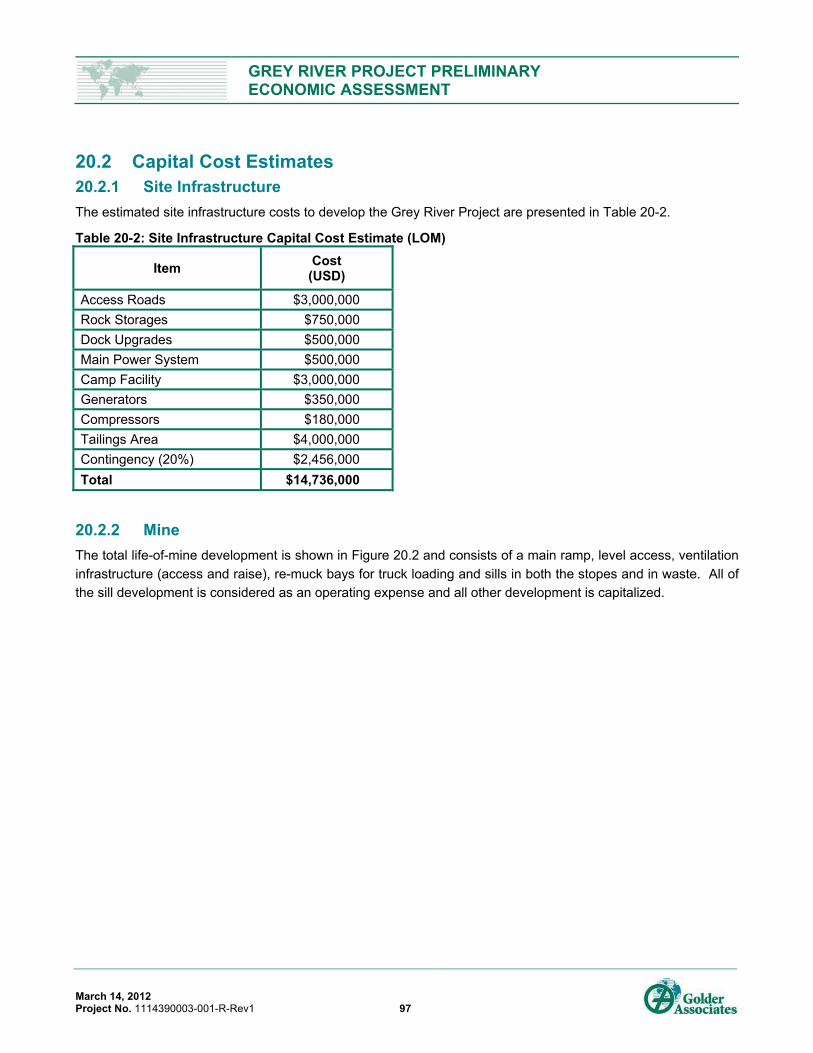
GREY RIVER PROJECT PRELIMINARY ECONOMIC ASSESSMENT
March 14, 2012 Project No. 1114390003-001-R-Rev1 97
20.2 Capital Cost Estimates 20.2.1 Site Infrastructure
The estimated site infrastructure costs to develop the Grey River Project are presented in Table 20-2.
Table 20-2: Site Infrastructure Capital Cost Estimate (LOM)
Item Cost (USD)
Access Roads $3,000,000
Rock Storages $750,000
Dock Upgrades $500,000
Main Power System $500,000
Camp Facility $3,000,000
Generators $350,000
Compressors $180,000
Tailings Area $4,000,000
Contingency (20%) $2,456,000
Total $14,736,000
20.2.2 Mine
The total life-of-mine development is shown in Figure 20.2 and consists of a main ramp, level access, ventilation
infrastructure (access and raise), re-muck bays for truck loading and sills in both the stopes and in waste. All of
the sill development is considered as an operating expense and all other development is capitalized.

GREY RIVER PROJECT PRELIMINARY ECONOMIC ASSESSMENT
March 14, 2012 Project No. 1114390003-001-R-Rev1 98
Figure 20.2: Isometric view looking towards the east of the LOM mine development
Table 20-3 summarizes the total life-of-mine (LOM) capital development and cost. About $7 million of this total
is expensed in the pre-production phase and the remainder is expensed over the following seven years as
sustaining capital. Rehabilitation of the existing adit drift is assumed to be completed during the proposed
exploration Phase 1 described below in Section 25.1.1.
Table 20-3: Mine Development Capital Cost Estimate (LOM)
Item Length
(meters) Unit Cost Cost
Portal 1 $75,000 $75,000
Decline 2,555 $4,500 $11,497,500
Vent Raise 383 $2,500 $957,500
Vent Access 71 $4,000 $284,000
Level Access 279 $4,000 $1,116,000
Re-muck Bays 71 $4,000 $284,000
Paste Line 800 $400 $320,000
Contingency (15%) $2,180,100
Total $16,714,100

GREY RIVER PROJECT PRELIMINARY ECONOMIC ASSESSMENT
March 14, 2012 Project No. 1114390003-001-R-Rev1 99
The mine development unit costs are estimates only and actual quotations from mine contractors will be required
at the next level of engineering study. These costs can vary greatly depending on mobilization costs and
specific site requirements. A 30% increase in these unit rates would increase the mine development costs by
$6 million.
The mine equipment costs are summarized in Table 20-4. The unit costs are estimates from Golder’s existing
database and no actual quotations were obtained for this study.
Table 20-4: Mine Equipment Capital Cost Estimate (LOM)
Item Quantity Unit Cost Cost (USD)
LHD (1.5 m3) 2 $300,000 $ 600,000
LHD (3 m3) 1 $650,000 $650,000
Trucks (20-t) 1 $550,000 $550,000
Drills 2 $250,000 $500,000
Jumbo/Long Tom 2 $400,000 $800,000
Scissorlifts 2 $250,000 $500,000
Grader 1 $235,000 $235,000
Jeeps 3 $90,000 $270,000
Electrical System 1 $500,000 $500,000
Pumps 4 $30,000 $120,000
Fans 1 $300,000 $300,000
Refuge Chambers 2 $150,000 $300,000
Contingency (20%) $1,005,000
Total $6,330,000
20.2.3 Process Plant
The capital cost for the process plant is based on a 400 tpd sorting/gravity plant based on estimates for the list of
mechanical equipment as presented in Table 20-5. The mechanical list is generated from the flowsheets and
priced to +/-30% from results of recent studies for similar process options.

GREY RIVER PROJECT PRELIMINARY ECONOMIC ASSESSMENT
March 14, 2012 Project No. 1114390003-001-R-Rev1 100
Table 20-5: Process Plant Capital Cost Estimate
Item Cost (USD)
Crushing & Screening $1,365,397
Concentrator Building $85,895
Sorting $672,338
Spiral Plant $224,112
Product Handling $86,799
Slimes Handling $282,089
Conveyors & Material Handling $483,409
Plant Services $96,810
Plant Piping System $51,045
Plant Electrical, Instrumentation & Control $704,172
Site Preparation, Bulk Earthworks $366,605
Infrastructure General Services $18,786
Water Treatment Plant $37,573
Infrastructure and Buildings $350,593
Stores Workshop and Offices $141,281
Plant Maintenance Equipment and Tools $33,964
Main Laboratory $214,303
Plant Substation $106,210
First Fill & Spares $105,144
Subtotal $4,999,412
EPCM $749,911
Contingency (20%) $1,150,000
Total $6,900,000
Paste Plant
Generic high-density paste plant designs incorporate mechanical thickening of the full-fraction tailings stream to
approximately 78% solids, followed by mixing of the high-density paste with binder (Portland cement) and
pumping the mixture to the underground openings by positive displacement pumps. The paste plant design and
cost estimate presented here is for a 20 tonne per hour (tph) full paste production. The cost is based on a
similar 80 tph unit. The total estimated design and construction cost for the paste plant including a
20% contingency is $3,360,000. Appendix B contains a preliminary flowsheet for the proposed paste plant.
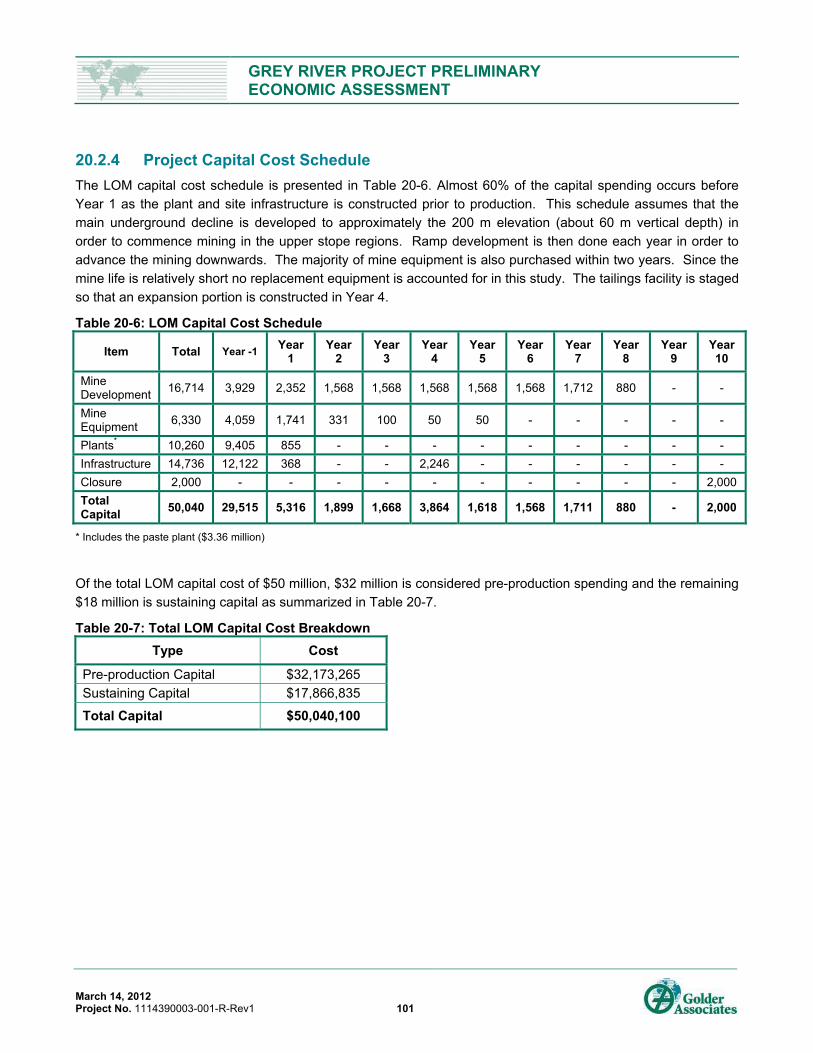
GREY RIVER PROJECT PRELIMINARY ECONOMIC ASSESSMENT
March 14, 2012 Project No. 1114390003-001-R-Rev1 101
20.2.4 Project Capital Cost Schedule
The LOM capital cost schedule is presented in Table 20-6. Almost 60% of the capital spending occurs before
Year 1 as the plant and site infrastructure is constructed prior to production. This schedule assumes that the
main underground decline is developed to approximately the 200 m elevation (about 60 m vertical depth) in
order to commence mining in the upper stope regions. Ramp development is then done each year in order to
advance the mining downwards. The majority of mine equipment is also purchased within two years. Since the
mine life is relatively short no replacement equipment is accounted for in this study. The tailings facility is staged
so that an expansion portion is constructed in Year 4.
Table 20-6: LOM Capital Cost Schedule
Item Total Year -1 Year 1
Year 2
Year 3
Year 4
Year 5
Year 6
Year 7
Year 8
Year 9
Year 10
Mine Development
16,714 3,929 2,352 1,568 1,568 1,568 1,568 1,568 1,712 880 - -
Mine Equipment
6,330 4,059 1,741 331 100 50 50 - - - - -
Plants* 10,260 9,405 855 - - - - - - - - -
Infrastructure 14,736 12,122 368 - - 2,246 - - - - - -
Closure 2,000 - - - - - - - - - - 2,000
Total Capital
50,040 29,515 5,316 1,899 1,668 3,864 1,618 1,568 1,711 880 - 2,000
* Includes the paste plant ($3.36 million)
Of the total LOM capital cost of $50 million, $32 million is considered pre-production spending and the remaining
$18 million is sustaining capital as summarized in Table 20-7.
Table 20-7: Total LOM Capital Cost Breakdown
Type Cost
Pre-production Capital $32,173,265
Sustaining Capital $17,866,835
Total Capital $50,040,100

GREY RIVER PROJECT PRELIMINARY ECONOMIC ASSESSMENT
March 14, 2012 Project No. 1114390003-001-R-Rev1 102
21.0 ECONOMIC ANALYSIS
21.1 Methodology A discounted cash flow method is used to evaluate the economics of the Grey River Project using the base case
economic parameters and underground mining resource as defined above. A discount rate of 5% is used for the
analysis. The cash flow is generated on a pre-tax basis at this early stage of the project. In future studies
federal and provincial taxes will have to be considered as well as any royalties that may apply.
21.2 Basis of Analysis Future annual cash flows have been estimated based on estimates for production rate, mined grade, mill
recovery, metal price and capital and operating cost estimates as presented earlier. Table 21-1 summarizes the
base case parameters used in the cash flow analysis.
Table 21-1: Summary of Base Case Project Parameters used in the Cash Flow Analysis
Parameter Value
Underground Mining Resource 1,268,306
Mined Grade 0.524% WO3
Mining & Milling Rate 400 tpd, 146,000 tpa
Plant Recovery 85%
Total LOM Capital Costs $50 million
Pre-production Capital Cost $32 million
Total Operating Costs $107.50 per tonne
Metal Price $355 per MTU ($16 per lb)
Discount Rate 5%
21.3 Results of Cash Flow Analysis The preliminary base case cash flow is presented in Appendix D. This analysis demonstrates that the base case
project yields a positive pre-tax undiscounted cash flow of $15.5 million. The Net Present Value (NPV) for the
base case is $2.9 million using a discount rate of 5%. Net revenue is sufficient to cover operating and capital
expenses in each year of full production.
21.4 Sensitivity Analysis The Grey River deposit is most sensitive to revenue parameters in the cash flow; metal price, grade and
recovery. This is seen in Figure 21.1 that presents a “spider” chart for the key parameters and the impact of
changes to these parameters on the NPV.

GREY RIVER PROJECT PRELIMINARY ECONOMIC ASSESSMENT
March 14, 2012 Project No. 1114390003-001-R-Rev1 103
Figure 21.1: Sensitivity of the project NPV to changes to the key base case parameters
The current metal price is approximately 30% higher than the value used for the base case, which is nearer to
the 3-year historic average. Figure 21.2 presents the sensitivity of the project NPV to metal price.

GREY RIVER PROJECT PRELIMINARY ECONOMIC ASSESSMENT
March 14, 2012 Project No. 1114390003-001-R-Rev1 104
Figure 21.2: The sensitivity of project NPV to the metal price (base case at $16/lb)
As evidenced by Figure 21.2 a 30% increase in metal price (to $21/lb) generates a pre-tax NPV of $47 million.
The cashflow for this case is provided in Appendix D.
21.5 Project Payback The project payback period using the base case parameters is almost 8 years and the total mine life is just over
9 years. At current metal prices (about 30% higher than the base case value at December 2011) the payback
period would be reduced to just over 4 years.

GREY RIVER PROJECT PRELIMINARY ECONOMIC ASSESSMENT
March 14, 2012 Project No. 1114390003-001-R-Rev1 105
21.6 Project Risks and Opportunities The following project risks are identified for the Grey River Project:
Highly sensitive to metal price. This is both a risk and an opportunity depending on future metal price.
Highly sensitive to dilution in the mining process; a 10% drop in mined grade would result in a negative
NPV at base case parameters. The underground stope mining will have to be very efficient with high
quality control.
The 85% plant recovery used in this study is untested and requires confirmation through a metallurgical test
program. Similar to above, a 10% drop in recovery to 77% generates a negative NPV at base case
parameters. There is also opportunity that plant recovery could be higher than estimated here which would
add value to the project.
The operating costs, in dollars per tonne mined/milled, for narrow vein, low production underground mines
are very sensitive to production rate since small reductions in the tonnage increase unit costs and cut-off
grade.
There have been few studies on environmental and social impacts and tailings disposal options and these
pose risks to project development.
GREY RIVER PROJECT PRELIMINARY ECONOMIC ASSESSMENT
March 14, 2012 Project No. 1114390003-001-R-Rev1 106
22.0 ADJACENT PROPERTIES Tenajon Resource Corp owns the Moly Brook Molybdenum Property which is adjacent to Playfair's Grey River
project. The Moly Brook Property is a molybdenum project that was first discovered in 1995 by the now defunct
Royal Oak Mines Inc. while exploring for gold. In May 2009, based on 43 drill holes, Tenajon Resources
announced a resource estimate for its 100% owned Moly Brook property located in Newfoundland, Canada. The
property contains an Indicated resource of 124.6 million lbs of molybdenum and an Inferred resource of
38.6 million lbs at a 0.04% cut-off. 120.0 million pounds of the Indicated Resources and 32.1 million pounds of
the Inferred Resources are contained within a pit shell which has an estimated strip ratio of 2.03:1.

GREY RIVER PROJECT PRELIMINARY ECONOMIC ASSESSMENT
March 14, 2012 Project No. 1114390003-001-R-Rev1 107
23.0 OTHER RELEVANT DATA AND INFORMATION This Section is not applicable.

GREY RIVER PROJECT PRELIMINARY ECONOMIC ASSESSMENT
March 14, 2012 Project No. 1114390003-001-R-Rev1 108
24.0 INTERPRETATION AND CONCLUSIONS
24.1 Resources The property is located adjacent to the fishing community of Grey River on the south coast of Newfoundland.
The town of Grey River is situated at approximately latitude 47o34’N and longitude 57 o6’W. The Grey River
Tungsten property consists of 154 contiguous mining claims grouped into one mineral license (015686M) held by
Playfair through a purchase agreement with South Coast Ventures.
The project area is underlain by the Silurian-Devonian Burgeo Intrusive Suite and an east – west trending belt of
Precambrian metamorphic rocks referred to as the Grey River Enclave which consists of amphibolites,
quartz-mica schists, pelites and gneisses. The faults in the metamorphic rocks can be grouped into two main
sets: an east-west set parallel to the schistosity and a south-east set cross-cutting the schistosity. A third set
occurs only in the granites. Arising from this set of faults is a prominent fissure system of tensional origin striking
north to northeast. These tension fissures act as the structural control for the tungsten veins.
The Grey River tungsten veins are typical fluorite-rich, wolframite-quartz greisen vein deposits. Wolframite is the
dominant tungsten-bearing mineral although a number of small scheelite occurrences are known. The principal
vein is the Number 10 Vein which strike from 10° to 30° north, with a steep dip of 65° to 75° to the west.
The width of the vein ranges from 0.25 to 2.5 meter and average of 1.13 meter.
The Number 6 Vein is potentially the north extension of the Number 10 Vein displaced 150 meters east along an
East-West trending fault system.
Number 10a Vein capture a portion of the high grade mineralization on the hanging wall of Number 10 Vein
however its true orientation is not well know at present. A low core angle on some of the quartz veinlets
suggests a possible east-west direction.
A bulk density of 2.81 g/cc has been used for the tonnage calculation based on 21 samples collected by Playfair.
The database consist of historical diamond drill data, trench, underground samples collected by ASARCO
between 1957 and 1970. Playfair diamond drilled the property in 2006 and again in 2008 to confirm ASARCO's
drill data and to increase the resource on the Number 6 vein and below the adit level on the Number 10 Vein.
The back and face samples were de-clustered to remove any spatial bias using a pseudo polygonal method.
DGL performed data verification through a site visit, as well as the collection of independent character samples,
and a database audit. Minor clerical errors in the Playfair database were corrected prior to mineral resource
estimation.
There is a marked difference in the grade distribution between the historical data and the newer drill results with
the Playfair assays generally returning lower WO3 values. The difference is currently assumed to be related to
the analytical procedure but needs to be evaluated by Playfair.
A mineral resource has been estimated for the Number 10 Vein on the Grey River tungsten property using data
supplied by Playfair. This data includes drill hole information as well as historical assay data for back, face,
raise, trench and grab samples.
Both Inverse Distance Squared and Nearest Neighbour interpolation methods were used. No significant
discrepancies exist between these methods.

GREY RIVER PROJECT PRELIMINARY ECONOMIC ASSESSMENT
March 14, 2012 Project No. 1114390003-001-R-Rev1 109
All indicated blocks in the resource were downgraded due to the lack of original assay certificates for the
underground sampling, the difference in grade between the historical data and the newer Playfair data and the
difficulty in capturing a representative sample with the small historical EX drilling.
An Inferred mineral inventory of 1.2 million tonnes at 0.730% WO3 using a 0.2% cut-off and excluding
mineralization grading less than 0.2% WO3 over a 1.0 minimum mining width has been estimated for the
combined Number 10, Number 6 and Number 10a Vein. The mineral inventory was provided to Golder for further
economic assessment.
24.2 Mining The Grey River deposit is generally narrow-vein and steeply dipping with vein dip ranging from 70 to 80 degrees
and is considered amenable to a blasthole open stoping mining method with pastefill. At about 2,400 tonnes per
vertical meter of underground mining resource a 400 tpd operation is proposed at this level of engineering study.
Small narrow vein mining equipment and techniques will be required to mine the deposit efficiently, minimize
dilution and maximize recovery. To achieve higher production rates the deposit strike length needs to be longer
but that would also necessitate additional decline, level and ventilation development thus increasing
pre-production capital costs.
The underground mining resource (diluted and mine recovered) is estimated to be 1,268,306 tonnes at a grade
of 0.524% WO3 using a cut-off of 0.35% WO3 and a minimum mining width of 2 m. Using the base case
economic parameters the pre-tax cash flow is estimated to be positive at $15.5 million over a mine life of about
9 years. The pre-tax NPV for the base case using a 5% discount rate is $2.9 million. The project would
generate a NPV(5%) of $47 million at an IRR of 27% at the current metal price of around $440 per MTU
($21 per lb) (at December 2011).
All of the resources used to develop the underground mining resource in this study are in the Inferred category.
The Inferred mineral resources are considered too speculative geologically to have the economic considerations
applied to them that would enable them to be categorized as mineral reserves, and there is no certainty that this
preliminary economic assessment will be realized.
24.3 Processing Grey River is proposed as a low-tonnage, high grade operation, with a relatively free-milling ore, shown to be
amenable to gravity separation methods, producing a potential concentrate of 60% with a tungsten recovery of
75%.
Individual gravity separation tests indicate that the quality of the sample preparation was insufficient to produce
consistent metallurgical results. The test work indicates that testing was undertaken on a ‘bulk sample’,
however, the indicated grade was relatively high compared to the current estimated feed grade. The potential
mine feed is highly diluted compared to the sample tested by SGS and so metallurgical results from those
reports are potentially optimistic compared to results achieved from a fully diluted sample.

GREY RIVER PROJECT PRELIMINARY ECONOMIC ASSESSMENT
March 14, 2012 Project No. 1114390003-001-R-Rev1 110
A typical gravity/flotation-based plant processing material such as at Grey River would generally obtain between
85% to 92% recovery to a 65% to 70% concentrate. For this study a recovery of 85% to a 65% concentrate
grade was assumed.
24.4 Environmental The assessment of environmental considerations is preliminary at this stage of the project and will require further
study. The specific requirements for environmental assessment will ultimately be determined by the scope of the
project, known, or assumed, environmental sensitivities, and public and stakeholder response to the project
information in the registration document.

GREY RIVER PROJECT PRELIMINARY ECONOMIC ASSESSMENT
March 14, 2012 Project No. 1114390003-001-R-Rev1 111
25.0 RECOMMENDATIONS
25.1 Exploration Recommendations The Number 10 Vein at Grey River is one of only a few deposits in Canada with demonstrated tungsten
resources, partial underground development and two stages of metallurgical test data. From the available data
the vein appears to be continuous between the surface trenches and the exposures within the adit. However,
due to the nuggety nature of the mineralization, as well as the relatively wide-spaced drilling, there are gaps in
the data that must be filled in order to change the resource categories.
25.1.1 Phase 1
Phase one is designed to validate the assays in advance of the drill program. The re-assay of the pulps can be
done at anytime. Re-habilitating the adit level is required by a contractor and needs to be scheduled in advance
of the arrival of the Playfair geological team. This adit rehab is also needed for the potential mining plan.
DGL recommends that Playfair re-run 12 (15 of the assays intersecting the vein) drill core pulps from the 2006
and 2008 program using the Fusion XRF or INAA since there is a possibility that the ICP-MS or ICP-ES
understated the tungsten grade.
Since the accuracy of the historical assay in comparison to the newer results is not known, DGL recommends
that Playfair embark on a campaign of verification of historical underground samples and drill core. DGL
suggests replicating 35 underground channel samples or 5% of the underground dataset. If the grade compares
well with the existing samples, then that would be sufficient to validate the remaining samples. If the grades do
not compare, but a good correlation exists with the older samples, an adjustment could be mathematically
applied via a regression equation. The intent is to minimize the risk to the resource and add a level of
confidence that would allow re-classification of the current resource to Indicated. A budget estimate for this work
is presented in Table 25-1.
Table 25-1: Budget Estimate for Validating Underground Samples
Item Amounts
Assay cost - 47 @ $60 per sample $2,820
Cost for rehabilitating the existing adit drift (1.9 km) and installing services (air and water)
$1,700,000
Personnel - Geologist and 2 helpers (4 weeks) $44,000
Accommodation in Grey River. $15,000
Helicopter support for Playfair (3 trips) $18,000
Sub-total $1,779,820
Contingency (20%) $355,964
Total $2,135,784

GREY RIVER PROJECT PRELIMINARY ECONOMIC ASSESSMENT
March 14, 2012 Project No. 1114390003-001-R-Rev1 112
25.1.2 Phase 2
A series of close-spaced holes within the current Inferred category is suggested so that the nearby Indicated
categories can be expanded. A surface drill rig capable of HQ (or thin wall N) core drilling is recommended to
create data points in the area above the face and back samples in the South Vein. This program can be
completed in one campaign and the results used to assess the viability of additional exploration.
Six holes are needed at the +50 m elevation level in an area immediately above the face/back sample locations
in the South Vein. HQ core can be drilled from surface to intersect the vein in these locations but each hole will
be in the order of 300 m in length.
Alternatively, these holes can be drilled from the three closest cross-cuts as soon as the adit has been
rehabilitated. The cross-cut locations will shorten the hole lengths although this is at the expense of an optimum
core angle with the vein.
Six holes should be drilled at the +100 m elevation level within the inferred category. As with the initial six holes
these pierce points will be spaced about 50 m apart at this elevation with 5 holes intersecting the Number 10
Vein and one hole intersecting the Number 6 Vein. Holes should be approximately 230 meter in length to reach
that elevation.
Four 150 meter long holes should test the +150 m elevation level. Two holes intersecting the Number 6 Vein
and two holes intersecting the Number 10 Vein.
Four short holes on the +200 m level testing the southern extent of the Number 10 vein. Each hole should be
about 100 meter in length.
The budget for all 20 surface holes is given in Table 25-2 and the drilling plan is shown in Figure 25.1.
Table 25-2: Proposed Budget for Additional Fill-in Drilling on the Number 10 Vein
Item Amounts
Drilling 20 HQ size holes, total of 4,380 meter @ $120/m $525,600
Report Writing, maps $10,000
Equipment rental, & DDH collar surveying $25,000
Personnel $75,000
Assaying and sample preparation $25,000
Field accommodation $30,000
Helicopter support $100,000
Sub-total $790,600
Contingency $80,000
Total $870,600

GREY RIVER PROJECT PRELIMINARY ECONOMIC ASSESSMENT
March 14, 2012 Project No. 1114390003-001-R-Rev1 113
Figure 25.1: Proposed drilling plan for the Grey River project
Other targets should be examined to assess the potential for increasing the grade and/or tonnes of the
Number 10 Vein. In particular, the area below the adit level should be drilled to verify the continuity of the
tungsten mineralization in the vein. This program can be best accomplished after the adit has been
re-habilitated using drill stations set up in the cross-cuts. No budget is proposed for this program due to
uncertainty in the cost estimates for the different evaluation methods.
Additional recommendations for future exploration programs include:
The insertion of blanks and duplicate samples should be added to the QA/QC protocol in future sampling
programs.
Field generated specific gravity determinations should continue.

GREY RIVER PROJECT PRELIMINARY ECONOMIC ASSESSMENT
March 14, 2012 Project No. 1114390003-001-R-Rev1 114
Geotechnical information should be routinely collected to create a data set that will be of use in future
mining efforts. Core photographs should be taken and catalogued.
A minimum of two ASARCO holes (10% of the data) should twinned with a new holes to quantify the effects
of core re-drilling/grinding in the original standard drill holes (in addition to the proposed holes above).
25.2 Mining Further work is required to develop more accurate cost estimates for both operating and capital costs. The
project economics are quite sensitive to mine operating costs and a higher confidence in this value will be
needed. In addition, the mine operating costs for small, narrow vein deposits are very sensitive to production
rate. Further study will be needed to confirm the proposed rate of 400 tpd and develop a more detailed mine
plan and production schedule. Other, more selective methods are possible but they could increase costs or limit
production rates. The deposit is also very sensitive to dilution and additional studies should be completed on the
relationship between mining cost, cut-off grade, dilution and productivity.
Limited geotechnical data is available for the Grey River deposit at this stage. More detailed geotechnical
investigations and design exercises must be done for the mine workings, proposed stope sizes and crown pillar
dimensions at the next level of engineering study.
In order to develop mineral reserves for the Grey River Project as part of a pre-feasibility study the majority of
Inferred mineral resources, and all of the underground mining resource as defined here, will have to be upgraded
to the Indicated category.
25.3 Processing Concentrate specification needs to be addressed in future test work. Furthermore, WO3 concentrates destined
for APT plants have a target size distribution specification. Further metallurgical work is strongly recommended
in order to; establish a firm specification on the head grade for the feed; maximize recovery to an acceptable
WO3 concentrate; and, move beyond the scoping stage and simulate the unit processes of the proposed flow
sheet on a representative sample of the feed material. This will help establish firm criteria for the metallurgical
performance to produce an acceptable concentrate.
A projected recovery of 85% WO3 is used in this study but is provisional and should be confirmed by test work in
the next phase of work.
25.4 Environmental The following are recommended for future work in relation to environmental and socio-economic issues:
Fish presence and habitat characterization should be determined for areas that might be affected by
activities conducted on the plateau (i.e., Project, not exploration activities). The results of these surveys will
assist in the Project planning. The overall site plan showing all water bodies (streams and ponds), roads
and other infrastructure should be updated regularly as the project design advances.

GREY RIVER PROJECT PRELIMINARY ECONOMIC ASSESSMENT
March 14, 2012 Project No. 1114390003-001-R-Rev1 115
It is recommended that fish presence and fish habitat characterization be determined for areas that might
be affected by activities conducted in the marine environment or with wharf construction in marine areas.
It is recommended that consideration be given to setting up a baseline water quality sampling program that
will carry into the development of the Project.
Other issues will be better defined when additional Project details are available, at which time liaison with
appropriate regulators can be done to identify data gathering requirements.

GREY RIVER PROJECT PRELIMINARY ECONOMIC ASSESSMENT
March 14, 2012 Project No. 1114390003-001-R-Rev1 116
26.0 REFERENCES Bahyrycz, G.S.: Geology and Mineral Deposits of the Grey River Area, Southern Newfoundland;
Buchans Mining Co. Ltd., October, 1956.
Cavey, G. and Gunning, D. 2006: Updated technical report on the Panasqueira Mine, Distrito de Castelo Branco,
Portugal. 43-101 Technical Report for Primary Metals Inc.
Dadson, P.: Compilation of Data, Grey River Property, South Coast, Newfoundland and Labrador;
Playfair Mining Ltd.: February 8, 2007.
Dearin, C. and Harris, J.: 2006 Diamond Drilling Program, Grey River WO3 Project; Fortis GeoServices Ltd.;
April 12, 2006.
Frenchman’s Cove Property, Grey River, Newfoundland; Royal Oak Mines Ltd., March 1996.
Higgins, N.H. and Swanson, E.A.: Preliminary Report Grey River Tungsten Project; Buchans Mining Company
Limited; December 1956.
Jacobs, W.: First Year Mineral Assessment Report on Grey River Property, Nfld., Licences 4849M, 5027M,
5181M, 5182M, 5441M, NTS Map Sheet 11P11; White Bear Resources Ltd., Copper Hill Resources
Inc., and Pearl Resources Inc.: 1997.
Kadowaki, R.S.: General Report of the Grey River Tungsten Prospect; 1957.
Lendrum, S.: First Year Assessment Report of Prospecting, Lake Sediment, Stream Sediment and
Lithogeochemical Sampling on Ground Staked Licence 4586.
McBride, D.E.: Memo to D.K. Jackson; 1978.
McCarthy, P.L.: Economics of Narrow Vein Mining, Proceedings - Narrow Vein Mining Seminar, Bendigo,
Victoria, pp 89-97, 1993.
Mercer, B.: First Year Assessment Report on Ground Staked Licence 4558 and Second Year Assessment
Report on Ground Staked Licence 4476, Prospecting, Trenching, Geological Mapping, Diamond Drilling,
Geochemical and Geophysical Surveying at Frenchman’s Cove, Grey River, Newfoundland;
Royal Oak Mines Inc., March 1996.
Moreton C. PhD, P.Geo.: Gray River Tungsten Property, Newfoundland and Labrador, NI43-101 Technical
report, Wardrop, June 2007.
Moreton C. PhD, P.Geo., Sprott D. P. Eng, Bamber A. P. Eng.: Preliminary Economic assessment of the
Grey River Property, Newfoundland, NI43-101 Technical Report, Golder Associates, January 2008.
Srivastava S. C., Bhaisare S. R., Wagh D. N. and Siyer C. P. Analysis of tungsten in low grade ores and
geological samples, Bull. Mater. Sci., Vol 19, No. 2, April 1996, pp. 331-343
Webster, M.P.: 1st, 2nd and 3rd Year Assessment of Ground Staked Mineral License 4301, Report on Bulk
Sampling Program and Tungsten Products Research, The Grey River Area, Newfoundland, Canada;
Raventures Inc., 1996.

GREY RIVER PROJECT PRELIMINARY ECONOMIC ASSESSMENT
March 14, 2012 Project No. 1114390003-001-R-Rev1 117
27.0 CERTIFICATES OF QUALIFIED PERSONS
27.1 Certificate for Joseph Rosaire Pierre Desautels, P.Geo. I, Joseph Rosaire Pierre Desautels of Barrie, Ontario, do hereby certify that as an author of Sections of the technical report titled “Grey River Project Preliminary Economic Assessment” dated March 14, 2012, I hereby make the following statements:
I am a Principal Resource Geologist with Desautels Geoscience Ltd. with a business address at 290 Harvie Road, Barrie, Ontario, L4N 8H1.
I am a graduate of Ottawa University (B.Sc. Hons., 1978).
I am a member in good standing of the Association of Professional Geoscientists of Ontario (Registration #1362).
I have practiced my profession in the mining industry continuously since graduation.
I visited the property from October 04 to 05, 2011.
I have read the definition of “qualified person” set out in NI 43-101 and certify that, by reason of my education, affiliation with a professional association (as defined in NI 43-101), and past relevant work experience, I fulfill the requirements to be a “qualified person” for the purpose of NI 43-101.
My relevant experience with respect to resource modelling includes 31 years’ experience in the mining sector covering database, mine geology, grade control, and resource modelling. I was involved in numerous projects around the world in both base metals and precious metals deposits.
I am responsible for the preparation of parts of Section 1.0 to 3.0 and all of Sections 4.0 to 12.0, 14.0, 22.0 24.1 and 25.1 of this technical report titled “Grey River Project Preliminary Economic Assessment”, dated March 14, 2012.
I have no prior involvement with the property that is the subject of the Technical Report.
As of the date of this Certificate, to my knowledge, information, and belief, this technical report contains all scientific and technical information that is required to be disclosed to make the technical report not misleading.
I am independent of the Issuer as defined by Section 1.4 of the Instrument.
I have read NI 43-101 and the Technical Report has been prepared in compliance with NI 43-101 and Form 43-101F1.
Signed and dated this 14th day of March, 2012 at Barrie, Ontario.


GREY RIVER PROJECT PRELIMINARY ECONOMIC ASSESSMENT
March 14, 2012 Project No. 1114390003-001-R-Rev1 119
27.3 Certificate of Andrew Bamber, P.Eng. I, Andrew Bamber, of Vancouver, British Columbia, do hereby certify that as an author of Sections of the report
titled “Grey River Project Preliminary Economic Assessment”, dated March 14, 2012, I hereby make the
following statements:
I am employed as a Partner/ Principal Engineer with Minesense Technologies Ltd. with a business address
at 122 – 1857 West 4th Avenue, Vancouver, BC, Canada, V6J 1M4.
I am a graduate of the University of Cape Town, BSc. (Hons.) Mechanical Engineering, 1993, and the
University of British Columbia, MASc. Mining and Mineral Process Engineering, 2004.
I am a member in good standing of the South African Institute of Mechanical Engineers; the South African
Institution of Certificated Mechanical and Electrical Engineers; the Canadian Institute of Mining and
Metallurgy (CIM), and a Professional Engineer registered with the Engineering Council of SA License #
990013.
I have practiced my profession continuously since graduation.
I have read the definition of “qualified person” set out in National Instrument
43-101 (NI 43-101) and certify that, by reason of my education, affiliation with a professional association (as
defined in NI 43-101) and past relevant work experience, I fulfill the requirements to be a “qualified person”
for the purpose of NI 43-101.
My relevant experience with respect to the Playfair Grey River Project includes over 14 years experience in
mining and mineral processing projects in Southern Africa, Canada and Central Asia. I have been a
principal in several pre-feasibility and feasibility studies, including the Kroondal ‘K2’ Platinum Project, the
Mimosa Phase III Platinum Expansion, the Voskhod Chrome Project in Kazakhstan and the Pipe II Scoping
Study for INCO Thompson.
I am responsible for the preparation of parts of Section 1.0 and 16.5 and Sections 13.0, 20.1.2, 20.2.3, 24.3
and 25.3 of this technical report titled “Grey River Project Preliminary Economic Assessment”, dated
March 14, 2012.
I have no prior involvement with the Property that is the subject of the Technical Report.
GREY RIVER PROJECT PRELIMINARY ECONOMIC ASSESSMENT
March 14, 2012 Project No. 1114390003-001-R-Rev1 120
As of the date of this Certificate, to my knowledge, information and belief, this Technical Report contains all
scientific and technical information that is required to be disclosed to make the technical report not
misleading.
I am independent of the Issuer as defined by Section 1.4 of the Instrument.
I have read National Instrument 43-101 and the Technical Report has been prepared in compliance with
National Instrument 43-101 and Form 43-101F1.
Signed and dated this 14th day of March, 2012 at Vancouver, British Columbia.


GREY RIVER PROJECT PRELIMINARY ECONOMIC ASSESSMENT
March 14, 2012 Project No. 1114390003-001-R-Rev1
APPENDIX A ASARCO Analytical Procedure


GREY RIVER PROJECT PRELIMINARY ECONOMIC ASSESSMENT
March 14, 2012 Project No. 1114390003-001-R-Rev1
APPENDIX B Plant Flow Sheets Feed Preparation Spiral Plant, Tailings, Concentrate Handling Paste Plant
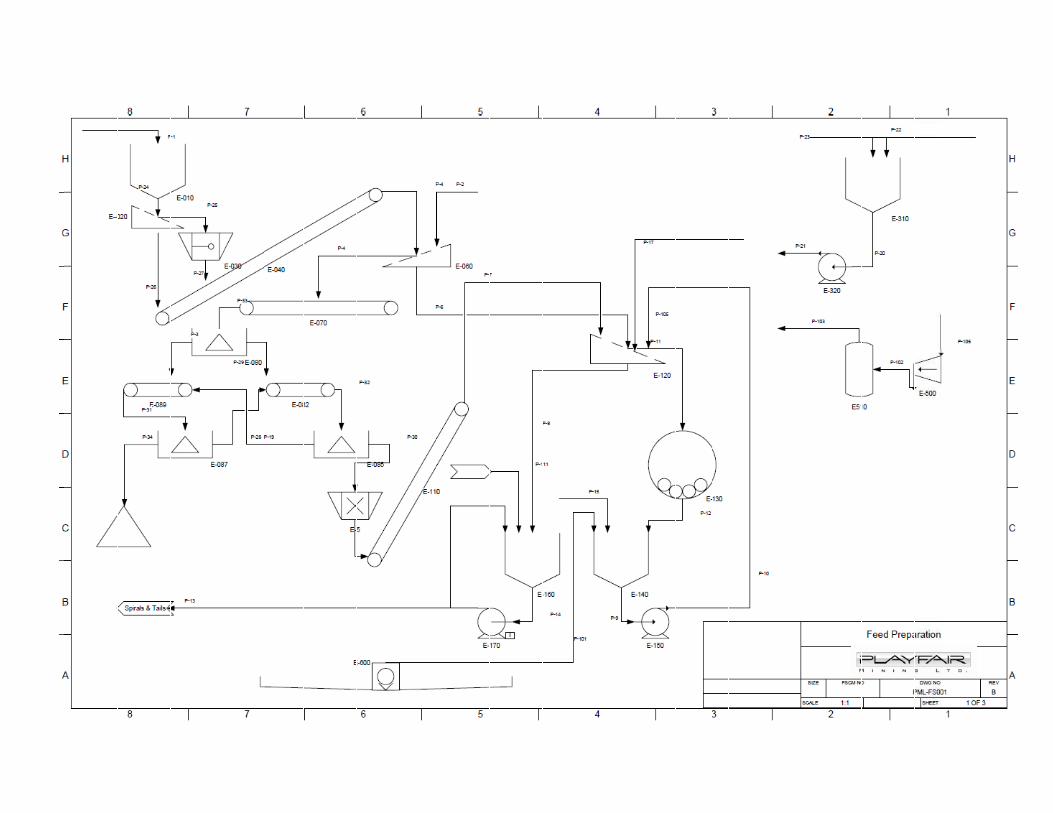


Grey River Tungsten Equipment List - Concentrator Rev BEquipment
Number Description Type Manufacturer kW CommentE-010 Feed hopper 5tE–020 Vibrating grizzly 1000 x 1200 2 x 1.9 40mm splayE-030 Jaw crusher 430 x 250 Metso VB92 37 30mm CSSE-040 Conveyor 10m L x 300mm W 5.5 1.25m/sE-060 Screen 1500 x 1800 2 x 2.2 10mm PU deckE-070 Conveyor 10m L x 300mm W 5.5 1.25m/sE-080 Rougher sorter ISS-X Steinert 5.5 Sort -40 + 10mmE-082 Product conveyor 10m L x 300mm W 5.5 1.25m/sE-085 Waste conveyor 10m L x 300mm W 5.5 1.25m/sE-086 Scavenger sorter ISS-X Steinert 5.5 Sort -40 + 10mmE-087 Cleaner sorter ISS-X Steinert 5.5 Sort -40 + 10mmE-089 Recycle conveyor 10m L x 300mm W 5.5 1.25m/sE-090 Product hopper 5tE-095 Vibrating feeder 600x900 Vibramech 2x 2.2E-100 VSI REMCO 30 6mm CSSE-110 Conveyor 10m L x 300mm W 1.25m/sE-120 Mill product screen 1800 x 2200 Vibramech 2x 2.2 1mm PU deckE-130 Rod mill 1.2m x 1.8m EGL Metso 200 Grate dischargeE-140 Mill dishcarge sump 3m3
E-150 Mill discharge pump 2 x 1 1/2Wier
Envirotech 4E-160 Mill product sump 3m3
E-170 Spiral feed pump 2 x 1 1/2Wier
Envirotech 4E-180 Desliming cyclone 150mm Krebs
E-190 Rougher spiralsSC 18/5 HM
Spirals Multotec4x5 turn double
start
E-200 Scavenger spiralsSC 18/5 HM
Spirals Multotec4x5 turn double
start
E-210Scavengertable/spiral Single deck Wilfley 1.1
E-220 Spiral concs sump 3m3
E-230 Spiral concs pump 2x 1 1/2Wier
Envirotech 4
E-231Spiral concsconditioning tank 3m3 Aeromix 2.2 Optional
E232 Pyrite flotation RCS 5 Metso 22 Optional
E-233Pyrite flotation u/flowpump 2 x 1 1/2
WierEnvirotech 4 Optional
E-240Product dewateringcyclone 150mm
Linatex spigottype
E-250 Product stockpile 5tE-260 Spiral tails sump 3m3
E-270Talings underflowpump 2 x 1 1/2
WierEnvirotech 4
E-280 Tailings thickener 5m BL Size 10 Metso 5.5

E-290Thickener u/flowpump 2 x 1 1/2
WierEnvirotech 4
E-300 Tailings damE-310 Process water tank 50m3
E-320 Process water pump 2 x 1 1/2Wier
Envirotech 4E-500 Compressor GA30 Atlas Copco 37E-510 Plant air receiver Atlas Copco
E-600 Spillage pump 3"DTVWier
Envirotech 4 Mobile pump
E-610 Spillage pump 3"DTVWier
Envirotech 4 Mobile pump
Total

E-300
P-81
P-82
P-83
P-86
P-87
E-420
E-430
P-88
V-1
E-410
P-90
E-400
E-440
P-94
P-95
E-450
E-460
P-96
P-97
P-98
OBL
OBL
P-104
H
G
F
E
D
C
B
A
8 7 6 5 4 3 2 1
H
G
F
E
D
C
B
A
8 7 6 5 4 3 2 1
20 tph Pastefill Plant
SIZE FSCM NO DWG NO REV
PML-FS-003 A
SCALE NTS SHEET 3 OF 4
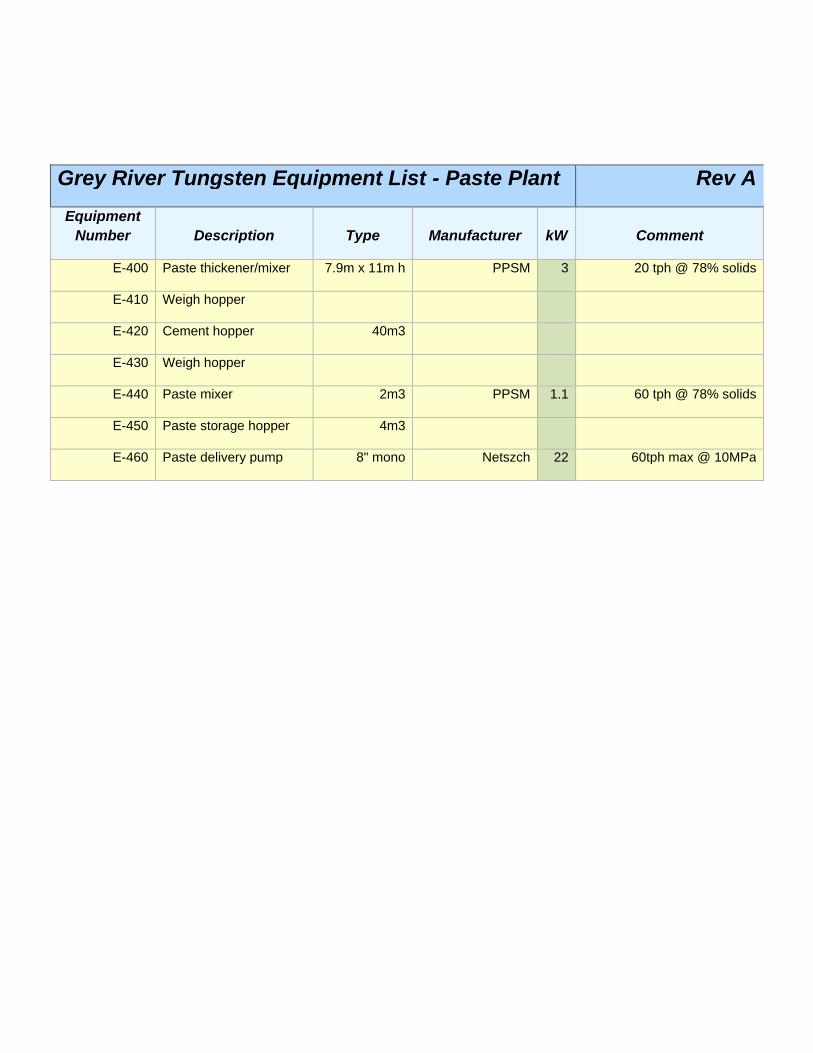
Grey River Tungsten Equipment List - Paste Plant Rev A
Equipment
Number Description Type Manufacturer kW Comment
E-400 Paste thickener/mixer 7.9m x 11m h PPSM 3 20 tph @ 78% solids
E-410 Weigh hopper
E-420 Cement hopper 40m3
E-430 Weigh hopper
E-440 Paste mixer 2m3 PPSM 1.1 60 tph @ 78% solids
E-450 Paste storage hopper 4m3
E-460 Paste delivery pump 8" mono Netszch 22 60tph max @ 10MPa

GREY RIVER PROJECT PRELIMINARY ECONOMIC ASSESSMENT
March 14, 2012 Project No. 1114390003-001-R-Rev1
APPENDIX C Preliminary Site Layout Plans


GREY RIVER PROJECT PRELIMINARY ECONOMIC ASSESSMENT
March 14, 2012 Project No. 1114390003-001-R-Rev1
APPENDIX D Preliminary Pre-tax Cash Flow Base Case - $16/lb Spot Price - $21/lb

Project Cashflow - Grey River Project
Project 11-1439-0003 $USD
Year -1 Year 1 Year 2 Year 3 Year 4 Year 5 Year 6 Year 7 Year 8 Year 9 Year 10 Total
Production
Throughput, tpd 400
Operating days per year 365
Tonnes Milled 73,000 146,000 146,000 146,000 146,000 146,000 146,000 146,000 146,000 27,306 1,268,306
Grade %WO3 0.524 0.505 0.473 0.473 0.525 0.522 0.533 0.530 0.613 0.630
Mill Recovery 85% 85% 85% 85% 85% 85% 85% 85% 85% 85% 85%
Recovered pounds conc. lbs 716,837 1,382,996 1,295,273 1,295,273 1,435,593 1,429,204 1,458,262 1,450,009 1,676,610 322,439 12,462,496
Tonnes 325 627 588 588 651 648 661 658 761 146 5,653
Net Revenue $16.00 $11,469,388 $22,127,933 $20,724,362 $20,724,362 $22,969,489 $22,867,259 $23,332,197 $23,200,145 $26,825,765 $5,159,031 $199,399,931
USD/lb
Operating Cost
Mining $80.00 $5,840,000 $11,680,000 $11,680,000 $11,680,000 $11,680,000 $11,680,000 $11,680,000 $11,680,000 $11,680,000 $2,184,507 $101,464,507
Milling $11.50 $839,500 $1,679,000 $1,679,000 $1,679,000 $1,679,000 $1,679,000 $1,679,000 $1,679,000 $1,679,000 $314,023 $14,585,523
G&A $15.00 $1,095,000 $2,190,000 $2,190,000 $2,190,000 $2,190,000 $2,190,000 $2,190,000 $2,190,000 $2,190,000 $409,595 $19,024,595
Shipping&Insurance $1.00 $73,000 $146,000 $146,000 $146,000 $146,000 $146,000 $146,000 $146,000 $146,000 $27,306 $1,268,306
Total Operating Cost $107.50 $0 $7,847,500 $15,695,000 $15,695,000 $15,695,000 $15,695,000 $15,695,000 $15,695,000 $15,695,000 $15,695,000 $2,935,431 $136,342,931
Capital
Total Capital $50,040,100 $29,515,195 $5,316,140 $1,898,660 $1,668,410 $3,863,760 $1,618,160 $1,568,160 $1,711,785 $879,830 $0 $2,000,000 $50,040,100
Pre-production capital $32,173,265 $29,515,195 $2,658,070
Sustaining Capital $17,866,835 $2,658,070 $1,898,660 $1,668,410 $3,863,760 $1,618,160 $1,568,160 $1,711,785 $879,830 $0 $2,000,000 $15,208,765
Salvage $2,502,005 $2,502,005 $2,502,005
Net Cashflow (Pre-tax) $15,518,905 ($29,515,195) ($1,694,252) $4,534,273 $3,360,952 $1,165,602 $5,656,329 $5,604,099 $5,925,412 $6,625,315 $11,130,765 $2,725,605 $15,518,905
Pre-tax NPV 5.0% $2,861,000
IRR 7%

Project Cashflow - Grey River Project
Project 11-1439-0003 $USD
Year -1 Year 1 Year 2 Year 3 Year 4 Year 5 Year 6 Year 7 Year 8 Year 9 Year 10 Total
Production
Throughput, tpd 400
Operating days per year 365
Tonnes Milled 73,000 146,000 146,000 146,000 146,000 146,000 146,000 146,000 146,000 27,306 1,268,306
Grade %WO3 0.524 0.505 0.473 0.473 0.525 0.522 0.533 0.530 0.613 0.630
Mill Recovery 85% 85% 85% 85% 85% 85% 85% 85% 85% 85% 85%
Recovered pounds conc. lbs 716,837 1,382,996 1,295,273 1,295,273 1,435,593 1,429,204 1,458,262 1,450,009 1,676,610 322,439 12,462,496
Tonnes 325 627 588 588 651 648 661 658 761 146 5,653
Net Revenue $21 $14,910,204 $28,766,313 $26,941,671 $26,941,671 $29,860,336 $29,727,437 $30,331,856 $30,160,188 $34,873,495 $6,706,741 $259,219,910
USD/lb
Operating Cost
Mining $80.00 $5,840,000 $11,680,000 $11,680,000 $11,680,000 $11,680,000 $11,680,000 $11,680,000 $11,680,000 $11,680,000 $2,184,507 $101,464,507
Milling $11.50 $839,500 $1,679,000 $1,679,000 $1,679,000 $1,679,000 $1,679,000 $1,679,000 $1,679,000 $1,679,000 $314,023 $14,585,523
G&A $15.00 $1,095,000 $2,190,000 $2,190,000 $2,190,000 $2,190,000 $2,190,000 $2,190,000 $2,190,000 $2,190,000 $409,595 $19,024,595
Shipping&Insurance $1.00 $73,000 $146,000 $146,000 $146,000 $146,000 $146,000 $146,000 $146,000 $146,000 $27,306 $1,268,306
Total Operating Cost $107.50 $0 $7,847,500 $15,695,000 $15,695,000 $15,695,000 $15,695,000 $15,695,000 $15,695,000 $15,695,000 $15,695,000 $2,935,431 $136,342,931
Capital
Total Capital $50,040,100 $29,515,195 $5,316,140 $1,898,660 $1,668,410 $3,863,760 $1,618,160 $1,568,160 $1,711,785 $879,830 $0 $2,000,000 $50,040,100
Pre-production capital $32,173,265 $29,515,195 $2,658,070
Sustaining Capital $17,866,835 $2,658,070 $1,898,660 $1,668,410 $3,863,760 $1,618,160 $1,568,160 $1,711,785 $879,830 $0 $2,000,000 $15,208,765
Salvage $2,502,005 $2,502,005 $2,502,005
Net Cashflow (Pre-tax) $75,338,884 ($29,515,195) $1,746,564 $11,172,653 $9,578,261 $7,382,911 $12,547,176 $12,464,277 $12,925,071 $13,585,358 $19,178,495 $4,273,315 $75,338,884
Pre-tax NPV 5.0% $46,790,000
IRR 27%

Golder Associates Ltd.
500 - 4260 Still Creek Drive
Burnaby, British Columbia, V5C 6C6
Canada
T: +1 (604) 296 4200