Embed Size (px)
Citation preview

Grid Shock: Coordinated Load-Changing Attacks on Power GridsThe Non-Smart Power Grid is Vulnerable to Cyber Attacks as Well
Adrian DabrowskiSBA ResearchWien, Austria
Johanna UllrichSBA ResearchWien, Austria
Edgar R. WeipplSBA ResearchWien, Austria
ABSTRACTElectric power grids are among the largest human-made controlstructures and are considered as critical infrastructure due to theirimportance for daily life. When operating a power grid, providershave to continuously maintain a balance between supply (i.e., pro-duction in power plants) and demand (i.e., power consumption) tokeep the power grid’s nominal frequency of 50Hz or alternatively60Hz. Power consumption is forecast by elaborated models includ-ing multiple parameters like weather, season, and time of the day;they are based on the premise of many small consumers averagingout their energy consumption spikes.
In this paper, we develop attacks violating this assumption, in-vestigate their impact on power grid operation, and assess theirfeasibility for today’s adversaries. In our scenario, an adversarybuilds (or rents) a botnet of zombie computers and modulates theirpower consumption, e.g., by utilizing CPU, GPU, hard disks, screenbrightness, and laser printers in a coordinated way over the In-ternet. Outperforming the grid’s countervailing mechanisms intime, the grid is pushed into unstable states triggering automatedload shedding or tie-line tripping. We show that an adversary doesnot have to rely on smart grid features to modulate power con-sumption given that an adequate communication infrastructure forstriking the (legacy) power grid is currently nearly omnipresent:the Internet to whom more and more power-consuming devicesare connected.
Our simulations estimate that between 2.5 and 9.8 million in-fections are sufficient to attack the European synchronous grid –depending on the mix of infected devices, the current mix of activepower plant types, and the current overall produced power. How-ever, the herein described attack mechanisms are not limited to theEuropean grid.
ACM Reference Format:Adrian Dabrowski, Johanna Ullrich, and Edgar R. Weippl. 2017. Grid Shock:Coordinated Load-Changing Attacks on Power Grids: The Non-Smart PowerGrid is Vulnerable to Cyber Attacks as Well. In 2017 Annual ComputerSecurity Applications Conference. ACM, New York, NY, USA, 12 pages. https://doi.org/10.1145/3134600.3134639
Permission to make digital or hard copies of all or part of this work for personal orclassroom use is granted without fee provided that copies are not made or distributedfor profit or commercial advantage and that copies bear this notice and the full citationon the first page. Copyrights for components of this work owned by others than theauthor(s) must be honored. Abstracting with credit is permitted. To copy otherwise, orrepublish, to post on servers or to redistribute to lists, requires prior specific permissionand/or a fee. Request permissions from [email protected] 2017, December 4–8, 2017, San Juan, PR, USA© 2017 Copyright held by the owner/author(s). Publication rights licensed to theAssociation for Computing Machinery.ACM ISBN 978-1-4503-5345-8/17/12. . . $15.00https://doi.org/10.1145/3134600.3134639
Figure 1: Visualization of Attacks 1 and 2: The botnet canmodulate the power demandmuch faster than power plantscan react.
1 INTRODUCTIONElectric power grids are among the largest human-made structuresand by far the most important for technology-dependent societies.Without electricity, life as we know it would not function; therewould be breakdowns in water and food supply, transport, medicalaid, and communication infrastructures. For this reason, powergrids are considered critical infrastructures, and operated with ahigh level of care to provide qualitative service, i.e., constant voltageand frequency. At the same time, power grids are legacy systemspre-dating modern telecommunication networks — such as theInternet — by decades, as is reflected in its structure: Electricityconsumers are predominantly uncontrolled, i.e., consuming electricpower whenever they need thereby causing fluctuations in con-sumption. However, on a macro scale fluctuations average out: foreach consumer turning a light bulb off there is most likely anotherone turning the light on. Energy suppliers have developed sophisti-cated models that reliably forecast power demand in dependenceof time of the day, week day, season and many other parametersallowing (centralized) power plants to trace actual consumptionbest possible in order to keep the equilibrium of production andconsumption; the remaining gap is placed at disposal by so calledcontrol reserves (spinning reserve in the U.S.), i.e., the activation ofpower plants in stand-by.
Power grids around the globe currently undergo substantial mod-ifications commonly summarized under the term smart grid, and theincluded concepts put an end to the strict separation of controlledproduction and uncontrolled consumption. On the one hand, renew-ables like wind turbines and photovoltaics provide electric energyin dependence of weather conditions and are thus only to a certainextent predictable, not to mention arbitrarily controllable. On theother hand, demand-side management aims to shift certain types ofconsumption, e.g., heating or cooling, in time. Synchronized over acommunication channel, energy should then be consumed at thetime of production by renewables. Due to such remote control ofhigh amounts of power consumption, the smart grid is consideredto be vulnerable to direct cyber attacks aiming to destabilize thesystem [28, 64].

ACSAC 2017, December 4–8, 2017, San Juan, PR, USA A. Dabrowski, J. Ullrich, E.R. Weippl
In this paper, we show that an adversary does not have to relyon explicit (or future) smart grid features to modulate power con-sumptions, as the communication infrastructure to attack the legacygrid is already available: the Internet. An adversary might compro-mise a large number of Internet-facing power-drawing devices, e.g.,computers, TVs, or thermostats controlling heating systems, andmodulate their power consumption in a coordinated way (Figure 1).As these fluctuations are at a large scale, fast and unpredictable,power plants are not able to trace power consumption any morecausing an imbalance of production and consumption and eventu-ally load-shedding, disconnection of power plants, disconnectionof transmission lines, or a split of one synchronous power grid intomultiple areas. Our attack benefits from the fact that the power gridis substantially slower in reaction than information technology,and will become even more vulnerable in the future, as control-lable power consumption (with a potentially low level of securityprotection) increases due to the spread of the Internet-of-Things(IoT).
In this paper, we focus primarily on the synchronous grid ofContinental Europe (also known as UCTE grid) as it is the largestof its kind spanning over 23 countries, including large parts ofEurope, North Africa as well as Turkey, and cite the respectiveUCTE/ENTSO-E policies. While terminology and details mightdiffer in other synchronous grids, e.g., in the United States, wewant to stress that the general principles, attacks, and conclusionsapply to AC power grids all over the world.
The paper is structured as follows: Section 2 provides backgroundon today’s power grids from an engineering perspective. Section 3describes our attack scenarios and the anatomy of the adversary’sbotnet for these attacks. It goes without saying that such an at-tack can ethically never be tested on a real power grid. Thus, wemeasure the capabilities for load modulation of a zombie and itsperipherals in Section 4 and use simulations to predict the impact oflarge load changes on the power grid in Section 5. In Section 6, wecombine the gained results into multiple scenarios and assess thenumber of infections needed considering parameters like time ofthe day, season, etc. Section 7 discusses related work, and Section 8concludes the paper.
2 BACKGROUNDThis section provides background on the power grid from an engi-neering perspective and an introduction into control theory, dis-cussing feedback loops and resonance frequencies.
2.1 Producer-Consumer EquilibriumElectric power cannot be stored at large scale, i.e., must be gen-erated and consumed at the same time. In consequence, the chal-lenge when operating a power grid is to maintain an equilibriumof electric power supplied by power plants and power consumedby electric loads. Apart from a few consumers with extraordinaryhigh consumption — e.g., aluminum foundries and steel mills — areuncontrolled, i.e., they turn their power consumption on and offwhenever they need or feel to. Thus, keeping a balance betweensupply and demand has become the suppliers’ tasks – their powerplants’ production has to trace current consumption.
Table 1: Emergency routines in case of under-frequency inGermany [60, p65] similar to the ENTSO-E policies [55, p26]
Frequency Action
1 49.8 Hz Alerting, activation of plants, shedding of pumps
2 49.0 Hz Load-shedding of 10-15% of total load
3 48.7 Hz Load-shedding of further 10-15% of total load
4 48.4 Hz Load-shedding of further 15-25% of total load
5 47.5 Hz Disconnection of all power plants
Scheduling power plants in order to deliver enough electricpower at all times is a non-trivial task, which is fulfilled by applyinga two-fold approach: elaborated models were developed describingoverall power consumption in dependence of type of load (com-mercial or residential), time of the day, week day, season, weatherand many parameters more allowing a quite accurate predictionof power consumption. Secondly, the remaining gap is handled bycontrol reserve, i.e., additional power production capacities that arekept in stand-by and activated if needed [55, 56].
If production and consumption are imbalanced, frequency de-viates from its nominal value f0 (in Europe f0 = 50Hz, in the USf0 = 60Hz): If there is more supply than demand, the frequencyincreases; if there is less supply than demand, the frequency de-creases. This happens, because large spinning turbines producethe vast majority of electricity in today’s power grids and storerotational energy, i.e., kinetic energy due to rotation. In case ofover-supply, conservation of energy produces additional torqueon the generator’s spinning axis and accelerates the turbine, i.e.,energy supplied to the turbine is converted into mechanical energyinstead of electric energy. As the turbine speed and the grid fre-quency are rigidly coupled, the grid frequency increases as well.Vice versa, higher power consumption slows down the generatordue to a counter-torque on the spinning axis and lowers the outputfrequency. In fact, a grid’s frequency deviation ∆f = f − f0 withf being the current value is used as the primary indicator for animbalance in demand and supply and triggers the control reserve,bringing the power grid back into equilibrium.
Due to minor imbalances, frequency is fluctuating around thenominal value even under normal operational conditions due tominor imbalances. If deviations are larger than a pre-defined thresh-old, emergency routines are performed to bring the power grid backinto balance. For example, German regulations define a five-stepplan for load-shedding in case frequency drops under certain val-ues [20], see Table 1. These routines protect turbines and otherphysical devices from damage, e.g., due to resonant frequencies.
2.2 Continental Synchronous Grid AreaHistorically, power grids were “islands” with a single power gen-erator which were then stepwise integrated into larger grids forreasons of reliability and costs. Also, consumption spikes are likelyto be handled better by multiple power plants. Cheaper (but typi-cally less controllable) power plants are able to produce the baseload, more expensive (and dynamic and more controllable) plantshandle peak loads. Nowadays, networks are operated on a national,even continental level.
Grid Shock: Coordinated Load-Changing Attacks on Power Grids ACSAC 2017, December 4–8, 2017, San Juan, PR, USA
A parallel operation of generators requires coherence, i.e., opera-tion at exactly the same frequency and in phase, leading to synchro-nous grid areas. Misalignment, e.g., in extreme case, one generatoris at the positive peak of a sine, while another is at the negativepeak, will result in major short-circuit like currents potentiallyleading to fire or physical destruction. The biggest synchronousarea is the continental synchronous grid area, also called synchronousgrid of continental Europe, comprising most of the European Union,Switzerland, many Balkan countries as well as three North Africanstates; there are also plans for further expansion. This implies thatthe sine at a power plug in Athens, Greece is the same as anotherone obtained in Lisbon, Portugal or Tunis, Tunisia. It has a totalproduction capacity of more than 600 GW and a nominal frequencyof 50 Hz.
The continental synchronous grid is organizationally split intocontrol zones which are led by a transmission system operator(TSO) [57]. Control zones are the size of a smaller European coun-try like Austria or Switzerland and mostly follow national bordersor geographical landmarks. Larger countries are split into multiplecontrol zones, e.g., Germany has four. Control zones have connec-tions with adjacent zones via transmission lines. However, theircapacity covers only a fraction of the power consumption and ismostly meant for the compensation of power imbalances.
TSOs are unified in the European Network of Transmission SystemOperators for Electricity (ENTSO-E) which defines regulations onhow to jointly operate the grid. Among these regulations, ENTSO-Especifies the provision and application of control reserve in threesteps to balance production and consumption, namely primary,secondary and tertiary control as described in the following para-graphs [55, 56].
On the physical level, before any control system kicks in, therotational energy stored in the spinning turbines stabilizes thefrequency to a certain extent.
Primary control is activated within seconds after an incident –i.e., frequency deviation is exceeding a certain threshold – and thefirst to actively react to a power imbalance. Primary control is ap-plied in proportion to the frequency deviation, i.e., K · (f − f0), anddoes not bring the frequency back to nominal, it rather stabilizesthe frequency at a stationary value. In practice, a control system(governor) within the power plant observes the grid frequencyand decides whether to increase or decrease power output. In pri-mary control, all generators in the synchronous area participatesimultaneously.
Secondary control is activated after 30 seconds and takes someminutes until full activation. Its task is to replace primary controland return the frequency to its nominal value. This type of controlreserve has to be carried out by the TSO whose control zone isimbalanced. The respective zone is recognized by the Area Con-trol Error (ACE) which is calculated for each zone according toEquation 1.
ACE = Pmeasured − Pplanned + K · (f − f0) (1)
Pmeasured is the sum ofmeasured power transfers on transmissionlines, Pplanned the sum of planned power exchanges with adjacentzones, and K is the network power frequency characteristic of theprimary control. If all produced primary control is exported intoother control zones, ACE is zero and secondary control remains
inactive in the respective area. If the imbalance occurred in itsown zone, a TSO’s ACE differs from zero and secondary control isinitiated.
Tertiary control frees up resources from primary and sec-ondary control after their sustained activation. In contrast to theprior two control mechanisms, tertiary control also allows formanual intervention by the TSO.
2.3 Feedback Loops and ResonanceFrequencies
Control theory distinguishes open-loop systems from closed-loopedsystems. In an open-loop system, the controller aims to achievethe output reaching a set point without monitoring the output; inconsequence, accurate system models are necessary while still notbeing able to adapt in case of unexpected disturbances. Meanwhile,closed-looped systems are measuring the system’s outputy (e.g., viaa sensor), comparing it with the set pointw and reacting upon thecontrol deviation e = w − y. The output counteracts the deviationfrom the set point; this behavior is also known as negative feedback.This way, a disturbance influencing the output is measured, andcounteracted.
Closed-loop controls frequently incorporate delays, as it takestime to measure, calculate and physically react, e.g., when accelerat-ing physical masses. This implies that feedback is not instantaneousand the system might swing when excited at certain frequencies.A signal’s phase shift is dependent on the delay, and a shift of 180degrees changes negative feedback into positive. The feedback doesnot counteract the deviation anymore, but rather reinforces it, lead-ing to self excitation and an increasing amplitude. Such a situationis potentially damaging and thus to be avoided; as a rule of thumb,the control should be faster than the monitored physical system.
Linear controllers exhibit proportional (P), integral (I) or derivate(D) behavior as well as respective combinations: Proportional con-trol amplifies the control deviation e by a constant factor, integralcontrol integrates the control deviation e over time, and derivatecontrol differentiates. Proportional control shows permanent con-trol offset, i.e., the output differs from its intended value by someoffset. If the latter is undesired, proportional control has to be com-bined with integral behavior, forming a PI controller.
Power imbalance influences a grid’s frequency; there aremultiplecontrols reacting on frequency shifts, i.e, closed-loop controls [55,56]. Load, in particular from induction engines, increases/decreaseswith frequency and thereby automatically reduces power imbal-ance. This effect is known as self regulation of loads, and is assumedto be 1%/Hz in the continental synchronous grid. In addition, thereare the operational measures of primary, secondary and tertiarycontrol, rescheduling power production facilities. Primary controlis specified to show proportional behavior, i.e., it cannot returnfrequency to its nominal value of 50Hz, whereas, secondary is acombined proportional, integral (PI) controller returning the fre-quency to its nominal value. Both show delays, i.e., primary controlreacts typically within a few seconds and secondary control within30 seconds, replacing primary control, vulnerable to self-excitation.Since tertiary control can be manually scheduled, its behavior can-not be specified in a similar manner.

ACSAC 2017, December 4–8, 2017, San Juan, PR, USA A. Dabrowski, J. Ullrich, E.R. Weippl
3 THREAT SCENARIOFor our attacks, we assume a botnet controlling a high amount ofcomputers and their peripherals. Each bot can trivially modulatethe power consumption of the CPU, the GPU (Graphics ProcessingUnit), hard drives, and the screen backlight. Laser printers — an pe-ripheral common — are also large power consumers due to the hightemperatures used in their fusion units. In some cases, the botnetmight find other locally accessible Internet-of-Things (IoT) deviceson the network, which often incorporate less security protectionor default passwords, for load modulation.
While each of the devices only contributes several hundred tothousands Watt, their effect multiplies by the botnet producinga large leverage on power consumption within the grid. It canmodulate this power consumption in a coordinated fashion andin a sub-second range. This way, the adversary aims to negativelyaffect the power grid.
In the first part of this section, we introduce different kinds ofload modulation attacks. In the second part, we specify the botnetin detail.
3.1 Attack TypesWe consider an attack successful if of the following effects occurs:
• Customers or power plants become disconnected from thegrid, e.g., by automatic load shedding due to under-frequencyor frequency protection protocols for power plants.
• Transmission lines (tie lines) become disconnected, e.g., byoverload-protections, or adjacent control zones become dis-connected.
Attack 1: Static Load Attack. The attacker increases the powerconsumption of all bots to the maximum; this action shifts powergeneration and consumption out of the equilibrium by increasingthe consumption faster than the producers can react. Just a briefviolation of the frequency thresholds, triggers load shedding (seeTable 1), i.e., the automatic disconnection of parts of the grid. Toenlarge the amplitude of load changes, the adversary might pig-gyback their attack on power spikes and oscillations that usuallyhappen in the grid [23, 26]. This attack targets the primary control.
Attack 2: Dynamic Load Attack. Closed-loop control systems withnegative feedback and non-zero latency tend to over- and under-shoot when reacting to changes. This effect can be used to increasethe amplitude of Attack 1 by measuring the reaction times andmodulate the power consumption so that the highest productionpeak is met with a low modulated demand and vice versa. Sincethe attacker is reacting on the grid, s/he needs a return channel tomeasure the state of the grid,i.e., the current frequency. In particu-lar, the adversary increases the load to the maximum and waits forthe full primary control to be activated; then, decrease the load tothe minimum wait for the primary control to deactivate, and so on.This attack targets the behavior of the primary control.
Eventually, the attacker might find a resonant frequency thatleads to amuch larger frequency swing than appropriate for the loadchange. The ENTSO-E synchronous area is known to have eigen-frequencies that manifest in several post-incident reports [18],[54,p.77],[26, p.3].
Figure 2: Simplified schematic of attack 3
Attack 3: Inter-Zone Attacks. This attack aims to trip tie lines thatare connecting areas by putting large loads on them. A naïve wayto increase the load on a tie line is to find a line that is operatingnear the maximum and increase power consumption in the targetarea of that transfer. Some TSO’s publish their line state on the web[1]. Even though they are delayed in time, it gives an attacker agood insight on when the line is usually loaded the most. However,since primary control detects the increase in load, a part of theadditional load will be produced in the targeted area (control zone),leaving only the rest to the tie line.
Reducing power consumption in one area while simultaneouslyincreasing it in the target area would further increase the burden onthe line, but decreasing load (of mostly idle electronic appliances) isonly possible in rare cases. However, the attacker can wait for theautomatic secondary control to equalize for changes between bothzones to meet scheduled transfers; then change the load modulationbetween zones to achieve the same effect.
Figure 2 depicts the scheme step by step. First, load is added toZone Z1, effectively lowering the transmission on the line (in- andoutgoing transmissions cancel each other out). However, secondarycontrol will compensate for the overproduction in one zone and theunderproduction in another and adjust output power accordinglyto meet the scheduled transfer on the line. The attacker waits untilthis happens and inverts the modulation between the zones, recre-ating the imbalance with reversed sign, again triggering substantialcompensation currents over transmission lines. For simplicity, weassumem1 ≈m2 =m, so that an extra ofm is added to the trans-mission line. Since the total load of the grid does not change, theprimary control will not kick in.
3.2 Anatomy of a Grid-Attacking BotnetA botnet is a set of hijacked computers (called bots or zombies) onthe Internet that is set up to to perform tasks on behalf of the bot-net owner [46]. Among other, botnets gained infamous popularityby traffic-based denial-of-service attacks, mass-hacking, sendingspam, spying on the computer owners, online fraud, mining crypto-currencies, stealing secrets from presidential candidates, and in-fecting other computers. Some botnets operate for years until they

Grid Shock: Coordinated Load-Changing Attacks on Power Grids ACSAC 2017, December 4–8, 2017, San Juan, PR, USA
are detected. The following paragraphs provide details on how anadversary is able to built an adequate botnet for power-load attacks.
Acquisition. Prices of botnets vary depending on the countrythe zombies are placed in. A 2013 report [16], named USD 1,000for 10,000 U.S.-based bots, and between USD 400 and USD 600 forEuropean-based bots. Large botnets contain up to tens of milliondevices [43].
Synchronization. For power grid attacks, a timely communica-tion structure is in order to coordinate precise load manipulations.Modern protocols such as NTP [33, 66] compensate for round-triptime, delivering sub-millisecond performance if allowed to run forextended periods of time [34].
Geographical Estimation. For our attacks, the botnet has tocoarsely estimate the position of the zombie machines. For attacks1 and 2 the granularity can be as low as the continent as centralEurope is an interconnected supergrid. For attacks on the USgrid, the granularity should be at least on state level as there aremultiple synchronous grids. There are various ways to identify thegeographical position of a bot:
• GeoIP lookup: Maxmind [32] and other databases provideat least a state/country level localization – even in the freeversion.
• Wi-Fi localization: Coarse location by BSSIDs of Wi-Fi accesspoints is now a standard technique for mobile phones. Somestand-alone PCs certainly almost all notebooks come with aWi-Fi receiver. Some databases are available free of charge[61].
• Keyboard layout: Malware such as the Conficker worm [10,43] uses the keyboard layout to determine the country of thecomputer to avoid targeting the own country. This workson language-fragmented continents like Europe, but not inNorth America.
Frequency Measurement. Attack 2 and 3 (Section 3.1) benefitfrom the frequency feedback channel. In case the attacker andbot-master is sitting anywhere within the attacked grid, s/he caninvest into a low-cost power grid frequencymeasurement unit, suchas from open-source projects [11, 14], measuring the frequencyat an ordinary power outlet. Since the frequency is identical inall parts of the network (until it breaks up), one measurementstation is sufficient. Attacks on remote grids might approximatemeasurements by analyzing audio/microphone hum, or Webcamlight flickering on target machines — similar to its use in multimediaforensics [12, 25]. Furthermore, some websites [15, 17, 21, 23, 38]offer live data for certain grids.
4 EVALUATION: POWER-MODULATIONTo understand the attack and estimate the effects we have to answertwo questions. First, to which amount can a bot zombie influence itspower consumption and at which pace. Secondly, use simulationsto predict the outcome of such a load attack on the power grid. Theformer is described in this section, the latter in Section 5.
In a lab experiment, we measured a bot’s capability for software-driven load modulation. In a first step, we analyzed the dynamics ofa PC’s load increase/decrease in order to determine their capabilities
Figure 3: Model of botnet zombie and method of measure-ment
Figure 4: Measurement setup in detail
for fast load changes. Then, we categorized different types of devicesthat might become part of our attack and investigated the increaseof load from an idle to a fully utilized state.
4.1 Electric Model of a Load-Altering PCSince PCs and servers appear to have great potential for load control,we took a closer look and asked how fast they can modulate theirpower consumption.
The components of a PC (or Server) do not directly draw powerfrom the mains. Instead, a series of power conversions takes placebefore reaching the relevant components, i.e., CPU, GPU and harddrive. Our model is depicted in Figure 3: We must assume that eachconversion step through the power supply unit (PSU) and subse-quent DC/DC converters incorporates power-stabilizing capacitorswhich will dampen the artificially produced load spikes. To measurethe effective load amplitudes and times as dispensed to the grid, wehad to measure at the power socket (Figure 4).
As a conservative assumption of an office PC, we chose an IntelCore2 Duo (Figure 5). For a high-end gaming PC we tested an Inteli7-6700 with an NVIDIA Geforce GTX 1070 graphics card (Figure7). Both were connected with an LG 24" TFT screen which wasmeasured separately (Figure 6). On Linux, we used command linetools hdparm -t for inducing stress to hard disks, stress -c forthe CPU, and glmemperf for the GPU. OnWindows, we used ZCPUfor CPU stress and 3D Mark to measure the GPU.
As expected according to our model, the capacitors soften thesteep current edges, especially in the low-end range. Thus, the PSUin the old office PC ramped up the consumption within 2-3 ACcycles, i.e., 40-60 ms. In contrast, the gaming PC can multiply itspower consumption and the PSU ramps up the usage within a singleAC cycle. Hard disk consumption turned out to be negligible: mostof the power is used for the disk rotation which is independentfrom head movements.
Laser printers are without question the heaviest power con-sumers of all computer peripherals due to the high temperaturesinvolved when fixating the toner to the paper. The fuser’s surgecurrent is a multiple of its already high power consumption (Figure

ACSAC 2017, December 4–8, 2017, San Juan, PR, USA A. Dabrowski, J. Ullrich, E.R. Weippl
Figure 5: Example: low-endoffice PC. PSU ramps uppower within 2-3 AC cycles
Figure 6: LG 24" TFT screenneeds 8 s before going tosleep mode.
8a). In our setup with a small office/home office (SOHO) printer, theheat-up process started within a second when printing via USB, andseveral seconds when printing over the network. The high powerusage continues for 8 seconds for the first page and 5 seconds forall following pages. On stand-by, the printer reheats the fuser every35 seconds, until it goes to sleep mode after several minutes.
Screens can easily be turned on and off via software as operatingsystems offer power saving controls and appropriate APIs. As seenin Figure 6, the screen first displays a goodbye message (3 seconds),then goes into time-out mode (5 seconds) and finally to sleep.
These measurements (Table 2) give us a preliminary insightregarding the achievable dynamics of load changing attacks per-formed by a botnet. As expected, capacitors in the power conversionunits smear the hard edges of artificially produced power spikes.However, even in the worst case (60 ms per slope) an attacker canachieve modulation frequencies up to 8 Hz.
4.2 Categorization of Load-Altering AppliancesThe second part of this Section looks at the question on the amountof controllable load by PC components and commonly found IoTdevices and their usage.
The last column of Table 2 compromises data from our ownmeasurements, data sheets and PC power tutorials [9].
Since such an overview cannot depict the countless differentmodels of hardware sold and installed around a world, its purposeis to estimate the impact of the attacks described above.
The ∆ Load column denotes the margin of controllable powerconsumption, e.g., the difference between idle state and full utiliza-tion. For example, desktop hard disks (typ. 5,400 RPM) have a lowerbase power consumption than server hard disks (typ. 7,200 - 10,000RPM), but the difference between access and non-access is small.
(a) Intel i7 ZCPU stress test (b) 3D mark benchmark ending
Figure 7: Gaming PC; the PSU ramps up the current withina single AC cycle to a multiple compared to idle usage.
Table 2: Modulated load by device
Pwr Control Latency
Device Type Inc. Dec. on off ∆ Load
CPU
Core2 Duo # 20-60 ms 20-60 ms 35 W
i3 # 20-60 ms 20-60 ms 55-73 W [9]
i5 # 20-60 ms 20-60 ms 73-95 W [9]
i7 # 20-60 ms 20-60 ms 77-95 W [9]
i7-E # 20-60 ms 20-60 ms 130-150 W [9]
GPU
Low-end # 20-60 ms 20-60 ms 20-76 W [9]
Mid-end # 20-60 ms 20-60 ms 102-151 W [9]
High-end # 20-60 ms 20-60 ms 150-238 W [9]
Top-end # 20-60 ms 20-60 ms 201-297 W [9]
HDD # 20-60 ms 20-60 ms 3-7 W [9]
Screen TFT size dep. 1-5 s 5-10 s 60-100 W
Laser Printer SOHO # 1-3 s 5-10 s 800-1300 W
Smart Air Cond. # 1-10 s 600-1000 W
Smart Thermostat elec. Heating # 1-10 s 1-15 kW
Smart Oven # 1-10 s 2-3 kW
Smart Refrigerator # 1-10 s 300-500 W
Smart Kettle # 1-10 s 1000-1500 W
In contrast to other appliances, screens can easily reduce powerwithout much side effects by going to sleep. Major operating sys-tems offer unprivileged API or command line calls to accomplishthat. Hard-disks can be sent to sleep as well (spin-down) but thistypically needs administrator privileges. Furthermore regular back-ground file system activity (book-keeping) will not make the effectlasting without putting the whole OS into sleep. Such a step with-draws the PC from the control of the botnet and is therefore notincluded.
As for printers, we did not considered office printers as they areusually shared by multiple users. Thus, print jobs are sequentializedand power consumption would not multiply with the number ofinfections, as it is spread over time.
Internet-of-Things devices are included in our list although theyare still rare. The exception are smart thermostats [2, 39, 50] beingsold in the U.S since 2015 are increasingly[52], in total 20 milliondevices since 2013 (U.S. has 126 Mio. Households [49]). Such airconditioners [2, 7, 27]) and smart refrigerators [48] can be manipu-lated by changing the set-point temperature. Kitchen appliancessuch as smart ovens [47] and Wi-Fi-controlled water kettles [42]can also substantially draw power.
(a) Heating the fuse unit peakspower at 20A, before settling at4.8A= 1100W
(b) One page consumes 1100W for 8 s(idle) or 5 s (standby). In standby re-heating occurs about every 35 s
Figure 8: Brother HL2150 SOHO printer

Grid Shock: Coordinated Load-Changing Attacks on Power Grids ACSAC 2017, December 4–8, 2017, San Juan, PR, USA
47.5
48
48.5
49
49.5
50
0 5 10 15 20 25 30
Freq
uency
in H
z
Time in s
0.51
1.52
2.53
3.5
(a) Minimal Network Power (TS = 10 s )
47.5
48
48.5
49
49.5
50
0 5 10 15 20 25 30
Freq
uency
in H
z
Time in s
0.51
1.52
2.53
3.5
(b) Median Network Power (TS = 10 s )
47.5
48
48.5
49
49.5
50
0 5 10 15 20 25 30
Freq
uency
in H
z
Time in s
0.51
1.52
2.53
3.5
(c) Maximum Network Power (TS = 10 s )
47.5
48
48.5
49
49.5
50
0 5 10 15 20 25 30
Freq
uency
in H
z
Time in s
0.51
1.52
2.53
3.5
(d) Minimal Network Power (TS = 6 s )
47.5
48
48.5
49
49.5
50
0 5 10 15 20 25 30
Freq
uency
in H
z
Time in s
0.51
1.52
2.53
3.5
(e) Median Network Power (TS = 6 s )
47.5
48
48.5
49
49.5
50
0 5 10 15 20 25 30
Freq
uency
in H
z
Time in s
0.51
1.52
2.53
3.5
(f) Maximum Network Power (TS = 6 s )
Figure 9: Impact of static load attack on frequency in a grid with high rotational inertia (a-c), i.e., predominantly fed byconventional power plants, and low rotational inertia (d-f), i.e., fed by a high share of renewables, at different levels of totalnetwork power. Static load attacks are in multiples of the ENTSO-E reference incident (3000MW).
5 EVALUATION: GRID EFFECTSWe investigated the effects of a botnet’s load change on the conti-nental synchronous grid. In particular, seek to answer in which wayand to what extent load has to be modulated by an adversary usingthe botnet. Furthermore, we studied whether the grid’s state, i.e.,total load or the mix of feeding power plants, influences the successofan attack. Such attacks against critical infrastructure can neverbe tested on a real system, specifically for a grid like the continentalsynchronous grid area providing power to more than 500 millionpeople. Therefore, we developed a model in Matlab/Simulink thatis based on the model of Ulbig et al. [53] and the ENTSO-E poli-cies [55, 56]. In the remainder of this section, we describe in detailthe model, the dependencies of grid parameters, and the success ofeach attack as presented in Section 3.
Attack 1: Static Load Attack. The adversary suddenly increases ahigh amount of load; the raised demand leads to an imbalance ofproduction and consumption, thus shifting the frequency from itsnominal value to lower values. If the adversary’s amount of load is
Figure 10: Model for static load attack (primary control)
high enough, the frequency decreases rapidly without the primarycontrol being able to counteract in time. If the frequency goes downto 49Hz, load is shed due to emergency protocol, i.e., numerousconsumers become disconnected from the power grid.
For a simulation, we developed a model as depicted in Fig-ure 10. The model contains the grid’s response to a production-consumption imbalance with f0 = 50Hz (nominal frequency), starttime constant TS and the network power SN . Further, it containstwo feedback loops: The first considers the the self-regulation ofload in case of frequency changes; the load typically changes 1%/Hz.The other feedback represents primary control, containing a satura-tion when reaching 200mHz (at this point the full primary reserve isactivated), a proportional element with a gain of 15,000MW/s (fullprimary reserve of 3,000MW should be activated at 200mHz), a PT1-element representing turbine characteristics withTN = 2 s (fast gasturbines) and a maximum slew rate of 500MW/s as specified byENTSO-E policies. With TS = 10 and SN = 150GW , the system’sresponse to the reference incident (RI) of 3,000MW correspondswith the design hypothesis of the policies [55] and emphasizes ourmodel’s accordance with the continental synchronous grid. Sec-ondary control is not included into this model as it would not beactivated at such an early phase of imbalance.
In a first step, we investigated the impact of the power grid’snetwork power SN on the amount of load that has to be modifiedby the adversary. SN represents the amount of currently producedpower and differs in the course of days, weeks and seasons. Gener-ally, it is lower during night, summer and on national holidays, asconsumers request less power than during daytime, winter and onwork days. Values for network power PN are taken from ENTSO-Estatistics of the year 2016 [41]: The highest load was 583,711MW onJanuary 19th 2016, 5-6 a.m., the lowest load of 263,591MWwhereas

ACSAC 2017, December 4–8, 2017, San Juan, PR, USA A. Dabrowski, J. Ullrich, E.R. Weippl
0
1000
2000
3000
4000
5000
6000
0 20 40 60 80 100 120
Att
ack
Load in M
W
Time in s
Figure 12: Dynamic load attack (1.5 reference incidents)
on May 29th 2016, 6-7 p.m, occurred the median load of 2016 was409,823MW.
We measure the static load attack in multiples of a ENTSO-E’sreference incident of 3,000MW. The impact of these attacks on gridfrequency with a start time constant of TS = 10 s is shown in Fig-ures 9a-9c. Reaching the threshold of 49Hz causes load shedding,and, thus, a successful attack. At minimal network power twice thereference incident, i.e., 6,000MW is enough, whereas median net-work power requires 2.5 times the reference incident, i.e., 7,500MW,and maximum network power 3.5 times, i.e., 10,500MW. In conclu-sion, it is easier to reach the threshold for load shedding at timesof an overall low power level in the network, i.e., at night, duringsummer and on national holidays.
Finally, the start time constant TS is dependent on the type ofpower plants supplying the grid and is historically getting lower dueto the increased use of renewables (wind turbines, PV)1. TS mightget as low as 6 s [53]. Figures 9d-9f highlight the consequences:more renewables make the frequency shifting faster, and reachingthe threshold for load shedding becomes easier. Low start timeconstants are typically encountered during times of low power gen-eration, e.g., on national holidays with lots of wind, as renewablessources are preferred for supply in Europe.
Attack 2: Dynamic Load Attack. Dynamic attacks promise to bemore successful than static ones, i.e., reach higher frequency shiftswhile modulating the same amount of load. In our case, the adver-sary drives all load to full power, waits until primary control isinitiated and reaches its maximum; then, the adversary withdrawsall power consumption. Since the primary control’s full activationtakes 30 seconds, the attack load is modulated as depicted in Fig-ure 12 (Our simulation relies on the model as shown in Figure 10).
The results of an attack via modulating 1.5 times the referenceincident are shown in Figure 11: the absolute frequency shift at1Photovoltaics and many wind-turbines are connected to the grid by solid-state invert-ers. In consequence, they can not stabilize the grid’s frequency by means of rotationalinertia.
Figure 13: Model for control area including primary and sec-ondary control
0
500
1000
1500
2000
2500
3000
3500
4000
0 50 100 150 200 250 300
Att
ack
Load in M
W (
Are
a 1
)
Time in s
(a) Attack load in area 1
0
500
1000
1500
2000
2500
3000
3500
4000
0 50 100 150 200 250 300
Att
ack
Load in M
W (
Are
a 2
)
Time in s
(b) Attack load in area 2
Figure 14: Inter-zone attack (reference incident)
the second swing after 80 seconds is typically higher than at thefirst one; in addition, the frequency is becoming larger than thenominal value of 50Hz for a period of roughly 30 seconds, i.e.,frequency overshoots despite an adversary that is solely able tomodulate additional load in a grid2. Again, the less network power,e.g., during summer and nights, and the smaller the start timeconstant (more renewables), the easier it is to reach the thresholdof 49Hz for load shedding; the higher the attack load, the higherthe frequency shift.
Attack 3: Inter-Zone Attacks. This attack relies on a synchronousgrid containing multiple zones which are interconnected by trans-mission lines. In a first step, the adversary increases the load inone zone. Secondary control is eventually activated, and compen-sates for this additional consumption. As soon as this happens, theadversary reduces the load, while increasing it in the other zone,waiting for secondary control to compensate again. Finally, thisleads to high amounts of transmission on the tie lines, which mighteventually trip them.
2In the past, wind turbines were disconnected from the grid at a frequency of 50.5 Hz.
48.5
49
49.5
50
50.5
51
0 20 40 60 80 100 120
Freq
uency
in H
z
Time in s
6s10s
(a) Minimal Network Power
48.5
49
49.5
50
50.5
51
0 20 40 60 80 100 120
Freq
uency
in H
z
Time in s
6s10s
(b) Median Network Power
48.5
49
49.5
50
50.5
51
0 20 40 60 80 100 120
Freq
uency
in H
z
Time in s
6s10s
(c) Maximum Network Power
Figure 11: Dynamic load attack at different levels of total network power and rotational inertia
Grid Shock: Coordinated Load-Changing Attacks on Power Grids ACSAC 2017, December 4–8, 2017, San Juan, PR, USA
-4000
-2000
0
2000
4000
6000
0 50 100 150 200 250 300
Transi
t fr
om
Are
a 1
to A
rea 2
in M
W
Time in s
TS = 6sTS = 10s
(a) Minimal Network Power
-4000
-2000
0
2000
4000
6000
0 50 100 150 200 250 300
Transi
t fr
om
Are
a 1
to A
rea 2
in M
W
Time in s
TS = 6sTS = 10s
(b) Median Network Power
-4000
-2000
0
2000
4000
6000
0 50 100 150 200 250 300
Transi
t fr
om
Are
a 1
to A
rea 2
in M
W
Time in s
TS = 6sTS = 10s
(c) Maximum Network Power
49
49.2
49.4
49.6
49.8
50
50.2
50.4
0 50 100 150 200 250 300
Freq
uency
in H
z
Time in s
Area 1, TS = 6sArea 2, TS = 6s
Area 1, TS = 10sArea 2, TS = 10s
(d) Minimal Network Power
49
49.2
49.4
49.6
49.8
50
50.2
50.4
0 50 100 150 200 250 300
Freq
uency
in H
z
Time in s
Area 1, TS = 6sArea 2, TS = 6s
Area 1, TS = 10sArea 2, TS = 10s
(e) Median Network Power
49
49.2
49.4
49.6
49.8
50
50.2
50.4
0 50 100 150 200 250 300
Freq
uency
in H
z
Time in s
Area 1, TS = 6sArea 2, TS = 6s
Area 1, TS = 10sArea 2, TS = 10s
(f) Maximum Network Power
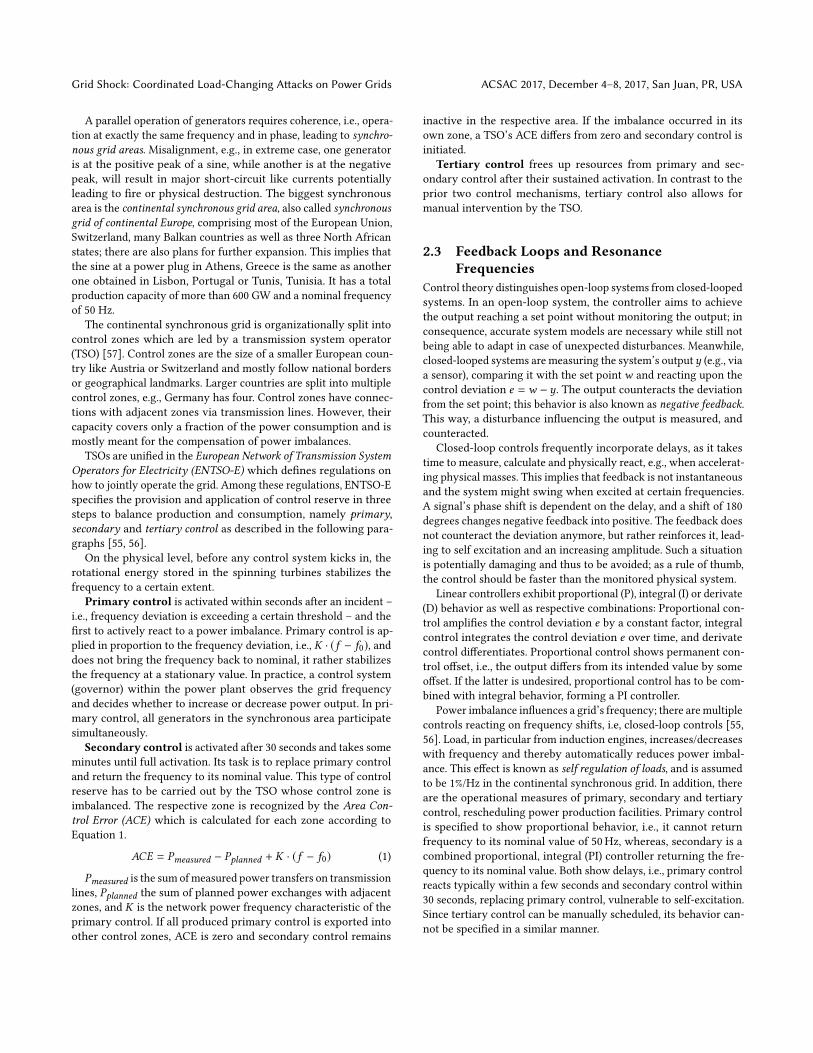
Figure 15: Transit power and frequency deviation in inter-zone attack at different levels of total network power and rotationalinertia
For the simulation, we extended our model by another feed-back loop representing secondary control, see Figure 13. Secondarycontrol calculates the Area Control Error (ACE) as described inSection 2.2. Pmeasured, i.e., the transit to other areas, is fed into themodel via input 2, Pplanned is assumed to be zero. The ACE is thenforwarded to a delay (which might be up to 5 seconds [56]), andeventually to a PID controller representing the secondary controllerwith anti-wind-up functionality (Cp = 0.17,TN = 120), a saturationwhen reaching the maximum amount of secondary control, again aPT1-element representing turbine characteristics tN = 2 s (fast gasturbine), and a ramping as power plants cannot increase/decreasewith arbitrary dynamics. Then, we took two such areas and con-nected them to a 2-area model by subtracting one area’s frequencyfrom the other and feeding the result into the transfer function2πPTie
s to finally gain the power in transmission. Their frequencies
Table 3: Prototypical computer hardware configurationswith expected modulatable load
Components ∆ Watt Office Home Game ServerCore2 35 5% 5% 0% 0%i3 64 40% 30% 5% 30%i5 84 30% 40% 30% 80%i7 86 15% 20% 40% 90%i7E 140 10% 5% 25% 50%GPU-Low 49 50% 50% 5% 0%GPU-Mid 126.5 30% 30% 40% 0%GPU-High 194 15% 15% 40% 0%GPU-Top 249 5% 5% 15% 0%TFT 80 125% 110% 150% 0%Laser Printer 1,100 5% 30% 30% 0%Expected ∆ Load 338.45 600.75 715.8 233.8
are feed into the tie line’s transfer function and further to bothareas but with opposite sign.
Figure 14 shows the load that is modulated by the adversary inareas 1 and 2; Figure 15 shows the result in dependence of totalnetwork power load and rotational inertia. Figures 15a-15c showthat the maximum amount of power in transit over the tie line is toa great extent independent from these parameters. They rather havean impact on the frequency deviation as shown in Figures 15d-15f,but inter-zone attacks aim to trip power lines. Thus, the adversaryhas to aim for a maximal power spike between area 1 and area 2and fast changes, as line-tripping is done based on the total amountof load in transit as well as its time derivative [53].
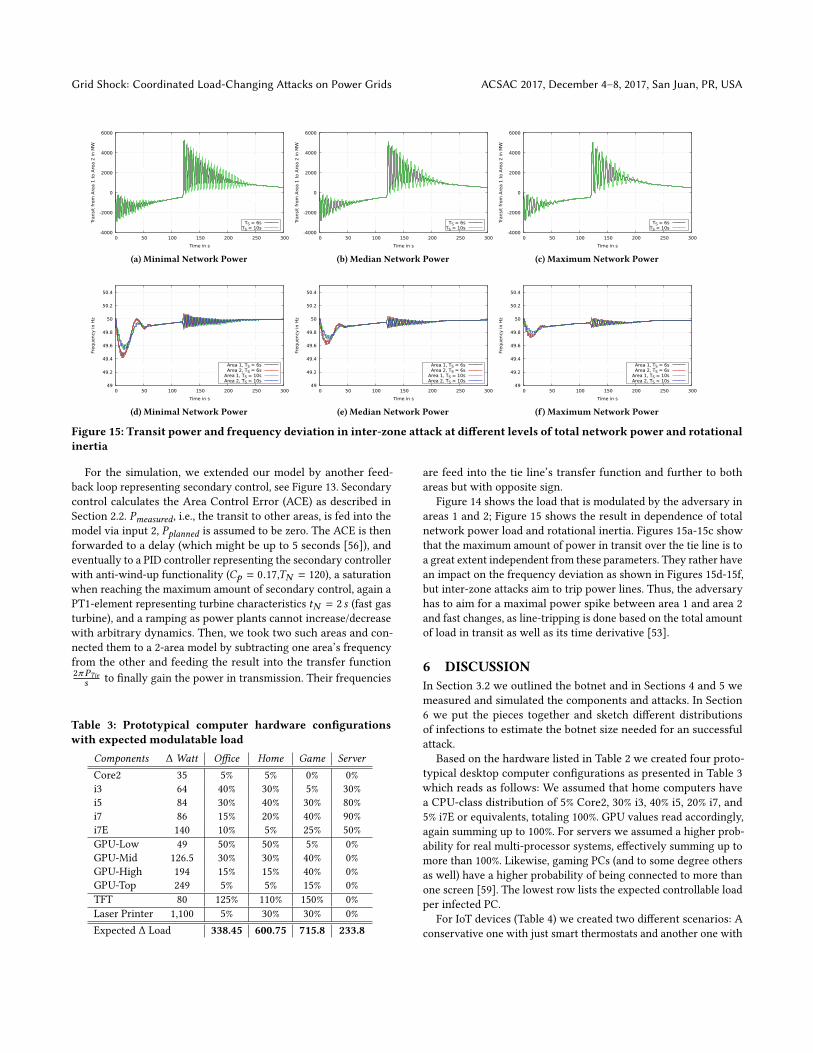
6 DISCUSSIONIn Section 3.2 we outlined the botnet and in Sections 4 and 5 wemeasured and simulated the components and attacks. In Section6 we put the pieces together and sketch different distributionsof infections to estimate the botnet size needed for an successfulattack.
Based on the hardware listed in Table 2 we created four proto-typical desktop computer configurations as presented in Table 3which reads as follows: We assumed that home computers havea CPU-class distribution of 5% Core2, 30% i3, 40% i5, 20% i7, and5% i7E or equivalents, totaling 100%. GPU values read accordingly,again summing up to 100%. For servers we assumed a higher prob-ability for real multi-processor systems, effectively summing up tomore than 100%. Likewise, gaming PCs (and to some degree othersas well) have a higher probability of being connected to more thanone screen [59]. The lowest row lists the expected controllable loadper infected PC.
For IoT devices (Table 4) we created two different scenarios: Aconservative one with just smart thermostats and another one with

ACSAC 2017, December 4–8, 2017, San Juan, PR, USA A. Dabrowski, J. Ullrich, E.R. Weippl
Table 4: IoT scenarios
IoT ∆ Watt Mix 1 Mix 2AC 800 0% 4%Thermostat 8,000 4% 8%Oven 2,500 0% 1%Refrigerator 400 0% 1%Kettle 1,250 0% 1%Expected ∆ Load 320 692.75
additional devices. The former reflects the fact that est. 20 Milliondevices [52] have been sold in the last 4 years in the U.S. to their126 Mio. housholds [49]. We reduced the factor by 1/3 to accountfor to the distribution of electric heating systems [40] in the U.S.
Table 5 combines the different computer types from Table 3 aswell as the IoT scenarios into three possible infection distributions,whereas the first — most conservative estimation — excludes IoTdevices completely. The second distribution corresponds with thefirst, with the addition of thermostats and the third adds all classesof IoT devices.
The following row computes the expected controllable load onaverage per installation of a botnet client, based on the distributionof infected computers. The last two rows display the botnet sizenecessary for 1 and 1.5 reference incidents (3,000 MW or 4,500 MWrespectively).
Depending on the mix of infected devices, a successful attackcan be achieved with 2.5 to 9.8 million devices — depending onother conditions described in Section 5 are met, such as day of timeand mix of energy sources. For attacks 1 and 2 the infections canbe located anywhere within the synchronous grid.
While this can only be considered a rough estimate, it is wellwithin reach of real-world botnets. More accurate estimates aredifficult [6, 44], but go up to 50 Mio. infected computers at thepeaks times of certain botnets [51]. These figures cover infectionsglobally, but Europe’s estimated 17% share of Internet users in 2017[35] and high technological level let these numbers appear feasible.Furthermore, we anticipate an increase of connected computersand Internet-enabled devices in the next years.
6.1 LimitationsThe used simulation models are based on Ulbig et al. [53] and haveto estimate some properties of the grid such as the mix of generatorcharacteristics. A more precise simulation is possible with datafrom TSOs or ENTSO-E which include the exact mix of connectedpower plants and their scheduled (or actual) availability.
6.2 Future workThe simulation model for attack 2 uses resonance mainly causedby activation delay and generator characteristics of the primarycontrol. However, additional grid-inherent resonances are knownfor the ENTSO-E synchronous area [18],[54, p.77],[26, p.3]. Anattacker could piggyback on top of them and try to amplify themto gain more leverage. Grid-inherent resonant frequencies couldalso amplify the effects of attack 3.
We did not look at cascading effects which were almost alwaysinvolved in large scale power outages [19, 54, 58]. These simulations
Table 5: Infections neededDistribution 1 Distribution 2 Distribution 3
Office PC 40% 40% 30%Home PC 30% 30% 40%Gameing PC 15% 15% 20%Server 15% 15% 10%+ IoT-Mix (Table 4) - Mix 1 Mix 2Avg. ∆ Load p. Infection 458.045W 778.045W 1,201.125WInfections 3000MW (1 RI) 6,549,575 3,855,819 2,497,659Infections 4500MW (1.5 RI) 9,824,363 5,783,728 3,746,488
are only possible with grid wide topology data including all tie linescharacteristics.
In this paper we only targeted severe power disruptions of thegrid e.g., by load shedding. However, an attacker could also justaim for economic damage invisible to the end-customer. Immediatecosts arise by the additional deployment of reserves and increasedunplanned international transfers. Long-term costs are associatedwith the permanent allocation of reserves as preparation for suchattacks.
7 RELATEDWORKIrregular behavior in power grids happens from time to time, mostlydue to unexpected incidents and not as a consequence of mali-cious behavior. ENTSO-E investigates and publishes such incidentsto advance the knowledge for proper incident response. Thereby,ENTSO-E reported on inter-area oscillations [18], the impact ofsolar eclipses on power production [45], a blackout in larger partsof central Europe caused by a cascade of tripping lines [54], and asimilar one in Turkey [19]. The first action against a power gridknown to have beenmalicious happened in the Ukraine in 2015. Theadversaries used malware delivered via e-mails, stole credentialsand finally got access to the power providers’ SCADA systems [8].The adversaries used attack vectors well-known in traditional IT,whereas our attacks strike the power grid – a cyber-physical system– in its physical part.
Numerous works considered false data injection attacks, i.e., anadversary compromising meters and sending wrong data to theprovider, and their detection [29–31, 63, 65]. Mishra et al. [36] inves-tigated rate alteration attacks, i.e., fabrication of price messages, insmart grids. Mohsenian et al. [37] introduced the notion of Internet-based load attacks on smart grids, for example by manipulatingcomputational load, exploiting capabilities of demand-side manage-ment or (apparently) manipulating spot-market electricity prices,e.g., so that programmable smart meters start charging electric carsall at once. Furthermore, the remote kill switch found in some smart-meters to disconnect subscribers from the grid has been suggestedfor similar destabilizing attacks on power grids as in our paper[5, 13]. However, as of 2017, meters with demand-side managementare rolled out only to a limited extent. Smart meters that are rolledout at large-scale under various national and EU programs [24]often are metering-only and do not include a power control switchas they are more expensive and some nations completely opt outfrom such functionality [22].
Amini et al. [3, 4] claim that dynamic load attacks are moresuccessful with respect to their impact on grid frequency. Their

Grid Shock: Coordinated Load-Changing Attacks on Power Grids ACSAC 2017, December 4–8, 2017, San Juan, PR, USA
model requires, however, huge power-shocks, effectively doublingthe power consumption. We considered attacks with a load up to3.5 times the continental synchronous grid’s reference incident, i.e.,10,500MW in total. This is lower than 4 % of the grid’s total load,even at times of lower network power, thus making our attacksmore practicable.
Xu et al. [62] aimed to increase loads in IaaS, PaaS and SaaSclouds to trip data centers’ circuit breakers. The load increase iscaused by the adversary renting cloud services or by using externalweb services to trigger computationally expensive operations. Theauthors sought to unplug a cloud provider’s data center, but did notnegatively impact the power grid itself, whereas our attacks aimto directly shut down the power grid or at least parts of it. Beyondthat, our attack load might consist of any kind of controllable loadand is not limited to cloud-based loads.
8 CONCLUSIONPower grids are among the largest human-made control structuresand pre-date large communication networks like the Internet bydecades. Their successful, i.e., synchronized, operation requiresconstant balance of power supply and demand; therefore, powerproviders maintain elaborated models to forecast demand in de-pendence of parameters like time of the day, season and weatherconditions. However, these models rely on the assumption that fluc-tuations caused by single consumers are averaged out on a macroscale, i.e., for each consumer turning a light bulb off there is anotherone turning the light on. In our scenario, an adversary builds (orrents) a botnet of zombie computers and modulates their powerconsumption, e.g., by utilizing CPU, GPU, screen brightness, andlaser printers in a coordinated way. Outperforming the grid’s coun-tervailing mechanisms in time, the grid is pushed into an unstablestate triggering automated load shedding or tie line tripping due tounder-frequency.
We developed three different attacks against the power gridand analyzed their feasibility. Therefore, we first investigated thedynamics and increase of different loads, in particular regardingPCs and IoT devices. We found CPUs, GPUs, and screens with acontrollable load increase of 100W and more; printers and IoTdevices with even 1,000W and more. In a second step, we simulatedthe impact of load attacks on grid stability, given that testing ourattacks on a real power grid is infeasible for a variety of reasons.
Under favorable conditions, i.e., low total network power and ahigh share of inverter-connected renewables feeding power intothe grid, 4,500MW of additional load is sufficient to destabilizethe system and trigger load shedding. In the European continentalsynchronous grid area, these conditions are typically prevalent atnight or on public holidays with highwind power supply. Accordingto our computations, an adversary requires a botnet of 2.5 to 9.8million bots (Table 5). While this is not feasible in all cases, it mightbe worthwhile for entire nation attacks.
While terminology and details differ between synchronous gridsworldwide, we want to stress that the general principles and con-clusions are applicable to all AC power grids and our attacks workin every of these grids, though minor adaptions likely be necessary.
9 ACKNOWLEDGMENTSWe like to thank the reviewers for their constructive comments andadditional insights.
This work was partially sponsored with the CyPhySec project bythe Bridge Frühphase program and the COMET K1 program, bothby the Austrian Research Promoting Agency (FFG). Isometric iconsfrom the Lincity-ng project in Figure 1 distributed under CC-BY-SA-v2.
REFERENCES[1] 50Hertz Transmission GmbH. 2017. Grid load in the 50Hertz control area. (2017).
http://www.50hertz.com/en/Grid-Data/Grid-load[2] Airpatrol. 2017. Smart Air Conditioner Controllers. (2017). http://www.airpatrol.
eu/ accessed 2017-06-04.[3] S. Amini, H. Mohsenian-Rad, and F. Pasqualetti. 2015. Dynamic load altering
attacks in smart grid. In 2015 IEEE Power Energy Society Innovative Smart GridTechnologies Conference (ISGT). 1–5. https://doi.org/10.1109/ISGT.2015.7131791
[4] S. Amini, F. Pasqualetti, and H. Mohsenian-Rad. 2017. Dynamic Load AlteringAttacks Against Power System Stability: Attack Models and Protection Schemes.IEEE Transactions on Smart Grid (2017), 1–1.
[5] R. Anderson and S. Fuloria. 2010. Who Controls the off Switch?. In 2010 FirstIEEE International Conference on Smart Grid Communications. 96–101. https://doi.org/10.1109/SMARTGRID.2010.5622026
[6] Manos Antonakakis, Tim April, Michael Bailey, Matt Bernhard, Elie Bursztein,Jaime Cochran, Zakir Durumeric, J. Alex Halderman, Luca Invernizzi, MichalisKallitsis, Deepak Kumar, Chaz Lever, Zane Ma, Joshua Mason, Damian Menscher,Chad Seaman, Nick Sullivan, Kurt Thomas, and Yi Zhou. 2017. Understanding theMirai Botnet. In 26th USENIX Security Symposium (USENIX Security 17). USENIXAssociation, Vancouver, BC, 1093–1110. https://www.usenix.org/conference/usenixsecurity17/technical-sessions/presentation/antonakakis
[7] General Electric Appliances. 2017. GE WiFi Connect - Air Conditioners. (2017).http://www.geappliances.com/ge/connected-appliances/air-conditioners.htm ac-cessed 2017-06-04.
[8] Brian Harrell. 2017. Why the Ukraine power grid attacks should raise alarm.(2017). http://www.csoonline.com/article/3177209/security/why-the-ukraine-power-grid-attacks-should-raise-alarm.html
[9] buildcomputers.net. 2017. Power Consumption of PC Components in Watts.(2017). http://www.buildcomputers.net/power-consumption-of-pc-components.html accessed 2017-05-06.
[10] Pierre-Marc Bureau. 2009. Malware Trying to Avoid Some Countries.(2009). https://www.welivesecurity.com/2009/01/15/malware-trying-to-avoid-some-countries/ accessed 2017-05-30.
[11] Michael Ciuffo. 2012. Transistor Clock Part 1: Power and Time Base. (2012).http://ch00ftech.com/2012/06/20/2279/ accessed 2017-06-05.
[12] Alan J. Cooper. 2008. The Electric Network Frequency (ENF) as an Aid to Authen-ticating Forensic Digital Audio Recordings – an Automated Approach. In AudioEngineering Society Conference: 33rd International Conference: Audio Forensics-Theory and Practice. http://www.aes.org/e-lib/browse.cfm?elib=14411
[13] M. Costache, V. Tudor, M. Almgren, M. Papatriantafilou, and C. Saunders. 2011.Remote Control of Smart Meters: Friend or Foe?. In 2011 Seventh European Confer-ence on Computer Network Defense. 49–56. https://doi.org/10.1109/EC2ND.2011.14
[14] Mathias Dalheimer. 2016. An open-source infrastructure for power grid monitor-ing. (2016). https://github.com/netzsinus Github repository.
[15] Mathias Dalheimer. 2017. Momentane Frequenzabweichung im Stromnetzes.(2017). https://netzsin.us/ in German, accessed 2017-06-05.
[16] Dancho Danchev. 2013. How much does it cost to buy 10,000 U.S.-based malware-infected hosts? (2013). https://www.webroot.com/blog/2013/02/28/how-much-does-it-cost-to-buy-10000-u-s-based-malware-infected-hosts/ accessed 2017-05-30.
[17] Dynamic Demand. 2017. Dynamic Demand. (2017). http://www.dynamicdemand.co.uk/grid.htm accessed 2017-06-05.
[18] European Network of Transmission System Operators for Electricity. 2011.Analysis of CE Inter-Area Osciallations Of 19 and 24 February 2014. (2011).https://www.entsoe.eu/fileadmin/user_upload/_library/publications/entsoe/RG_SOC_CE/Top7_110913_CE_inter-area-oscil_feb_19th_24th_final.pdf
[19] EuropeanNetwork of Transmission SystemOperators for Electricity. 2015. Reporton Blackout in Tureky on 31st March 2015. (2015).
[20] Forum Netztechnik. 2012. Technische Anforderungen an die automatische Fre-quenzentlastung. (2012). In German.
[21] Thomas Gobmaier. 2017. Measurement of the mains frequency. (2017). http://www.mainsfrequency.com/ accessed 2017-06-05.
[22] Nicolas Höning. 2013. Remote "shut-off" option cancelled for Dutch smart meters.(2013). https://www.nicolashoening.de/?energy&nr=238 accessed 2017-09-24.

ACSAC 2017, December 4–8, 2017, San Juan, PR, USA A. Dabrowski, J. Ullrich, E.R. Weippl
[23] Markus Jaschinsky. 2017. altuelle Netzfrequenz (47,5-52,5 Hz) - Netzfrequenz.info.(2017). https://www.netzfrequenz.info/aktuelle-netzfrequenz-full accessed 2017-06-05.
[24] Joint Research Centre of the Eurpean Comission. 2017. Smart Metering deploy-ment in the European Union. (2017). http://ses.jrc.ec.europa.eu/smart-metering-deployment-european-union
[25] Mateusz Kajstura, Agata Trawinska, and Jacek Hebenstreit. 2005. Application ofthe Electrical Network Frequency (ENF) Criterion. Forensic Science International155, 2 (2005), 165–171. https://doi.org/10.1016/j.forsciint.2004.11.015
[26] Mats Larsson, Walter Sattinger, Luis-Fabiano Santos, and Roland Notter. 2013.2013 IEEE Power & Energy Society General Meeting. Institute of Electrical and Elec-tronics Engineers, Chapter Practical Experience with Modal Estimation Tools atSwissgrid. https://library.e.abb.com/public/503f299a520c490c972def08598f6d7b/Practical%20Experience%20with%20Modal%20Estimation.pdf
[27] LG. 2017. LG Smart AC with mobile app. (2017). http://www.lg-dfs.com/smartac.aspx accessed 2017-06-04.
[28] X. Li, X. Liang, R. Lu, X. Shen, X. Lin, and H. Zhu. 2012. Securing smart grid:cyber attacks, countermeasures, and challenges. IEEE Communications Magazine50, 8 (August 2012), 38–45. https://doi.org/10.1109/MCOM.2012.6257525
[29] X. Liu and Z. Li. 2014. Local Load Redistribution Attacks in Power Systems WithIncomplete Network Information. IEEE Transactions on Smart Grid 5, 4 (2014),1665–1676.
[30] X. Liu, Z. Li, and Z. Li. 2016. Optimal Protection Strategy Against False DataInjection Attacks in Power Systems. IEEE Transactions on Smart Grid (2016), 1–9.
[31] K. Manandhar, X. Cao, F. Hu, and Y. Liu. 2014. Detection of Faults and AttacksIncluding False Data Injection Attack in Smart Grid Using Kalman Filter. IEEETransactions on Control of Network Systems 1, 4 (2014), 370–379.
[32] MaxMind Inc. 2017. GeoIP Products. (2017). http://dev.maxmind.com/geoip/accessed 2017-05-30.
[33] D. Mills. 1992. Network Time Protocol (Version 3) Specification, Implementationand Analysis. RFC 1305 (Draft Standard). (March 1992), 109 pages. https://doi.org/10.17487/RFC1305 Obsoleted by RFC 5905.
[34] David L. Mills. 2014. Clock Discipline Algorithm. (2014). https://www.eecis.udel.edu/~mills/ntp/html/discipline.html accessed 2017-05-30.
[35] Miniwatts Marketing Group. 2017. World Internet Users Statistics and 2017World Population Stats. (2017). http://www.internetworldstats.com/stats.htmaccessed 2017-09-22.
[36] S. Mishra, X. Li, A. Kuhnle, M. T. Thai, and J. Seo. 2015. Rate alteration attacks insmart grid. In 2015 IEEE Conference on Computer Communications (INFOCOM).2353–2361.
[37] A. H. Mohsenian-Rad and A. Leon-Garcia. 2011. Distributed Internet-Based LoadAltering Attacks Against Smart Power Grids. IEEE Transactions on Smart Grid 2,4 (Dec 2011), 667–674. https://doi.org/10.1109/TSG.2011.2160297
[38] NationalGridUSA Service Company, Inc. 2017. Electricity Transmission Oper-ational Data. (2017). http://www2.nationalgrid.com/uk/industry-information/electricity-transmission-operational-data/
[39] Nest Labs, Inc. 2017. Meet the Nest Learning Thermostat. (2017). https://nest.com/thermostat/meet-nest-thermostat/ accessed 2017-06-04.
[40] Department of Energy. 2017. Home Heating Systems. (2017). https://energy.gov/energysaver/home-heating-systems accessed 2017-06-08.
[41] EuropeanNetwork of Transmission SystemOperators For Electricity. 2017. PowerStatistics. (2017). https://www.entsoe.eu/data/statistics/Pages/default.aspx ac-cessed 2017-06-06.
[42] Darren Pauli. 2015. Connected kettles boil over, spill Wi-Fi passwords overLondon. (2015). https://www.theregister.co.uk/2015/10/19/bods_brew_ikettle_20_hack_plot_vulnerable_london_pots/ accessed 2017-05-04.
[43] Phillip Porras, Hassen Saidi, and Vinod Yegneswaran. 2009. An Analysis ofConficker’s Logic and Rendezvous Points. Technical Report. SRI International.http://www.csl.sri.com/users/vinod/papers/Conficker/ accessed 2017-05-30.
[44] Moheeb Abu Rajab, Jay Zarfoss, Fabian Monrose, and Andreas Terzis. 2007. MyBotnet is Bigger Than Yours (Maybe, Better Than Yours): Why Size EstimatesRemain Challenging. In Proceedings of the First Conference on First Workshop onHot Topics in Understanding Botnets (HotBots’07). USENIX Association, Berkeley,CA, USA, 5–5.
[45] Regional Group Contitental Europe and Synchronous Area Great Britain. 2015.Solar Eclipse 2015 - Impact Analysis. (2015).
[46] Rafael A. Rodríguez-Gómez, Gabriel Maciá-Fernández, and Pedro García-Teodoro.2013. Survey and Taxonomy of Botnet Research Through Life-cycle. ACMComput.
Surv. 45, 4, Article 45 (Aug. 2013), 33 pages.[47] Samsung. 2016. NE58K9850WG/AA - 5.8 cu. ft. Slide-In Electric Flex
Duo Range with Dual Door. (2016). http://www.samsung.com/us/home-appliances/ranges/slide-in/ne58k9850wg-slide-in-electric-flex-duo-range-with-dual-door-black-stainless-steel-ne58k9850wg-aa/
[48] Samsung. 2017. Family Hub Refrigirator. (2017). http://www.samsung.com/us/explore/family-hub-refrigerator/ accessed 2017-06-04.
[49] Inc. Statista. 2016. Number of households in the U.S. from 1960 to 2016 (in mil-lions). (2016). https://www.statista.com/statistics/183635/number-of-households-in-the-us/ accessed 2017-06-07.
[50] tado GmbH. 2017. Smart heating control. (2017). https://www.tado.com/ accessed2017-06-04.
[51] Karl Thomas. 2015. Nine bad botnets and the damage they did. (2015). https://www.welivesecurity.com/2015/02/25/nine-bad-botnets-damage/ accessed 2017-06-08.
[52] Katherine Tweed. 2015. Smart Thermostats Begin to Dominate the Market in2015. (2015). https://www.greentechmedia.com/articles/read/smart-thermostats-start-to-dominate-the-market-in-2015 accessed 2017-06-07.
[53] Andreas Ulbig, Theodor S. Borsche, and Göran Andersson. 2014. Impact of LowRotational Inertia on Power System Stability and Operation. arXiv 1312.6435(2014). https://arxiv.org/abs/1312.6435.
[54] Union for the Co-Ordination of Transmission of Electricity. 2007.Final Report: System Disturbance on 4 November 2006. (2007).https://www.entsoe.eu/fileadmin/user_upload/_library/publications/ce/otherreports/Final-Report-20070130.pdf
[55] Union for the Coordination of the Transmission of Electricity (UCTE). 2004.Continental Europe Operation Handbook. European Network of TransmissionSystem Operators for Electricity, Chapter Appendix 1 - Load-Frequency Con-trol and Performance. https://www.entsoe.eu/fileadmin/user_upload/_library/publications/entsoe/Operation_Handbook/Policy_1_Appendix%20_final.pdf
[56] Union for the Coordination of the Transmission of Electricity (UCTE). 2004. Con-tinental Europe Operation Handbook. European Network of Transmission SystemOperators for Electricity, Chapter Policy 1 - Load-Frequency Control and Per-formance. https://www.entsoe.eu/fileadmin/user_upload/_library/publications/entsoe/Operation_Handbook/Policy1_final.pdf
[57] Union for the Coordination of the Transmission of Electricity (UCTE).2004. Continental Europe Operation Handbook. European Network ofTransmission System Operators for Electricity, Chapter Introduction.https://www.entsoe.eu/fileadmin/user_upload/_library/publications/entsoe/Operation_Handbook/introduction_v25.pdf
[58] U.S.-Canada Power System Outage Task Force. 2004. Final Report on the August14, 2003 Blackout in the United States and Canada: Causes and Recommendations.(2004). https://www.energy.gov/sites/prod/files/oeprod/DocumentsandMedia/BlackoutFinal-Web.pdf
[59] Valve Corporation. 2017. Steam Hardware & Software Survey. (2017). http://store.steampowered.com/hwsurvey/ accessed 2017-06-07.
[60] Verband der Netzbetreiber (VDN). 2007. TransmissionCode 2007 - Netz-und Systemregeln der deutschen Übertragungsnetzbetreiber. (2007).https://www.bdew.de/internet.nsf/id/A2A0475F2FAE8F44C12578300047C92F/$file/TransmissionCode2007.pdf In German.
[61] Wiggle Project. 2017. Wiggle: Wireless Network Mapping. (2017). https://wigle.net/ accessed 2017-05-30.
[62] Zhang Xu, Haining Wang, Zichen Xu, and Xiaorui Wang. 2014. Power Attack:An Increasing Threat to Data Centers. In Network and Distributed System SecuritySymposium 2014, Proceedings of. Internet Society.
[63] J. Yan, Y. Tang, Bo Tang, H. He, and Y. Sun. 2016. Power grid resilience againstfalse data injection attacks. In 2016 IEEE Power and Energy Society General Meeting(PESGM). 1–5.
[64] Y. Yan, Y. Qian, H. Sharif, and D. Tipper. 2012. A Survey on Cyber Security forSmart Grid Communications. IEEE Communications Surveys Tutorials 14, 4 (2012),998–1010.
[65] Q. Yang, J. Yang, W. Yu, D. An, N. Zhang, and W. Zhao. 2014. On False Data-Injection Attacks against Power System State Estimation: Modeling and Coun-termeasures. IEEE Transactions on Parallel and Distributed Systems 25, 3 (2014),717–729.
[66] G. Zorn. 2010. RADIUS Attributes for IEEE 802.16 Privacy Key ManagementVersion 1 (PKMv1) Protocol Support. RFC 5904 (Informational). (June 2010),15 pages. https://doi.org/10.17487/RFC5904


![Detection of Hidden Transformer Tap Change Command Attacks ... · of threats to smart grids called Coordinated Cyber-Physical Attacks (CCPA) have been considered in [26]. In [26],](https://img.pdfslide.net/doc/110x75/5f2c0d87b0c3733cb2797017/detection-of-hidden-transformer-tap-change-command-attacks-of-threats-to-smart.jpg)


![A Selective Defense for Mitigating Coordinated Call AttacksAvailable defenses for DDoS targeting VoIP services, such as [27,17,29,31], are constructed to mitigate attacks by analysing](https://img.pdfslide.net/doc/110x75/5ff9f42505b379356377fd26/a-selective-defense-for-mitigating-coordinated-call-available-defenses-for-ddos.jpg)