Embed Size (px)
Citation preview
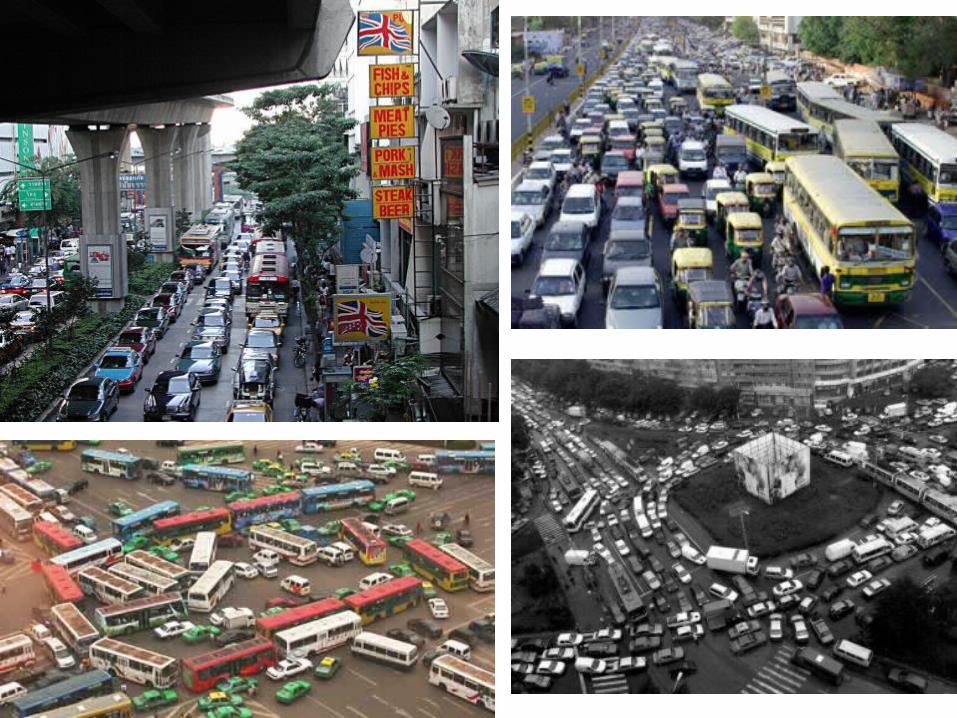
GRIDLOCK IN CITIES
Nikolas Geroliminis Carlos Daganzo
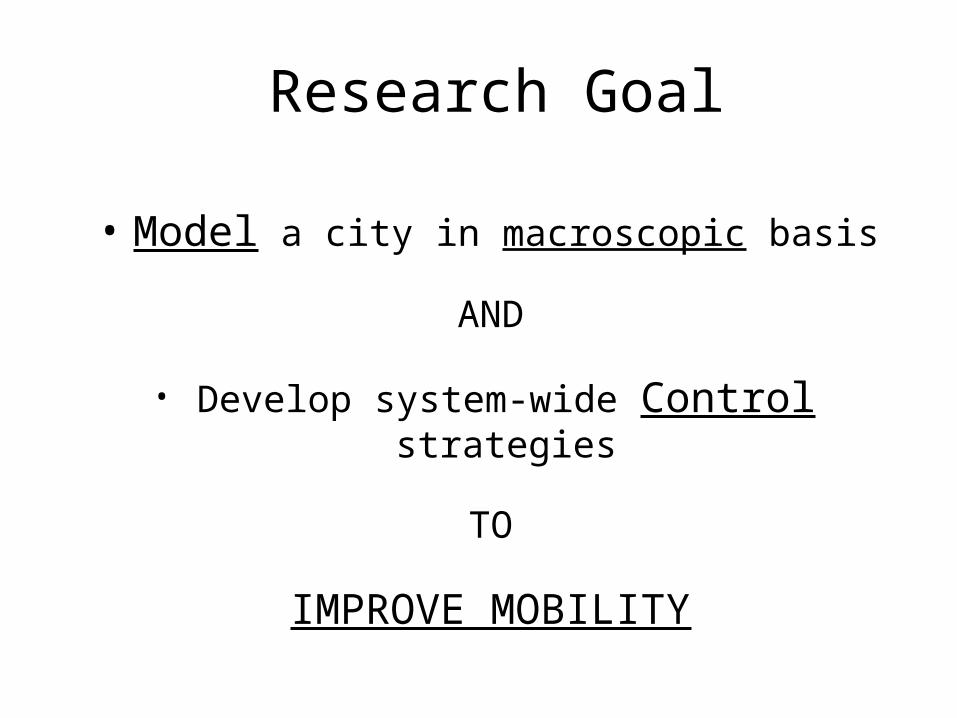
Research Goal
• Model a city in macroscopic basis
AND
• Develop system-wide Control strategies
TO
IMPROVE MOBILITY
Why macroscopically?
• Prediction-based models require time dependent O-D tables
• Highly congested networks exhibit chaotic behavior1, 2
1, 2 Daganzo, 1998 and 2005
EXISTING MODELS ARE NOT REALISTIC AND APPROPRIATE TO DEAL WITH CROWDED CONDITIONS

URBAN GRIDLOCK: KEY ISSUES
• Move from PREDICTION to OBSERVATION
• ROBUST APPROACH
PROPOSE→ MONITOR→MODIFY
• Information Technology
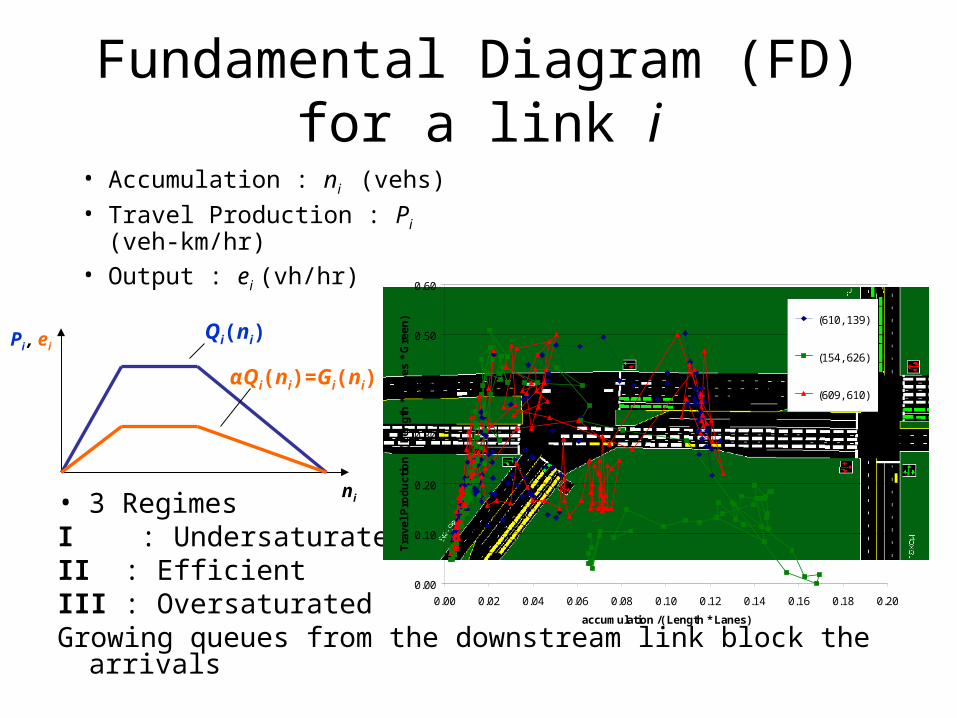
Fundamental Diagram (FD) for a link i
• 3 Regimes I : UndersaturatedII : Efficient III : Oversaturated Growing queues from the downstream link block the arrivals
• Accumulation : ni (vehs)• Travel Production : Pi (veh-km/hr)• Output : ei (vh/hr)
Pi , ei
ni
Qi(ni)
αQi(ni)=Gi(ni)
0.00
0.10
0.20
0.30
0.40
0.50
0.60
0.00 0.02 0.04 0.06 0.08 0.10 0.12 0.14 0.16 0.18 0.20
accumulation /( Length * Lanes)
Tra
vel
Pro
du
ctio
n /
( L
eng
th *
Lan
es *
Gre
en) (610, 139)
(154, 626)
(609, 610)
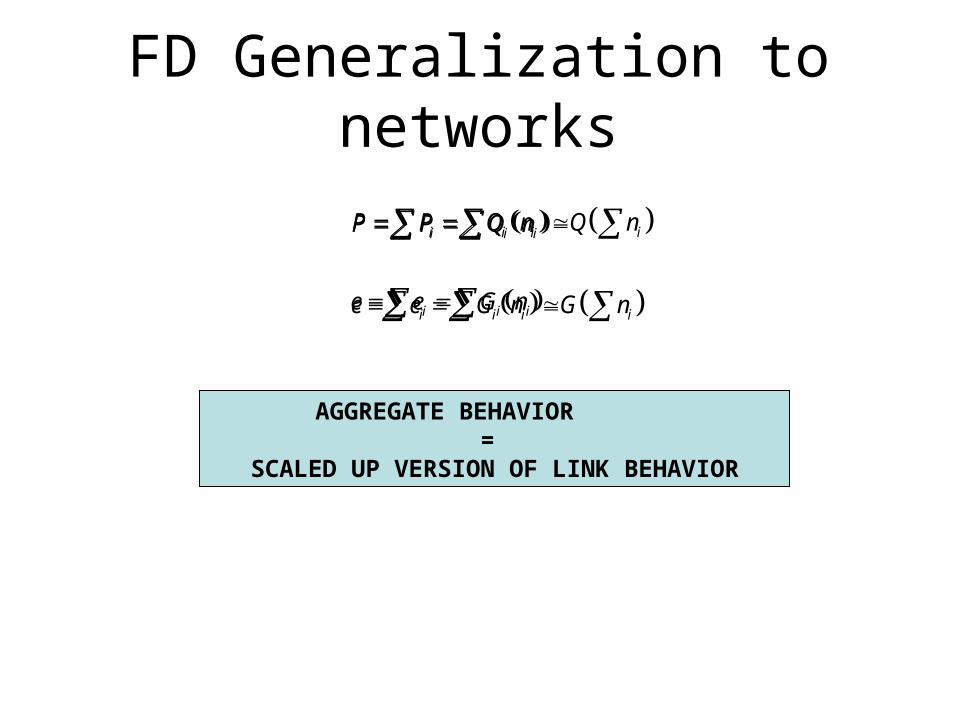
FD Generalization to networks
i i i i
i i i i
P P Q n Q n
e e G n G n
i i i
i i i
P P Q n
e e G n
AGGREGATE BEHAVIOR =
SCALED UP VERSION OF LINK BEHAVIOR
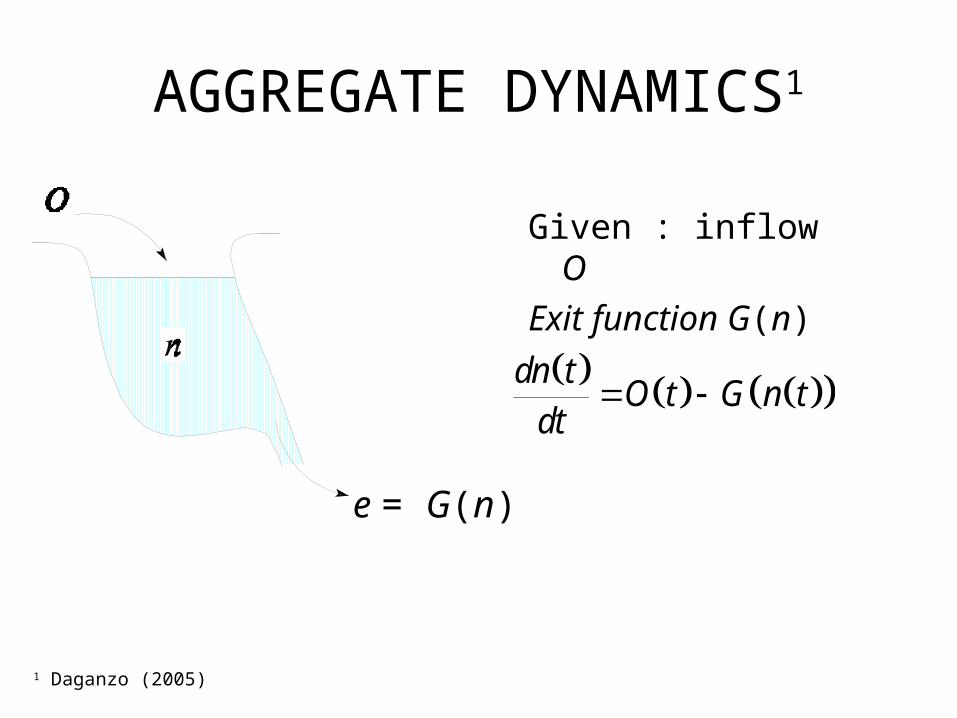
AGGREGATE DYNAMICS1
Given : inflow O
Exit function G(n)
dn tO t G n t
dt
e = G(n)
1 Daganzo (2005)
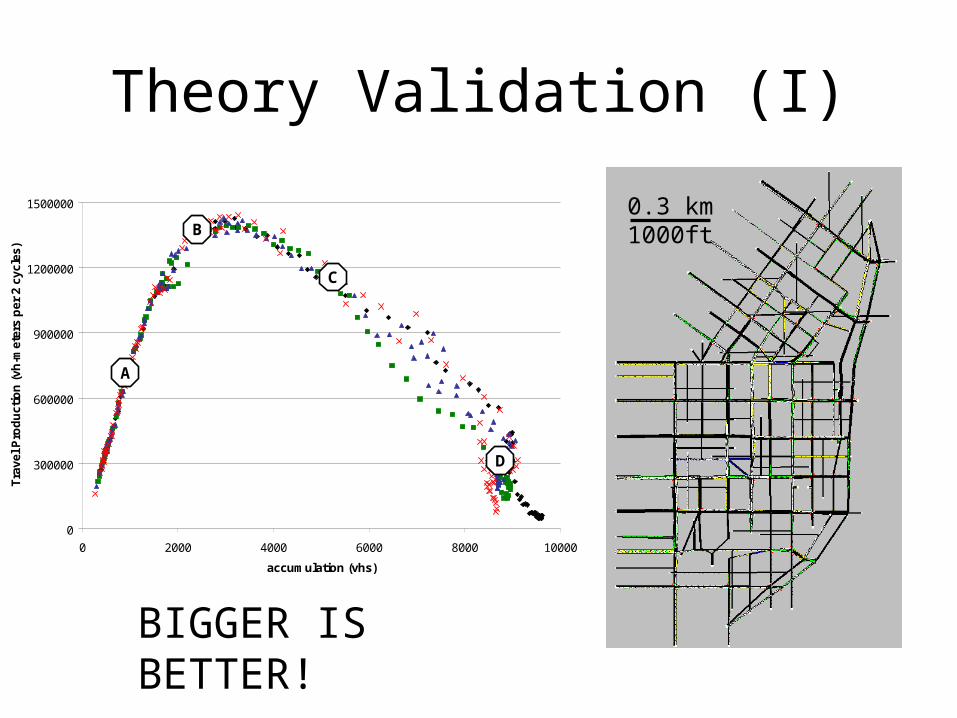
Theory Validation (I)
0.3 km1000ft
0
300000
600000
900000
1200000
1500000
0 2000 4000 6000 8000 10000
accumulation (vhs)
Tra
vel
Pro
du
ctio
n (
vh-m
eter
s p
er 2
cyc
les)
A
B
C
D
BIGGER IS BETTER!
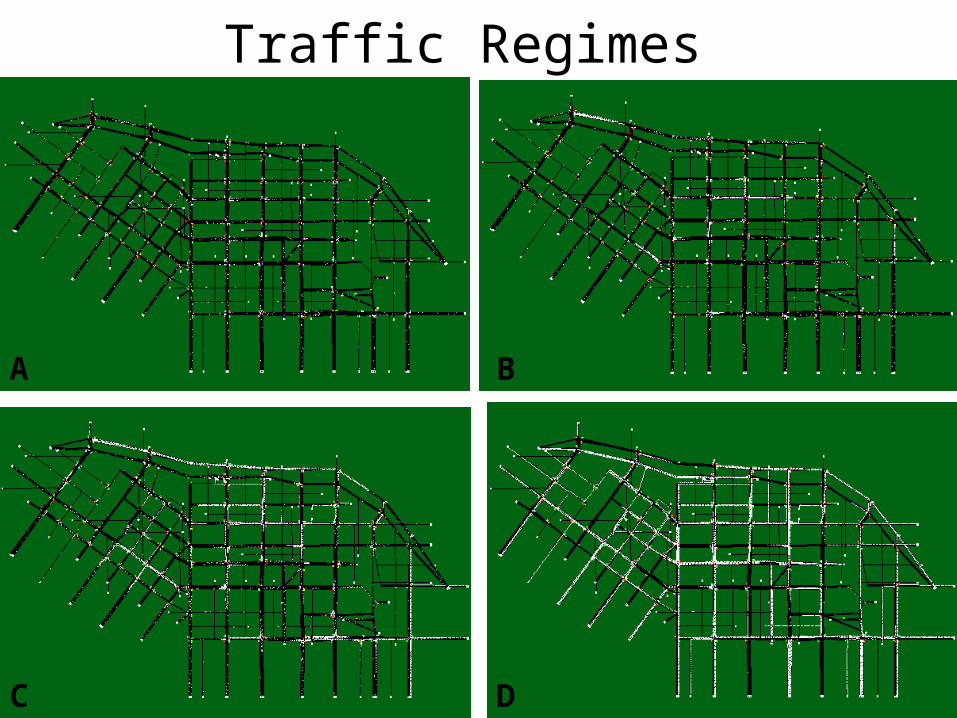
Traffic Regimes
A B
C D
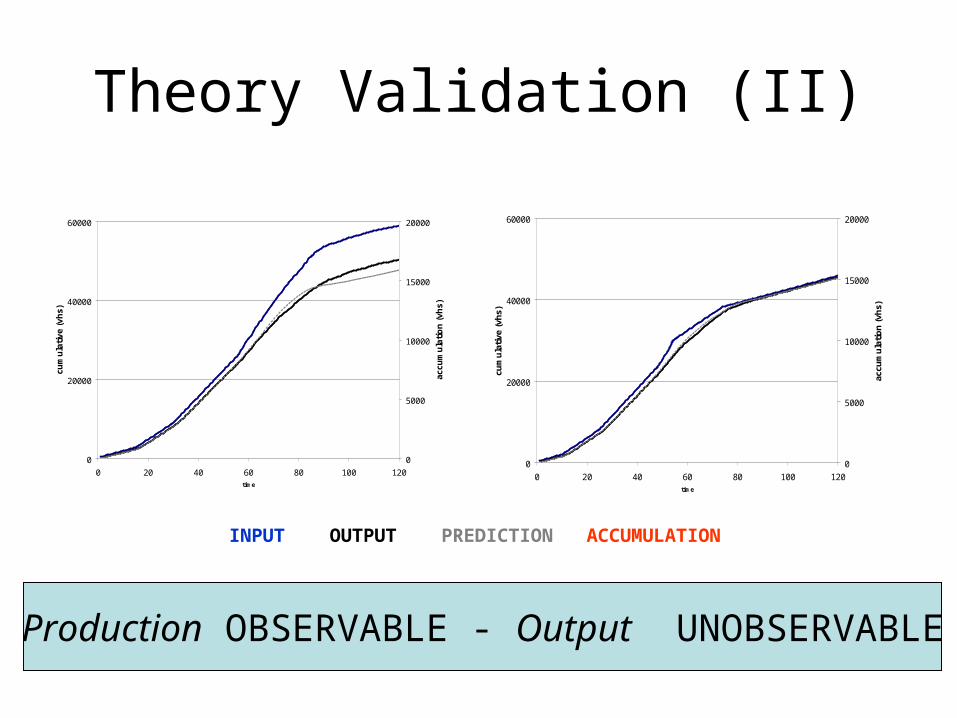
Theory Validation (II)
0
20000
40000
60000
0 20 40 60 80 100 120time
cum
ula
tive
(vh
s)
0
5000
10000
15000
20000
accu
mu
lati
on
(vh
s)
INPUT OUTPUT PREDICTION ACCUMULATION
Production OBSERVABLE - Output UNOBSERVABLE
0
20000
40000
60000
0 20 40 60 80 100 120time
cum
ula
tive
(vh
s)
0
5000
10000
15000
20000
accu
mu
lati
on
(vh
s)
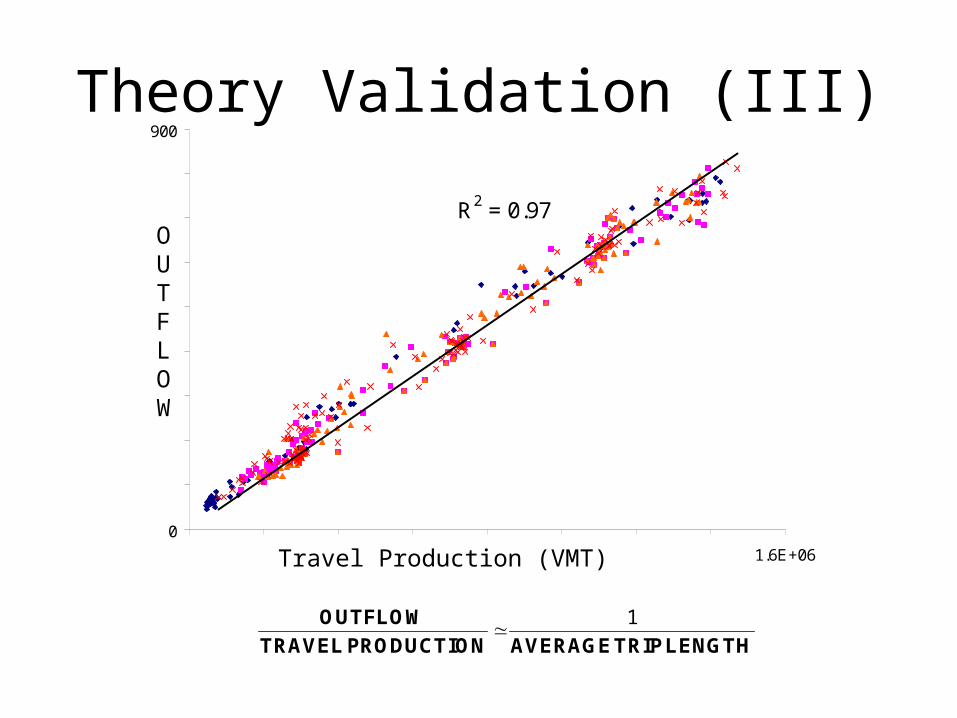
Theory Validation (III)
R2 = 0.97
0
100
200
300
400
500
600
700
800
900
0.0E+00 2.0E+05 4.0E+05 6.0E+05 8.0E+05 1.0E+06 1.2E+06 1.4E+06 1.6E+06Travel Production (VMT)
OUTFLOW
1OUTFLOW
TRAVEL PRODUCTION AVERAGETRIP LENGTH
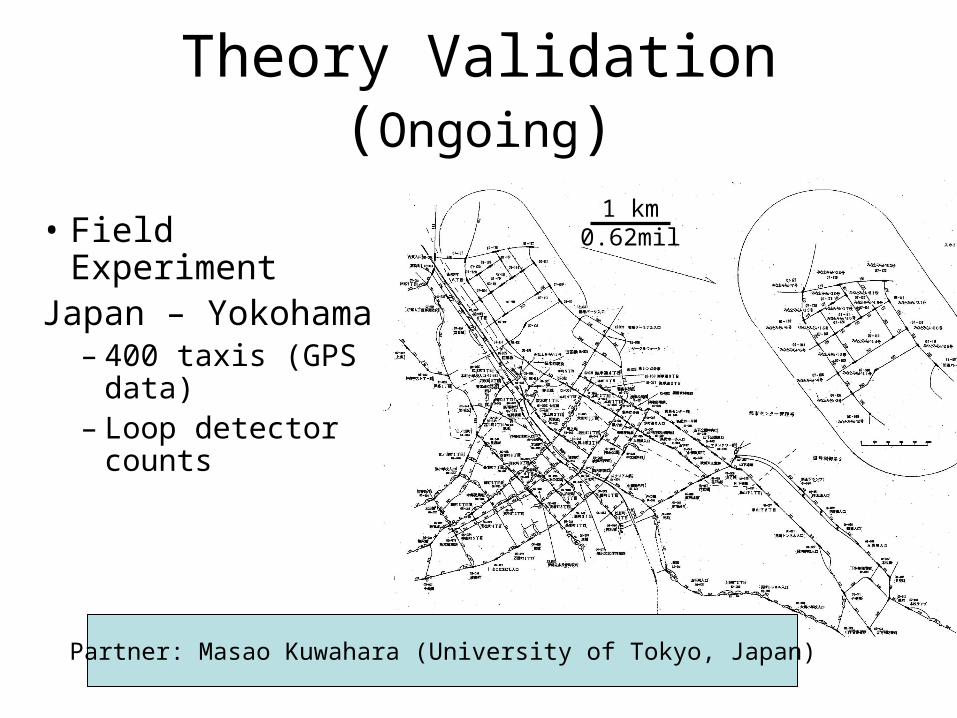
Theory Validation (Ongoing)
• Field ExperimentJapan – Yokohama
– 400 taxis (GPS data)
– Loop detector counts
Partner: Masao Kuwahara (University of Tokyo, Japan)
1 km0.62mil
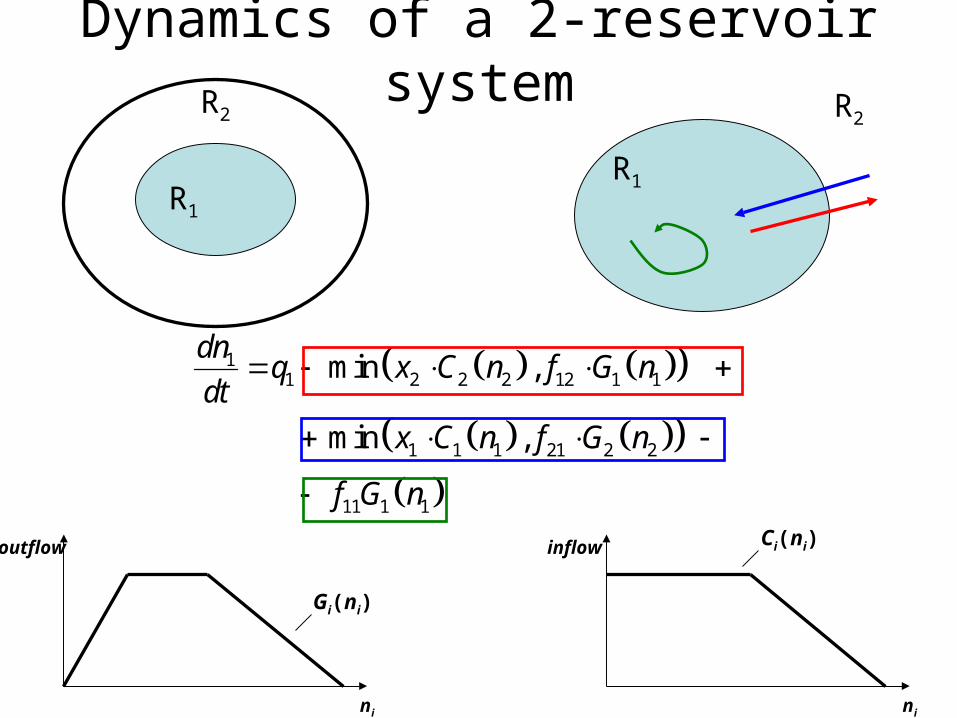
11 2 2 2 12 1 1
1 1 1 21 2 2
11 1 1
min ,
min ,
dnq x C n f G n
dt
x C n f G n
f G n
R2
R1
R1
R2
inflow
ni
Ci(ni)outflow
ni
Gi(ni)
Dynamics of a 2-reservoir system
0
20000
40000
60000
80000
100000
120000
140000
160000
180000
0 200 400 600 800 1000
time
vhs
cum trips endedR1cum trips endedR2cum trips endedR1,2
0
20000
40000
60000
80000
100000
120000
140000
160000
180000
0 200 400 600 800 1000
time
vhs
cum trips ended R1
cum trips ended R2
cum trips endedR1,2
0
20000
40000
60000
80000
100000
120000
140000
160000
180000
0 200 400 600 800 1000
time
vhs
accumulation R1
accumulation R2
0
20000
40000
60000
80000
100000
120000
140000
160000
180000
0 200 400 600 800 1000
time
vhs
accumulation R1
accumulation R2
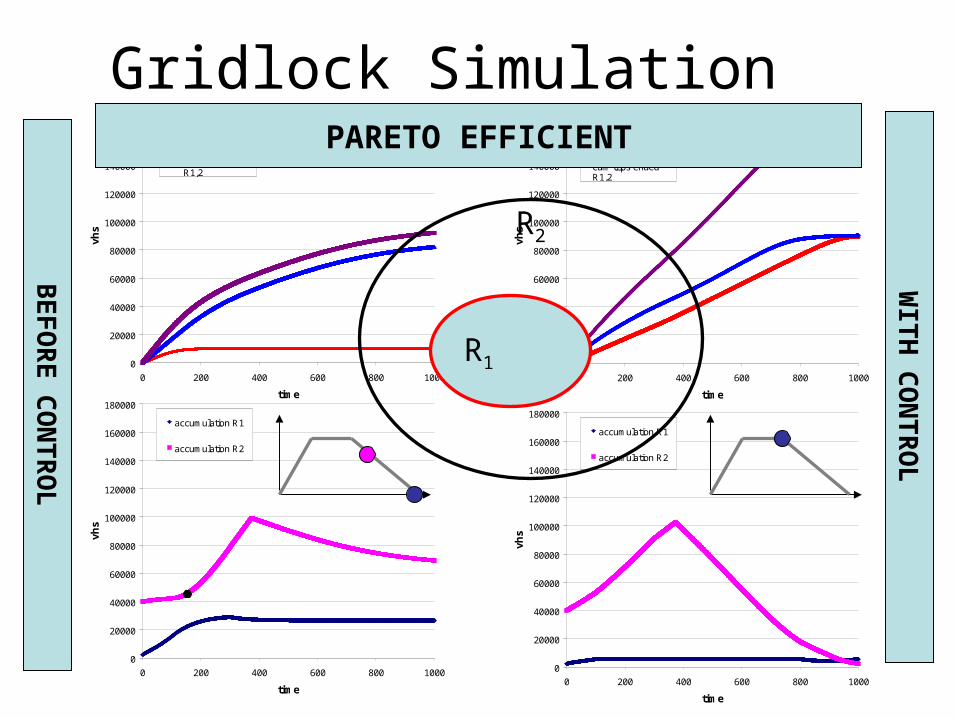
Gridlock Simulation
BE
FO
RE
CO
NT
RO
L
WIT
H C
ON
TR
OL
R2
R1
PARETO EFFICIENT
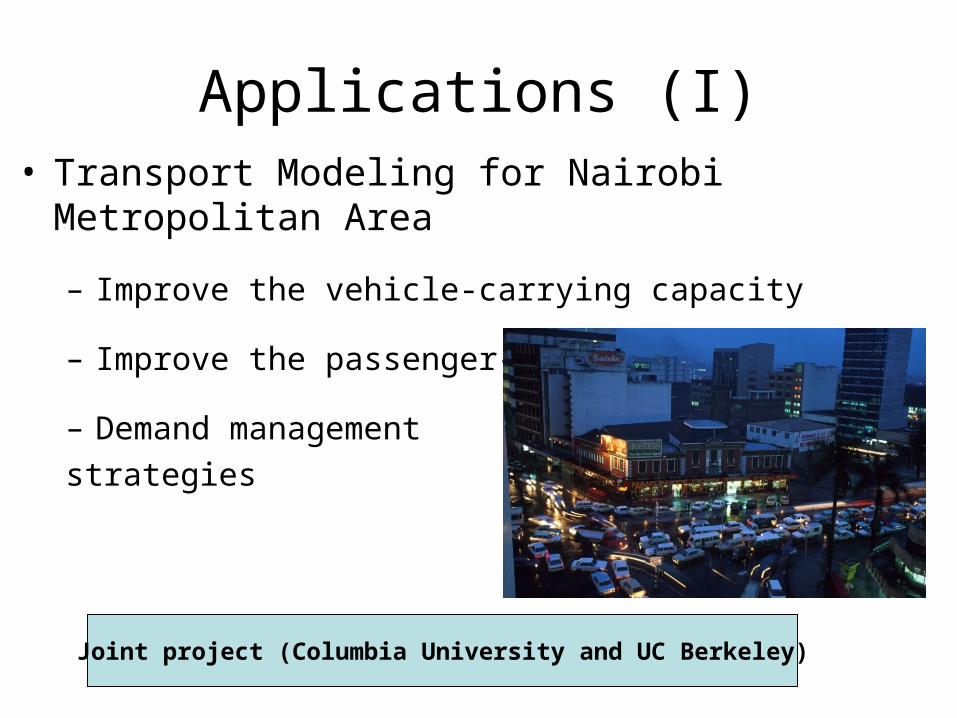
Applications (I)• Transport Modeling for Nairobi Metropolitan Area
– Improve the vehicle-carrying capacity
– Improve the passenger-carrying capacity
– Demand management
strategies
Joint project (Columbia University and UC Berkeley)
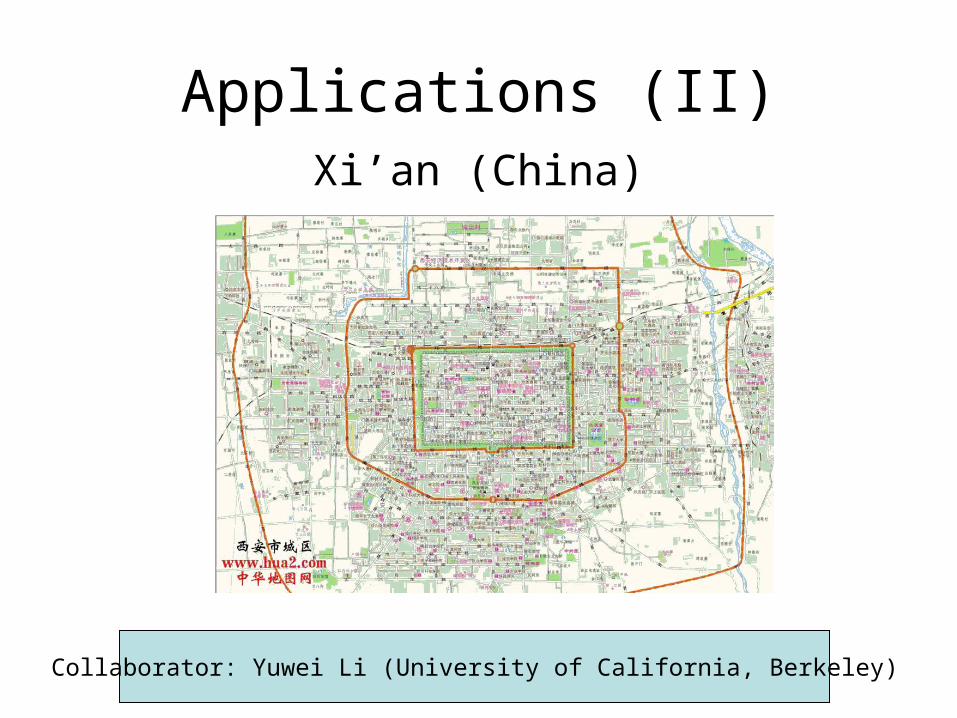
Applications (II)Xi’an (China)
Collaborator: Yuwei Li (University of California, Berkeley)
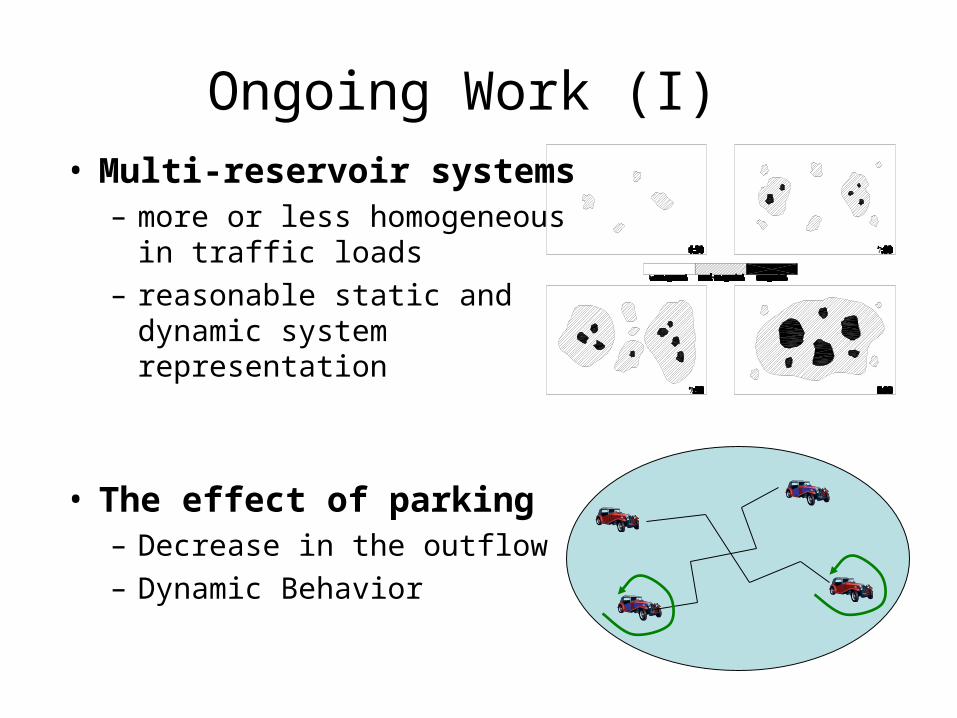
Ongoing Work (I) • Multi-reservoir systems
– more or less homogeneous in traffic loads
– reasonable static and dynamic system representation
• The effect of parking – Decrease in the outflow
– Dynamic Behavior
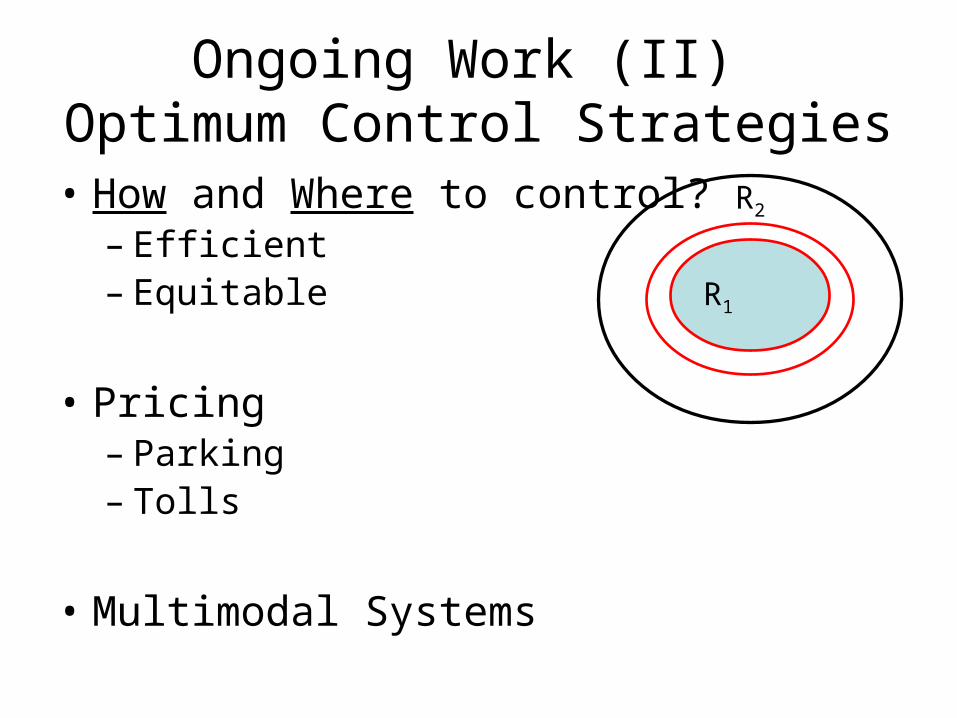
Ongoing Work (II) Optimum Control Strategies
• How and Where to control?– Efficient– Equitable
• Pricing – Parking– Tolls
• Multimodal Systems
R2
R1
QUESTIONS - SUGGESTIONS