Embed Size (px)
Citation preview
Groningen–Rotterdam: changing dynamics
The reduction of gas production in the Netherlands and the influence on the
energy dependency of the Rotterdam industrial cluster
Graduation Comity
Full professor: Prof. Dr. P.M. Herder Energy and Industry
First supervisor: Ass. Prof. Dr. A.F. Correljé Economics of Technology and Innovation
Second supervisor: Dr. Ir. R.M. Stikkelman Energy and Industry
External supervisor Prof. Dr. J.G. van der Linde Geopolitics and Energy & Director CIEP
Author Maurits (Marinus) Kreijkes, BSc.
Student Number 4108655
E-mail [email protected]|[email protected]
Telephone +316 13590354
Faculty Technology, Policy and Management (TBM)
Programme System Engineering, Policy Analysis and Management
Graduation Institute Clingendael International Energy Programme (CIEP)
2
Preface
The Dutch region with the lowest population density was frequently in the domestic news over the
past few months. Minister Kamp of Economic Affairs is occupied finding the right balance, between
satisfying the local population on the one hand, and, producing gas from the Groningen field to gain
state revenues on the other hand. Since the amount and fierceness of earthquakes in the Groningen
region increased, Minister Kamp decided to reduce the gas production even further than already
planned. Meanwhile, the Port of Rotterdam, a large pillar of the Dutch economy, is very dependent
on natural gas. What impact will the reduction of gas have on the Rotterdam cluster? What are the
consequences, and are there alternatives? That is what this master thesis is all about.
The emergence of this thesis was not possible without the help from various individuals and
companies. I would like to thank all directly involved.
First of all, of course, a word of gratitude to Prof. Coby van der Linde. Thank you for offering me the
graduation internship at Clingendael International Energy Programme (CIEP). These months were a
very exciting period to me where I learned a lot on energy and geopolitics. You were of great help
during the whole process of my thesis; pointing out the right directions, reflecting and reading along.
You also gave me the opportunity to provide me with the right contacts within the world of energy.
In particular many thanks for the confidence you had in me offering a research position at CIEP in
July. I would like to thank Emma van der Veen as well, my former colleague at CIEP who was of great
help during the technical data research of this thesis.
My gratitude goes out to the other members of the graduation committee: Ass.Prof. Aad Correlje, Dr.
Rob Stikkelman and Prof. Paulien Herder. Aad, your critical notes, extensive feedback and useful
literature were of great value to me. Your (historical) knowledge on Dutch natural gas is enormous
and contributed real added value to this thesis. Rob, thank you for all the feedback sessions which I
attended with great pleasure. Your in depth knowledge on the port of Rotterdam and your
professional guidance led this thesis to a success. Paulien, thank you for providing me with the right
guidance on the methodology at the beginning and the feedback during the greenlight meeting, this
firm basis helped me during my whole research project.
Great appreciation goes to several executives of the organisations that helped the progress of this
research: Mr. Melieste (Port of Rotterdam), Mr. van ’t Noordenede (Deltalinqs), Mr. Kleisterlee & de
Best (Essent Moerdijk), Mr. Verhoeven (Warmtebedrijf Rotterdam). Other persons that have been of
help with critical feedback during this research are: Mr. Braaksma (Gasterra), Mr. Stuyt and
colleagues (Brabers/ E.On), Mr. Rookmaker (RWE) and Mr. Regan (Eurogas).
I would like to thank my parents who gave me the opportunity to study here at the TU Delft. Through
all these years you always supported me and giving the right advice. I will always remember your
encouragement. Many thanks to my father and brother who assisted me a lot during the last phase
of my research. Especial gratitude goes out to Eline, you were always there for me, thank you.
I hope you will enjoy reading this master thesis.
Maurits Kreijkes
The Hague, October 2015

3

4
Management Summary
Introduction
The Dutch energy system is greatly dependent on natural gas. In 2013 the primary energy
consumption in the Netherlands was for 43% supplied with natural gas (CBS, 2015a). With
this proportion of natural gas the Netherlands has the highest share in national primary
energy consumption of Europe (Eurogas, 2014). The reason for this large share of natural gas
is the Dutch national gas production. The Netherlands has been a large gas producer,
consumer and exporter since the find of the large onshore field in Groningen province.
The natural gas production in the Netherlands is decreasing currently. Several studies have
shown that natural gas production will be at such a level that the Netherlands will become a
net importer around 2025 (IEA, 2012; ECN, 2014). These estimates are without inclusion of
the recent decisions to limit production from the Groningen field. The integral role of natural
gas is very important; many energy processes in the Dutch economy run on natural gas.
When Dutch gas production decreases, the downstream part of the natural gas-value chain
in the Netherlands might be affected. To prevent structural import dependency on one
supplier, such as Russia or Norway, the Netherlands can diversify gas supply with LNG
imports and biogas production. Another method to be less dependent on import is to find
alternatives in the energy portfolio to satisfy Dutch energy demand. Clustered industrial
sectors, such as the Rotterdam area, will also be affected when domestic gas supply will be
reduced. The question is how dependent the Rotterdam industrial cluster is on natural gas.
The Dutch industrial dependency on gas will be the focus of this master thesis, as presented
in the main research question:
“What influence has the reduction of gas production in the Netherlands on the energy
sourcing of the Rotterdam industrial cluster?”
To answer this research question, 6 sub questions were formulated, which are described in
the separate chapters in this thesis. Chapter 4 maps all the flows of the Dutch energy
balance which focusses on the gas and heat consumption of the Rotterdam cluster. In
chapter 5 the share of natural gas used as feedstock for (petro)chemical conversion
processes is analysed. Alternatives for industrial heating processes are investigated in
chapter 6. In order to assess these alternatives, criteria which were established in chapter 1
are used. Chapter 7 researches the potential for a more evolved heat exchange mechanism
within the Rotterdam cluster as an alternative for low temperature heating with natural gas.
Chapter 8 researches the future role of natural gas in the industrial sector. In addition
alternative future functions of the gas grid are investigated. In chapter 9 the conclusions are
formulated as well as the further discussion, future research and reflection. This research is
realised via modelling, interviews and a lot of literature consultation on state of the art
technologies and projects examples of other countries. An in depth description on the
realization of this thesis can be found in the methodology sections 2.1 and 2.3.
5
Key findings
Mapping the flows of heat delivery throughout the Rotterdam cluster required an in depth
analyses. First a visualisation of the energy balance of the Netherlands was constructed in
order to derive the flows of the Rotterdam cluster.
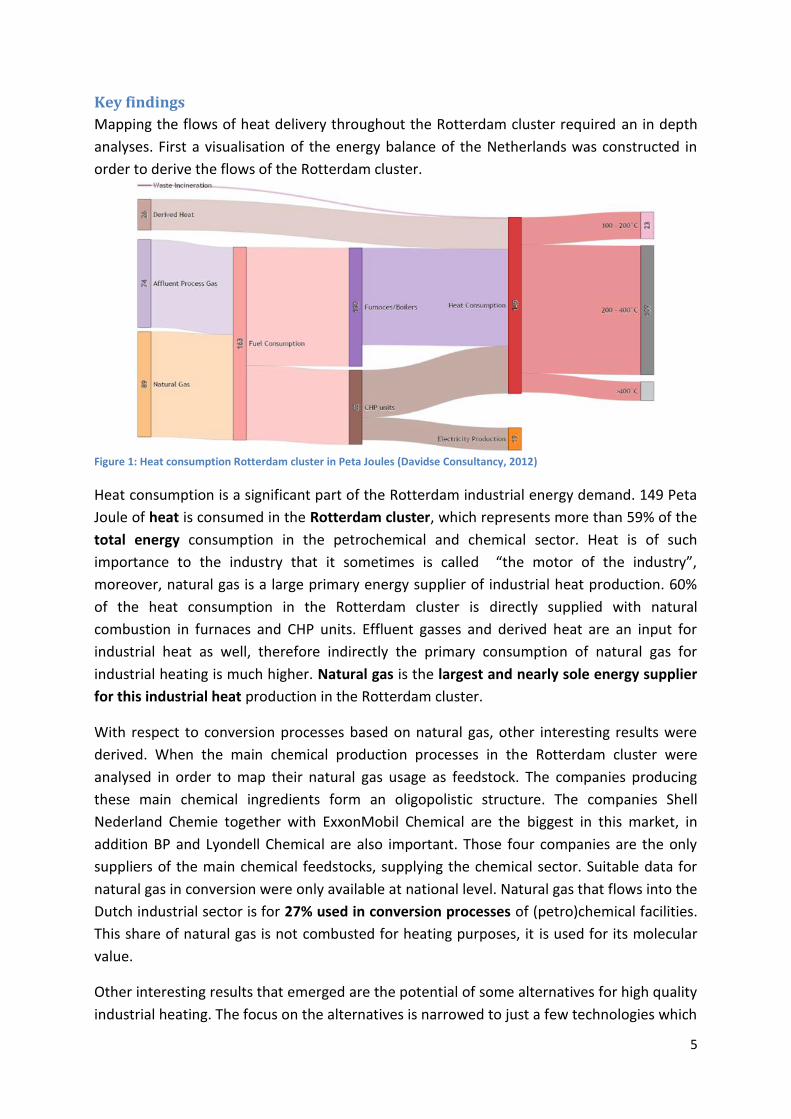
Figure 1: Heat consumption Rotterdam cluster in Peta Joules (Davidse Consultancy, 2012)
Heat consumption is a significant part of the Rotterdam industrial energy demand. 149 Peta
Joule of heat is consumed in the Rotterdam cluster, which represents more than 59% of the
total energy consumption in the petrochemical and chemical sector. Heat is of such
importance to the industry that it sometimes is called “the motor of the industry”,
moreover, natural gas is a large primary energy supplier of industrial heat production. 60%
of the heat consumption in the Rotterdam cluster is directly supplied with natural
combustion in furnaces and CHP units. Effluent gasses and derived heat are an input for
industrial heat as well, therefore indirectly the primary consumption of natural gas for
industrial heating is much higher. Natural gas is the largest and nearly sole energy supplier
for this industrial heat production in the Rotterdam cluster.
With respect to conversion processes based on natural gas, other interesting results were
derived. When the main chemical production processes in the Rotterdam cluster were
analysed in order to map their natural gas usage as feedstock. The companies producing
these main chemical ingredients form an oligopolistic structure. The companies Shell
Nederland Chemie together with ExxonMobil Chemical are the biggest in this market, in
addition BP and Lyondell Chemical are also important. Those four companies are the only
suppliers of the main chemical feedstocks, supplying the chemical sector. Suitable data for
natural gas in conversion were only available at national level. Natural gas that flows into the
Dutch industrial sector is for 27% used in conversion processes of (petro)chemical facilities.
This share of natural gas is not combusted for heating purposes, it is used for its molecular
value.
Other interesting results that emerged are the potential of some alternatives for high quality
industrial heating. The focus on the alternatives is narrowed to just a few technologies which

6
are very promising in the Netherlands: biomass combustion and biomass fermentation
(biogas), geothermal energy recovery and electrification. All four are technically very well
suited for utilisation in industrial heating purposes. The potential domestic availability in
terms of PJ on a yearly basis is the smallest for biomass fermentation followed by biomass
combustion. Both, electrification and geothermal heat recovery, have a very high potential
for the availability of energy in the future. The economics are the most decisive criterion for
a technology to succeed. Biomass combustion and fermentation are still both not feasible
based on current economics. Geothermal heat recovery, on the contrary, may very well
become economically viable for industrial heating when the ultra-deep heat recovery
technology becomes more mature.
For low grade heat (warm water) transportation in the Rotterdam cluster interesting
developments are in the making. Industrial plant operators are not only investigating
networks to deliver heat surpluses, there is also demand for residual heat within the process
industry. Potentially not only residual heat will flow from the cluster to the city, but also bi-
directional within the cluster, a heat exchange. This implies that the public and private
sector will be served with a further expanded infrastructure of the already existing heat net.
Third Party Access (TPA) will be applied to the heat grid. Large industrial customers are out
of the scope of the “Warmtewet” which means that every heat contract is open for
negotiation. Residential heat pricing is realised via the “Niet Meer Dan Anders”-principle. A
mechanism needs to be in place for heat to be marketed and distributed for commercial
users. A theoretical framework on critical transactions pointed out a suitable coordinating
model for the heat network. In addition two market mechanisms are investigated, the APX
power trading platform and the TTF gas trading platform. These platforms are compared
from a physical, economic and institutional perspective. The TTF platform seems to fit
seamlessly with the low grade heat exchange regarding the products offered at the spot
market and its futures market.
The potential to utilise the Dutch gas infrastructure more, also in the future scenario of a
roundabout, is feasible. Methods for further utilisation by inserting alternative gasses such
as green gas (already operational) and hydrogen are possible. There are some technological
limitations to the gas grid, but they are surmountable. A smart gas grid can be realised from
a technical perspective. However, institutionally there are quite some adjustments that have
to be made in order to proceed with large scale hydrogen injections. Economically, it is not
yet very attractive to induce high sunk cost investments, knowing the high production costs
of these alternative gaseous energy carriers cannot be recovered in the current market
circumstances.
Conclusion
The Main Research Question has two parts: the dependency of the Rotterdam cluster on
natural gas, and the declining Dutch gas production.
7
The dependency of the Rotterdam cluster on natural gas is proven throughout the chapters
of this thesis. The share of natural gas in the clusters’ energy consumption is about 60% and
most of this energy is allocated for the production of heat. Moreover, a large volume of
natural gas is used as (non-energetic consumption) feedstock for chemical conversion. Gas
for heating purposes can to some extent be replaced with alternative technologies, such as
geothermal heat recovery or electrification. However, such alternatives are still costly and
require subsidies to create a viable business case. Learning curves could change the cost
aspect for some of these technologies. The industrial business case for low grade heat can
be improved by developing a heat network in the cluster which is an expansion of the
existing heat infrastructure connected to the city of Rotterdam. Gas which is used for
chemical conversion has very small potential for replacement with alternatives, synthetic gas
could be an option however this is costly in comparison with gas production/import.
Therefore the dependency on natural gas in the Rotterdam cluster is clear. For some
applications of natural gas this is more evident, for example the natural gas conversions in
(petro)chemical facilities. Gas is not irreplaceable, however, there are some serious
technical, economic and institutional consequences connected to the alternatives.
The first section of the main research question, the declining Dutch gas production, is the
other aspect taken into account regarding the gas dependency of the Rotterdam cluster. The
production of low calorific Groningen gas is declining rapidly due to political pressure to
guarantee safety for the inhabitants. The status shift from a net gas exporting country to a
net importing country of natural gas will occur within a few years. The type of gas consumed
by the 80 national largest industrial gas consumers, who are equipped for high calorific gas
quality alleviate the pressure to adapt to new realities, since this gas can easily be imported.
The high calorific gas-grid can facilitate the larger industrial customers (Braaksma, 2015
interview). The declining production of low calorific gas requires nitrogen addition to the
domestic produced high calorific gas (small fields) to mimic Groningen-quality. This means
additional high calorific gas needs to be produced or imported, and also industrial high
calorific gas supply could become more import dependent. The other option is finding
alternative gasses or technologies to supply the heat and gas consumption for the
Rotterdam cluster. The larger the potential for alternatives of high quality heat production,
the lower the natural gas dependency of the cluster. The gas dependency of the Rotterdam
cluster is high, any disturbances or price peaks related to the delivery of this crucial energy
carrier can have a large impact.
The role of natural gas in Dutch society is still important in the long term future, however to
which extent gas will continue to be dominant as energy carrier is doubtful. Technical
breakthroughs and top down policy mechanisms can greatly impact the reduction of gas
consumption. Especially the role of low calorific “Groningen” gas in the Dutch energy system
is uncertain, depending on the success of non-industrial consumers to switch away or
sustainably reduce consumption. The lower Groningen production prolongs the timeframe in
which the field can produce, perhaps with the industry as its main client.
8
Index
Preface ..................................................................................................................................................... 2
Management Summary ........................................................................................................................... 4
List of figures ..................................................................................................................................... 10
List of tables ...................................................................................................................................... 11
List of abbreviations .......................................................................................................................... 12
Chapter 1: Introduction ......................................................................................................................... 14
1.1 Introduction ........................................................................................................................... 14
1.2 Research problem ................................................................................................................. 18
1.3 Missing knowledge ................................................................................................................ 19
1.4 Research questions................................................................................................................ 19
1.5 Research objective ................................................................................................................ 20
Chapter 2: Methodology ....................................................................................................................... 21
2.1 Research Approach ................................................................................................................ 21
2.2 Sub questions in perspective of thesis framework ............................................................... 24
2.3 Data Gathering ...................................................................................................................... 27
2.4 Scientific relevance ................................................................................................................ 28
2.5 Deliverables ........................................................................................................................... 28
Chapter 3: The ideal energy supply for industrial heating processes ................................................... 30
3.1 Criteria for industrial heating energy supply ......................................................................... 30
3.2 Cluster specific heat requirements ....................................................................................... 32
3.3 Why is gas so well suited? ..................................................................................................... 35
3.4 Conclusion ............................................................................................................................. 37
Chapter 4: The industrial energy flows for heat delivery in the Rotterdam cluster ............................. 38
4.1 Mapping of industrial energy flows the Netherlands ........................................................... 38
4.2 Industrial heat flows Rotterdam Cluster ............................................................................... 44
4.3 Conclusion ............................................................................................................................. 52
Chapter 5: Gas fed industrial conversion processes in the Rotterdam cluster ..................................... 54
5.1 Natural gas and NGLs conversion .......................................................................................... 54
5.2 Gas feedstock processes Rotterdam cluster ......................................................................... 56
5.3 Conclusion ............................................................................................................................. 58
Chapter 6: Other means to fulfil Dutch industrial energy needs .......................................................... 60
6.1 Alternative industrial heating introduction ........................................................................... 60
9
6.2 Biomass and industrial heating ............................................................................................. 61
6.2.1 Dry biomass combustion ............................................................................................... 63
6.2.2 Biogas production and industrial heating ..................................................................... 66
6.3 Geothermal heating .............................................................................................................. 72
6.4 Electrification ......................................................................................................................... 78
6.5 Conclusion ............................................................................................................................. 85
Chapter 7: Heat market potential in the Rotterdam cluster and its configuration .............................. 90
7.1 Heat markets in combination with industrial clusters .......................................................... 90
7.2 Cost and pricing of heat ........................................................................................................ 93
7.3 Theoretical framework with modes of coordinating the Rotterdam heat infrastructure .... 95
7.4 Pricing mechanisms gas and electricity trading .................................................................... 97
7.5 Suitable trading mechanisms from a physical, economic and institutional perspective ...... 99
7.5.1 APX model versus residual heat commodity ............................................................... 100
7.5.2 TTF model versus residual heat commodity................................................................ 101
7.6 Conclusion ........................................................................................................................... 103
Chapter 8: Changing role of gas and the future function of the gas grid ............................................ 106
8.1 The role of gas up till now and its future prospect ............................................................. 106
8.2 Synergies on the Dutch gas grid .......................................................................................... 109
8.2.1 Physical and chemical characteristics of alternative gasses on the gas grid ............... 109
8.2.2 Economics of alternative gasses .................................................................................. 113
8.3 Institutional implications gas transition .............................................................................. 114
8.4 Conclusion ........................................................................................................................... 116
Chapter 9: Conclusion ......................................................................................................................... 119
9.1 Recapitulation takeaways sub questions ............................................................................ 119
9.2 Conclusive answer on the main research question ............................................................. 123
9.3 Discussion ............................................................................................................................ 126
9.4 Reflection............................................................................................................................. 128
Literature ............................................................................................................................................. 132
Appendices .......................................................................................................................................... 139
Appendix I: Interviews and consultations ....................................................................................... 139
Appendix II: Dutch energy flows statistics Eurostat 2013 ............................................................... 141
Appendix III: RStudio programme interface & script input ............................................................. 143
Appendix IV: Crude Oil and Natural Gas Flowchart ........................................................................ 147
Appendix V: (Petro)chemicals produced in the Rotterdam cluster ................................................ 149
10
List of figures Figure 1: Heat consumption Rotterdam cluster in Peta Joules (Davidse Consultancy, 2012) ................................ 5
Figure 2: Dutch Gas value chain (Dijkema & Praet, 2013; Eurostat, 2014; CBS, 2015a) ....................................... 15
Figure 3: Gas production in the Netherlands (NLOG, 2015) added current gas demand ..................................... 16
Figure 4: Energy supply and consumption for the Dutch industrial sector in 2012 (Eurostat, 2013; IEA,2015a). 17
Figure 5: Visual representation of the research approach.................................................................................... 21
Figure 6 Sub questions plotted with the approaches of the thesis framework ................................................... 24
Figure 7: Rotterdam harbour sectorial division (Port of Rotterdam, 2015). ......................................................... 32
Figure 8: Rotterdam harbour, large energy consumers and producers (Port of Rotterdam, 2010). .................... 33
Figure 9: An overview of the US industrial thermal energy usage (Rattner & Garimella, 2015:1) ....................... 34
Figure 10: The Dutch natural gas transmission network (Gasunie, 2015a) .......................................................... 36
Figure 11: Dutch energy balance 2013 (Eurostat, 2015) ....................................................................................... 39
Figure 12: Final Dutch energy consumption 2013 (Eurostat, 2015)...................................................................... 41
Figure 13: Dutch heat balance 2013 (Eurostat, 2015) .......................................................................................... 43
Figure 14: Industrial infrastructures Rotterdam cluster and further (Port of Rotterdam, 2010:21) .................... 45
Figure 15: NATO Central European Pipeline System (CEPS) (NATO support and procurement agency, 2015) .... 46
Figure 16: Heat net from the Rotterdam harbour to the city centre (Keeton, 2014:1) ........................................ 47
Figure 17: Industrial steam production port of Rotterdam .................................................................................. 49
Figure 18: Heat consumption Rotterdam cluster in Peta Joules (Davidse Consultancy, 2012) ............................ 50
Figure 19: Heat consumption Chemical and Petrochemical sector (Davidse Consultancy, 2012) ........................ 51
Figure 20: Heat fuel source Chemical and Petrochemical sector (Davidse Consultancy, 2012) ........................... 52
Figure 21: Crude Oil and Natural Gas Flowchart (Petrochemicals Europe, 2015). ............................................... 55
Figure 22: Biomass conversion to bioenergy carriers (IEA, 2007) ......................................................................... 62
Figure 23: Biogas feed-in locations natural gas grid (Hazebroek, 2014) ............................................................... 69
Figure 24: Revenues and cost breakdown Dutch biomass fermentation plants (Velghe & Wierinck, 2013) ....... 71
Figure 25: Heat consumption breakdown Rotterdam cluster (See paragraph 4.2 figure 18) ............................... 72
Figure 26: Geothermal energy potential Netherlands (Kramers, et al., 2012). .................................................... 75
Figure 27: Geothermal energy cost price versus gas at different price levels (IF WEP, Ecofys, TNO, 2011:70). .. 76
Figure 28: Roadmap electrification chemical industry (TNO, 2015:1) .................................................................. 78
Figure 29: Transmission grid TenneT Netherlands and Germany (TenneT, 2015b) .............................................. 80
Figure 30: Dutch utility sector break down (left) and industrial energy consumption (IEA, 2015a) ..................... 82
Figure 31: French utility sector break down (left) and industrial energy consumption (IEA, 2015a) ................... 83
Figure 32: French and Dutch (Petro)chemical industry energy consumption breakdown (IEA, 2015a) .............. 84
Figure 33: Development of the Botlek portfolio (WBR, 2015) .............................................................................. 92
Figure 34: High calorific gas transmission network throughout the Netherlands (RVO, 2015b:1, customised) 108
Figure 35: Gaseous forms from biomass, in addition; high-, low- cal and synthesis gas (ECN, et. al, 2014:36) . 109
Figure 36: Hydrogen based economy (DNV-GL, 2013:1)..................................................................................... 111
Figure 37: Gas, heat and electricity grid synergies (Fraunhofer IFAM, 2014) ..................................................... 114
Figure 38: Heat consumption Rotterdam cluster in Peta Joules (Davidse Consultancy, 2012) .......................... 120
Figure 39: Dutch gas value chain, shifting tensions (Dijkema & Praet, 2013) ..................................................... 125
11
List of tables
Table 1: Gas usage in the Netherlands, composed with data from rounded to billion m
3 natural gas. ............... 14
Table 2: Criteria for energy supply source assessment ......................................................................................... 32
Table 3: Temperature and pressure specifications of heat carriers in industry (Liew, et al., 2014). .................... 35
Table 4: Import and export of energy carriers in 2013 with ratios (Eurostat, 2015) ............................................ 39
Table 5: Production and consumption of energy carriers in 2013 with ratios (Eurostat, 2015) ........................... 40
Table 6: Breakdown of energy carriers for several sectors in the Netherlands in 2013 (Eurostat, 2015) ............ 42
Table 7: Fuel sourcing Dutch thermal power station sector in 2013 (Eurostat, 2015) ........................................ 43
Table 8: Steam production Rotterdam cluster (Port of Rotterdam, 2010; Visser & Smit Hanab, 2015)............... 48
Table 9: Important main chemical products Rotterdam cluster (Port of Rotterdam, 2010) ................................ 57
Table 10: Criteria for energy supply source assessment ....................................................................................... 60
Table 11: Common biomass combustion techniques (van Loo & Koppejan, 2008) .............................................. 63
Table 12: Biomass fermentation facility types in the Netherlands (Velghe & Wierinck, 2013) ............................ 67
Table 13: Industrial heat supply source assessment ............................................................................................. 88
Table 14: Modes of organization to secure critical transactions of infrastructures (Kunneke, 2011:24) ............. 96

12
List of abbreviations
Units
Tcm Trillion cubic metres
Bcm Billion cubic meters
Pj Peta joule = 1015Joule
Tj Tera joule = 1012 joule
Gj Giga joule = 109 Joule
Mj Mega joule = 106 Joule
Mtoe Million tonnes of oil equivalent
TWh Terawatt hour = 109 KWh
GWh Gigawatt hour = 106 KWh
MWh Megawatt hour = 103 KWh
KWh Kilowatt hour = 3.6 Mj
Other
ACM Autoriteit Consument en Markt
APX Amsterdam Power Exchange
CNG Compressed Natural Gas
ECN Energieonderzoek Centrum Nederland
EGS Engineered Geothermal Systems
ETS Emission Trading System
GHG Green House Gas
GTS Gasunie Transport Services
HHV Higher Heating Value
IEA International Energy Agency
LNG Liquid Natural Gas
LHV Lower Heating Value
LNG Liquid Natural Gas
Mtoe Megaton Oil Equivalent
NAM Nederlandse Aardolie Maatschappij
NLOG Nederlands Olie en Gas Portaal
PTE Programma TijdsEenheid
RES Renewable Energy Sources
SNG Synthetic Natural gas
SoS Security of Supply
TIS Technology Innovation System
TPA Third Party Access
TTF Title Transfer Facility

13

14
Chapter 1: Introduction
1.1 Introduction
In the early 1960s an energy revolution occurred in the Netherlands. Enormous quantities of
natural gas were discovered in the north. The Slochteren field contained an estimated
amount of 1900Bcm by 1967 (Correljé & Verbong, 2004). To put things into perspective this
quantity of natural gas could supply the total Dutch gas demand for 40 years at the 2015
consumption rate. The discovery of this field triggered a change in the energy supply of the
Netherlands of that time. The energy portfolio then consisted mainly of oil and coal. Since
this discovery natural gas was rapidly added to the energy mix. After five years of Dutch “gas
campaign” all the Dutch municipalities on the mainland had been connected to the gas grid
(Correljé, et al., 2003).
This portfolio shift brought changes to society, gas started dominating the Dutch energy
supply portfolio. The Dutch gas sector is to a large extent based on low-calorific Groningen
gas quality. A share of high-calorific gas from imports or small fields production is converted
to “Groningen” quality. This way the large Groningen field has been made a central feature
of the gas sector. Industries adopted gas as a fuel for their production processes, households
were able to cook and heat with gas via pipelines, instead of using oil and coal. Due to this
transition and the continuous availability of gas the current Dutch energy system is greatly
dependent on gas. In 2013 the primary energy consumption of gas was 43% of the total
primary energy consumption with almost 1400Pj (CBS, 2015a), which means that the
Netherlands has the highest share of natural gas for their primary energy consumption of
Europe, followed by Italy, Hungary and the United Kingdom respectively (Eurogas, 2014).
Dutch gas usage is basically divided over five sectors. The division of gas consumption in the
Netherlands per sector is composed out of multiple data sets by ECN, GasTerra, EIA, CBS and
Eurogas.
Table 1: Gas usage in the Netherlands, composed with data from (CBS, 2015b/c; Eurogas, 2014; Roijers, et al., 2009; Ybema, et al., 2014) rounded to billion m
3 natural gas.
Sector Mln m3 Share
Residential 10.700 23%
Commercial 10.300 22%
Industry 12.000 26%
Power plants 11.700 25 %
Other 1.800 4%
Total 46.500 100%
Power plants are responsible for approximately a quarter of natural gas consumption in the
Netherlands. This consumption is more or less the same for the industrial sector, this sector
includes large processbased manufacturers such as metallurgic, chemical, and ceramic
plants. The greenhouse sector in the west of the Netherlands are included in the commercial
15
sector (besides large quantities of natural gas, added CO2 is required for growing
vegetation). The residential and commercial sectors together make up to 45% of the Dutch
natural gas demand, interestingly all this gas is used for heating water and spaces or for
cooking. The commercial sector includes the construction business, hotels, retailers,
hospitals, financial institutions, educational institutes, public service buildings, sports and
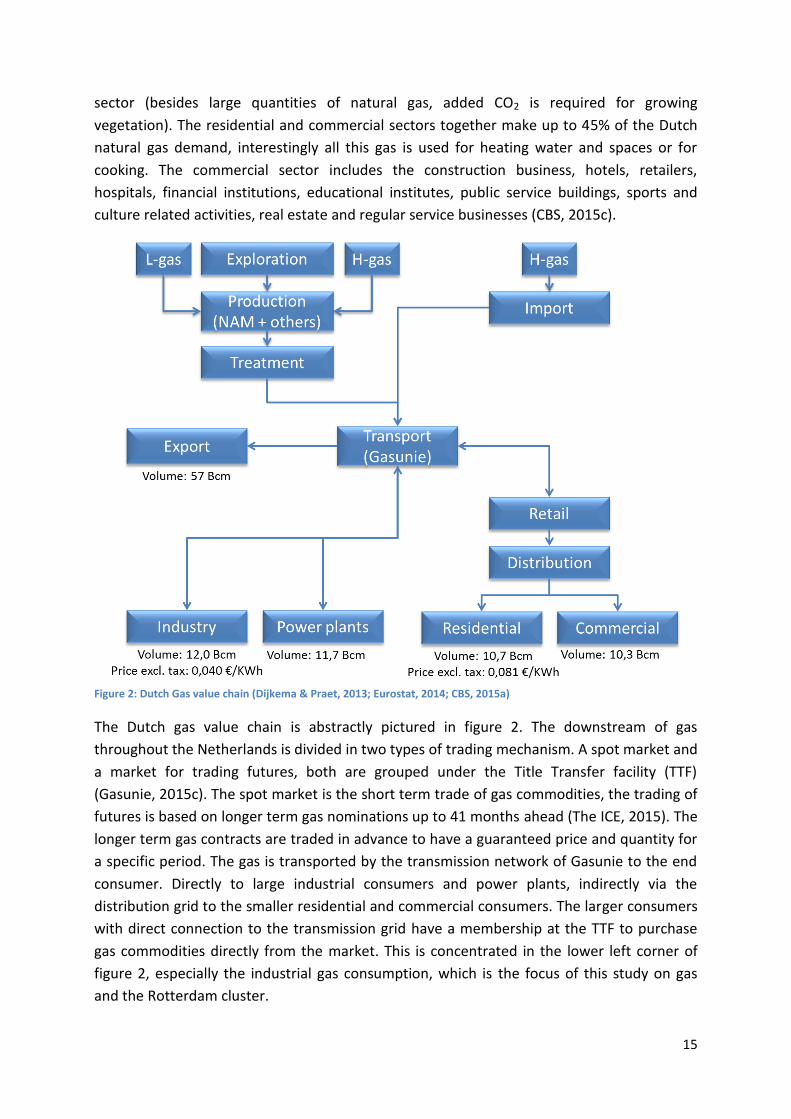
culture related activities, real estate and regular service businesses (CBS, 2015c).
Figure 2: Dutch Gas value chain (Dijkema & Praet, 2013; Eurostat, 2014; CBS, 2015a)
The Dutch gas value chain is abstractly pictured in figure 2. The downstream of gas
throughout the Netherlands is divided in two types of trading mechanism. A spot market and
a market for trading futures, both are grouped under the Title Transfer facility (TTF)
(Gasunie, 2015c). The spot market is the short term trade of gas commodities, the trading of
futures is based on longer term gas nominations up to 41 months ahead (The ICE, 2015). The
longer term gas contracts are traded in advance to have a guaranteed price and quantity for
a specific period. The gas is transported by the transmission network of Gasunie to the end
consumer. Directly to large industrial consumers and power plants, indirectly via the
distribution grid to the smaller residential and commercial consumers. The larger consumers
with direct connection to the transmission grid have a membership at the TTF to purchase
gas commodities directly from the market. This is concentrated in the lower left corner of
figure 2, especially the industrial gas consumption, which is the focus of this study on gas
and the Rotterdam cluster.
16
Currently the Netherlands uses its natural gas resources for domestic consumption and
export to other countries as shown in figure 2. However, the natural gas production in the
Netherlands is declining. In the near future, around 2025, several studies have shown that
the natural gas production in the Netherlands is at such a level that it will become a net
importer of natural gas (IEA, 2012; ECN, 2014). This will be of influence on domestic low
calorific gas supplies as well as gas delivered to neighbouring countries, such as Germany,
whilst indigenous German production is declining as well (Westphal, 2015l; Oxford Institute
for Energy Studies, 2014).
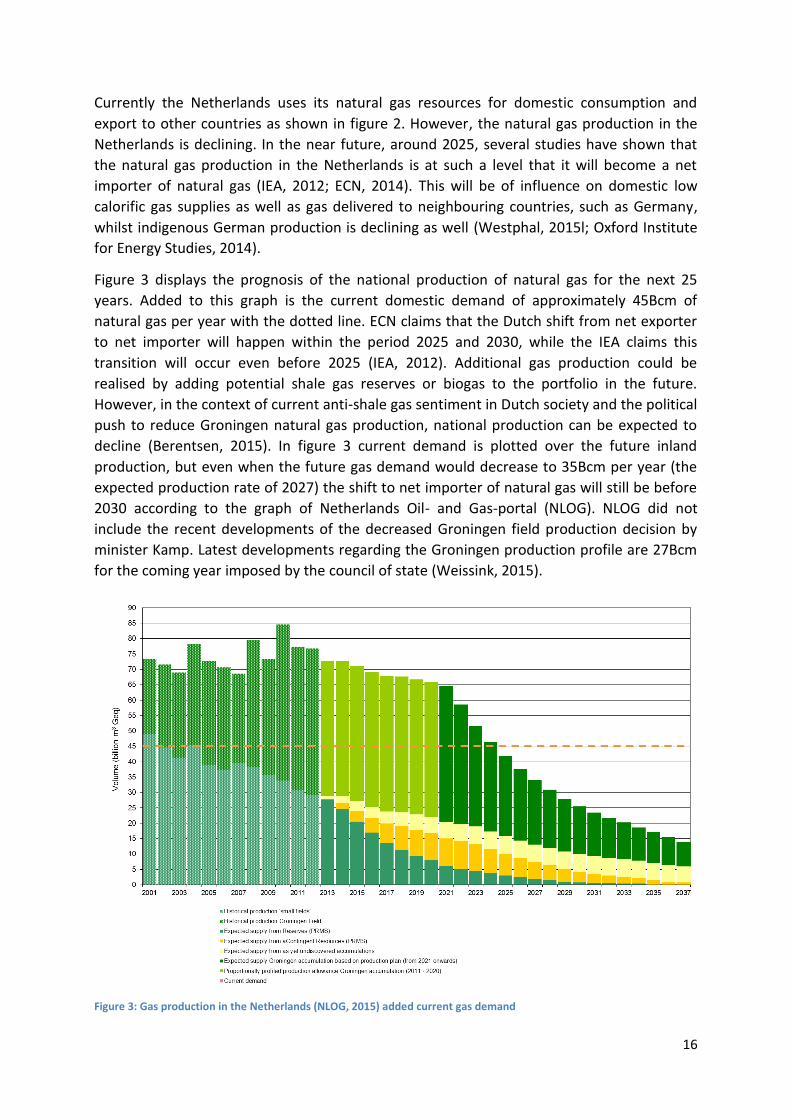
Figure 3 displays the prognosis of the national production of natural gas for the next 25
years. Added to this graph is the current domestic demand of approximately 45Bcm of
natural gas per year with the dotted line. ECN claims that the Dutch shift from net exporter
to net importer will happen within the period 2025 and 2030, while the IEA claims this
transition will occur even before 2025 (IEA, 2012). Additional gas production could be
realised by adding potential shale gas reserves or biogas to the portfolio in the future.
However, in the context of current anti-shale gas sentiment in Dutch society and the political
push to reduce Groningen natural gas production, national production can be expected to
decline (Berentsen, 2015). In figure 3 current demand is plotted over the future inland
production, but even when the future gas demand would decrease to 35Bcm per year (the
expected production rate of 2027) the shift to net importer of natural gas will still be before
2030 according to the graph of Netherlands Oil- and Gas-portal (NLOG). NLOG did not
include the recent developments of the decreased Groningen field production decision by
minister Kamp. Latest developments regarding the Groningen production profile are 27Bcm
for the coming year imposed by the council of state (Weissink, 2015).
Figure 3: Gas production in the Netherlands (NLOG, 2015) added current gas demand
17
Natural gas will still play an important role in the Dutch primary energy usage when this shift
will occur. The difference from before is that the gap between own production and the gas
demand needs to be filled by gas imports. The European gas production is an overall
declining picture. “European conventional gas production is expected to fall by 110
Bcm/year in the period 2013-2030, the actual figures being very dependent on the three
main producers - Norway, Netherlands, and the UK. No significant unconventional (shale gas,
tight gas, and coal bed methane) gas production is likely prior to 2020, and less than 20 Bcm
of production from those sources by 2030” (Oxford Institute for Energy Studies, 2014:71).
In the long term most of the gas that will be exported is transit gas from other countries. On
a global scale there is abundant supply of natural gas to fulfil Dutch demand, supply however
will change when gas needs to be transported by means of LNG ships or long pipelines from
countries in eastern Europe. “The main source of alternative gas for Europe will be the global
LNG market which comprises a wide range of countries including the USA. Global LNG trade
could double to 700 Bcm/year by 2030 - excluding the USA which could contribute in excess
of an additional 100 Bcm. With nearly 200 Bcm of re-gasification capacity - of which only 22
per cent was utilized in 2013 … it is clear that Europe could import much larger volumes,
depending on the global LNG supply/demand balance and prices in other regions”(Oxford
Institute for Energy Studies, 2014:72). These long transportation distances could influence
the gas price and political dependence. However, Dutch residential and commercial gas
consuming devices would need to adapt to high-calorific gas or convert the imported gas to
“Groningen” quality. Currently the Netherlands is already importing small quantities of gas
from Norway, Russia and Qatar (Eurogas, 2014). In addition to price issues, gas is a relative
clean fossil energy source compared to oil and coal. From an environmental point of view
the low costs per installed MW and the fluctuation capacity, makes gas an interesting
resource as a transition fuel in combination with RES.
The system role of natural gas is highly important, since many energy processes in the Dutch
society run on natural gas. Especially industrial clustered sectors that are interconnected
with each other that have natural gas as a feedstock are dependent. The Dutch industrial
dependency on natural gas is the focus for this research.
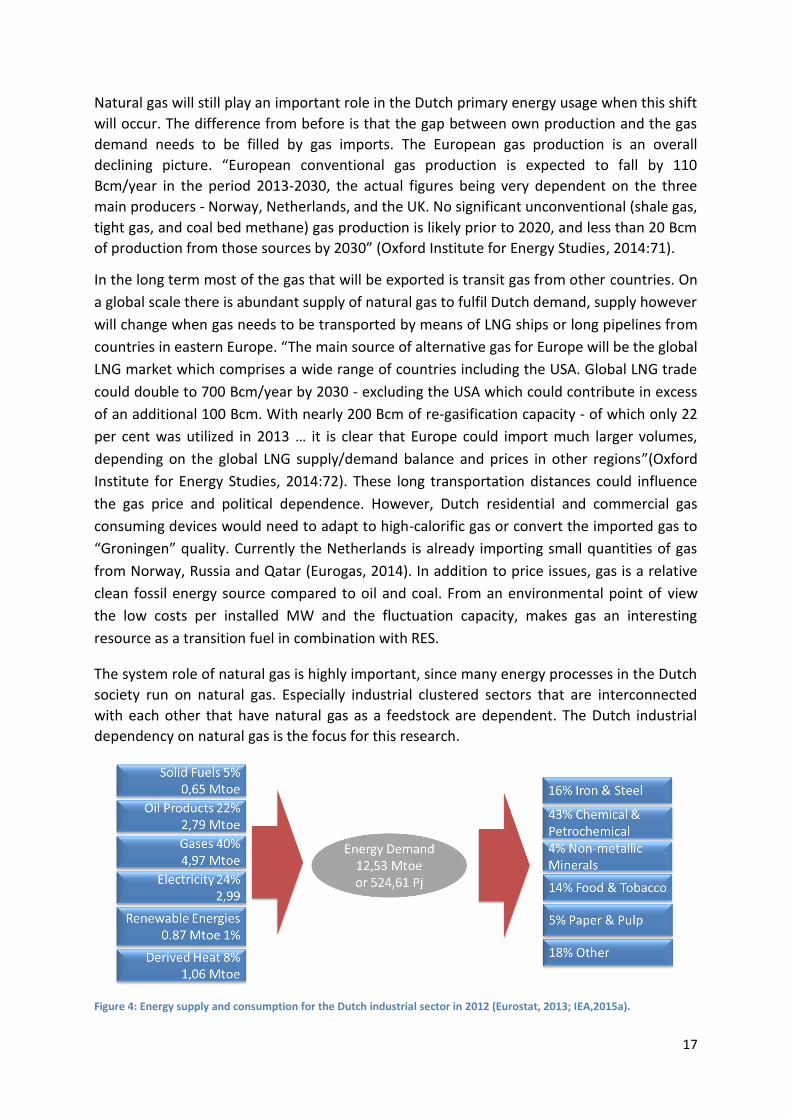
Figure 4: Energy supply and consumption for the Dutch industrial sector in 2012 (Eurostat, 2013; IEA,2015a).
18
The latest IEA data on the industrial energy consumption shows a 12,53 Mtoe yearly energy
consumption (IEA, 2015a). To show the net energy usage of the Dutch industrial sector the
sector specific efficiencies should be incorporated. Figure 4 gives an overview of the Dutch
industrial energy usage per fuel. Energy demand of the Dutch industrial sector in 2012 was
more than 500Pj, of which 40% was supplied with gas. This shows the large share of energy
supplied by gas in the Dutch industry. Interesting is the question whether the industrial
energy supply portfolio on the left side of figure 4 can become more diversified by other
energy sources. Countries such as France or Germany show a more diversified energy
portfolio for their industry (IEA, 2015a). The Dutch portfolio diversification is to a large
extent determined by the historical event of the Groningen field discovery, together with a
policy driven gas infrastructure rollout. France and Germany have significant higher
electrification rates of their industry, 34% and 35% respectively, whereas Dutch industry only
has an 24% electricity consumption rate of. For the Dutch (petro)chemical industry this even
lower with 18% (IEA, 2015a).
1.2 Research problem
When Dutch gas production decreases, the downstream part of the natural gas-value chain
in the Netherlands could be influenced. Other countries within the EU might have high
shares of natural gas for their primary energy consumption as well, however, no EU country
has such large domestic gas resources declining rapidly in production. To prevent structural
import dependency on one supplier the Netherlands can diversify gas supply with LNG
imports and biogas production. Another method to be less dependent on imports is to find
alternatives in the energy portfolio to satisfy Dutch energy demand. Then the question arises
how dependent on gas are we? Almost every residential building in the Netherlands is
connected to the gas grid, the quantity of energy that flows through this gas grid is
enormous. How will the industrial sector respond when gas supply decreases? Can energy
demand of industries be satisfied through electrical infrastructures? Gas contains a great
amount of energy per cubic meter, in comparison with electricity, gas delivers more than
four times as much energy than electricity to the Dutch households on a yearly basis (CBS,
2015d). Moreover, when gas fired heating is replaced by electric heating more CO2 emissions
will be the result because coal is part of the power-mix. Industry has a great demand for high
temperature heating energy in process based manufacturing. Also the clustered industrial
sectors, like the Rotterdam area, will be affected when gas supply will be reduced. These
clustered companies are using each other’s residuals and waste products as input. When the
input of CH4 (methane) is reduced, how will this affect the process on the long term? How
dependent is the Dutch industrial cluster on natural gas? The industrial dependency on gas
will be the focus of this master thesis. This dependency will be twofold; the dependency on
the molecule CH4 as input to a conversion process and the dependency for gas as a feedstock
for industrial heating.
19
1.3 Missing knowledge
As mentioned in the introduction of this chapter the missing information which will be
addressed in this thesis is the knowledge of the level and quality of gas dependency of the
Rotterdam industrial cluster. The future prospect of gas production in the Netherlands is not
bright. In this light the question is raised if one of the largest gas consuming sectors of the
Netherlands, industry, could reduce its gas demand (without leaving the country)? Is this
fossil fuel partly substitutable with alternatives to produce heat? To which extent is natural
gas used as a feedstock in the (petro)chemical plants? The required knowledge to research
the gas dependency of the Rotterdam cluster is varied:
- The properties of ideal energy supply sources for industrial clusters needs to be
determined. These properties can be used as criteria to assess potential sources for
heat supply in the Rotterdam cluster.
- Data on the energy flows (industrial heat and natural gas) throughout the Rotterdam
cluster for estimating the severity of the gas dependency.
- What are alternative energy supply sources for the industrial heating. What are the
positive and negative sides of such technologies?
- The effect on heat exchange within the cluster when gas is partly replaced by other
energy sources. How will the price calculation of heat supply be established when
this energy carrier will be utilised more?
- A final piece of missing knowledge is the future role of gas. How will the gas grid be
used? What will it’s function be, is gas replaceable and where not? This will be
analysed by possible scenarios of gas usage. In addition the possibility to insert
alternative gasses in the Dutch gas grid will be assessed.
1.4 Research questions
The missing knowledge from the preceding paragraph and the research problem are grasped
together in a main research question (MRQ) and a further division into six sub question. The
MRQ of this thesis:
“What influence has the reduction of gas production in the Netherlands on the energy
sourcing of the Rotterdam industrial cluster?”
This will be a case specific study for the industrial activity in the Rotterdam area. The
separate sub questions will each be a chapter in this thesis that will eventually support
answering the main research question. The sub questions are the following:
Q1. What are the ideal properties of an energy supply source for industrial heating processes? (This creates criteria, why is gas so well suited?)
Q2. What are the industrial energy flows for heat delivery in the Rotterdam cluster? (Current situation, focus on heat production and consumption)

20
Q3. What are important industrial conversion processes fed by natural gas in the Rotterdam cluster? (Current situation of gas conversion in Rotterdam region)
Q4. How can the industrial heating demand of the cluster be fulfilled by other means? (New technologies, examples other countries, fluctuation handling, costs, advantages, disadvantages)
Q5. How will a future heat market potentially look like when further elaborated? (Market mechanisms, costs of heat, CO2 price calculated in heat?)
Q6. What is the future mechanism and changing function of gas and its infrastructure? (Changes in the institutions, only transit of gas, or more?)
These sub questions will be described elaborately in the methodology of paragraph 2.1.
1.5 Research objective
Based on this knowledge gap a clear outline of the research problem can be shown. The
target of this thesis will be:
- Give insight how replaceable the supply source of natural gas is to identify the
dependency for gas in the Rotterdam industrial cluster. What impact will the
reduction of gas have on the Rotterdam cluster. Are the consequences and are there
alternatives?
- Showing potential alternatives for heating in industrial processes. Based on the
outcome of this industrial heat and gas dependency study recommendations can be
done to large industrial energy consumers on their energy supply portfolio.
- Mapping the energy flows on an abstract level of the Rotterdam cluster in a visual
model.
- On a national scale the objective of this visual model is clarifying the proportions of
natural gas in the total energy balance. It is expected to have a considerable effect
on the energy consumers when gas supplies would be reduced. The size of gas, coal
and oil flows are vast in comparison with for instance electricity flows.
- Providing a potential market model for trading heat, which could be used when heat
is exchanged more throughout the Rotterdam cluster on the long term.
- Researching the potential for further utilisation of the Dutch gas infrastructure
besides the “gas roundabout”.
- Getting grip on the current and future position of Dutch gas import dependency
regarding; L-gas, H-gas and conversion capacity between these two.
An explorative step in this thesis will be done to identify means to grasp industrial
heating with alternative energy sources. The empirical outline of current energy flows
throughout the Dutch industries and the explorative research on the potential to partly
replace natural gas with alternatives is the core research of this thesis to answer the
clusters' gas dependency.
21
Chapter 2: Methodology
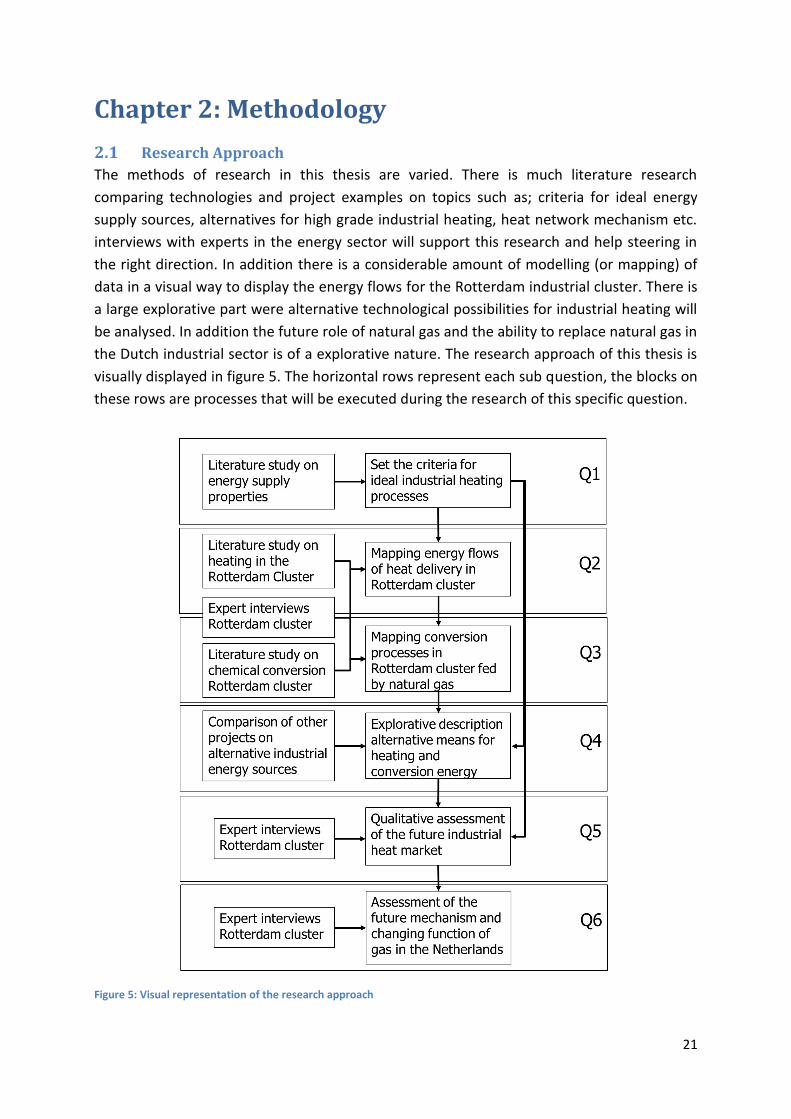
2.1 Research Approach
The methods of research in this thesis are varied. There is much literature research
comparing technologies and project examples on topics such as; criteria for ideal energy
supply sources, alternatives for high grade industrial heating, heat network mechanism etc.
interviews with experts in the energy sector will support this research and help steering in
the right direction. In addition there is a considerable amount of modelling (or mapping) of
data in a visual way to display the energy flows for the Rotterdam industrial cluster. There is
a large explorative part were alternative technological possibilities for industrial heating will
be analysed. In addition the future role of natural gas and the ability to replace natural gas in
the Dutch industrial sector is of a explorative nature. The research approach of this thesis is
visually displayed in figure 5. The horizontal rows represent each sub question, the blocks on
these rows are processes that will be executed during the research of this specific question.
Figure 5: Visual representation of the research approach
22
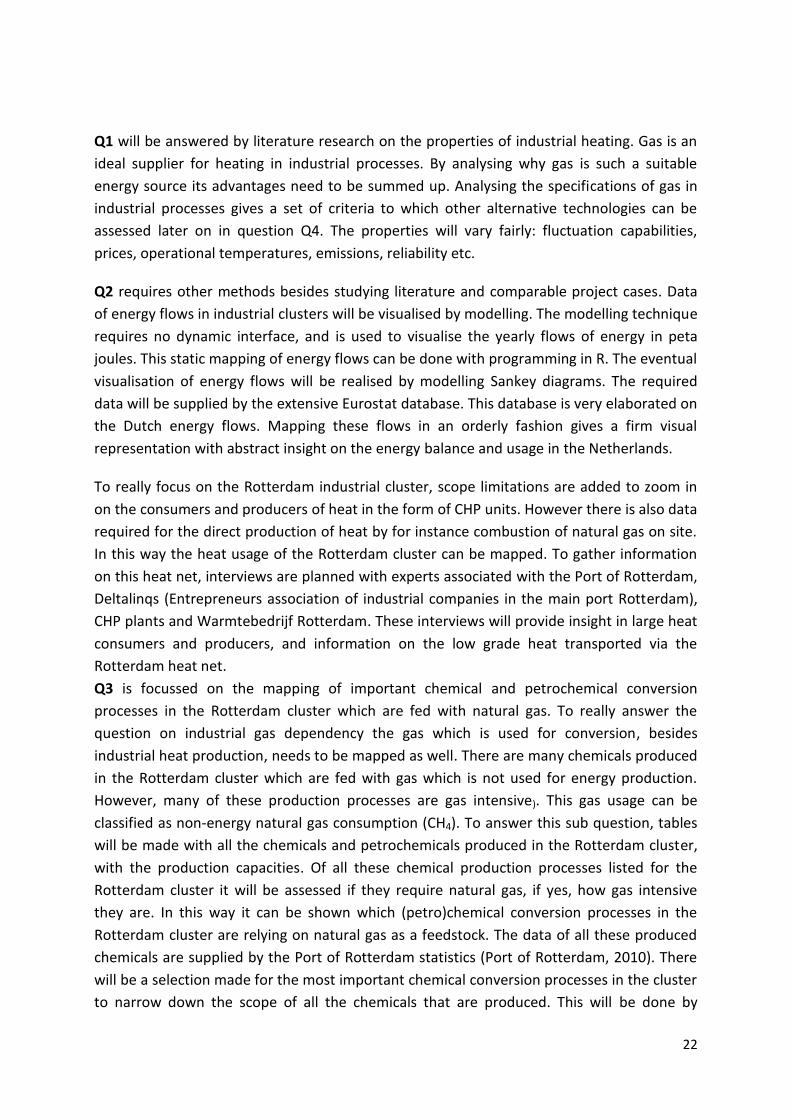
Q1 will be answered by literature research on the properties of industrial heating. Gas is an
ideal supplier for heating in industrial processes. By analysing why gas is such a suitable
energy source its advantages need to be summed up. Analysing the specifications of gas in
industrial processes gives a set of criteria to which other alternative technologies can be
assessed later on in question Q4. The properties will vary fairly: fluctuation capabilities,
prices, operational temperatures, emissions, reliability etc.
Q2 requires other methods besides studying literature and comparable project cases. Data
of energy flows in industrial clusters will be visualised by modelling. The modelling technique
requires no dynamic interface, and is used to visualise the yearly flows of energy in peta
joules. This static mapping of energy flows can be done with programming in R. The eventual
visualisation of energy flows will be realised by modelling Sankey diagrams. The required
data will be supplied by the extensive Eurostat database. This database is very elaborated on
the Dutch energy flows. Mapping these flows in an orderly fashion gives a firm visual
representation with abstract insight on the energy balance and usage in the Netherlands.
To really focus on the Rotterdam industrial cluster, scope limitations are added to zoom in
on the consumers and producers of heat in the form of CHP units. However there is also data
required for the direct production of heat by for instance combustion of natural gas on site.
In this way the heat usage of the Rotterdam cluster can be mapped. To gather information
on this heat net, interviews are planned with experts associated with the Port of Rotterdam,
Deltalinqs (Entrepreneurs association of industrial companies in the main port Rotterdam),
CHP plants and Warmtebedrijf Rotterdam. These interviews will provide insight in large heat
consumers and producers, and information on the low grade heat transported via the
Rotterdam heat net.
Q3 is focussed on the mapping of important chemical and petrochemical conversion
processes in the Rotterdam cluster which are fed with natural gas. To really answer the
question on industrial gas dependency the gas which is used for conversion, besides
industrial heat production, needs to be mapped as well. There are many chemicals produced
in the Rotterdam cluster which are fed with gas which is not used for energy production.
However, many of these production processes are gas intensive). This gas usage can be
classified as non-energy natural gas consumption (CH4). To answer this sub question, tables
will be made with all the chemicals and petrochemicals produced in the Rotterdam cluster,
with the production capacities. Of all these chemical production processes listed for the
Rotterdam cluster it will be assessed if they require natural gas, if yes, how gas intensive
they are. In this way it can be shown which (petro)chemical conversion processes in the
Rotterdam cluster are relying on natural gas as a feedstock. The data of all these produced
chemicals are supplied by the Port of Rotterdam statistics (Port of Rotterdam, 2010). There
will be a selection made for the most important chemical conversion processes in the cluster
to narrow down the scope of all the chemicals that are produced. This will be done by
23
focussing on the main chemicals produced in the Rotterdam cluster that are in its turn used
to produce other (petro)chemicals.
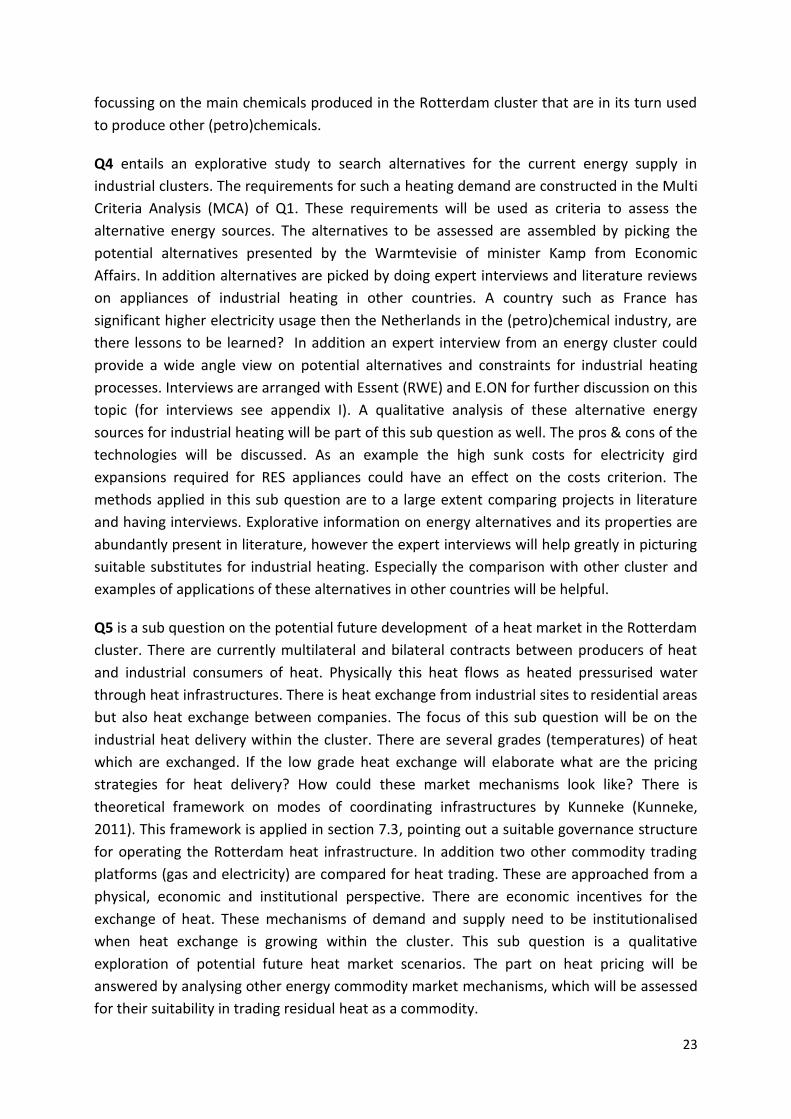
Q4 entails an explorative study to search alternatives for the current energy supply in
industrial clusters. The requirements for such a heating demand are constructed in the Multi
Criteria Analysis (MCA) of Q1. These requirements will be used as criteria to assess the
alternative energy sources. The alternatives to be assessed are assembled by picking the
potential alternatives presented by the Warmtevisie of minister Kamp from Economic
Affairs. In addition alternatives are picked by doing expert interviews and literature reviews
on appliances of industrial heating in other countries. A country such as France has
significant higher electricity usage then the Netherlands in the (petro)chemical industry, are
there lessons to be learned? In addition an expert interview from an energy cluster could
provide a wide angle view on potential alternatives and constraints for industrial heating
processes. Interviews are arranged with Essent (RWE) and E.ON for further discussion on this
topic (for interviews see appendix I). A qualitative analysis of these alternative energy
sources for industrial heating will be part of this sub question as well. The pros & cons of the
technologies will be discussed. As an example the high sunk costs for electricity gird
expansions required for RES appliances could have an effect on the costs criterion. The
methods applied in this sub question are to a large extent comparing projects in literature
and having interviews. Explorative information on energy alternatives and its properties are
abundantly present in literature, however the expert interviews will help greatly in picturing
suitable substitutes for industrial heating. Especially the comparison with other cluster and
examples of applications of these alternatives in other countries will be helpful.
Q5 is a sub question on the potential future development of a heat market in the Rotterdam
cluster. There are currently multilateral and bilateral contracts between producers of heat
and industrial consumers of heat. Physically this heat flows as heated pressurised water
through heat infrastructures. There is heat exchange from industrial sites to residential areas
but also heat exchange between companies. The focus of this sub question will be on the
industrial heat delivery within the cluster. There are several grades (temperatures) of heat
which are exchanged. If the low grade heat exchange will elaborate what are the pricing
strategies for heat delivery? How could these market mechanisms look like? There is
theoretical framework on modes of coordinating infrastructures by Kunneke (Kunneke,
2011). This framework is applied in section 7.3, pointing out a suitable governance structure
for operating the Rotterdam heat infrastructure. In addition two other commodity trading
platforms (gas and electricity) are compared for heat trading. These are approached from a
physical, economic and institutional perspective. There are economic incentives for the
exchange of heat. These mechanisms of demand and supply need to be institutionalised
when heat exchange is growing within the cluster. This sub question is a qualitative
exploration of potential future heat market scenarios. The part on heat pricing will be
answered by analysing other energy commodity market mechanisms, which will be assessed
for their suitability in trading residual heat as a commodity.
24
Q6 The last sub question is the qualitative assessment of the future mechanism and
changing function of gas and its infrastructure. Throughout this thesis alternatives for
natural gas and its implications will be analysed while the future of gas is left unsure. After a
long term transition were gas production domestically is drastically reduced the question
arises, what are the prospects for gas? Where is gas replaceable and where not? What is its
societal relevance? Will the future role of gas in the Netherlands only be the transit of gas or
more? This explorative research will be based on state of the art literature on long term
energy strategies and the latest developments regarding alternative gasses. The answer on
sub question Q6 will start from a historical perspective. This historical perspective of our
past gas strategies and decisions which are still of influence in future functions of gas usage.
Implications of a changing function of the gas grids enables shifts in economic mechanisms
and institutions (Nelson, 1994). Are there options to some sort of symbiosis in this
infrastructure, can hydrogen, high-calorific import gas and for instance biogas work together
in utilising this infrastructure?
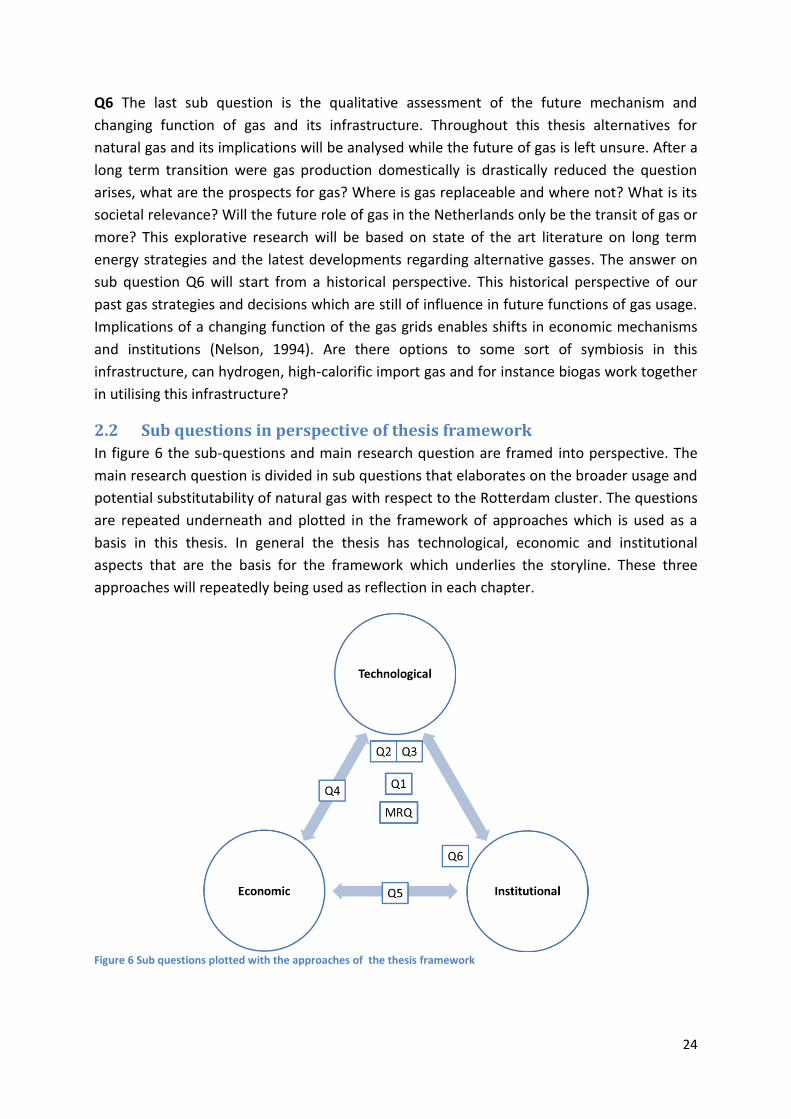
2.2 Sub questions in perspective of thesis framework
In figure 6 the sub-questions and main research question are framed into perspective. The
main research question is divided in sub questions that elaborates on the broader usage and
potential substitutability of natural gas with respect to the Rotterdam cluster. The questions
are repeated underneath and plotted in the framework of approaches which is used as a
basis in this thesis. In general the thesis has technological, economic and institutional
aspects that are the basis for the framework which underlies the storyline. These three
approaches will repeatedly being used as reflection in each chapter.
Figure 6 Sub questions plotted with the approaches of the thesis framework
25
Main research question: “What influence has the reduction of gas production in the Netherlands on the energy sourcing of the Rotterdam industrial cluster?” Q1. What are the ideal properties of an energy supply source for industrial heating processes?
Q2. What are the industrial energy flows for heat delivery in the Rotterdam cluster?
Q3. What are important industrial conversion processes fed by natural gas in the Rotterdam cluster?
Q4. How can the industrial heating demand of the cluster be fulfilled by other means?
Q5. How will a future heat market potentially look like when further elaborated?
Q6. What is the future mechanism and changing function of gas and its infrastructure?
The first sub question will shine light on the energy requirements of the Dutch large
industrial consumers. Q2 and Q3 will contribute largely to the knowledge on the current
flows of energy throughout the Rotterdam cluster by mapping gas flows used for industrial
heat and chemical conversion. Q4 is crucial answering the main research question. After all,
what are potential technological substitutes and alternative energy supply sources for
industrial heating demand? These alternatives for natural gas are as influential on the
outcome of this research as the demand requirements of the industrial clusters itself, in fact,
dependency for natural gas is reduced when suitable alternatives are in place. Q5 and Q6
will focus on the more exploratory part of this thesis. The potential for a further developed
heat exchange mechanism will be analysed. In addition Q6 will assess the alternative
methods to utilise the Dutch gas grid next to the function of a Dutch “gas roundabout”. The
last chapter (conclusion) will give an answer the main research question next to a discussion
of future research and a reflection on this research.
Technological approach
The technological perspective will play a major role in this thesis. The majority of the sub-
questions contain aspects of a technical nature. Especially sub-questions Q2 and Q3 are of a
technical nature mapping energy flows and modelling these in Sankey flow diagrams. Other
sub question are combinations of a technical approach and an economic approach, or all
three, in combination with the institutional approach as well. The technical perspective is
also present in chapters mainly concerning economics and institutions. The framework
depicted in figure 6 is only pointing out a focus, therefore the plotted questions in the figure
do not exclude the other approaches. The technical approach consist out of calculations,
dealing with technical data, programming, and technology assessments. Also a bit of
knowledge on chemistry is applied in the chapter concerning conversion of natural gas in the
(petro)chemical industry. Programming raw datasets and abstractly visualising is part of the
technical approach, however, more important is the translation behind these technical
methods. Constructing a picture of the Dutch energy balance is useful, however the
underlying message of these figures is even more interesting. For example the difference in

26
proportion comparing natural gas and oil flows to the Dutch utility sector. These differences
are enormous, especially seen the attention utilities get regarding decarbonisation. The last
sub question, concerning the potential utilization of the Dutch gas infrastructure has
technical aspects analysing the physical barriers inserting alternative gasses into the gas grid.
Basically every chapter in this thesis contains technical aspects, however, the focus of each
approach differs per chapter.
Economic approach
The economic approach for the thesis framework is based on multiple aspects. There are
cost price comparisons assessing the economic viability of alternatives for industrial heating.
There is the comparison of market mechanisms, describing their potential for trading heat as
a commodity within the Rotterdam cluster. Basically regional economics of clusters and cost
prices are very important for the economic approach (Porter, 2003). Porter wrote articles on
regional economics and industrial clustering. “We define a cluster as a geographically
proximate group of interconnected companies, suppliers, service providers and associated
institutions in a particular field, linked by externalities of various types” (Porter, 2003:562).
A cluster is characterised by services that are offered by multiple individual companies on a
single geographic location. The competitiveness of the optionality to choose between
multiple suppliers for a specific service really shows the interconnectedness of a group of
industrial facilities. The importance of these clusters are the positive externalities that
emerge as connections between individual companies. There can be exchange of common
technologies, skills, knowledge and purchased inputs (Porter, 2003).
Industrial clusters such as the Rotterdam harbour also have infrastructural advantages. Such
as; low- and high-calorific gas pipelines, biogas pipelines, crude and oil-product pipelines, a
heat net, glass fibre networks or infrastructures with other special properties or
requirements. Starting a (petro)chemical business in the Rotterdam harbour area could be
attractive due to the infrastructural assets which can be bought or used. Also the storage
capacities of natural gas, LNG, chemicals, oil and other petroleum products are advantages
of this economic clustering. The efficiencies of companies within economic clusters are
higher and institutional aspects like the interaction by the exchange of products and
residuals between actors is stimulated. This theoretic approach is recurring in the conclusion
of each chapter. Especially in sub question Q4 and Q5 were economics play a crucial role.
Institutional approach
The institutional approach is highly applicable regarding the subject of this thesis.
Institutions and institutional change play a large role influencing economic growth in
industrial clusters. The transaction cost theory is an interesting approach to assess the
behaviour of interaction within clustered areas. The social interaction of actors, bounded by
restricted rationality, will result in the objective to minimise transaction costs (Williamson,
1998). The alignment of government structures with these interactions are crucial. For this

27
thesis the institutional approach will be used when analysing the industrial dependency on
natural gas. Alternative sources for heat and substitutes for gas molecules will imply changes
for incumbent institutions currently operational in the cluster. The interaction between
actors of the Rotterdam area are multilateral, there are supply and demand obligations for
affluent and waste products in the form of contracts and covenants. For example waste
incinerators with heat delivery contracts need to produce a required minimum of heat to
supply residential areas, there are obligations and liabilities between actors which are
grasped in institutions.
Economic mechanisms (described in chapter 7) can be classified as institutions, these
economic activities are multi actor interactions stimulating productions (Nelson & Sampat,
2001). Chapter 7 goes deeper into the institutional governance of infrastructures by the
theory of Kunneke (Kunneke, 2011). Governing structures of such mechanisms are grasped
in the “play of the game” and the development of institutions (Nelson, 1994; Nelson &
Sampat, 2001; Williamson, 1998). The future role of a more established heat market will be
approached with the perspective of an institutional analysis in chapter 7 especially.
Throughout the other chapters of this thesis institutional aspects will play an important role
as well. A recurring aspect is the adoption of alternative technologies for industrial heating
and their institutional implications. In addition the last chapter focusses on the institutional
approach in particular by analysing institutional limitations to utilize the Dutch gas
infrastructure transporting alternative gasses.
2.3 Data Gathering
For this master thesis data is required, especially data from an empiric angle where the
properties of industrial heating processes will be mapped. The largest amounts of
information and data will be supplied with desk research and literature reviews. Supply
sources of this data are Google Scholar, Scopus and Science Direct.
Expert interviews are an important input for some of the aspects of this thesis. The view on
implications of alternative energy sources in energy clusters and the influence on heat
exchanges are typical subjects an expert can shine new light on. The experts that will be
interviewed are persons responsible for the energy supply portfolios of large industrial
plants/facilities consuming gas. Other experts that will be interviewed are representatives of
industrial companies in the Rotterdam cluster, who are a client of the heat net. Companies
interviewed are: Essent (RWE), E.On, Warmtebedrijf Rotterdam, Deltalinqs, Port of
Rotterdam. In addition Gasterra and Eurogas were consulted during the research phase of
this thesis. A list of interviewed persons and companies can be found in appendix I. The
setting of the interviews was in most cases an open conversation after a short presentation
on the current research of this thesis. These open conversations were shaped around several
bullet points which were established up front, documenting was done by making notes. An
example of the key discussion points for an interview is posted alongside the list of
interviews in appendix I. The interviews were deliberately held on a non-quote basis, this

28
helped the interviewees being more generous in sharing information, including sharing
positions of stakeholders. These interviews helped asking the right questions, pointing out
the right directions. In addition some of this information received by interviews in used or
applied in this thesis (by referring).
The quantitative analysis is mostly focuses in sub question Q2 and Q3, where heat and
molecular flows of natural gas in the industrial sector are mapped with the Sankey
programming of the Eurostat database. This database is very elaborate on the Dutch energy
flows. Mapping these flows in an orderly fashion gives a firm visual representation with
abstract insight on the energy flows in clustered industries. Additional data will be used of
Gasunie (provided by CIEP), CBS, IEA and EBN and some key reports (see reference list). Data
on molecular flow of CH4 is supported by the data statistical reports from the Port of
Rotterdam.
2.4 Scientific relevance
The answer to the main research question if gas is substitutable in the industrial sector will
contribute to our existing knowledge on the energy supply portfolio of the Rotterdam
industrial cluster. Another useful scientific aspect is the insight in the abstract flows of
energy of the national Dutch industry. More in depth, the flows of industrial heating
throughout the Rotterdam cluster, both, low and high grade heat are mapped. Until now
there is no overview of heat and gas flows of the large industrial consumers. The empirical
mapping of these flows contributes to the existing knowledge of heat and gas usage within
the Dutch industry and specifically the Rotterdam cluster.
Equally interesting is the mapping of the chemical and petrochemical conversion processes.
Depicting an overview of the most important chemical processes is useful for the knowledge
where and how much CH4 is used for conversion (non-energy gas usage). This seamlessly fits
with the interconnectivity of the cluster, and the eventual resource dependency of the
(petro)chemical conversion of natural gas as molecule.
The explorative part where the future function of gas in the Netherlands will be addressed
could contribute to the understanding of potential institutional mechanisms for gas
infrastructure utilisation. In addition heat market mechanisms will be analysed for the
Rotterdam industrial cluster. There is added value by testing the theoretic framework of
Kunneke on critical transactions, pointing out a coordination mechanism suitable for the
heat infrastructure in the cluster.
2.5 Deliverables
The deliverables from this thesis are multiple:
A visual model that represents the energy flows (heat and gas) in the Rotterdam
industrial clustered sector. This model will be abstract, but suitable enough to
understand the internal heat exchange that is currently in place or potentially
possible for implementation. A more in depth analyses of the direct heat consumers
and producer connected to the industrial heat net in the Rotterdam cluster.
29
Understanding of a potentially grown heat market and its market mechanism, which
could become important for industrial heating processes.
Portfolio diversification options (alternatives) for large industrial energy consumers
with positive and negative assessments of the used alternative energy sources.
The potential future function or role of gas in the Netherlands. An exploration for
possible scenarios related to gas usage and the ability to replace natural gas in some
industrial sectors.
An answer on the substitutability of natural gas in the Rotterdam industrial cluster.
30
Chapter 3: The ideal energy supply for industrial
heating processes What are the ideal properties for an energy supply source to feed industrial heating
processes? The requirements for such energy supply sources are multiple. There are various
criteria which influence the type of energy that is chosen to heat industrial processes. These
requirements are included in paragraph 3.1. Cluster specific heat requirement are described
in paragraph 3.2. For most large industrial processes gas is required. Why is that? This is the
focus of paragraph 3.3.
3.1 Criteria for industrial heating energy supply
There are multiple criteria which influence the type of energy that is chosen to heat
industrial processes. The nature of the heat source is affected by the type of fuel that is
chosen. There is a spread in operational temperatures, with different fuel types as feedstock
per temperature range. The requirements for the industrial processes are crucial for the
establishment of an energy portfolio in industrial clusters.
The capacity of the required heat, the amount of joules that flow per unit of time, is an
important criterion for the energy supply. This capacity criterion is subdivided in peak
demand, overall demand and fluctuations of capacity. Basically this means that the fuel type
needs to be able to meet the maximum flow of joules per second, the overall operational
demand and the speed of ramp-up and ramp-down when the operational demand is
changed. This variability of heat capacity can be measured by the ramp-up and -down time.
In addition to capacity requirements there is the reliability of the energy supply source. The
process industry is characterised by 24/7 operational processes with very few down-times.
The continuous supply of heat is necessary to keep these processes optimal running. The
supply of the fuel as a feedstock needs to be reliable and undisturbed. Storage of the
feedstock can be possible in some cases such as gas or coal. In case of heat exchange or
electricity as feedstock the storage of delivered energy is much harder, in most cases
(especially with electricity) the energy needs to be used directly in case of industrial heating
processes. This criterion can be characterised as operational reliability.
When storage of energy for industrial heating is the case, long term availability aspects
come into play. What is the delivery time of the substance or feedstock? What are the future
prospects of supply on this feedstock? Will there be enough supply of this fuel source in the
mid- till long-term future? This criterion is very important for the main argument of this
thesis. A fuel alternative that has positive potential for storage and future surpluses will
perform better on this criterion than energy sources that need direct usage upon delivery.
The future supply source and reliability of natural gas is doubtful for the Dutch situation.
Other fuel sources and technologies can shine light on the future supply on the variety in
31
future supplies of energy. Another criterion in addition to this supply is the travel distance of
the heat source. Indirectly this distance influences the requirements for a infrastructure
necessary to transport this energy carrier. This is relevant for the physical necessity which
needs to be in place to fulfil industrial energy requirements with a specific energy source.
Another criterion is the quality of the energy source. The quality can be split up in two types
of quality: the energy efficiency of the source and the pollution of the energy source. The
effectiveness of the energy utilisation or the exergy quality, is expressed by the Carnot
efficiency. This efficiency is a scale for the maximum amount of useful work delivered during
a process in an system with an equilibrium state extracted from heat. In other words the
maximum conversion ratio from heat to work. The Carnot efficiency is the theoretic
maximum upper limit of efficiency.
The other quality of an energy source can be expressed in the degree of pollution. This
pollution can be measured by the emission of Green House Gas (GHG) per delivered amount
of Joule. The main GHGs are Water Vapour (H2O), Carbon Dioxide (CO2), Methane (CH4),
Nitrous Oxide (N2O), Ozone (O3) and Chlorofluorocarbons (CFCs) (Denman, et al., 2007). The
emission of the GHGs will be measured in the amount of tonnes GHG per Joule produced
energy. Not to be confused with concentrations of GHG, these measures do not represent
emissions. The degree of pollution of a specific heat supply source can be measured by its
emissions which are a firm basis as criteria.
A final criterion for energy supply which is inevitable and crucial, the costs. The cost aspect is
two sided, there are the operational cost of an energy source and the structural costs that
come along with the investment and maintenance. The operational costs will be most likely
the cost price (or marginal costs) of the specific energy source were an momentary value is
equal to an amount of joules. The operational cost will also take into account the
transportation of fuels, which differs per technology. The structural costs for a specific type
of installation or energy source can be an important selection criterion when opting for an
fuel source. To compare alternative technologies with each other the levelized costs of
energy is a useful measure. The levelized cost of energy are an estimate of the total cost of
energy integrated. This includes payback time, investment and operating costs.

32
Table 2: Criteria for energy supply source assessment
Criteria for heat source Operational unit […]
Capacity - peak - fluctuation changes
Energy flow [J/hour] Ramp-up & Ramp-down time [minutes]
Reliability - operational Disturbances [#/year] or downtime [minutes]
Availability - future supply - supply
Availability of energy source [J] Delivery time of energy source [days]
Infrastructure - distance - operational
Travel distance [km] Temp [°C] & Pressure [bar]
Quality - exergy - pollution
Carnot efficiency [ɳ] GHG emission [Ton GHG/Mj]
Costs - operational - investment - maintenance
Cost price of fuel [€/J] Capacity investment [€/MW] Maintenance cost [€/year]
Later on in this thesis these criteria will be used when alternative fuel sources and
techniques will be analysed for the delivery of industrial heat. The right hand side of the
table shows the operational units in which the criteria are measurable. Since not all the data
about new technologies will be publicly available or thoroughly researched the assessment
of different solutions for industrial heat will be qualitatively, using a Multi Criteria Analysis
(MCA).
3.2 Cluster specific heat requirements
The Rotterdam cluster has specific characteristics which ensure a case specific demand for
heat. The Rotterdam harbour is a vast area were multiple large industrial energy consumers
are operational. Figure 7 shows a map of the Rotterdam harbour region. The whole
Rotterdam cluster includes the port of Moerdijk and parts of Dordrecht as well (Port of
Rotterdam, 2013).
Figure 7: Rotterdam harbour sectorial division (Port of Rotterdam, 2015).
Figure 7 distinguishes several type of sectors in the Rotterdam harbour area. There are
multiple characteristics for the Rotterdam Port. Flows such as; oil, iron ore, coal, fruit, dry
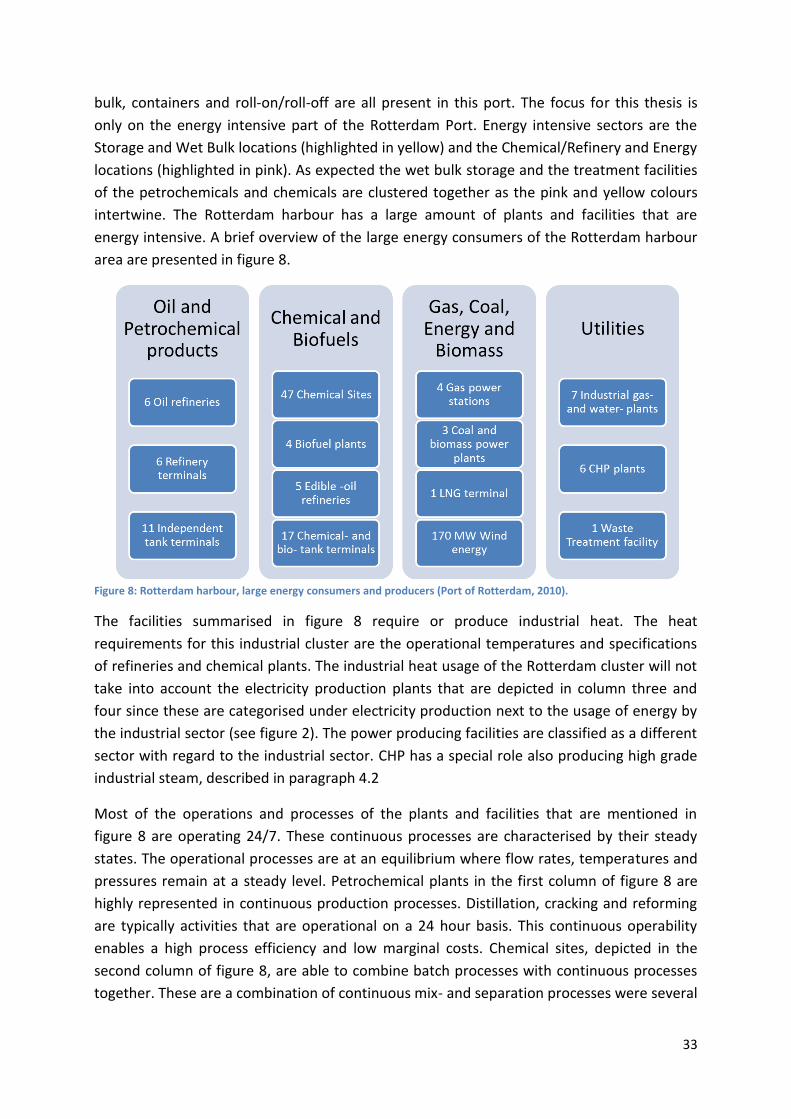
33
bulk, containers and roll-on/roll-off are all present in this port. The focus for this thesis is
only on the energy intensive part of the Rotterdam Port. Energy intensive sectors are the
Storage and Wet Bulk locations (highlighted in yellow) and the Chemical/Refinery and Energy
locations (highlighted in pink). As expected the wet bulk storage and the treatment facilities
of the petrochemicals and chemicals are clustered together as the pink and yellow colours
intertwine. The Rotterdam harbour has a large amount of plants and facilities that are
energy intensive. A brief overview of the large energy consumers of the Rotterdam harbour
area are presented in figure 8.
Figure 8: Rotterdam harbour, large energy consumers and producers (Port of Rotterdam, 2010).
The facilities summarised in figure 8 require or produce industrial heat. The heat
requirements for this industrial cluster are the operational temperatures and specifications
of refineries and chemical plants. The industrial heat usage of the Rotterdam cluster will not
take into account the electricity production plants that are depicted in column three and
four since these are categorised under electricity production next to the usage of energy by
the industrial sector (see figure 2). The power producing facilities are classified as a different
sector with regard to the industrial sector. CHP has a special role also producing high grade
industrial steam, described in paragraph 4.2
Most of the operations and processes of the plants and facilities that are mentioned in
figure 8 are operating 24/7. These continuous processes are characterised by their steady
states. The operational processes are at an equilibrium where flow rates, temperatures and
pressures remain at a steady level. Petrochemical plants in the first column of figure 8 are
highly represented in continuous production processes. Distillation, cracking and reforming
are typically activities that are operational on a 24 hour basis. This continuous operability
enables a high process efficiency and low marginal costs. Chemical sites, depicted in the
second column of figure 8, are able to combine batch processes with continuous processes
together. These are a combination of continuous mix- and separation processes were several
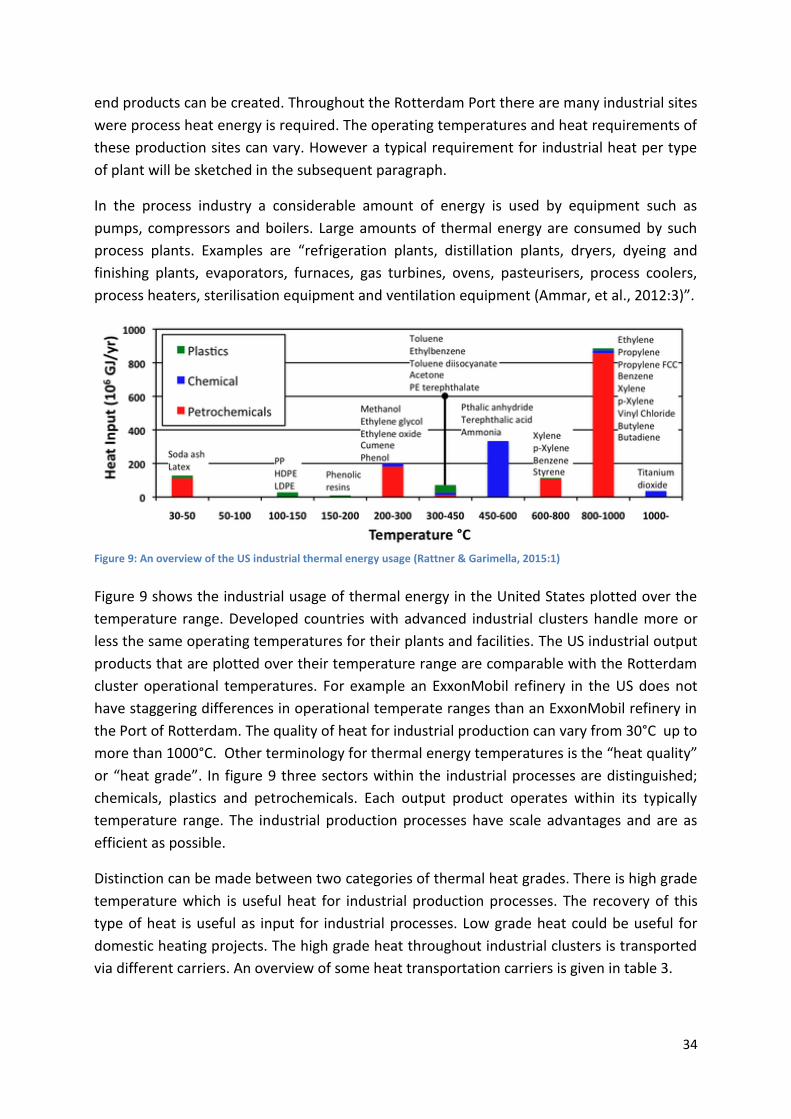
34
end products can be created. Throughout the Rotterdam Port there are many industrial sites
were process heat energy is required. The operating temperatures and heat requirements of
these production sites can vary. However a typical requirement for industrial heat per type
of plant will be sketched in the subsequent paragraph.
In the process industry a considerable amount of energy is used by equipment such as
pumps, compressors and boilers. Large amounts of thermal energy are consumed by such
process plants. Examples are “refrigeration plants, distillation plants, dryers, dyeing and
finishing plants, evaporators, furnaces, gas turbines, ovens, pasteurisers, process coolers,
process heaters, sterilisation equipment and ventilation equipment (Ammar, et al., 2012:3)”.
Figure 9: An overview of the US industrial thermal energy usage (Rattner & Garimella, 2015:1)
Figure 9 shows the industrial usage of thermal energy in the United States plotted over the
temperature range. Developed countries with advanced industrial clusters handle more or
less the same operating temperatures for their plants and facilities. The US industrial output
products that are plotted over their temperature range are comparable with the Rotterdam
cluster operational temperatures. For example an ExxonMobil refinery in the US does not
have staggering differences in operational temperate ranges than an ExxonMobil refinery in
the Port of Rotterdam. The quality of heat for industrial production can vary from 30°C up to
more than 1000°C. Other terminology for thermal energy temperatures is the “heat quality”
or “heat grade”. In figure 9 three sectors within the industrial processes are distinguished;
chemicals, plastics and petrochemicals. Each output product operates within its typically
temperature range. The industrial production processes have scale advantages and are as
efficient as possible.
Distinction can be made between two categories of thermal heat grades. There is high grade
temperature which is useful heat for industrial production processes. The recovery of this
type of heat is useful as input for industrial processes. Low grade heat could be useful for
domestic heating projects. The high grade heat throughout industrial clusters is transported
via different carriers. An overview of some heat transportation carriers is given in table 3.
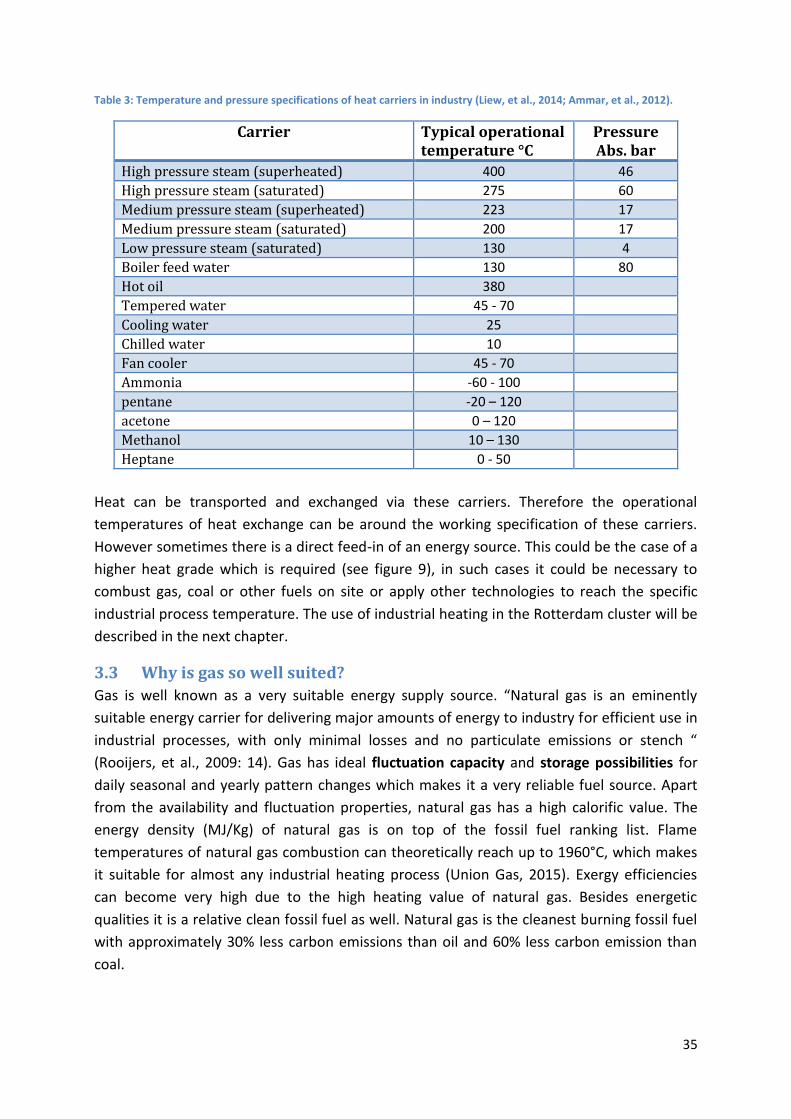
35
Table 3: Temperature and pressure specifications of heat carriers in industry (Liew, et al., 2014; Ammar, et al., 2012).
Carrier Typical operational temperature °C
Pressure Abs. bar
High pressure steam (superheated) 400 46
High pressure steam (saturated) 275 60
Medium pressure steam (superheated) 223 17
Medium pressure steam (saturated) 200 17
Low pressure steam (saturated) 130 4
Boiler feed water 130 80
Hot oil 380
Tempered water 45 - 70
Cooling water 25
Chilled water 10
Fan cooler 45 - 70
Ammonia -60 - 100
pentane -20 – 120
acetone 0 – 120
Methanol 10 – 130
Heptane 0 - 50
Heat can be transported and exchanged via these carriers. Therefore the operational
temperatures of heat exchange can be around the working specification of these carriers.
However sometimes there is a direct feed-in of an energy source. This could be the case of a
higher heat grade which is required (see figure 9), in such cases it could be necessary to
combust gas, coal or other fuels on site or apply other technologies to reach the specific
industrial process temperature. The use of industrial heating in the Rotterdam cluster will be
described in the next chapter.
3.3 Why is gas so well suited?
Gas is well known as a very suitable energy supply source. “Natural gas is an eminently
suitable energy carrier for delivering major amounts of energy to industry for efficient use in
industrial processes, with only minimal losses and no particulate emissions or stench “
(Rooijers, et al., 2009: 14). Gas has ideal fluctuation capacity and storage possibilities for
daily seasonal and yearly pattern changes which makes it a very reliable fuel source. Apart
from the availability and fluctuation properties, natural gas has a high calorific value. The
energy density (MJ/Kg) of natural gas is on top of the fossil fuel ranking list. Flame
temperatures of natural gas combustion can theoretically reach up to 1960°C, which makes
it suitable for almost any industrial heating process (Union Gas, 2015). Exergy efficiencies
can become very high due to the high heating value of natural gas. Besides energetic
qualities it is a relative clean fossil fuel as well. Natural gas is the cleanest burning fossil fuel
with approximately 30% less carbon emissions than oil and 60% less carbon emission than
coal.
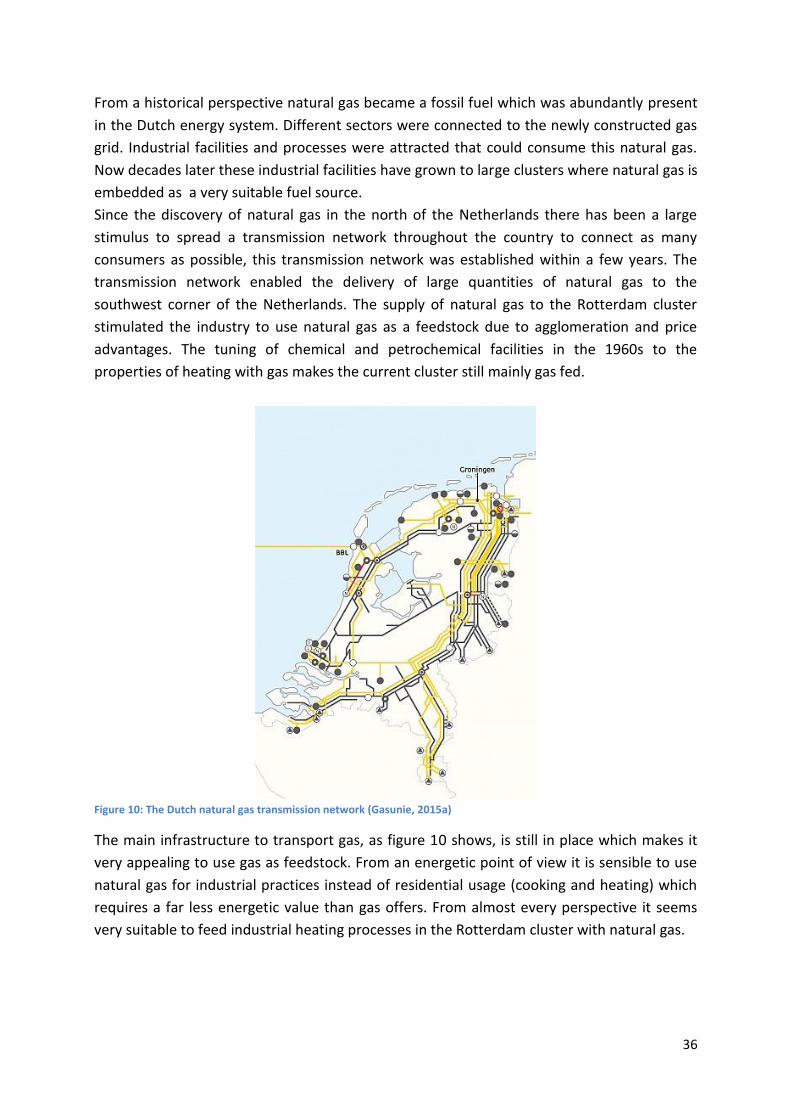
36
From a historical perspective natural gas became a fossil fuel which was abundantly present
in the Dutch energy system. Different sectors were connected to the newly constructed gas
grid. Industrial facilities and processes were attracted that could consume this natural gas.
Now decades later these industrial facilities have grown to large clusters where natural gas is
embedded as a very suitable fuel source.
Since the discovery of natural gas in the north of the Netherlands there has been a large
stimulus to spread a transmission network throughout the country to connect as many
consumers as possible, this transmission network was established within a few years. The
transmission network enabled the delivery of large quantities of natural gas to the
southwest corner of the Netherlands. The supply of natural gas to the Rotterdam cluster
stimulated the industry to use natural gas as a feedstock due to agglomeration and price
advantages. The tuning of chemical and petrochemical facilities in the 1960s to the
properties of heating with gas makes the current cluster still mainly gas fed.
Figure 10: The Dutch natural gas transmission network (Gasunie, 2015a)
The main infrastructure to transport gas, as figure 10 shows, is still in place which makes it
very appealing to use gas as feedstock. From an energetic point of view it is sensible to use
natural gas for industrial practices instead of residential usage (cooking and heating) which
requires a far less energetic value than gas offers. From almost every perspective it seems
very suitable to feed industrial heating processes in the Rotterdam cluster with natural gas.
37
3.4 Conclusion
What are the ideal properties of an energy supply source for industrial heating processes?
There are multiple criteria for an ideal energy source, the set of criteria will be summarised
in this conclusion. The first check in the criteria list are the capacity properties of a heat
source.
There are several technical requirements to a heat source. Capacity in the form of
fluctuation changes, reliable supply and availability of the future provisions of the resource.
Infrastructural requirements for an industrial heat resources are a checkmark, is there an
infrastructure in place? What is the travel distance? Also the quality of the energy is
important. What is the energetic value of the resource, how does it score on an exergy
analysis? The other quality of a heating source is important as well, the emissions. How
polluting is a certain amount of heat delivered by the type of fuel?
The last aspects of the criteria list is of an economic nature. What are the costs for an ideal
industrial heating source. The costs are divided into operational, investment and
maintenance costs. The operational cost of a fuel type is largely determined by the marginal
production cost of heat. The investment costs differs per type of fuel, for instance the supply
of industrial heating fired by gas does not require extra in depth investments since the
infrastructure is already in place. Other fuel sources may require higher investments when
implemented in the industrial cluster. Maintenance costs of the techniques and
infrastructures that are in place to facilitate the heat supply to the industrial cluster are
different per type of fuel and technique, some will be more labour intensive than others.
This assembly of criteria will all be taken into account when opting for a specific supply
source of industrial heating. Next to technical criteria and economic considerations,
institutions will play a role as well. The incumbent system is very important, the value of
historical choices regarding gas infrastructure investments are of great influence on the
current system. The established techniques and mechanisms to heat industrial processes are
deeply institutionalised in habits, long term contracts and the mind-set that gas is the most
suitable supplier for industrial heating (paragraph 3.3). However in the light of current public
perception towards domestic natural gas production and shale gas exploitation in the
Netherlands opting for alternative industrial heating applications is more accepted. All in all,
the set of criteria summed up in this chapter forms a suitable base for assessing industrial
heating sources in chapter 6.
38
Chapter 4: The industrial energy flows for heat
delivery in the Rotterdam cluster
This chapter focusses on the second sub question: “What are the industrial energy flows for
heat delivery in the Rotterdam cluster?” To answer this sub question a distinction has been
made between two approaches on heat usage throughout industries. Section 4.1 will analyse
the energy flows for all energy carriers throughout the national industry, to get an
understanding the proportion of heat transportation in comparison with the movements of
coal, gas, oil, chemicals and electricity. Section 4.2 will be specified on the Rotterdam cluster,
mapping heat flows to gain insight on the gas consumption. The fuel mix for industrial heat
production is important for answering the gas dependency question.
4.1 Mapping of industrial energy flows the Netherlands
This section is dedicated to depict the energy flows throughout the Netherlands to get them
in perspective. These energy flows have been plotted with the Sankey diagram method. This
type of modelling is used to visualise the yearly flows of energy per fuel type in joules
throughout different sectors. This static mapping of energy flows is done with programming
in R, using the programme RStudio. For an overview of the programme used and the script
of the actual programme of the model can be found in Appendix III.
For the visualisations in this paragraph the level of aggregation will become more focussed
per model. All the way from the Dutch energy balance down to the gas usage for heat in
Dutch industries. The latter illustration will be material for further discussion in section 4.2
on the Rotterdam cluster. To model the energy flows in a graph, specific data was required.
Which were provided by the elaborate statistic databases of Eurostat and the EIA (IEA,
2015a; Eurostat, 2015). The Eurostat database for instance has statistics on the size of the
energy flows per type of energy carrier throughout each process (industry, conversion,
consumption, transportation, residential usage etc.) of each country in the EU from 1990
onwards. An overview of this database, adapted specific to the case of the Dutch energy
balance in 2013, can be found in appendix II. Mapping the data of all these energy flows in
an orderly fashion gives a firm visual representation on the energy situation in the
Netherlands. After making a distinction among the data to reduce the amount of energy
flows for visualisation purposes (to realise an organised overview instead of a spaghetti), the
energy flows with a non-significant amount (in Tera joules) on a yearly basis, have been
removed in the visualisations. The chosen tipping point for excluding an energy flow is stated
around 10.000 Tera joules. The joules from the flows left out of the visualisations are still
included in the total amounts (and calculations) but not depicted as a labyrinth of small
flows. The energy flows depicted in the Sankey visualisations go from left to right.
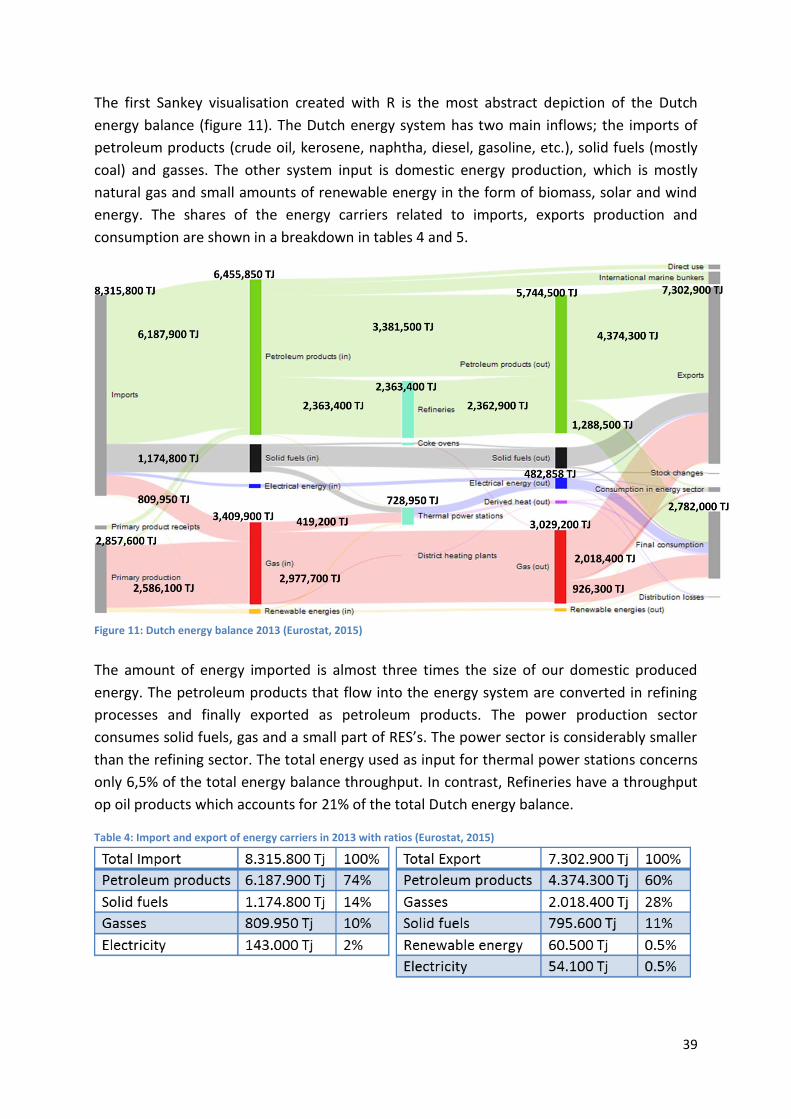
39
The first Sankey visualisation created with R is the most abstract depiction of the Dutch
energy balance (figure 11). The Dutch energy system has two main inflows; the imports of
petroleum products (crude oil, kerosene, naphtha, diesel, gasoline, etc.), solid fuels (mostly
coal) and gasses. The other system input is domestic energy production, which is mostly
natural gas and small amounts of renewable energy in the form of biomass, solar and wind
energy. The shares of the energy carriers related to imports, exports production and
consumption are shown in a breakdown in tables 4 and 5.
Figure 11: Dutch energy balance 2013 (Eurostat, 2015)
The amount of energy imported is almost three times the size of our domestic produced
energy. The petroleum products that flow into the energy system are converted in refining
processes and finally exported as petroleum products. The power production sector
consumes solid fuels, gas and a small part of RES’s. The power sector is considerably smaller
than the refining sector. The total energy used as input for thermal power stations concerns
only 6,5% of the total energy balance throughput. In contrast, Refineries have a throughput
op oil products which accounts for 21% of the total Dutch energy balance.
Table 4: Import and export of energy carriers in 2013 with ratios (Eurostat, 2015)
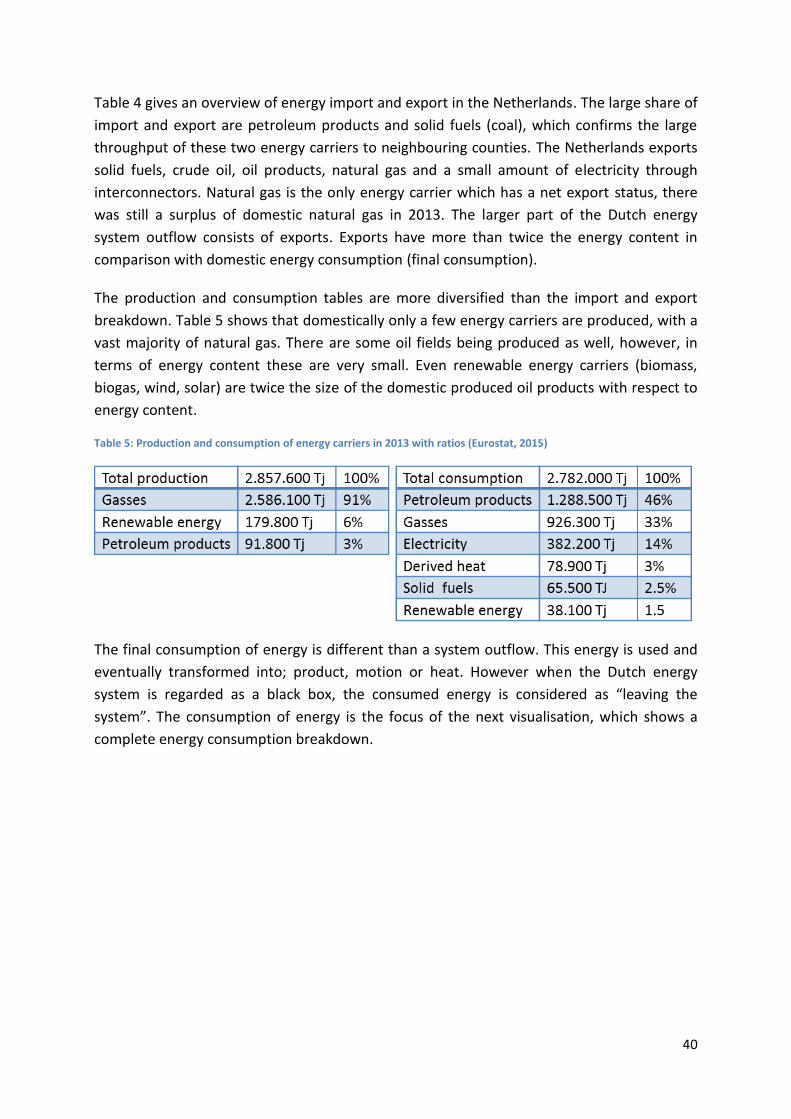
40
Table 4 gives an overview of energy import and export in the Netherlands. The large share of
import and export are petroleum products and solid fuels (coal), which confirms the large
throughput of these two energy carriers to neighbouring counties. The Netherlands exports
solid fuels, crude oil, oil products, natural gas and a small amount of electricity through
interconnectors. Natural gas is the only energy carrier which has a net export status, there
was still a surplus of domestic natural gas in 2013. The larger part of the Dutch energy
system outflow consists of exports. Exports have more than twice the energy content in
comparison with domestic energy consumption (final consumption).
The production and consumption tables are more diversified than the import and export
breakdown. Table 5 shows that domestically only a few energy carriers are produced, with a
vast majority of natural gas. There are some oil fields being produced as well, however, in
terms of energy content these are very small. Even renewable energy carriers (biomass,
biogas, wind, solar) are twice the size of the domestic produced oil products with respect to
energy content.
Table 5: Production and consumption of energy carriers in 2013 with ratios (Eurostat, 2015)
The final consumption of energy is different than a system outflow. This energy is used and
eventually transformed into; product, motion or heat. However when the Dutch energy
system is regarded as a black box, the consumed energy is considered as “leaving the
system”. The consumption of energy is the focus of the next visualisation, which shows a
complete energy consumption breakdown.

41
The second Sankey visualisation shows the Dutch final energy consumption in greater detail.
The energy consumption breakdown is focussed to the maximum precision level the
Eurostat database allowed. On the right hand side of figure 12 is a vertical dotted line. This
line makes a separation between the decomposition of energy usage per sector and the type
of energy carrier supplying these sectors. The fuel sources on the right side are simulated to
flow from right to left. The fuel sources on the right depict the proportion of every fuel type
which is consumed per process.
Figure 12: Final Dutch energy consumption 2013 (Eurostat, 2015)
The final consumption is divided in two sections; the fuels that are used for supplying energy
and the fuels that are used for its molecules e.g. conversion into chemical products. The
latter category is the case with some industrial processes, this category is called the “Non-
energy consumption”. The upper branch in figure 12 shows the Dutch non-energetic
consumption of fuels. The consumption of fuel for energetic purposes (heating, cooling, and
movement) is bigger than the non-energetic consumption of fuels. The energetic fuel
consumption of the lower branch is further subdivided into categories. Several interesting
sectors are highlighted in table 6, where the energy consumption is displayed per fuel.
A majority of the residential energy consumption is supplied with natural gas (74%), a
smaller part is supplied with electricity (20%). Only a small percentage of the Dutch
households are connected with a heat network, however, the amount of joules that are
transferred to these houses is still 2% of all energy supplied to the Dutch residents on a
yearly basis.
The transport sector for both, road traffic, and international aviation, use petroleum
products to a large extent. Products as kerosene, diesel and gasoline are the almost sole
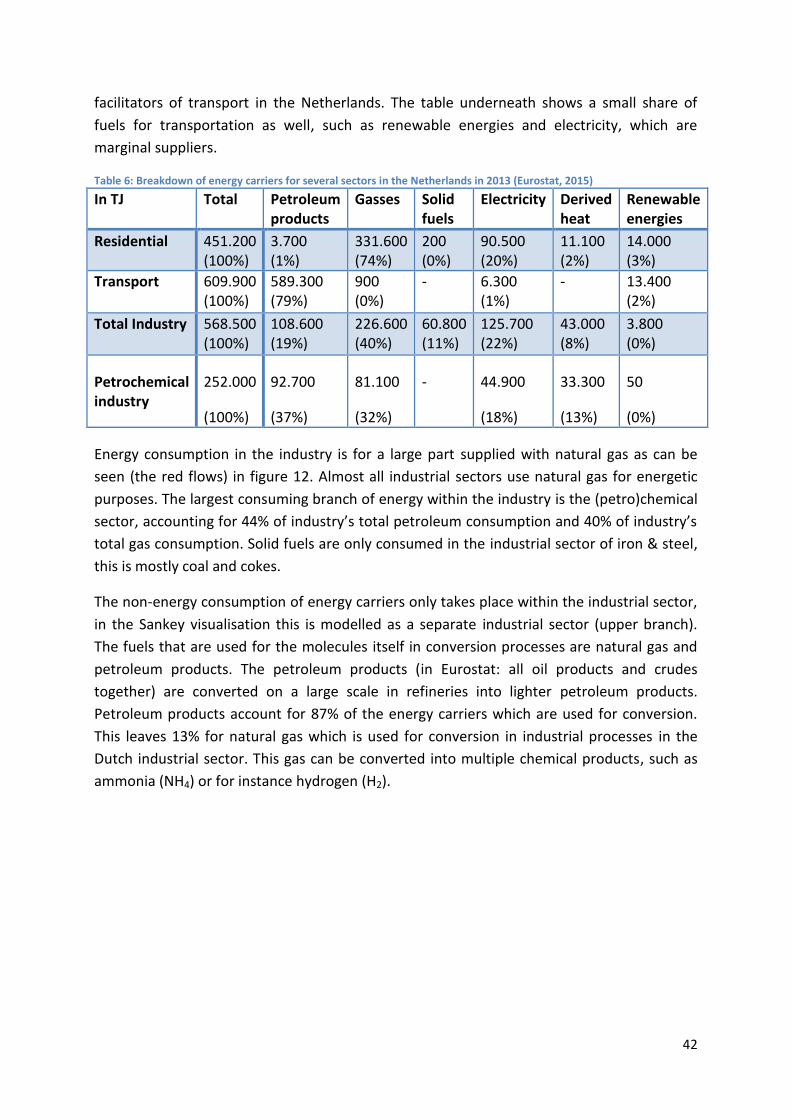
42
facilitators of transport in the Netherlands. The table underneath shows a small share of
fuels for transportation as well, such as renewable energies and electricity, which are
marginal suppliers.
Table 6: Breakdown of energy carriers for several sectors in the Netherlands in 2013 (Eurostat, 2015)
In TJ Total Petroleum products
Gasses Solid fuels
Electricity Derived heat
Renewable energies
Residential 451.200 (100%)
3.700 (1%)
331.600 (74%)
200 (0%)
90.500 (20%)
11.100 (2%)
14.000 (3%)
Transport 609.900 (100%)
589.300 (79%)
900 (0%)
- 6.300 (1%)
- 13.400 (2%)
Total Industry 568.500 (100%)
108.600 (19%)
226.600 (40%)
60.800 (11%)
125.700 (22%)
43.000 (8%)
3.800 (0%)
Petrochemical industry
252.000
(100%)
92.700
(37%)
81.100
(32%)
- 44.900
(18%)
33.300
(13%)
50
(0%)
Energy consumption in the industry is for a large part supplied with natural gas as can be
seen (the red flows) in figure 12. Almost all industrial sectors use natural gas for energetic
purposes. The largest consuming branch of energy within the industry is the (petro)chemical
sector, accounting for 44% of industry’s total petroleum consumption and 40% of industry’s
total gas consumption. Solid fuels are only consumed in the industrial sector of iron & steel,
this is mostly coal and cokes.
The non-energy consumption of energy carriers only takes place within the industrial sector,
in the Sankey visualisation this is modelled as a separate industrial sector (upper branch).
The fuels that are used for the molecules itself in conversion processes are natural gas and
petroleum products. The petroleum products (in Eurostat: all oil products and crudes
together) are converted on a large scale in refineries into lighter petroleum products.
Petroleum products account for 87% of the energy carriers which are used for conversion.
This leaves 13% for natural gas which is used for conversion in industrial processes in the
Dutch industrial sector. This gas can be converted into multiple chemical products, such as
ammonia (NH4) or for instance hydrogen (H2).
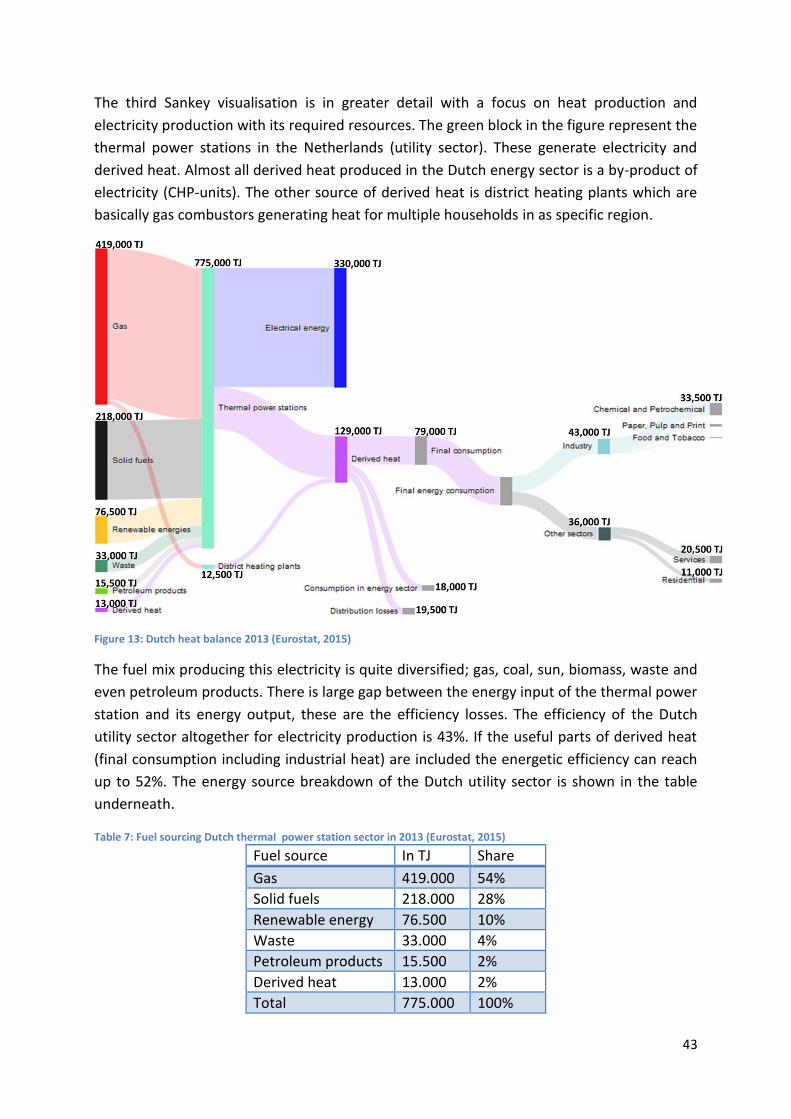
43
The third Sankey visualisation is in greater detail with a focus on heat production and
electricity production with its required resources. The green block in the figure represent the
thermal power stations in the Netherlands (utility sector). These generate electricity and
derived heat. Almost all derived heat produced in the Dutch energy sector is a by-product of
electricity (CHP-units). The other source of derived heat is district heating plants which are
basically gas combustors generating heat for multiple households in as specific region.
Figure 13: Dutch heat balance 2013 (Eurostat, 2015)
The fuel mix producing this electricity is quite diversified; gas, coal, sun, biomass, waste and
even petroleum products. There is large gap between the energy input of the thermal power
station and its energy output, these are the efficiency losses. The efficiency of the Dutch
utility sector altogether for electricity production is 43%. If the useful parts of derived heat
(final consumption including industrial heat) are included the energetic efficiency can reach
up to 52%. The energy source breakdown of the Dutch utility sector is shown in the table
underneath.
Table 7: Fuel sourcing Dutch thermal power station sector in 2013 (Eurostat, 2015)
Fuel source In TJ Share
Gas 419.000 54%
Solid fuels 218.000 28%
Renewable energy 76.500 10%
Waste 33.000 4%
Petroleum products 15.500 2%
Derived heat 13.000 2%
Total 775.000 100%

44
The derived heat input to the thermal power plants (bottom left) in figure 13 is self-
produced heat which is reused as a feedback loop. The purple flow of derived heat is
consumed in several sectors. A part of the produced derived heat is lost to; efficiency
losses(10%), distribution losses (15%) and consumption of heat in the energy sector (14%).
The rest of the derived heat (61%) is available for final consumption.
A large part of this derived heat is consumed by the industrial sector, where the chemical
and petrochemical plants are consuming the largest share (78%). The industrial processes
can use derived heat as input for their heat exchangers. Most industrial heating processes
convert natural gas directly into heat on site by combustion. This is shown by the large gas
consumption for energetic purposes by the (petro)chemical sector in contrast with their
derived heat input on the visualisation of figure 12. The derived heat is largely produced by
thermal power stations. This contains all sorts of power stations, including Combined Heat
and Power (CHP) units. These CHP units have an important presence in the Rotterdam
cluster (Davidse Consultancy, 2012). Some large companies have a CHP unit on site to
produce their own heat and electricity.
The data provided in the three Sankey visualisations of this section are based on the national
energy sector. The focus on the Rotterdam cluster has yet to be made, zooming in at the
specific gas and heat dependency. The Eurostat database only provided data for the Dutch
energy sector, which is to generic to draw conclusions. The next paragraph will be a more in
depth analyses of the Rotterdam cluster.
4.2 Industrial heat flows Rotterdam Cluster
To really focus on the Rotterdam industrial cluster, scope limitations are added to zoom in
on the consumers of the heat net facilitated by Stedin and Eneco and the CHP production
units in the area. By assessing these production capacities and their energy supply
diversification, the heat usage of the Rotterdam cluster can be mapped. To gather
information on this heat net, interviews were held with experts associated with the Port of
Rotterdam and Deltalinqs (Entrepreneurial association of industrial companies in the main
port Rotterdam) and Warmtebedrijf Rotterdam. These interviews provided insight in large
heat consumers and producers that interact with connections to the heat net. The
interviews were very useful, pointing out specific reports containing data required on cluster
specific heat consumption.
The final energy usage in the Dutch industry is for 80% supplied with heat. This can be
derived heat or heat delivered directly with the combustion of; coal, gas, other fossil fuels or
even heating with electricity. When looking into the primary source for this heat consumed
in industry the direct heat intake transported via steam and warm water pipelines is much
lower (Alderliesten, 2013). Almost 30% of the Dutch industrial final heat consumption is
lower than 250°C, which means that CHP units could supply this range of heat quality. More
than 10% of the industrial heat consumption has a heat quality of less than 100°C
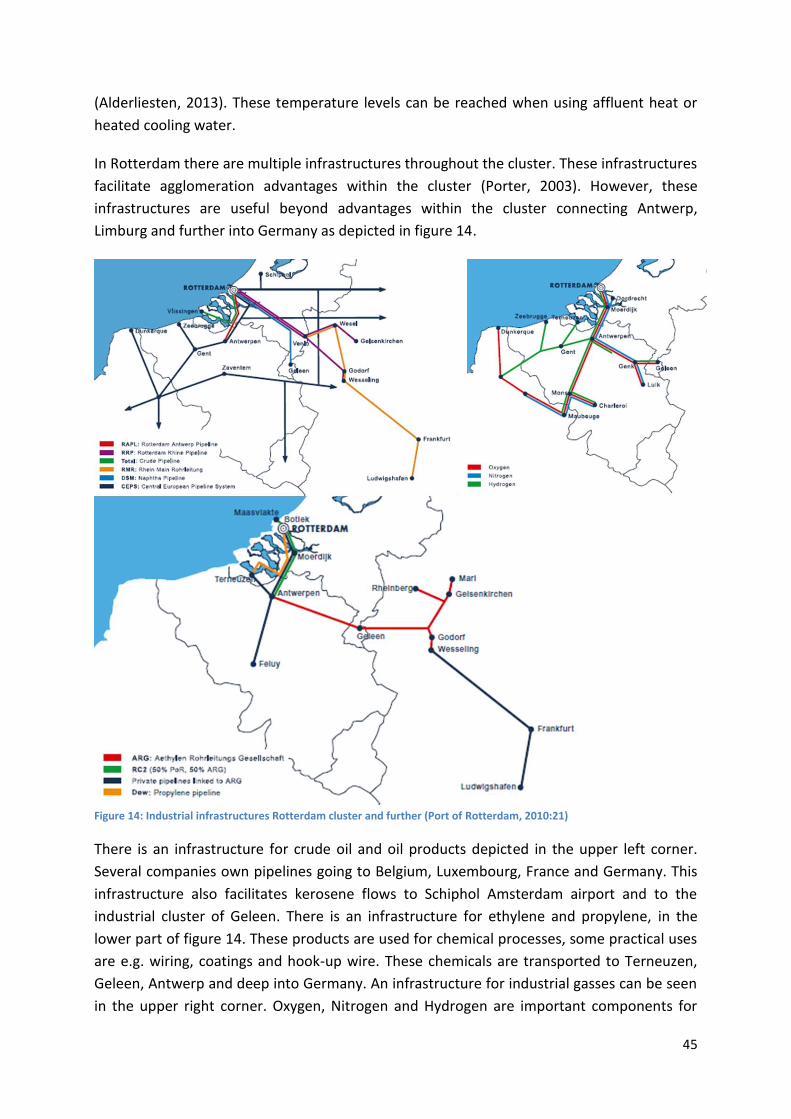
45
(Alderliesten, 2013). These temperature levels can be reached when using affluent heat or
heated cooling water.
In Rotterdam there are multiple infrastructures throughout the cluster. These infrastructures
facilitate agglomeration advantages within the cluster (Porter, 2003). However, these
infrastructures are useful beyond advantages within the cluster connecting Antwerp,
Limburg and further into Germany as depicted in figure 14.
Figure 14: Industrial infrastructures Rotterdam cluster and further (Port of Rotterdam, 2010:21)
There is an infrastructure for crude oil and oil products depicted in the upper left corner.
Several companies own pipelines going to Belgium, Luxembourg, France and Germany. This
infrastructure also facilitates kerosene flows to Schiphol Amsterdam airport and to the
industrial cluster of Geleen. There is an infrastructure for ethylene and propylene, in the
lower part of figure 14. These products are used for chemical processes, some practical uses
are e.g. wiring, coatings and hook-up wire. These chemicals are transported to Terneuzen,
Geleen, Antwerp and deep into Germany. An infrastructure for industrial gasses can be seen
in the upper right corner. Oxygen, Nitrogen and Hydrogen are important components for
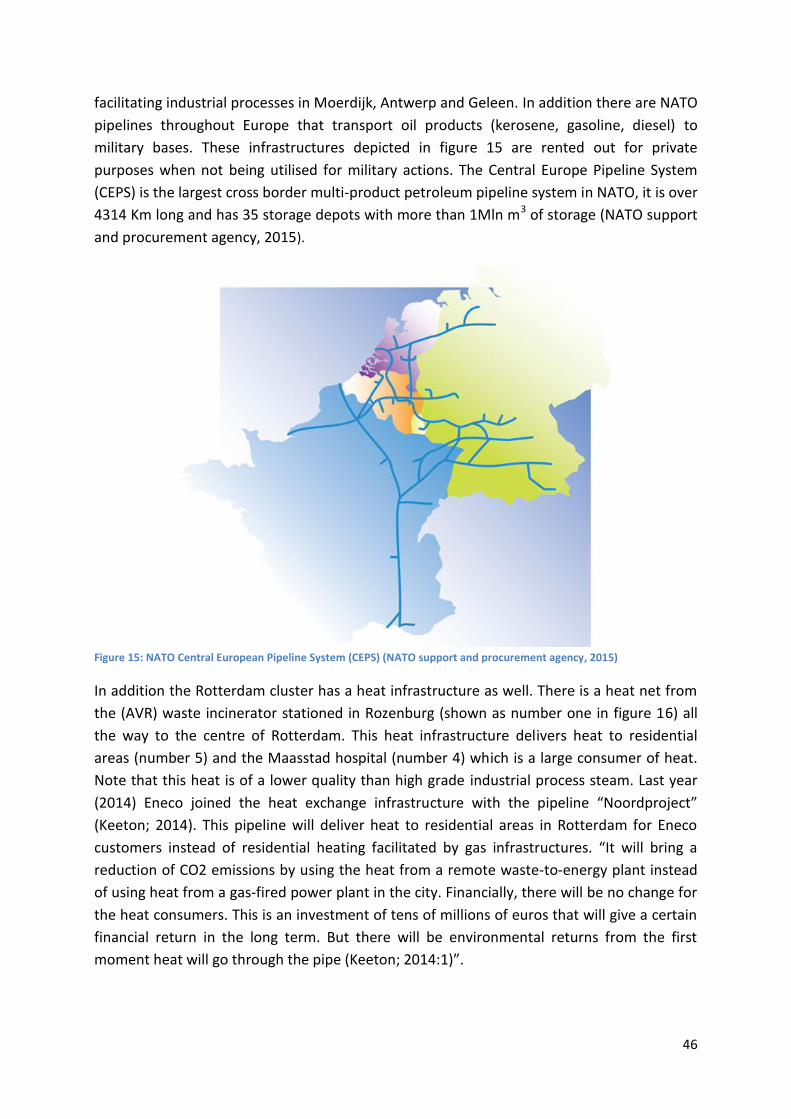
46
facilitating industrial processes in Moerdijk, Antwerp and Geleen. In addition there are NATO
pipelines throughout Europe that transport oil products (kerosene, gasoline, diesel) to
military bases. These infrastructures depicted in figure 15 are rented out for private
purposes when not being utilised for military actions. The Central Europe Pipeline System
(CEPS) is the largest cross border multi-product petroleum pipeline system in NATO, it is over
4314 Km long and has 35 storage depots with more than 1Mln m3 of storage (NATO support
and procurement agency, 2015).
Figure 15: NATO Central European Pipeline System (CEPS) (NATO support and procurement agency, 2015)
In addition the Rotterdam cluster has a heat infrastructure as well. There is a heat net from
the (AVR) waste incinerator stationed in Rozenburg (shown as number one in figure 16) all
the way to the centre of Rotterdam. This heat infrastructure delivers heat to residential
areas (number 5) and the Maasstad hospital (number 4) which is a large consumer of heat.
Note that this heat is of a lower quality than high grade industrial process steam. Last year
(2014) Eneco joined the heat exchange infrastructure with the pipeline “Noordproject”
(Keeton; 2014). This pipeline will deliver heat to residential areas in Rotterdam for Eneco
customers instead of residential heating facilitated by gas infrastructures. “It will bring a
reduction of CO2 emissions by using the heat from a remote waste-to-energy plant instead
of using heat from a gas-fired power plant in the city. Financially, there will be no change for
the heat consumers. This is an investment of tens of millions of euros that will give a certain
financial return in the long term. But there will be environmental returns from the first
moment heat will go through the pipe (Keeton; 2014:1)”.
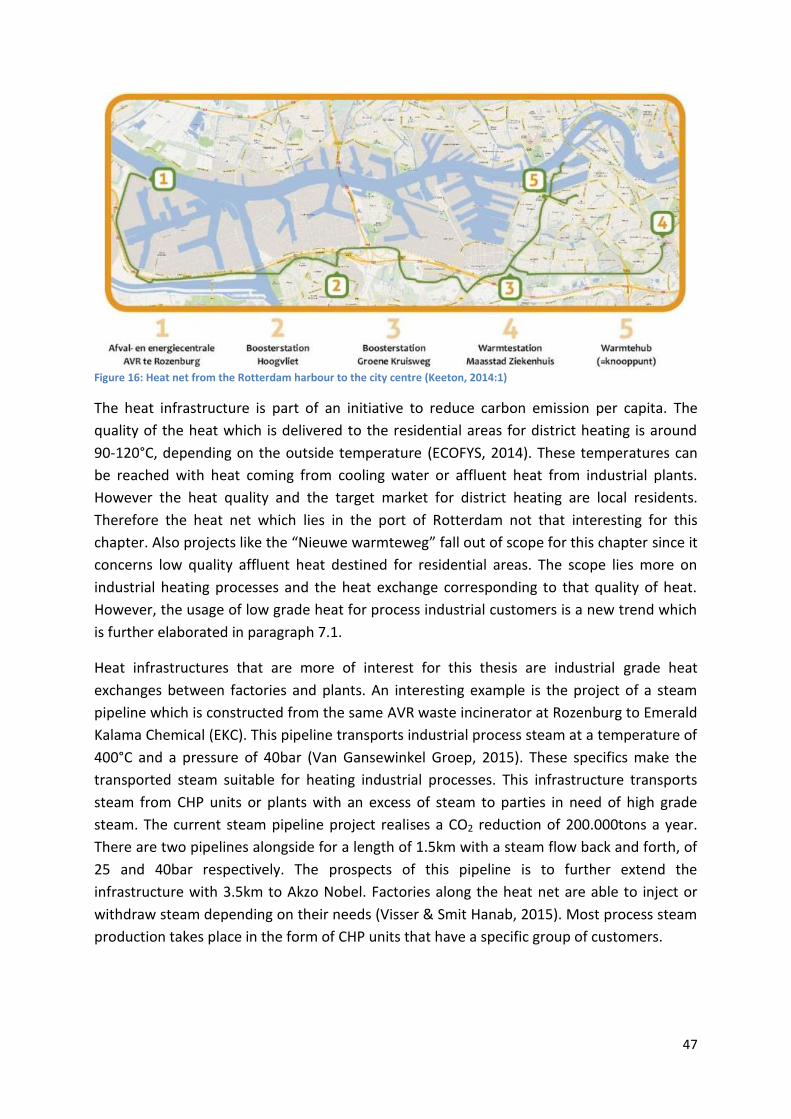
47
Figure 16: Heat net from the Rotterdam harbour to the city centre (Keeton, 2014:1)
The heat infrastructure is part of an initiative to reduce carbon emission per capita. The
quality of the heat which is delivered to the residential areas for district heating is around
90-120°C, depending on the outside temperature (ECOFYS, 2014). These temperatures can
be reached with heat coming from cooling water or affluent heat from industrial plants.
However the heat quality and the target market for district heating are local residents.
Therefore the heat net which lies in the port of Rotterdam not that interesting for this
chapter. Also projects like the “Nieuwe warmteweg” fall out of scope for this chapter since it
concerns low quality affluent heat destined for residential areas. The scope lies more on
industrial heating processes and the heat exchange corresponding to that quality of heat.
However, the usage of low grade heat for process industrial customers is a new trend which
is further elaborated in paragraph 7.1.
Heat infrastructures that are more of interest for this thesis are industrial grade heat
exchanges between factories and plants. An interesting example is the project of a steam
pipeline which is constructed from the same AVR waste incinerator at Rozenburg to Emerald
Kalama Chemical (EKC). This pipeline transports industrial process steam at a temperature of
400°C and a pressure of 40bar (Van Gansewinkel Groep, 2015). These specifics make the
transported steam suitable for heating industrial processes. This infrastructure transports
steam from CHP units or plants with an excess of steam to parties in need of high grade
steam. The current steam pipeline project realises a CO2 reduction of 200.000tons a year.
There are two pipelines alongside for a length of 1.5km with a steam flow back and forth, of
25 and 40bar respectively. The prospects of this pipeline is to further extend the
infrastructure with 3.5km to Akzo Nobel. Factories along the heat net are able to inject or
withdraw steam depending on their needs (Visser & Smit Hanab, 2015). Most process steam
production takes place in the form of CHP units that have a specific group of customers.
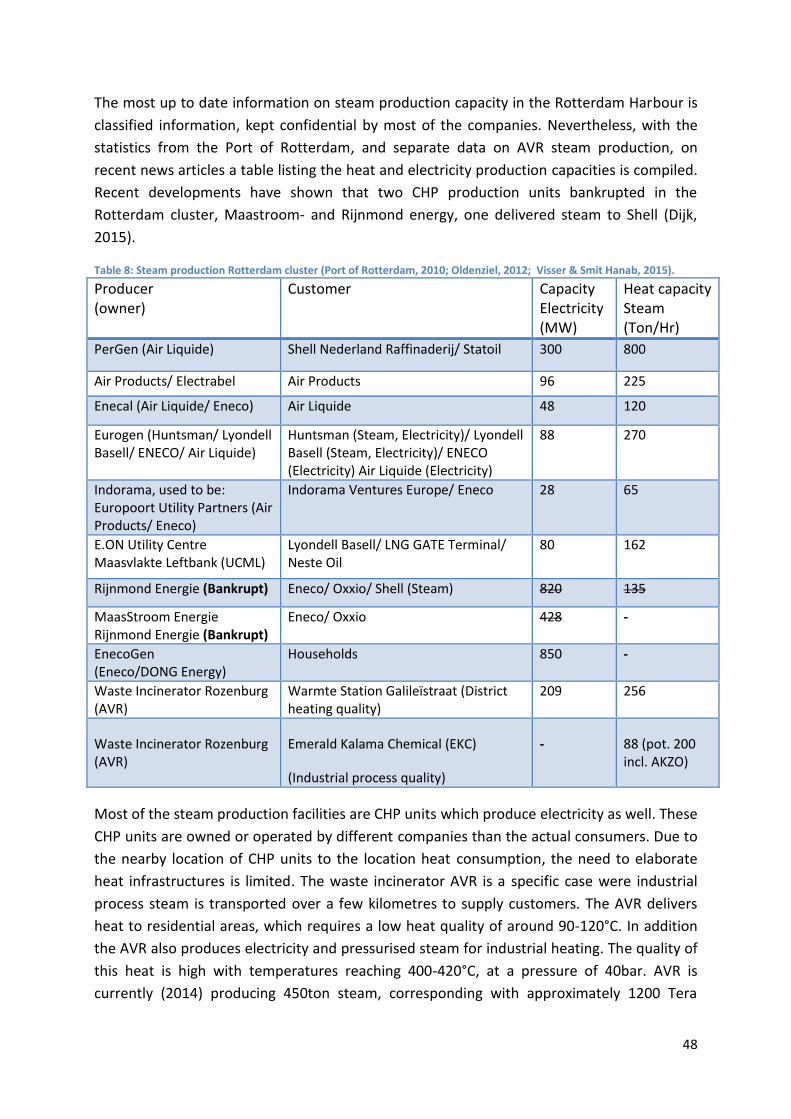
48
The most up to date information on steam production capacity in the Rotterdam Harbour is
classified information, kept confidential by most of the companies. Nevertheless, with the
statistics from the Port of Rotterdam, and separate data on AVR steam production, on
recent news articles a table listing the heat and electricity production capacities is compiled.
Recent developments have shown that two CHP production units bankrupted in the
Rotterdam cluster, Maastroom- and Rijnmond energy, one delivered steam to Shell (Dijk,
2015).
Table 8: Steam production Rotterdam cluster (Port of Rotterdam, 2010; Oldenziel, 2012; Visser & Smit Hanab, 2015).
Producer (owner)
Customer Capacity Electricity (MW)
Heat capacity Steam (Ton/Hr)
PerGen (Air Liquide) Shell Nederland Raffinaderij/ Statoil 300 800
Air Products/ Electrabel Air Products 96 225
Enecal (Air Liquide/ Eneco) Air Liquide 48 120
Eurogen (Huntsman/ Lyondell Basell/ ENECO/ Air Liquide)
Huntsman (Steam, Electricity)/ Lyondell Basell (Steam, Electricity)/ ENECO (Electricity) Air Liquide (Electricity)
88 270
Indorama, used to be: Europoort Utility Partners (Air Products/ Eneco)
Indorama Ventures Europe/ Eneco 28 65
E.ON Utility Centre Maasvlakte Leftbank (UCML)
Lyondell Basell/ LNG GATE Terminal/ Neste Oil
80 162
Rijnmond Energie (Bankrupt) Eneco/ Oxxio/ Shell (Steam) 820 135
MaasStroom Energie Rijnmond Energie (Bankrupt)
Eneco/ Oxxio 428 -
EnecoGen (Eneco/DONG Energy)
Households 850 -
Waste Incinerator Rozenburg (AVR)
Warmte Station Galileïstraat (District heating quality)
209 256
Waste Incinerator Rozenburg (AVR)
Emerald Kalama Chemical (EKC)
(Industrial process quality)
- 88 (pot. 200 incl. AKZO)
Most of the steam production facilities are CHP units which produce electricity as well. These
CHP units are owned or operated by different companies than the actual consumers. Due to
the nearby location of CHP units to the location heat consumption, the need to elaborate
heat infrastructures is limited. The waste incinerator AVR is a specific case were industrial
process steam is transported over a few kilometres to supply customers. The AVR delivers
heat to residential areas, which requires a low heat quality of around 90-120°C. In addition
the AVR also produces electricity and pressurised steam for industrial heating. The quality of
this heat is high with temperatures reaching 400-420°C, at a pressure of 40bar. AVR is
currently (2014) producing 450ton steam, corresponding with approximately 1200 Tera
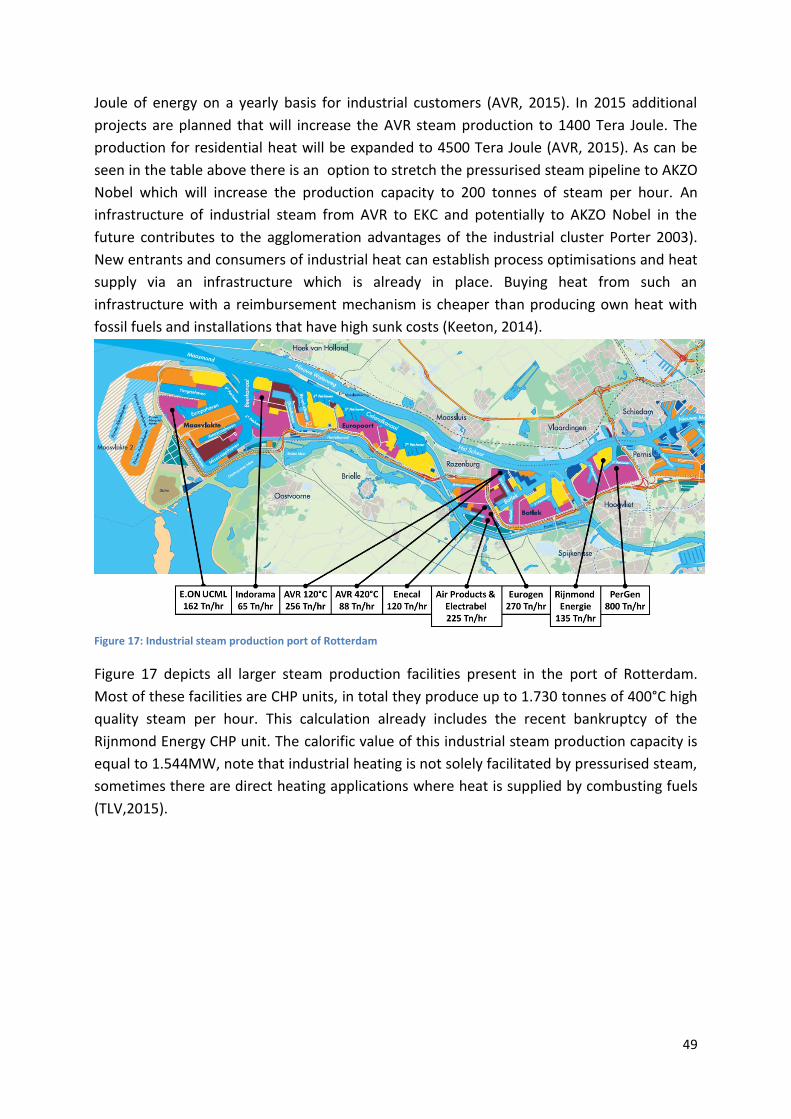
49
Joule of energy on a yearly basis for industrial customers (AVR, 2015). In 2015 additional
projects are planned that will increase the AVR steam production to 1400 Tera Joule. The
production for residential heat will be expanded to 4500 Tera Joule (AVR, 2015). As can be
seen in the table above there is an option to stretch the pressurised steam pipeline to AKZO
Nobel which will increase the production capacity to 200 tonnes of steam per hour. An
infrastructure of industrial steam from AVR to EKC and potentially to AKZO Nobel in the
future contributes to the agglomeration advantages of the industrial cluster Porter 2003).
New entrants and consumers of industrial heat can establish process optimisations and heat
supply via an infrastructure which is already in place. Buying heat from such an
infrastructure with a reimbursement mechanism is cheaper than producing own heat with
fossil fuels and installations that have high sunk costs (Keeton, 2014).
Figure 17: Industrial steam production port of Rotterdam
Figure 17 depicts all larger steam production facilities present in the port of Rotterdam.
Most of these facilities are CHP units, in total they produce up to 1.730 tonnes of 400°C high
quality steam per hour. This calculation already includes the recent bankruptcy of the
Rijnmond Energy CHP unit. The calorific value of this industrial steam production capacity is
equal to 1.544MW, note that industrial heating is not solely facilitated by pressurised steam,
sometimes there are direct heating applications where heat is supplied by combusting fuels
(TLV,2015).
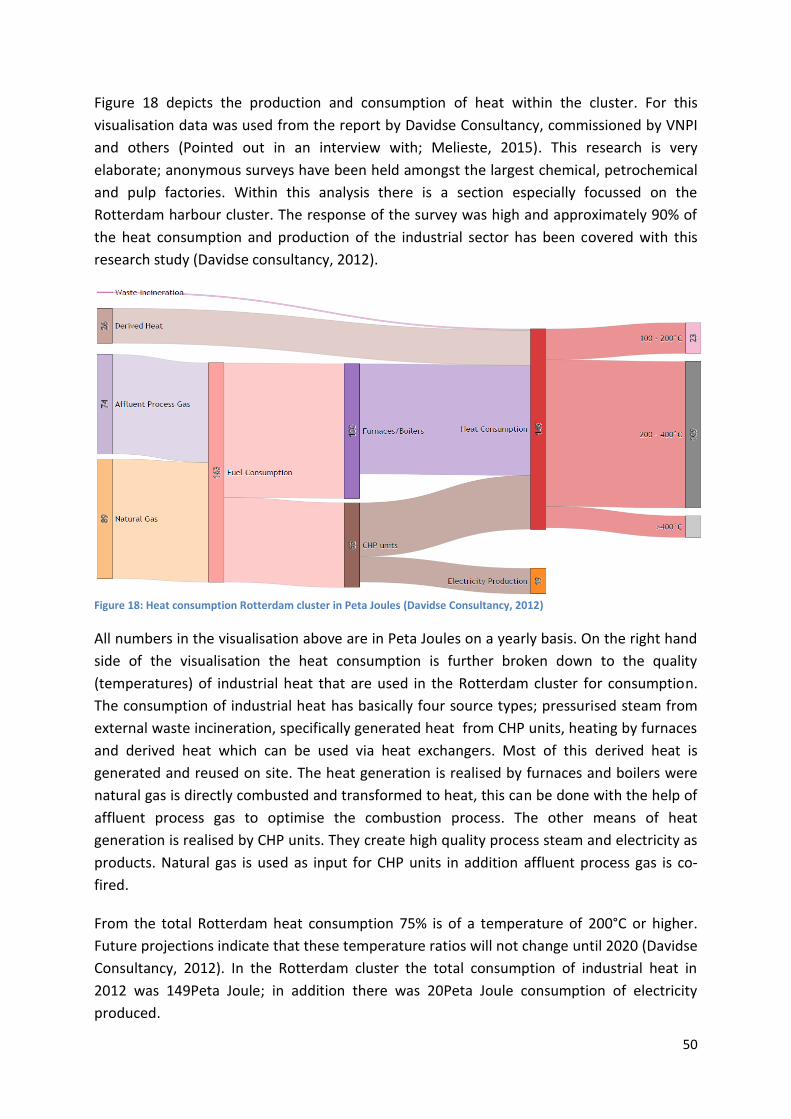
50
Figure 18 depicts the production and consumption of heat within the cluster. For this
visualisation data was used from the report by Davidse Consultancy, commissioned by VNPI
and others (Pointed out in an interview with; Melieste, 2015). This research is very
elaborate; anonymous surveys have been held amongst the largest chemical, petrochemical
and pulp factories. Within this analysis there is a section especially focussed on the
Rotterdam harbour cluster. The response of the survey was high and approximately 90% of
the heat consumption and production of the industrial sector has been covered with this
research study (Davidse consultancy, 2012).
Figure 18: Heat consumption Rotterdam cluster in Peta Joules (Davidse Consultancy, 2012)
All numbers in the visualisation above are in Peta Joules on a yearly basis. On the right hand
side of the visualisation the heat consumption is further broken down to the quality
(temperatures) of industrial heat that are used in the Rotterdam cluster for consumption.
The consumption of industrial heat has basically four source types; pressurised steam from
external waste incineration, specifically generated heat from CHP units, heating by furnaces
and derived heat which can be used via heat exchangers. Most of this derived heat is
generated and reused on site. The heat generation is realised by furnaces and boilers were
natural gas is directly combusted and transformed to heat, this can be done with the help of
affluent process gas to optimise the combustion process. The other means of heat
generation is realised by CHP units. They create high quality process steam and electricity as
products. Natural gas is used as input for CHP units in addition affluent process gas is co-
fired.
From the total Rotterdam heat consumption 75% is of a temperature of 200°C or higher.
Future projections indicate that these temperature ratios will not change until 2020 (Davidse
Consultancy, 2012). In the Rotterdam cluster the total consumption of industrial heat in
2012 was 149Peta Joule; in addition there was 20Peta Joule consumption of electricity
produced.
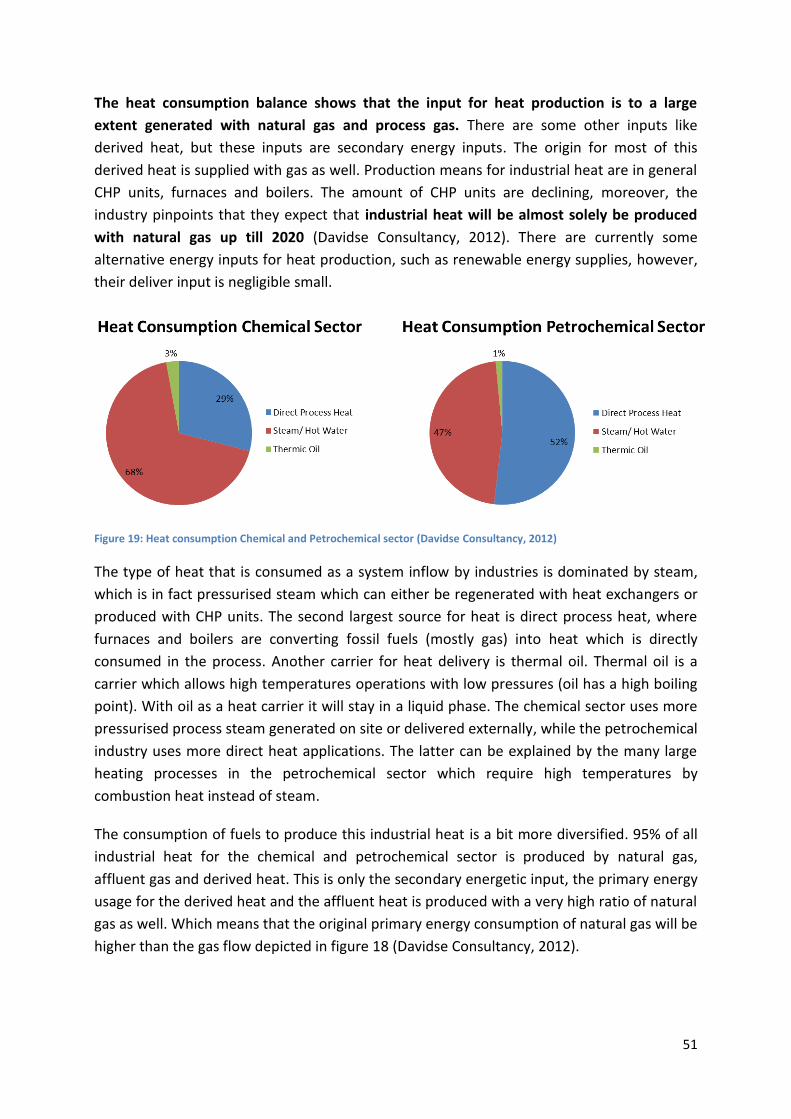
51
The heat consumption balance shows that the input for heat production is to a large
extent generated with natural gas and process gas. There are some other inputs like
derived heat, but these inputs are secondary energy inputs. The origin for most of this
derived heat is supplied with gas as well. Production means for industrial heat are in general
CHP units, furnaces and boilers. The amount of CHP units are declining, moreover, the
industry pinpoints that they expect that industrial heat will be almost solely be produced
with natural gas up till 2020 (Davidse Consultancy, 2012). There are currently some
alternative energy inputs for heat production, such as renewable energy supplies, however,
their deliver input is negligible small.
Figure 19: Heat consumption Chemical and Petrochemical sector (Davidse Consultancy, 2012)
The type of heat that is consumed as a system inflow by industries is dominated by steam,
which is in fact pressurised steam which can either be regenerated with heat exchangers or
produced with CHP units. The second largest source for heat is direct process heat, where
furnaces and boilers are converting fossil fuels (mostly gas) into heat which is directly
consumed in the process. Another carrier for heat delivery is thermal oil. Thermal oil is a
carrier which allows high temperatures operations with low pressures (oil has a high boiling
point). With oil as a heat carrier it will stay in a liquid phase. The chemical sector uses more
pressurised process steam generated on site or delivered externally, while the petrochemical
industry uses more direct heat applications. The latter can be explained by the many large
heating processes in the petrochemical sector which require high temperatures by
combustion heat instead of steam.
The consumption of fuels to produce this industrial heat is a bit more diversified. 95% of all
industrial heat for the chemical and petrochemical sector is produced by natural gas,
affluent gas and derived heat. This is only the secondary energetic input, the primary energy
usage for the derived heat and the affluent heat is produced with a very high ratio of natural
gas as well. Which means that the original primary energy consumption of natural gas will be
higher than the gas flow depicted in figure 18 (Davidse Consultancy, 2012).
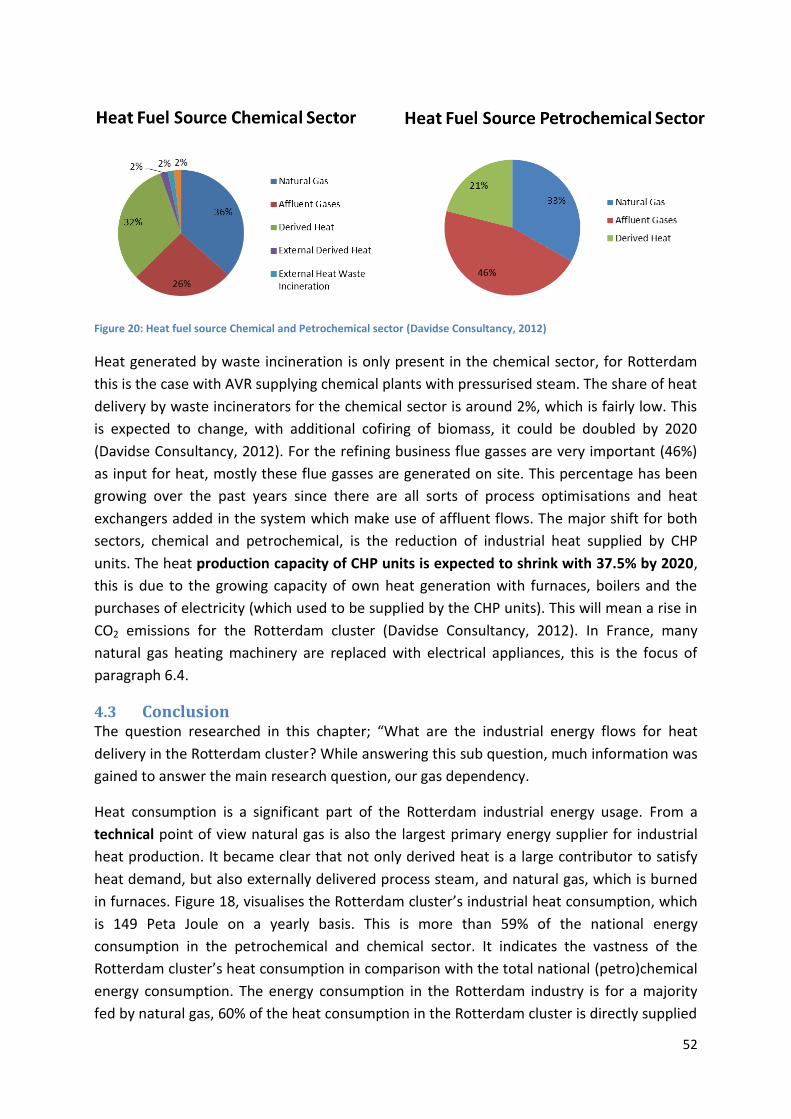
52
Figure 20: Heat fuel source Chemical and Petrochemical sector (Davidse Consultancy, 2012)
Heat generated by waste incineration is only present in the chemical sector, for Rotterdam
this is the case with AVR supplying chemical plants with pressurised steam. The share of heat
delivery by waste incinerators for the chemical sector is around 2%, which is fairly low. This
is expected to change, with additional cofiring of biomass, it could be doubled by 2020
(Davidse Consultancy, 2012). For the refining business flue gasses are very important (46%)
as input for heat, mostly these flue gasses are generated on site. This percentage has been
growing over the past years since there are all sorts of process optimisations and heat
exchangers added in the system which make use of affluent flows. The major shift for both
sectors, chemical and petrochemical, is the reduction of industrial heat supplied by CHP
units. The heat production capacity of CHP units is expected to shrink with 37.5% by 2020,
this is due to the growing capacity of own heat generation with furnaces, boilers and the
purchases of electricity (which used to be supplied by the CHP units). This will mean a rise in
CO2 emissions for the Rotterdam cluster (Davidse Consultancy, 2012). In France, many
natural gas heating machinery are replaced with electrical appliances, this is the focus of
paragraph 6.4.
4.3 Conclusion The question researched in this chapter; “What are the industrial energy flows for heat
delivery in the Rotterdam cluster? While answering this sub question, much information was
gained to answer the main research question, our gas dependency.
Heat consumption is a significant part of the Rotterdam industrial energy usage. From a
technical point of view natural gas is also the largest primary energy supplier for industrial
heat production. It became clear that not only derived heat is a large contributor to satisfy
heat demand, but also externally delivered process steam, and natural gas, which is burned
in furnaces. Figure 18, visualises the Rotterdam cluster’s industrial heat consumption, which
is 149 Peta Joule on a yearly basis. This is more than 59% of the national energy
consumption in the petrochemical and chemical sector. It indicates the vastness of the
Rotterdam cluster’s heat consumption in comparison with the total national (petro)chemical
energy consumption. The energy consumption in the Rotterdam industry is for a majority
fed by natural gas, 60% of the heat consumption in the Rotterdam cluster is directly supplied
53
with natural gas combustion in furnaces and CHP units. Process gasses and derived heat are
an input for industrial heat as well. Therefore, indirectly, the primary consumption of natural
gas will result in an even higher contribution to industrial heating in the Rotterdam cluster.
The Rotterdam cluster is driven by heat, which in turn is mostly generated with natural gas.
The secondary energy consumption of natural gas in the Rotterdam cluster is 89Peta Joule,
this corresponds with 2.53 Billion cubic meters of natural gas (Gasunie, 2015b). Which is
5.7% of our national natural gas consumption. The share of gas consumed in the Rotterdam
cluster is not only high in comparison with national gas consumption, the heat production in
the cluster is also almost solely dependent on natural gas.
The 149 Peta Joule of industrial heat consumption for the Rotterdam cluster is a very large
proportion of the total Dutch energy consumption for the chemical and petrochemical
sector. Natural gas is in its turn the largest energy supplier for industrial heat production.
Comparing this annual consumption of 149 Peta Joule, the total Rotterdam industrial heat
consumption is comparable with 11.500MW of electricity production capacity, which needs
to be operated 24h a day for the whole year.1 That’s comparable to roughly 37% of the total
Dutch installed electricity production capacity (30.725MW) (Tennet, 2015a).
On a side note, the mapping of industrial heat flows throughout the Rotterdam cluster is not
just based on pure capacities and technical specifications. There are also economic and
institutional factors that play a role with the gas intensity of the cluster. The interaction
between actors play a significant role in supplying heat for the cluster. Table 8 shows a
variety of CHP unit projects that are established with multiple owners and heat consuming
companies. These interactions are crucial for the established heat production capacity. The
CHP production capacity in the Rotterdam cluster is expected to shrink with 37.5% by 2020
(Davidse consultancy, 2012). This is a result of structural low electricity prices and low profit
margins (spark spread) due to overcapacity in the Dutch utility sector. Recent developments
have shown that two CHP production units bankrupted in the Rotterdam cluster,
Maastroom- and Rijnmond energy, one delivered steam to Shell (Dijk, 2015). The
interconnection to industrial processes induces the dependency on a CHP unit. For some of
the CHP units the core reason for existence is the contractual obligation to deliver heat.
Companies with a large industrial heat demand could switch to own heat production by
furnace or kettle when such bilateral contracts expire (Kleisterlee, 2015 interview). This is
exactly describing the situation with Rijnmond Energy (Dijk, 2015). The demand for industrial
heat will not decrease when (petro)chemical processes stay operational, on the other hand,
the CHP capacity will reduce. A different heat production and consumption balance sheet for
the cluster can be expected, therefore the production portfolio could change significantly.
The question arises if this will be realised with natural gas or with potential other energy
supply sources. This will be researched in chapter 6, analysing several alternatives for
industrial heating.
1 149 PJ/year of total delivered heat after losses can be converted to electric production capacity in MW (MJ/s)
54
Chapter 5: Gas fed industrial conversion
processes in the Rotterdam cluster
What are important industrial conversion processes fed with natural gas in the Rotterdam
cluster? This sub question is very specific, in order to get hold of the gas flows through the
cluster, gas for chemical and petrochemical conversion needs to be taken into account as
well. In chapter four gas for industrial heating purposes was analysed, this chapter will focus
on the molecular value of gas. In this case gas is used as a feedstock instead of a fuel for
combustion. Paragraph 5.1 will focus on important products that are converted out of
natural gas and Natural Gas Liquids (NGLs). Paragraph 5.2 will list the chemical and
petrochemical products that are produced in the Rotterdam cluster which use gas as a
feedstock. Paragraph 5.3 will summarise the gas intensity for the Rotterdam cluster on the
aspect of the gas consumption for conversion.
5.1 Natural gas and NGLs conversion The chemicals and petrochemicals that can be produced out of natural gas and crude oil are
very diverse (see figure 21). The focus of this thesis are the chemical and petrochemical
industries that use natural gas as feedstock. Natural gas can be split up in Natural Gas Liquids
(NGLs) and methane. In addition there are associated gasses which are by-products to crude
oil refining such as ethane, LPG and Methane.
These gases in combination with others, are used to make very important base ingredients
for the chemical and petrochemical industry. Main base chemicals of this sector are:
Ethylene, Propylene, the C4-stream, Pygas, Methanol, Benzene, Toluene and Xylenes. The
first five basic chemicals use many gas components as feedstock (Petrochemicals Europe,
2015). Figure 21 shows the flowchart for natural gas and crude oil to all sorts of chemical
and petrochemical end-products. This graph presents rough feedstock, chemical base
ingredients, a variety of (petro)chemical end products and appliances of these substances on
top of the graph. In appendix IV the flowchart is depicted on a larger scale divided over two
pages.
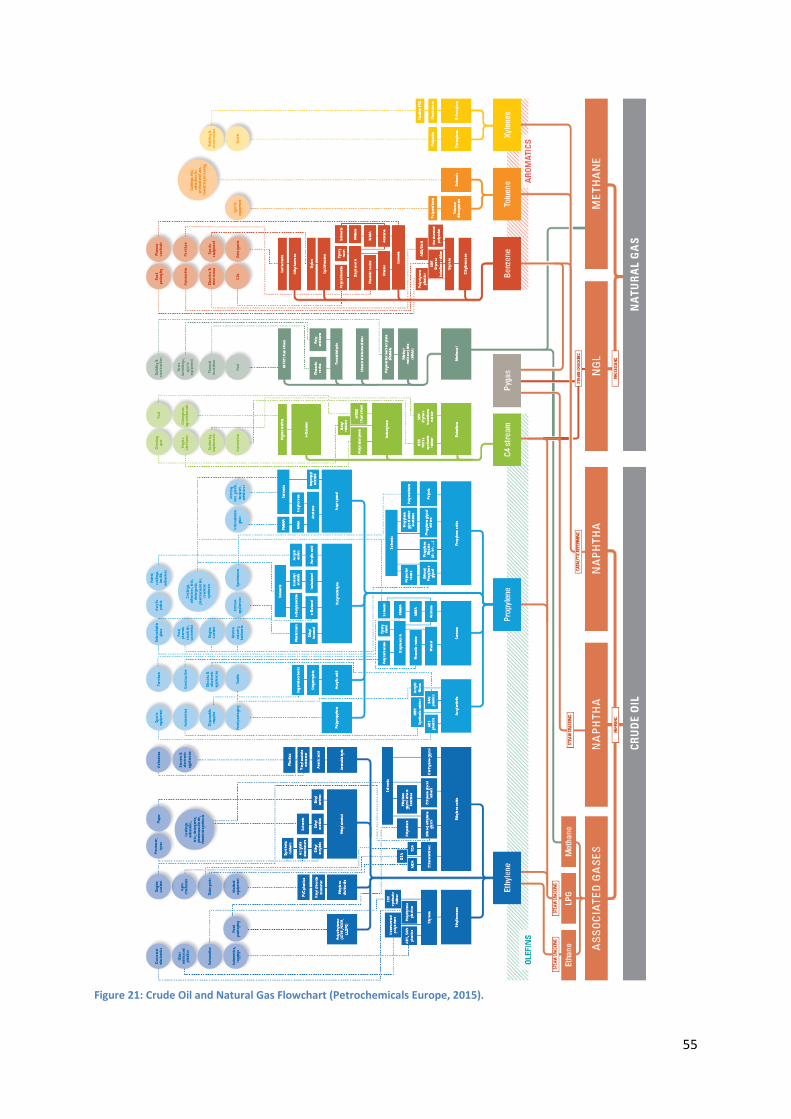
55
Figure 21: Crude Oil and Natural Gas Flowchart (Petrochemicals Europe, 2015).
56
These (petro)chemicals are used to produce a variety of end-products which are consumed
in daily by end-consumers. This can vary from plastics and coatings to papers, paints and
textiles. Daily appliances and (petro)chemical end-products are visualised in the upper part
of the figure. The lower section, crude oil and natural gas, is further divided into fuel
categories such as; ethane, methane, LPG, NGL’s and Naphtha. One layer higher in the graph
shows all the streams that are basically categorized by the number of carbon atoms
(C2,C3,C4 etc.). Products in these five categories can be produced by a variety of reaction
and separation technologies. The main message from this visualisation is the direct link
between the complete Methanol product branch and natural gas (methane).
For this study the sort of chemicals that are produced and their gas intensity are of particular
interest. The intensity of gas as a feedstock for the production of these chemicals is analysed
in the next two paragraphs.
5.2 Gas feedstock processes Rotterdam cluster The statistical reports by the Port of Rotterdam provide insight in the chemicals produced in
the harbour, sorted by location and company (Port of Rotterdam, 2010). By searching for all
these chemicals how gas-intensive their production process are, the conversion aspect of gas
can be mapped. The tables on the produced (petro)chemicals in the Rotterdam cluster are
listed in appendix V. A column is added to the table in the appendix with the source
carbohydrates used producing these chemicals. These base-chemical components are
required to produce the (petro)chemical products. The base chemicals; Ethylene, Propylene,
the C4-stream, Pygas, Methanol, Benzene, Toluene and Xylenes are important to feed the
production processes of the (petro)chemicals listed in appendix V. In order to link all the
(petro)chemicals to the rate of gas consumption, the gas intensity of the base chemical
components are mapped.
Figure 21 shows that the downstream of all these chemicals production processes are
supplied with the main chemical components. If all products from appendix V are all
analysed for their gas intensity including the basic chemical components there will be an
overestimation of all the gas used for conversion. The gas for conversion as feedstock would
be calculated twice, direct via the end-product gas intensity and indirectly via the gas
intensity of the basic chemical components producing these end-products.
The pure form of for instance ethylene and propylene can be imported via pipeline
infrastructures. In this case there is assumed that all demand for these main chemical
components are fulfilled by own production in the cluster. However surpluses can be
exported via the infrastructure of chemical products through the ARA cluster (figure 14). This
is due to limited data available on the absolute numbers of total import or export of these
main chemical components to and from the Rotterdam cluster. When all main chemical
components produced in the Rotterdam cluster are checked for their gas intensity, the gas
used as feedstock is covered for own consumption and the export of chemical products.

57
Appendix V contains interesting data on the production of main chemicals for feedstock in
the cluster. It appears that only a few companies throughout the whole Rotterdam cluster
produce base chemicals in large quantities. The companies producing these main chemical
ingredients form an oligopolistic structure. The companies Shell Nederland Chemie together
with ExxonMobil Chemical are the biggest in this market, in addition BP and Lyondell
Chemical are also important. Those four companies are the only suppliers of the main
chemical feedstocks, supplying the chemical sector.
Table 9: Important main chemical products Rotterdam cluster (Port of Rotterdam, 2010)
Company Main chemicals [Tonne/year]
Shell Nederland Chemie Propylene 330.000
(Pernis) 1-Butene 60.000
ExxonMobil Chemical Benzene 750.000
Ortho xylene 130.000
Para xylene 690.000
Lyondell Chemical Isobutylene 100.000
Basell Polyolefins Polybutene 40.000
BP Propylene 125.000
Shell Nederland Chemie Ethylene 900.000
(Moerdijk) Propylene 500.000
Butadiene 115.000
Benzene 500.000
Ethylene oxide 305.000
Ethylbenzene 640.000
Ethylene glycol 155.000
Propylene oxide 210.000
Table 9 shows that the supply portfolio of companies delivering these main chemical
ingredients is not very diversified. All in all it means that five companies facilitate the further
downstream of chemical products for the rest of the cluster.
The production of 900.000 tonnes ethylene a year by Shell Nederland Chemie has an
equivalent of 1.029.305 tonnes of methane by the oxidative coupling method (Zhang, 2013).
These tonnes of natural gas resembles slightly more than 1,5Bcm (more than 3% of yearly
national gas consumption). Ethylene is produced by cracking naphtha in the Rotterdam
cluster and not by partial oxidation of methane. (Dijkema, 2012). Therefore this equivalent is
not more than an equivalent for comparison reasons.
Researching the gas intensity of the chemical cluster with this method leads to some serious
barriers. Each of these base chemicals can be produced via all sorts of chemical conversions
processes. Take for instance propane, this could be just a by-product when processing
natural gas and Natural Gas Liquids (NGLs). However, propene could also be produced by
steam cracking naphtha, in this case larger hydrocarbons are cracked to smaller molecules
that are more in demand (Melieste, 2015 interview).
58
Other main chemicals such as methanol could be produced out of syngas instead of
methane. Moreover this methanol can be used to produce for instance ethylene and
propylene. In this way the main chemical substances can be used to produce the properties
of each other. Therefore it is not unambiguously possible to say which main chemical
products in the Rotterdam cluster are produced with a certain process or feedstock, let
alone to assess how much gas is consumed for the production. It is known that in western
Europe, the United States and Japan most of the chemical base products are realised by
steam cracking larger hydrocarbons (Dijkema, 2012).
Information related to these type of production processes and interconnected chemical
flows is in most of the cases classified information. On top of that the chemical production
capacities from the port statistics are a bit outdated (2010). Fortunately chemical and
petrochemical facilities are long term oriented projects with high sunk costs. Therefore large
modification and changes are not occurring often. However there are new facilities and
capacities that are constructed, also in the last 5 years. For example Air Liquide constructed
a new plant which was delivered in 2011. This is not included into the statistics report from
the Port of Rotterdam. This plant produces 130.000 normal cubic meter of hydrogen an
hour, this production process is highly methane intensive (Rotterdam Climate Initiative,
2011). These production processes can be added to the table of the port statistics. However
the proportions of chemical conversion in the Rotterdam cluster are still classified, which
makes calculations on gas intensity not achievable.
5.3 Conclusion The sub question which is researched in this chapter was: “What are important industrial
conversion processes fed with natural gas in the Rotterdam cluster?” Answering this
question was difficult, there are multiple barriers that obstruct the progress of this analysis.
First of all the data which is publicly available is scarce. Any specific details on the production
of chemicals and feedstock specifications are classified information. Then there is the
problem that the available data is outdated.
To get some technical understanding which chemical conversion processes are gas intensive,
base (petro)chemistry flows were analysed. From crude oil and natural gas a variety of
chemical products are manufactured, this of course indirectly. In this chapter a distinction
has been made for the main chemical ingredients that in its turn are used for further
chemical conversion. However when analysing the gas intensity of these main chemical
components there is yet another difficulty. The production of the main chemical
components can be realised via multiple production processes. Alternative processes such as
steam cracking of larger hydrocarbons, or treating natural gas and NGLs can result in the
same products. Therefore it is not easy to assess how gas intensive different chemicals
produced in the Rotterdam cluster are. It is even technically possible to make base chemicals
from other base chemical components.
59
From an economic perspective there are some interesting aspects as well. The companies
producing these main chemical ingredients form an oligopolistic structure. The companies
Shell Nederland Chemie, ExxonMobil Chemical are the biggest in this market model. There
are four companies in total that are the sole producers of the main chemical feedstock.
Another interesting aspect of this research question is the proportions, if we look at one
simple production process of Shell. The production of 900.000 tonnes ethylene annually has
a natural gas equivalent of 1,5Bcm. This is just a comparison to get an understanding on
proportions, in the Rotterdam cluster ethylene is produced by steam cracking naphtha
(Dijkema, 2012). The gasses used for conversion in the Rotterdam cluster are hard to map,
but they are significant.
Institutionally seen, four large companies supplying the main chemical ingredients creates a
rather dependent position. Shell Chemie Nederland and ExxonMobil Chemical are the largest
players, keeping up the whole chemical and petrochemical industry in the Rotterdam cluster
and beyond. This is an interesting market model since the continuation of these few
companies is critical for the existence of the companies on surrounding on the demand side.
The production and supply of chemicals and chemical base products are most likely arranged
with long term contracts and supply obligations as well since there are many large
investments and high sunk-costs. There are option for chemical product imports since the
Rotterdam cluster is port based and there are infrastructures to the chemical clusters of
Antwerp and Germany that facilitate interconnection. The alternative is importing chemicals,
which probably would drive prices up structurally.
There was a need to fall back on the national data to answer this chapter’s research question
in a valid way. This data is available by the Eurostat database up till the year 2013. The gas
which is consumed for its energetic purpose in the Dutch industrial sector is 226.646 Tera
joule, this is merely used for combustion and industrial heating. The gas which is used as
feedstock (non-energy consumption) in the Dutch industry is 81.930 Tera joule (Eurostat,
2015). This means that from all consumed gas in the Dutch industry 27% is used as
feedstock for conversion in (petro)chemical processes. This figure is representative for the
industrial cluster of Rotterdam since the type of chemical processes converting natural gas in
for instance Geleen are not that different from Rotterdam. In addition the market share of
the Rotterdam cluster is dominant in the Dutch (petro)chemical sector. Therefore an answer
on this sub question is that the natural gas which is used for conversion in the Rotterdam is
significant and will be approximately a quarter of all the gas that is consumed in the cluster.

60
Chapter 6: Other means to fulfil Dutch industrial
energy needs
This chapter will be centred around the following research question: How can the industrial
heating demand of the cluster be fulfilled by other means? The answer on this question can
be very extensive, when all sort of energy carriers and production technologies are taken
into account. For the case of the industrial heating demand in the Rotterdam cluster this
scope will be narrowed down. Only if there is a potential energy source or technology for
industrial heating in the Rotterdam cluster it will be assessed. When applying the selection
criteria of research question one, the Multi Criteria Analysis (MCA), the scope of this
research question will be more focussed. Alternative technologies for industrial heating will
be sought in literature which relate case specific to the Netherlands. In addition other
industrial clusters (located in other countries) will be used as example when possible for
their industrial heating means. These industrial energy supply sources will be compared for
applicability in a Dutch case with their advantages and disadvantages. Importing natural gas
would be sufficient satisfying the needs for industrial heating. The selected technologies
assessed in this chapter are substitutes for industrial heating with natural gas.
6.1 Alternative industrial heating introduction
There are multiple criteria for an ideal energy source in industrial clusters. The criteria which
are established in Q1 will be used as a directory answering this research question. The
criteria is shown in table 10.
Table 10: Criteria for energy supply source assessment
Criteria for heat source Operational unit […]
Capacity - peak - fluctuation changes
Energy flow [J/hour] Ramp-up & Ramp-down time [minutes]
Reliability - operational Disturbances [#/year] or downtime [minutes]
Availability - future supply - supply
Availability of energy source [J] Delivery time of energy source [days]
Infrastructure - distance - operational
Travel distance [km] Temp [°C] & Pressure [bar]
Quality - exergy - pollution
Carnot efficiency [ɳ] GHG emission [Ton GHG/Mj]
Costs - operational - investment - maintenance
Cost price of fuel [€/J] Capacity investment [€/MW] Maintenance cost [€/year]
For further explanation of the criteria see paragraph 3.1. The variability is incorporated
under the category of capacity changes, and the storability in taken into account in
combination with availability. This table enables comparing alternative technologies with
one another. It has yet to be found out if for each available or potential technology there will

61
be sufficient data available at the operational level. Not all attractive technologies are
proven or have track record in the Netherlands let alone within the Rotterdam cluster.
Therefore a qualitative assessment based on these criteria will be the case for some
alternatives. Each alternative for industrial heating from the selection besides or in
combination with natural gas will be described per paragraph. The structure of each
paragraph will be as follows. A description of the technology, the assessment via a Multi
Criteria Analysis. In addition there will be examples supplied when possible of appliances
with this specific technique in other industrial clusters worldwide. The number of
technologies that will be covered in this chapter for industrial heating are limited. There are
many energy sources that could be assessed for industrial heat production. The range of
means can stretch from coal gasification to palm oil or solar power. The list of energy
sources is very long. The chapter of this thesis is based on a selection for just a few
alternatives selected by their potential due to scope limitations. The focus lies on the
indicated potential technologies for Dutch industrial heating as described in the
“Warmtevisie” by the minister of Economic affairs. The main pillars for industrial heating are
deep geothermal energy recovery and biomass energy (fermentation and combustion)
production (Kamp, 2015). As an addition electrification of industrial heating will be
investigated in this chapter.
6.2 Biomass and industrial heating
Biomass can be used in a variety of processes in the industrial sector. There is thermic
combustion of pulp which can be (co)combusted in power plants or waste incinerators. In
addition there is biomass conversion into green gas (upgraded biogas) by fermentation. The
feedstock of biomass input differs widely. The term biomass is a collective name for all
organic substances that can potentially be used for thermic production or chemical products.
There are two main types of biomass; dried crops, such as sugarcane, corn and grasses, the
other type is wet crops such as seaweed, algae, aquatic plants and manure. In some
situations biomass is in direct competition with food production. Directly if dry cultivation is
used as biomass, this is called the primary production of biomass. Then there is secondary
production, where indirectly biomass is produced from the residuals of crops during
processing. In addition there is also a tertiary supply of biomass which is biomass available
detached from production, such as; pruning waste, manure and slaughterhouse residuals.
Primary biomass is the type which is used the most as feedstock, this is also named
“dedicated crops” (Krebbekx, et al., 2010).
There are several technologies to process the types of biomass described above, some of
these technologies are still in the development phase. Basically there are three main
pathways to deal with biomass. Bio-refining, which is in fact the process where the valuable
parts of organic material are being separated and used. A second technology is the
fermentation of biomass which result in biogas. This fermentation process is facilitated by
micro-organisms. A third option is conversion of biomass at high temperatures. This can be
done by pyrolysis (or torrefaction), gasification and combustion (Krebbekx, et al., 2010). For
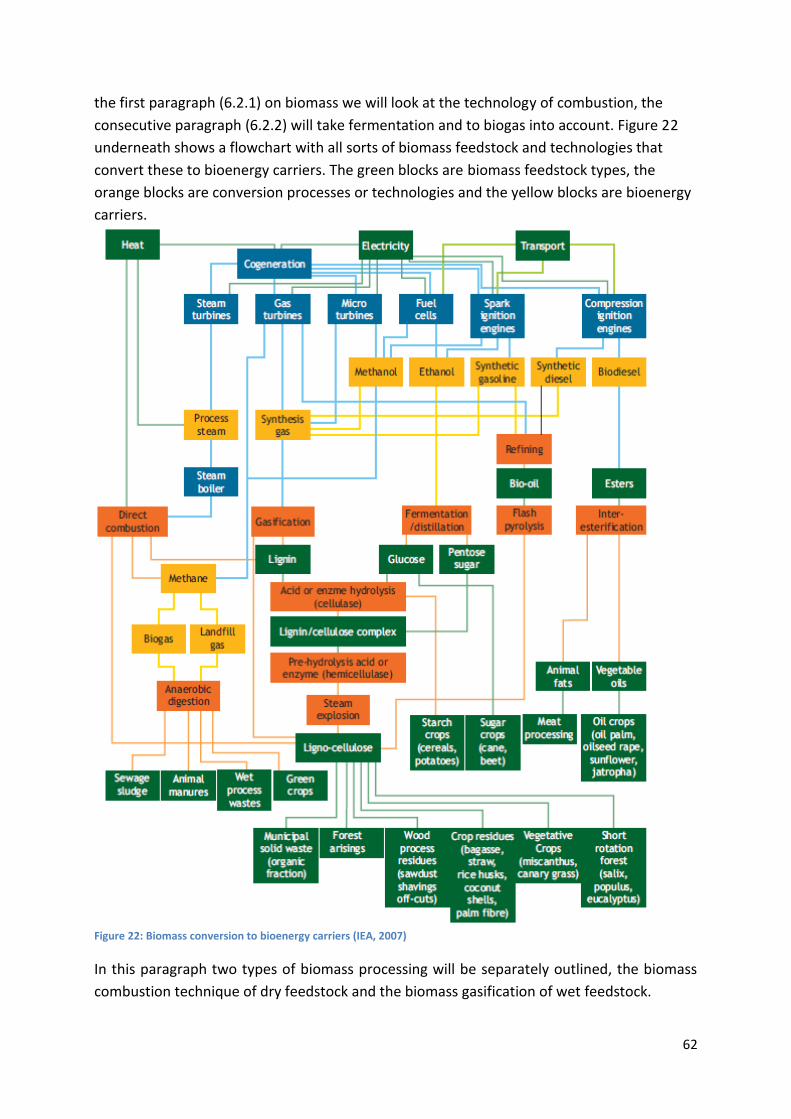
62
the first paragraph (6.2.1) on biomass we will look at the technology of combustion, the
consecutive paragraph (6.2.2) will take fermentation and to biogas into account. Figure 22
underneath shows a flowchart with all sorts of biomass feedstock and technologies that
convert these to bioenergy carriers. The green blocks are biomass feedstock types, the
orange blocks are conversion processes or technologies and the yellow blocks are bioenergy
carriers.
Figure 22: Biomass conversion to bioenergy carriers (IEA, 2007)
In this paragraph two types of biomass processing will be separately outlined, the biomass
combustion technique of dry feedstock and the biomass gasification of wet feedstock.
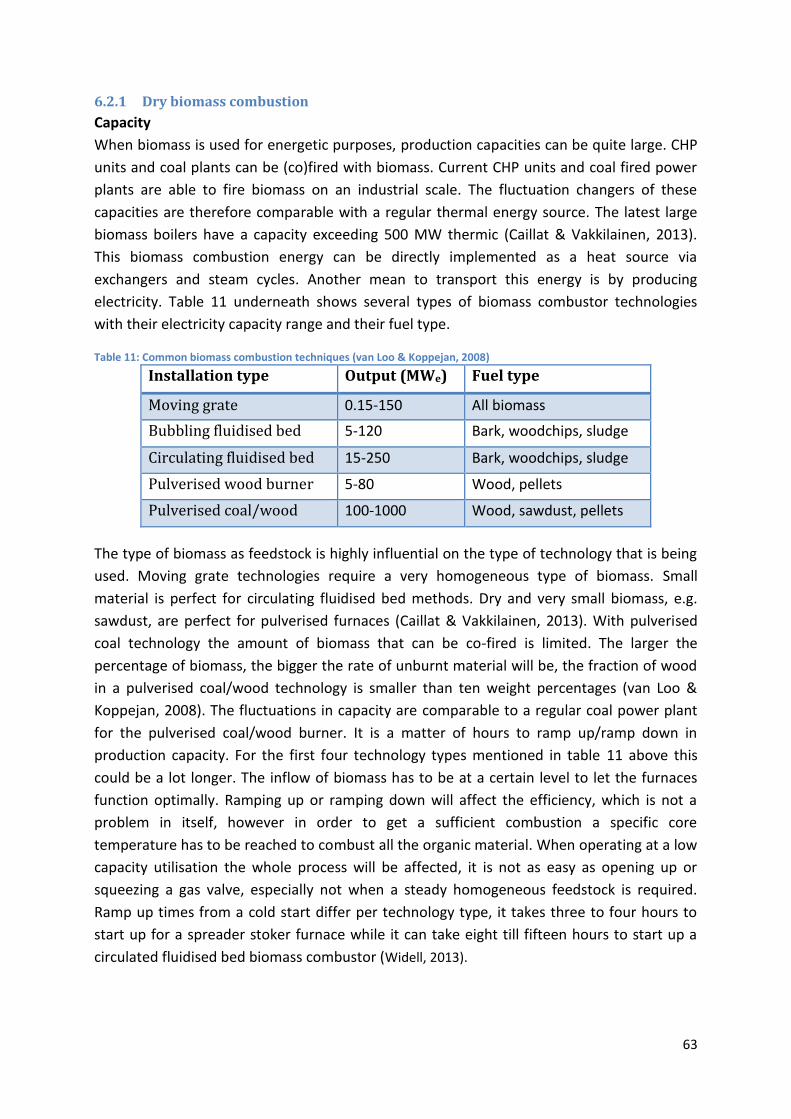
63
6.2.1 Dry biomass combustion
Capacity
When biomass is used for energetic purposes, production capacities can be quite large. CHP
units and coal plants can be (co)fired with biomass. Current CHP units and coal fired power
plants are able to fire biomass on an industrial scale. The fluctuation changers of these
capacities are therefore comparable with a regular thermal energy source. The latest large
biomass boilers have a capacity exceeding 500 MW thermic (Caillat & Vakkilainen, 2013).
This biomass combustion energy can be directly implemented as a heat source via
exchangers and steam cycles. Another mean to transport this energy is by producing
electricity. Table 11 underneath shows several types of biomass combustor technologies
with their electricity capacity range and their fuel type.
Table 11: Common biomass combustion techniques (van Loo & Koppejan, 2008)
Installation type Output (MWe) Fuel type
Moving grate 0.15-150 All biomass
Bubbling fluidised bed 5-120 Bark, woodchips, sludge
Circulating fluidised bed 15-250 Bark, woodchips, sludge
Pulverised wood burner 5-80 Wood, pellets
Pulverised coal/wood 100-1000 Wood, sawdust, pellets
The type of biomass as feedstock is highly influential on the type of technology that is being
used. Moving grate technologies require a very homogeneous type of biomass. Small
material is perfect for circulating fluidised bed methods. Dry and very small biomass, e.g.
sawdust, are perfect for pulverised furnaces (Caillat & Vakkilainen, 2013). With pulverised
coal technology the amount of biomass that can be co-fired is limited. The larger the
percentage of biomass, the bigger the rate of unburnt material will be, the fraction of wood
in a pulverised coal/wood technology is smaller than ten weight percentages (van Loo &
Koppejan, 2008). The fluctuations in capacity are comparable to a regular coal power plant
for the pulverised coal/wood burner. It is a matter of hours to ramp up/ramp down in
production capacity. For the first four technology types mentioned in table 11 above this
could be a lot longer. The inflow of biomass has to be at a certain level to let the furnaces
function optimally. Ramping up or ramping down will affect the efficiency, which is not a
problem in itself, however in order to get a sufficient combustion a specific core
temperature has to be reached to combust all the organic material. When operating at a low
capacity utilisation the whole process will be affected, it is not as easy as opening up or
squeezing a gas valve, especially not when a steady homogeneous feedstock is required.
Ramp up times from a cold start differ per technology type, it takes three to four hours to
start up for a spreader stoker furnace while it can take eight till fifteen hours to start up a
circulated fluidised bed biomass combustor (Widell, 2013).
64
Reliability
The reliability of biomass incinerators are less accurate than conventional utility facilities like
a gas fired power plant. The operational challenges for biomass combustion are varied, there
can be many potential disturbances in the process. Sticky fly ash will cause fouling and
corrosion in the superheated heat exchanging tubes. Grate biomass combustion systems can
have slagging within the boilers which could stop the fuel flow (Hupa, 2012). Biomass
combustion can cause severe problems with fuel impurities and pollutions. In these cases
the calorific value of the feedstock can decrease rapidly which influences the core
temperature and the operability of heat production. The pollutions can cause disturbances
with maintenance due to heavy corrosions by the high content of chlorine and potassium
often present in biomass (Caillat & Vakkilainen, 2013). All in all, these potential situations for
troubleshooting could affect the heat exchange of the Rankine cycle, pressure drops and
uneven heat flows could occur. This deteriorates the reliability of a boiler in combination
with biomass.
Availability
The domestic supplies of biomass in the Netherlands are not sufficient. The estimated
amount of biomass production in 2010 was approximately 34 megatons. If all this biomass
would be used for energetic purposes this would be equal to 132,2PJ (Krebbekx, et al.,
2010). For comparison the Rotterdam cluster uses 149Pj for heat production on a yearly
basis (see chapter 4). Therefore the availability of biomass to fulfil industrial heating
purposes would fall short in the cluster, because these 34 megatons produced in the
Netherlands are not all dedicated for energetic purposes. If 30% of our energy demand by
2030 would be supplied with biomass, it would require 3.5mln hectares. To put this in
contrast the Netherlands has a land surface of 3.3mln hectares (Krebbekx, et al., 2010). The
domestic supply of biomass will not be sufficient to satisfy Dutch energy needs. Biomass
would therefore have to be imported. Only if all domestic produced biomass would be
allocated for energetic purposes in the Rotterdam cluster there would be a step in the
direction a bio-heated industry.
Infrastructure
Next to supply of biomass there is also the physical allocation, transportation of biomass is
another aspect which comes into play when assessing an industrial heating potential. The
travel distance of the organic material could have practical or cost limitations.
Commonly traded biomass types are woodchips, pellets, torrefied biomass and bark. Bark is
the outer layer of a tree, for biomass supply this layer is shredded to small pieces to strips of
wood which are directly fed into combustion chambers. Woodchips can consist out of
multiple parts of a tree. There are green woodchips, made from branches, bark and even
leaves. Next to that, white wood chips are produced that only contain the centre of a tree
stem (Selkimäki, et al., 2010). Pellets are different with respect to its commodity. “Pellets are
small, dense, cylindrical, pressed wood products. Pellets substantially increase heating value
65
(lower heating value – LHV) per biofuel volume. This reduces the transport cost so pellets
are typically sold in international markets. Transportation, storage and handling are the
same as for coal, gravel, etc. Pellets have low biological activity and are stable during
storage” (Caillat & Vakkilainen, 2013:199). Another type of organic feedstock is torrefied
biomass. This is organic material which is treated with heat. This process enables the
feedstock to achieve a higher energetic value. Moist is subtracted out of the feedstock and
the material is partly decomposed. In some cases the energy density can even be higher than
pellets.
Transporting these types of biomass from the location of production to the location of
consumption will affect the competitiveness of the fuel. Most of the organic material will be
delivered in large batches by ship, truck or train. The energy intensity of the biomass types
described above are influential for the costs of transportation per energy quantity. For
instance pellets, which are very homogeneous, are more likely to travel a further distance
due to their energy density than wet biomass. Some types of biomass can even be imported
via international trade. In the Netherlands there are no restrictions or further requirements
to the transportation infrastructure since there are many capabilities for the transportation
of biomass.
Quality The quality of energetic use of biomass becomes ambiguous when applying it for electricity
production. However for this chapter the production means of industrial heating demand is
researched. In fact all energy from organic material that will be used to produce heat will be
used effectively when heat production is the target. Factors that could impact the quality of
the energetic usage are the distance of transport of the raw feedstock and the quality of the
biomass that is used. It is highly influential what the moisture levels in the substance are and
how much heat per kilogram eventually will be produced. A piece of freshly harvested green
wood has a lower heating value (LHV) of 5.9MJ/kg while dry biomass has a LHV of 14.3MJ/kg
(IEA, 2007). On top of that plant efficiencies related to producing industrial pressurised
steam can differ as well.
The pollution aspect of biomass is interesting, there are two types of pollutants, those from
incomplete combustion and pollutants from non-organic substances that are present in the
feedstock. Incomplete combustion, due to partly oxidation of material and wet substances
leads to emission of CO, soot, hydrocarbons, tar and unburnt char emissions. In addition the
biomass feedstock can be fouled with nitrogen which can lead to all sorts of Nitrogen-oxides
(NOx). The non-organic substances could cause sour emissions with Sulphur, Potassium and
Chlorine content. Dangerous chemicals can be formed such as polychlorinated dibenzo-p-
dioxins and polychlorinated dibenzofurans, and heavy metals (Caillat & Vakkilainen, 2013).
“Biomass combustion produces solid and gaseous pollutant emissions that need to be
treated not only to follow existing or future emissions standards (Table 9.8), but also to
minimise possible effects on human health and environment” (Caillat & Vakkilainen,
2013:211).
66
Costs
The cost aspect of a biomass fired industrial heating process is mainly influenced by the fuel
costs, the investment costs and the maintenance cost. “Many bioenergy projects are
technically feasible but investments do not proceed because other forms of energy appear
to be more cost competitive. A significant barrier results where the relatively high costs for
bioheat, biopower or biofuels cannot compete on purely economic terms with fossil fuels
used to provide the same amount of useful energy. The concept of providing a level playing
field to enable true cost comparisons to be made that include all subsidies, co-benefit etc. is
often suggested but rarely achieved in practice” (IEA, 2007:44). To achieve high payback
from the large capital investment it is an attractive business case to utilise a biomass
combustor 24hours a day, 365 days a year, with just a few moments of down time due to
maintenance. Economic risks are high in delivering heat for a biomass combustor, there is
direct competition gas and coal for heat production. Biomass supplies can be twice the price
of coal in terms of €/MW. This is due to high transportation costs and a low energy density.
Industrial sized biomass energy producers have a relatively high capital investment cost,
approximately 1300-2500 $/kW in comparison with 900-2000 $/kW for gas and coal plant
capacity (IEA, 2007). Maintenance costs are higher in comparison with conventional heat
producing facilities like gas turbine and coal combustors due to the higher risk of system
errors. The feedstock of biomass can differ gravely which triggers all sorts of operational
problems (see reliability paragraph). Maintenance costs are lower and more predictable
when more homogeneous biomass is used as a feedstock with for instance using cofiring in
coal plants. Then it becomes a relatively low risk and low cost process for having a share of
biomass capacity in the system. For the case of industrial heat production (pressurised
steam) pure biomass would be very expensive while cofiring of biomass could be a potential.
Examples
For industrial heating purposes biomass combustion could be suitable since it is relatively
cost-effective. Technically it fits as well, high temperatures can be reached and production
technologies are in a developed stadium, steam production with pellets can be used as an
example for such a technology. It is expected that 20-30PJ could be established with biomass
combustion for industrial steam production by 2020 (Kamp, 2015). In the Rotterdam cluster
there is already an example of a thermic biomass facility. The waste incinerator at Rozenburg
delivers more than 10MWth pressurised steam produced with biomass combustion to
industrial customers (ECOFYS, 2014). This steam production is part of a process industry with
a closed steam cycle. This production is secured in long term contracts, the delivery and the
price of the organic feedstock will most likely also be arranged on a long term contract as
basis for a valid business model.
6.2.2 Biogas production and industrial heating
As addition to paragraph 6.2.1 on biomass combustion, there is also the digestion and
fermentation of organic material to biogas (or upgraded green gas) in paragraph 6.2.2. If we
look closely to figure 22 showed a few pages above this process of biogas production is
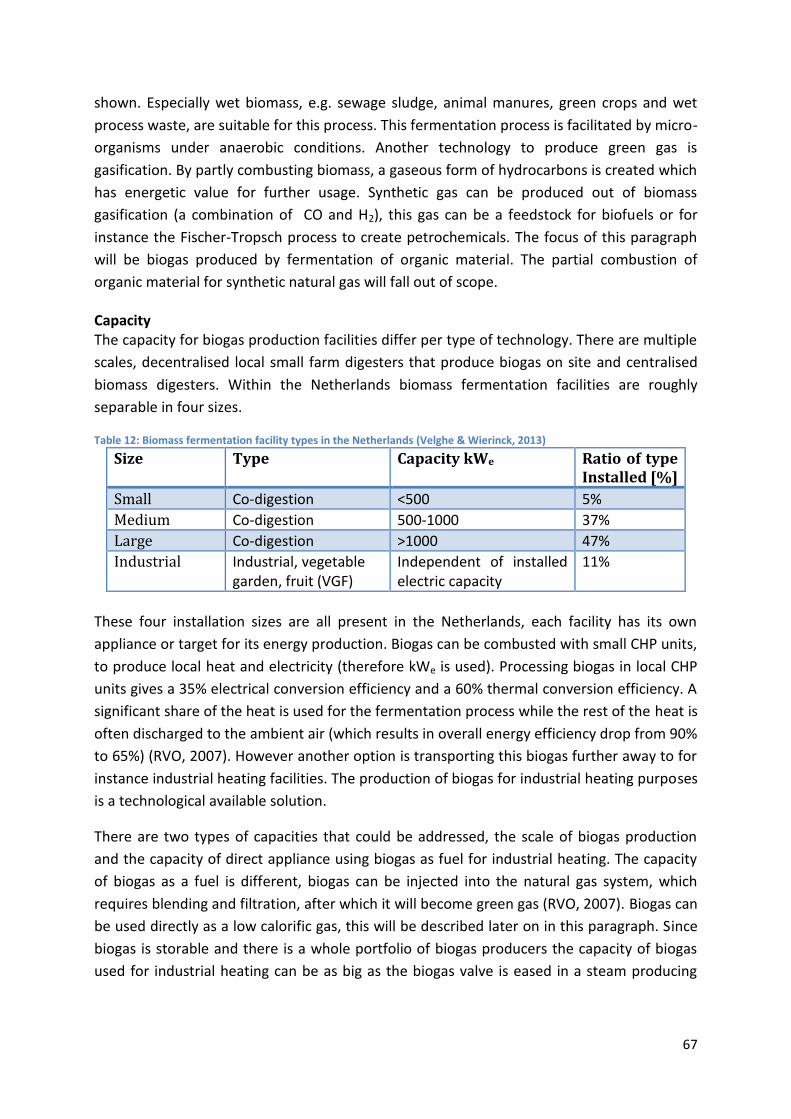
67
shown. Especially wet biomass, e.g. sewage sludge, animal manures, green crops and wet
process waste, are suitable for this process. This fermentation process is facilitated by micro-
organisms under anaerobic conditions. Another technology to produce green gas is
gasification. By partly combusting biomass, a gaseous form of hydrocarbons is created which
has energetic value for further usage. Synthetic gas can be produced out of biomass
gasification (a combination of CO and H2), this gas can be a feedstock for biofuels or for
instance the Fischer-Tropsch process to create petrochemicals. The focus of this paragraph
will be biogas produced by fermentation of organic material. The partial combustion of
organic material for synthetic natural gas will fall out of scope.
Capacity The capacity for biogas production facilities differ per type of technology. There are multiple
scales, decentralised local small farm digesters that produce biogas on site and centralised
biomass digesters. Within the Netherlands biomass fermentation facilities are roughly
separable in four sizes.
Table 12: Biomass fermentation facility types in the Netherlands (Velghe & Wierinck, 2013)
Size Type Capacity kWe Ratio of type Installed [%]
Small Co-digestion <500 5%
Medium Co-digestion 500-1000 37%
Large Co-digestion >1000 47%
Industrial Industrial, vegetable garden, fruit (VGF)
Independent of installed electric capacity
11%
These four installation sizes are all present in the Netherlands, each facility has its own
appliance or target for its energy production. Biogas can be combusted with small CHP units,
to produce local heat and electricity (therefore kWe is used). Processing biogas in local CHP
units gives a 35% electrical conversion efficiency and a 60% thermal conversion efficiency. A
significant share of the heat is used for the fermentation process while the rest of the heat is
often discharged to the ambient air (which results in overall energy efficiency drop from 90%
to 65%) (RVO, 2007). However another option is transporting this biogas further away to for
instance industrial heating facilities. The production of biogas for industrial heating purposes
is a technological available solution.
There are two types of capacities that could be addressed, the scale of biogas production
and the capacity of direct appliance using biogas as fuel for industrial heating. The capacity
of biogas as a fuel is different, biogas can be injected into the natural gas system, which
requires blending and filtration, after which it will become green gas (RVO, 2007). Biogas can
be used directly as a low calorific gas, this will be described later on in this paragraph. Since
biogas is storable and there is a whole portfolio of biogas producers the capacity of biogas
used for industrial heating can be as big as the biogas valve is eased in a steam producing
68
facility. Capacity ramp up and ramp down times are fast, comparable with a STEG (steam
and gas) heat producing facility.
Reliability
The reliability of biomass fermentation is proper, however there are common errors that
could occur within the fermentation reactors. Sediment layers appear inside the vessel due
to small amounts of rock and sand that strand in the tank by the effect of gravity. Stirring the
organic material can help boosting the efficiencies of the fermentation however these “dead
zones” or non-active layers keep appearing in the reactor vessel (Velghe & Wierinck, 2013).
Actively cleansing of the vessels during maintenance periods will be necessary for the
fermentation facilities to operate. Another common error is the deterioration of the wooden
digester construction due to circumstances of the air temperature, humidity and quality. In
some cases there is also troubleshooting with the heating of the fermentation facility, cold
weather and poor insulation can lead to a complete stagnation of the digestion process
(Velghe & Wierinck, 2013). All in all, these potential errors could affect the production of
biogas. Biogas reliability on the production side is not that big of a problem since biogas is
storable and there is a whole portfolio of biogas producers that can balance supply and
demand fluctuations. Biogas as a fuel has a very high reliability, the gas itself is a commodity
with a given calorific bandwidth and quality (GTS, 2015a).
Availability
There were 4500 biogas producing installations throughout the whole of Europe in 2002, this
number has been growing ever since. All this biogas is mostly produced by fermentation of
wet organic substances. The total market estimate for Europe in 2020 is 90PJ of energy
content produced with biomass (IEA,2007). In the Netherlands a growing potential for biogas
production is predicted, some wet biomass feedstock’s are expected to increase. Manure
production by cattle, chickens and pigs have potential growth expectations due to changing
market conditions and regulations. Besides manure production, the harvesting of sewage
sludge and grass have a growing potential as well. Around 2030 an additional source of wet
biomass, seaweed, can be produced (ECN, et al., 2014).
To be specific, 3.7Bcm of biogas can be produced by 2030, for comparison this is 2.2Bcm of
natural gas, 1 cubic meter of biogas has an equivalent of 0.63 cubic meter of natural gas
(Swedish Gas Centre, 2012). For biogas production on a yearly basis there could be a
potential production capacity of approximately 77PJ a year by 2030 (ECN, et al., 2014). The
amount of energy that is recovered from wet biomass in the form of biogas is dependent on
the technologies that are used. The energy required to fulfil the Rotterdam cluster’s
industrial heat demand is 149Pj on a yearly basis (see chapter 4). The availability of biogas to
satisfy industrial heating would fall short in the Netherlands, however there is of course a
possibility to combine multiple renewable sources for industrial heating in the cluster.

69
Infrastructure
There are some infrastructural aspects to the appliance of direct biogas as energy source,
biogas can be sour and will not be transported in that form through the national gas
transmission grid. The biogas can be used locally for producing electricity or heating (or both
in case of CHP-units). Injection into the natural gas grid is possible when the quality is
upgraded to natural gas grid quality. When multiple producers of biogas are clustered
together there is a possibility for a biogas grid that has centralised blending stations for
biogas insertion to the natural gas grid. Some of these locations, industrial scale, are
depicted in figure 23 underneath.
Figure 23: Biogas feed-in locations natural gas grid (Hazebroek, 2014)
So for biogas to be applicable regarding the industrial heating purpose for the Rotterdam
cluster it needs to be upgraded and blended into the natural gas grid. Another option is to
use biogas directly for industrial appliances which requires a separate biogas grid that can
handle the lower quality energetic value, pollution and acidity. When opting for a separate
biogas grid this fuel source for industrial heating will become very costly. “The storage of
biomass is often necessary due to its seasonal production versus the need to produce
bioenergy all year round. Therefore to provide a constant and regular supply of fuel for the
plant requires either storage or multi-feedstocks to be used, both of which tend to add cost
to the system. Since biomass tends to have relatively low energy density (whether as a solid,
liquid or gas), and is organic, then the storage of large volumes can be costly. For example
biogas needs either large plastic or steel storage tanks or to be compressed and stored in
cylinders, both being expensive options. Therefore matching the biogas production rate to
70
the demand is the more usual approach”(IEA, 2007: 35). When biogas is upgraded to green
gas every natural gas device becomes a potential customer for biogas. When there are many
decentralised biogas producers and when joint production exceeds approximately one
thousand cubic meters biogas an hour it becomes interesting to investigate for applications
of biogas blending and injection to the natural gas grid (RVO, 2007).
Quality
The quality of biogas in relation to natural gas is lower. Green gas however is upgraded to
the energetic content of natural gas, one cubic meter of biogas has an equivalent of 0.63
cubic meter of natural gas (see the two paragraphs preceding). The feed in of green gas is
comparable to the feed in of natural gas to the transmission grid. Biogas exists mainly out of
CO2 and CH4. On a regular basis high calorific (foreign or offshore) gas is blended with
nitrogen (N2) to reach the Groningen low calorific gas quality. For the scale of biogas
injection into the natural gas grid this process is too costly. Therefore biogas is just blended
with natural gas until there is right ratio between CO2 and CH4 within a certain bandwidth to
inject it next to natural gas into the grid.
The pollution of biogas production is also taken into account for the assessment of the
quality criterion. Biogas or biofuel combustion tends to be a relatively cleaner and less
noxious fuel than other fossil fuel equivalents. The sulphur and nitrogen content of biomass
are lower (IEA, 2007). The pollution differs widely per technology used, there are factors
such as feedstock qualities, combustion temperatures, etc. The production of biogas by
fermentation can be polluting as well, however anaerobic fermentation processes tend to be
very dirty (with regard to emissions and odours). “Local regulations will vary regarding any
emissions to air (including fly ash, dioxins, carbon monoxide, carbon dioxide, sulphur
dioxide, nitrous oxides, particulates, dust), so early consultation with the local authority will
be necessary. … A resource consent often involves regular monitoring of emissions (either
automatically or manually) to ensure that any conditions imposed on a bioenergy plant are
being met” (IEA, 2007: 40). All in all biomass fermentation to biogas is relatively clean,
however there can be obstructions by locals who experience the NIMBY effect, this is highly
dependent on the scale of the production.
Costs The costs of biogas production are mainly influenced by the fuel, labour, investment and
maintenance cost. Biogas production is for many decentralised producers an additional
process instead of a core business. For example famers that have residual manure or wet
organic substances are able to create a more valuable product and sell biogas (or heat and
electricity). In these cases biogas production is complementary because the feedstock of the
process was already in place. Still most of these cases are heavily subsidised to have an
economic business case (Velghe & Wierinck, 2013). When biogas is produced at a larger
industrial scale the feedstock has to be bought as well. Biomass supplies can be twice the
price of coal in terms of €/MW, due to high transportation costs and a low energy density
(IEA,2007). On top of that biogas has a lower energetic value than natural gas while regular

71
gas will be the reference price when it is upgraded to green gas. Operational costs for small
scale biogas producers could be reduced due to lower fuel costs, while large scale
fermentation plants on the other hand can cut down on labour costs due to efficiencies. The
feedstock of biomass fermentation is proper, however there are some operational problems
(see reliability paragraph). Such operational failures will be substantial for maintenance
costs. A study by Organic Waste Systems, commissioned by Agentschap NL evaluated 20
biogas fermentation plants throughout the Netherlands. The result of these facilities are
expressed in the pie charts underneath in percentages. The blue pie chart represents the
revenue break down and the red pie chart represents the costs break down structure of the
biogas producers under investigation.
Figure 24: Revenues and cost breakdown Dutch biomass fermentation plants (Velghe & Wierinck, 2013)
On the revenue side it appears that 33% of the revenues are gained by electricity sales, while
62% of the gains are raised by subsidies. The other few percentages are allocated to the
sales of heat or digested waste. On the costs side more interestingly there is a more
divergent picture. 6% is allocated to labour costs, 32% are capital costs due to the
investments made, another 31% of the costs are allocated to substrates (which are
chemicals to increase or catalyse the digestion process). 18% of the costs are allocated to
the disposal of residual digestion material. Another 12% is allocated to maintenance costs
(Velghe & Wierinck, 2013). This cost breakdown is focussed on decentralised biomass
fermentation facilities, however it gives a useful perspective on the costs and revenues that
are involved with this biomass fermentation. On a technical basis we have seen that
industrial heat (pressurised steam) production can be realised with biogas in the form of
green gas. From the economical perspective it seems unlikely that biogas production on a
large scale will be implemented for industrial heating since on average within the
Netherlands the revenues for producing biogas is for 62% subsidised. Of course there are
projects that perform better and there is a learning curve which could make biomass
fermentation cheaper, next to small scale farmers there are also industrial scale biogas
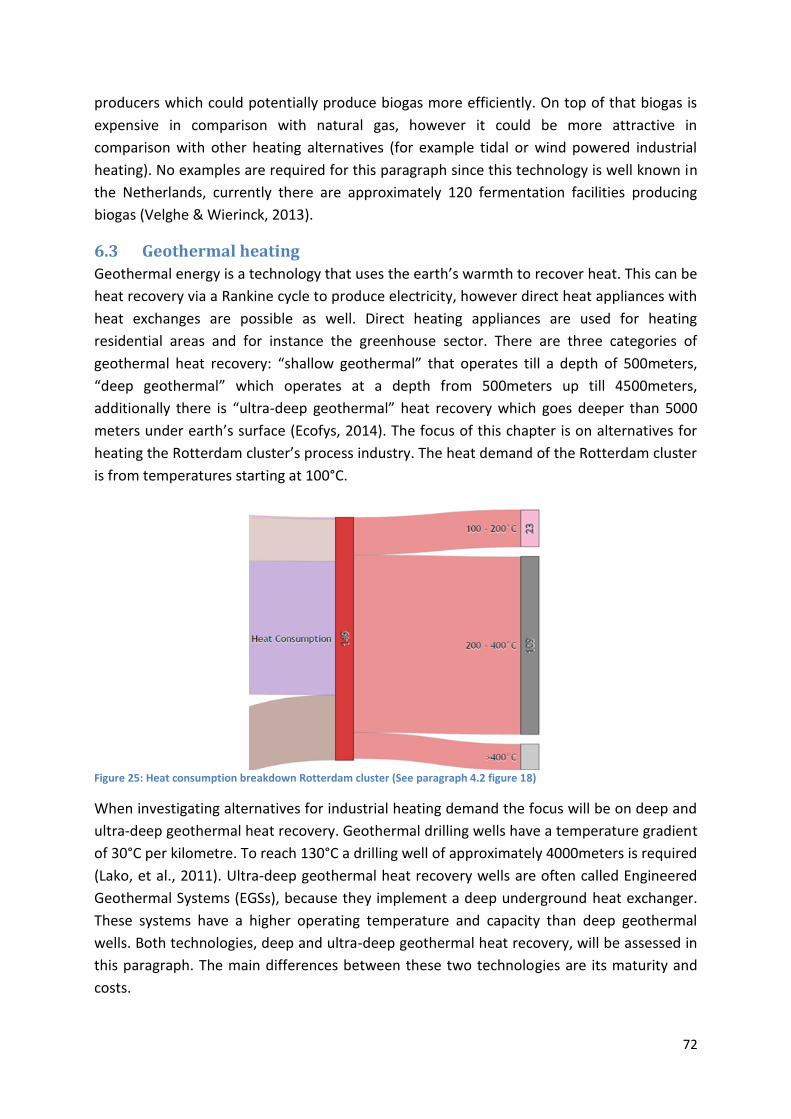
72
producers which could potentially produce biogas more efficiently. On top of that biogas is
expensive in comparison with natural gas, however it could be more attractive in
comparison with other heating alternatives (for example tidal or wind powered industrial
heating). No examples are required for this paragraph since this technology is well known in
the Netherlands, currently there are approximately 120 fermentation facilities producing
biogas (Velghe & Wierinck, 2013).
6.3 Geothermal heating
Geothermal energy is a technology that uses the earth’s warmth to recover heat. This can be
heat recovery via a Rankine cycle to produce electricity, however direct heat appliances with
heat exchanges are possible as well. Direct heating appliances are used for heating
residential areas and for instance the greenhouse sector. There are three categories of
geothermal heat recovery: “shallow geothermal” that operates till a depth of 500meters,
“deep geothermal” which operates at a depth from 500meters up till 4500meters,
additionally there is “ultra-deep geothermal” heat recovery which goes deeper than 5000
meters under earth’s surface (Ecofys, 2014). The focus of this chapter is on alternatives for
heating the Rotterdam cluster’s process industry. The heat demand of the Rotterdam cluster
is from temperatures starting at 100°C.
Figure 25: Heat consumption breakdown Rotterdam cluster (See paragraph 4.2 figure 18)
When investigating alternatives for industrial heating demand the focus will be on deep and
ultra-deep geothermal heat recovery. Geothermal drilling wells have a temperature gradient
of 30°C per kilometre. To reach 130°C a drilling well of approximately 4000meters is required
(Lako, et al., 2011). Ultra-deep geothermal heat recovery wells are often called Engineered
Geothermal Systems (EGSs), because they implement a deep underground heat exchanger.
These systems have a higher operating temperature and capacity than deep geothermal
wells. Both technologies, deep and ultra-deep geothermal heat recovery, will be assessed in
this paragraph. The main differences between these two technologies are its maturity and
costs.
73
Capacity
The capacity of geothermal heat recovery differs per well. There are factors such as the
structure of the earth layers (which defines the temperature gradient), the depth of the well
and the type of technology implemented. In most of the current cases geothermal energy is
applied in combination with CHP units. The temperature difference is gravely important for
the capacity of heat production. The temperature difference is defined as ∆T, the bigger the
temperature difference, the more efficient electricity can be produced out of the Rankine
cycle. At a temperature difference of (∆T) 55°C the electricity production efficiency is
approximately 10%, the Rankine cycle can theoretically produce 960KWe. The direct heat
delivery for heat net appliances are approximately 6.1 MWth. When there is are ∆T of 90°C
heat productions capacities are already up to 15.7MWth (Lako, et al., 2011). Then again it
differs gravely on the technology or ground structure how efficient the geothermal energy
recovery can take place. There are several locations within the Netherlands were the
temperature gradient exceeds 30°C per kilometre, there are places were 35°C per kilometre
or even higher can be reached, this will result in an efficiency step from 10 to 12% on the
Rankine cycle for electricity production.
This brings us to ultra-deep geothermal energy recovery. Ground layers deeper than 5000m
are attractive for their high temperatures of 150°C to 200°C. Engineered Geothermal
Systems are applicable in wider range since wells with such drilling depths do not have to be
located near an underground warm water flow or aquifer. With these depths a temperature
gradient of 40°C per kilometre can be reached in some cases (Lako, et al., 2011). This makes
higher temperatures possible, which makes the potential applications for geothermal heat
much bigger. Pure electricity production (instead of CHP) or industrial heat production for
the process industry becomes feasible. Drilling to depths of six to ten kilometres deep the
steam temperatures can reach up to 350°C with electricity production efficiencies of 25%
(Sandt, 2010). The fluctuation changes of geothermal heat are flexible as well. It can produce
a very steady baseload of heat (or in case of CHP units electricity), however geothermal
technologies are very well capable of ramping up and down quickly (GEA, 2013). To reach a
higher capacity (MW) installation for heat recovery per drilling well another technology can
be implemented, a so called open system. The closed system, which circulates a medium
through a closed circuit, delivers a small heat production capacity. An open system does not
need large horizontal piping systems for heat exchange to reach a higher production
capacity (IF WEP, Ecofys, TNO, 2011). However the risks for an open system are bigger since
the system is prone to fouling since it is open. This will be further discussed in the reliability
section underneath.
Reliability
The reliability of geothermal heating technologies is proper. There are some aspects that
need to be taken into account when doing any operational maintenance or work. The whole
geothermal facility is dealing with superheated water, any equipment, heat exchanger or
turbine can be very dangerous (GEA, 2013). In addition ultra-deep geothermic drilling is not
74
a well proven technology, there will be a learning curve which eventually could positively
affects the reliability. Even deep geothermal heat recovery is still in a sort of development
phase. There are multiple failures that are common for geothermal heat recovery. Natural
gasses can be a residual product next to heat from the earth’s crust. Constipations can occur
due to salt sedimentation in the tubing and heat exchanger system. Another technicality is
that in some cases radioactivity is measured, however only on a very small scale. In addition
there is the problem that many geothermal projects are using extra energy to re-inject
cooled down water into the ground, this result in a lower energy efficiency for heat recovery
(Lako, et al., 2011). These technological flaws or occurrences are present with deep
geothermal wells, ultra-deep geothermal wells could potentially be even more reluctant to
failure and maintenance. All in all besides these occurring failures geothermal heat recovery
projects tend to be a reliable supply source for energy.
Availability Geothermal energy in the Netherlands is currently still a small industry. There are
approximately 10 exploratory geothermal heat recovery projects performed (Lako, et al.,
2011). These geothermal projects produced 2,9PJ on a yearly basis in 2012 (RVO, 2015a).
However, the potential is enormous. TNO in combination with Ecofys and IF WEP (A
geothermic specialist) did a study for geothermal energy potential in the Netherlands with
remarkable results. Deep geothermic potential (deeper than 4km) is applicable almost
anywhere in the Netherlands. At least 20% of our national primary energy consumption can
be replaced with geothermal energy in 2050 (IF WEP, Ecofys, TNO, 2011). Note: this 20%
potential is the worst case scenario in this study, which is still a staggering 411PJ. Basically
there is enough potential to support the whole Netherlands for hundreds of years in energy,
however there is not much known about the Dutch ground layers deeper than 4000meter.
There is little data available which results in a high risk profile for geothermal projects. When
such a geothermal facility is in place it can provide a steady supply of heat throughout the
year without any seasonal or pattern behaviour. “Geothermal power offers both firm and
flexible solutions to the changing U.S. power system by providing a range of services
including but not limited to baseload, regulation, load following or energy imbalance,
spinning reserve, non-spinning reserve, and replacement or supplemental reserve ”(GEA,
2013: 4).
Infrastructure
Most deep and ultra-deep geothermal heat recovery projects are applicable almost
everywhere throughout the Netherlands, however there are differences on thermal
potential regarding the amount of recoverable heat underground. Figure 26 is showing the
probability of economic success designated in three classes: ‘unknown’, “possible”: and
“good potential” on the right side. The left hand side shows potential technical recoverable
heat regardless of any economics or flow property constraints (Kramers, et al., 2012).
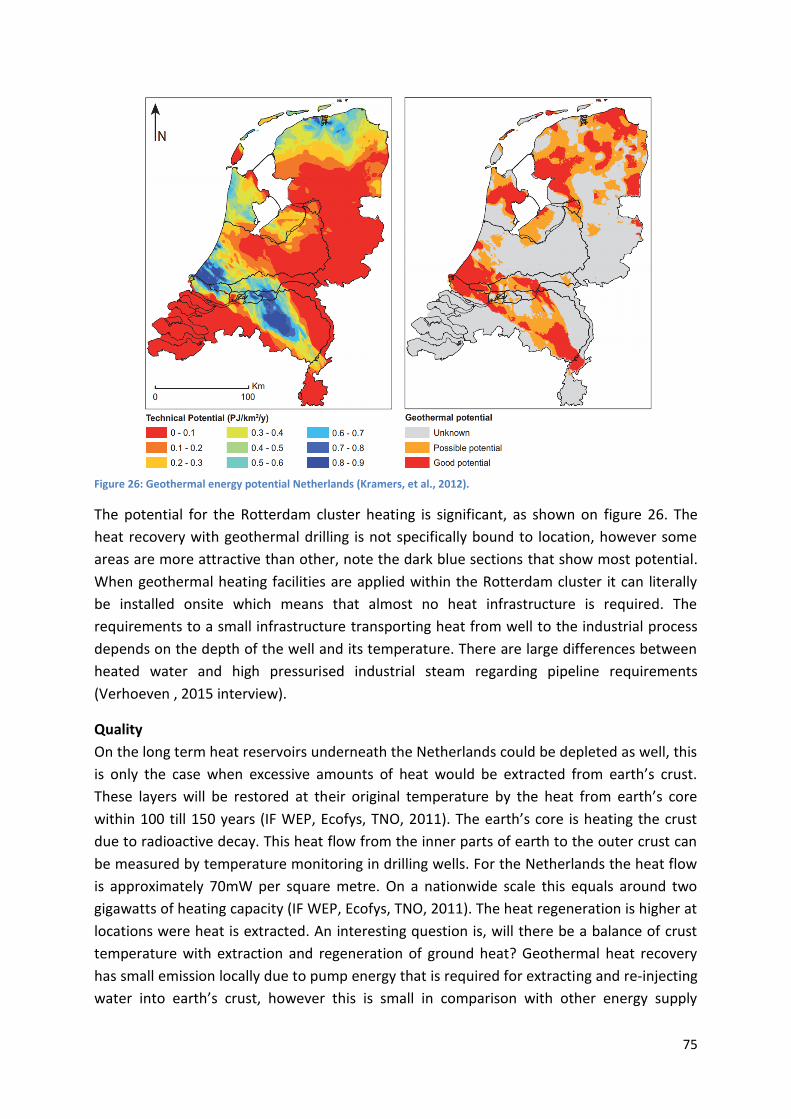
75
Figure 26: Geothermal energy potential Netherlands (Kramers, et al., 2012).
The potential for the Rotterdam cluster heating is significant, as shown on figure 26. The
heat recovery with geothermal drilling is not specifically bound to location, however some
areas are more attractive than other, note the dark blue sections that show most potential.
When geothermal heating facilities are applied within the Rotterdam cluster it can literally
be installed onsite which means that almost no heat infrastructure is required. The
requirements to a small infrastructure transporting heat from well to the industrial process
depends on the depth of the well and its temperature. There are large differences between
heated water and high pressurised industrial steam regarding pipeline requirements
(Verhoeven , 2015 interview).
Quality
On the long term heat reservoirs underneath the Netherlands could be depleted as well, this
is only the case when excessive amounts of heat would be extracted from earth’s crust.
These layers will be restored at their original temperature by the heat from earth’s core
within 100 till 150 years (IF WEP, Ecofys, TNO, 2011). The earth’s core is heating the crust
due to radioactive decay. This heat flow from the inner parts of earth to the outer crust can
be measured by temperature monitoring in drilling wells. For the Netherlands the heat flow
is approximately 70mW per square metre. On a nationwide scale this equals around two
gigawatts of heating capacity (IF WEP, Ecofys, TNO, 2011). The heat regeneration is higher at
locations were heat is extracted. An interesting question is, will there be a balance of crust
temperature with extraction and regeneration of ground heat? Geothermal heat recovery
has small emission locally due to pump energy that is required for extracting and re-injecting
water into earth’s crust, however this is small in comparison with other energy supply
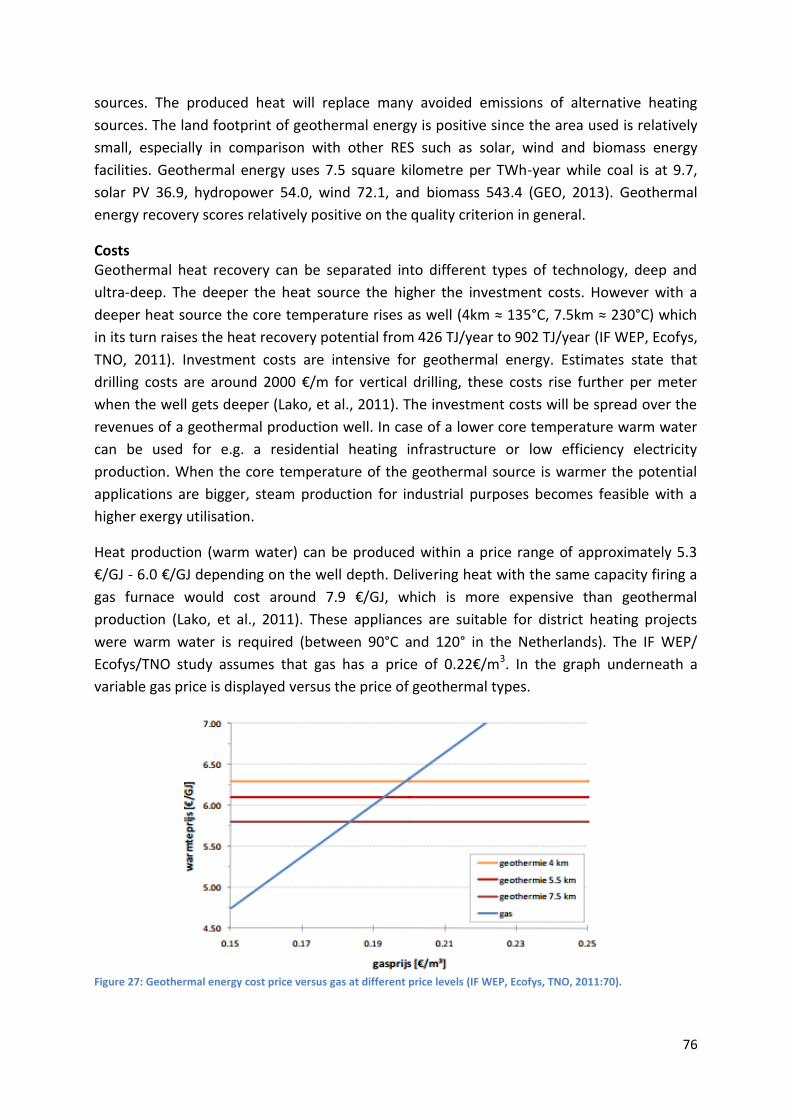
76
sources. The produced heat will replace many avoided emissions of alternative heating
sources. The land footprint of geothermal energy is positive since the area used is relatively
small, especially in comparison with other RES such as solar, wind and biomass energy
facilities. Geothermal energy uses 7.5 square kilometre per TWh-year while coal is at 9.7,
solar PV 36.9, hydropower 54.0, wind 72.1, and biomass 543.4 (GEO, 2013). Geothermal
energy recovery scores relatively positive on the quality criterion in general.
Costs Geothermal heat recovery can be separated into different types of technology, deep and
ultra-deep. The deeper the heat source the higher the investment costs. However with a
deeper heat source the core temperature rises as well (4km ≈ 135°C, 7.5km ≈ 230°C) which
in its turn raises the heat recovery potential from 426 TJ/year to 902 TJ/year (IF WEP, Ecofys,
TNO, 2011). Investment costs are intensive for geothermal energy. Estimates state that
drilling costs are around 2000 €/m for vertical drilling, these costs rise further per meter
when the well gets deeper (Lako, et al., 2011). The investment costs will be spread over the
revenues of a geothermal production well. In case of a lower core temperature warm water
can be used for e.g. a residential heating infrastructure or low efficiency electricity
production. When the core temperature of the geothermal source is warmer the potential
applications are bigger, steam production for industrial purposes becomes feasible with a
higher exergy utilisation.
Heat production (warm water) can be produced within a price range of approximately 5.3
€/GJ - 6.0 €/GJ depending on the well depth. Delivering heat with the same capacity firing a
gas furnace would cost around 7.9 €/GJ, which is more expensive than geothermal
production (Lako, et al., 2011). These appliances are suitable for district heating projects
were warm water is required (between 90°C and 120° in the Netherlands). The IF WEP/
Ecofys/TNO study assumes that gas has a price of 0.22€/m3. In the graph underneath a
variable gas price is displayed versus the price of geothermal types.
Figure 27: Geothermal energy cost price versus gas at different price levels (IF WEP, Ecofys, TNO, 2011:70).

77
For steam production the business case is a bit different since the required temperature is
higher. The used flow back steam from the industrial processes at temperatures around the
level of city heating. This residual heat can be used to produce electricity for example,
however the core business of this geothermal utilisation is steam production. Steam at a
level of 230°C can be produced at a cost price of 8.6 €/GJ, for comparison steam production
with a gas fired furnace is approximately 8.5 €/GJ (Lako, et al., 2011). The costs price is
sensitive to the flow-back temperature of the produced steam when leaving industrial
processes. If the flow back of steam hydrates is high enough it can be utilised to produce
electricity which would reduce the cost price.
Concluding the cost of ultra-deep geothermal energy recovery are lower than deep
geothermal energy with respect to the costs per produced joules, the investment costs of
EGS are higher but the potential heat production is bigger as well. Industrial facilities in the
Rotterdam cluster use the reference price for conventional heating technologies (boiler or
furnace parity), for the case of natural gas fired furnaces the reference heating price is low
since the gas price is low currently. In addition there is a low ETS price since there are too
many emission rights circulating which makes the heating reference costs even more
competitive in favour of conventional energy sources. The Dutch state has implemented a
subsidy to stimulate renewable energy via the Subsidie Duurzame Energieproductie (SDE+)
which lasts for fifteen years in the case of geothermal energy. Especially for geothermal
projects deeper than 500meter there is a separate guarantee for reimbursements or hedging
in case of drilling failures (RVO, 2015a). Next to state subsidies on geothermal energy the
cost price of ultra-deep heat recovery is expected to decrease further due to the learning
curve (Lako, et al., 2011).
Example There is a project realised on the Dutch island of Texel by Ecofys and IF technology. This
geothermal heat recovery is based on a CHP unit for electricity and heat production.
Information on this project is scarce, however the drilling costs are estimated at €51-53mln
which would mean (with drilling costs of €3500 per metre) a geothermal well at
approximately a depth of 7km. There is a special earth layer underneath Texel which is called
the “Kolenkalk Group”, located at a depth of 5.500m-7.500m (Lako, et al., 2011). In Germany
there are already many geothermal projects realised, 17 projects for heat delivery to heat
nets, three projects that deliver heat to thermic baths, 15large scale city heat nets, one CHP
project and three electricity producing applications (Lako, et al., 2011). There are also EGS
(ultra-deep geothermal) projects is Soultz France and Landau, Germany. In these projects
many knowledge is gained, however technology standardisation of EGS is still out and has
yet to be further developed.
Currently there is an investigation going on by a consortium of three parties to utilise ultra-
deep geothermal energy for industrial heating in the region Wageningen/Renkum
(Gelderland). This will be a combination of pressurised steam for a paper mill (Parenco in
Renkum) and the delivery of residual heat with a heat net to areas in the cities of
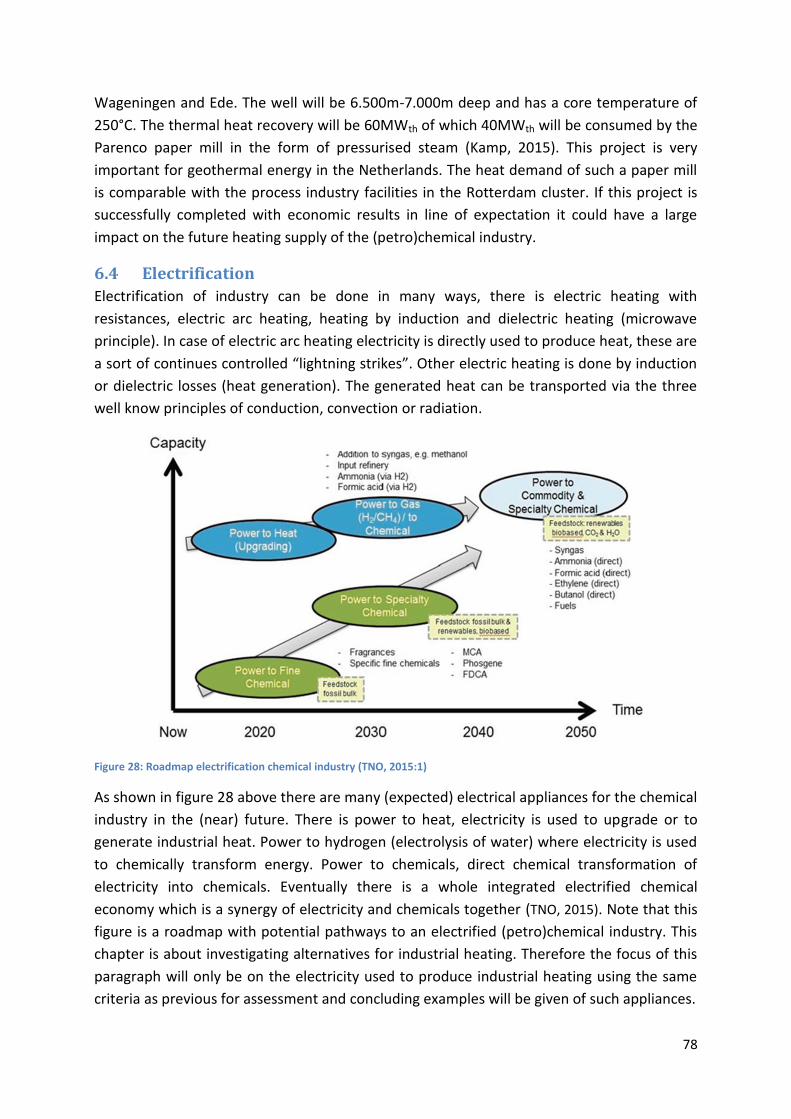
78
Wageningen and Ede. The well will be 6.500m-7.000m deep and has a core temperature of
250°C. The thermal heat recovery will be 60MWth of which 40MWth will be consumed by the
Parenco paper mill in the form of pressurised steam (Kamp, 2015). This project is very
important for geothermal energy in the Netherlands. The heat demand of such a paper mill
is comparable with the process industry facilities in the Rotterdam cluster. If this project is
successfully completed with economic results in line of expectation it could have a large
impact on the future heating supply of the (petro)chemical industry.
6.4 Electrification
Electrification of industry can be done in many ways, there is electric heating with
resistances, electric arc heating, heating by induction and dielectric heating (microwave
principle). In case of electric arc heating electricity is directly used to produce heat, these are
a sort of continues controlled “lightning strikes”. Other electric heating is done by induction
or dielectric losses (heat generation). The generated heat can be transported via the three
well know principles of conduction, convection or radiation.
Figure 28: Roadmap electrification chemical industry (TNO, 2015:1)
As shown in figure 28 above there are many (expected) electrical appliances for the chemical
industry in the (near) future. There is power to heat, electricity is used to upgrade or to
generate industrial heat. Power to hydrogen (electrolysis of water) where electricity is used
to chemically transform energy. Power to chemicals, direct chemical transformation of
electricity into chemicals. Eventually there is a whole integrated electrified chemical
economy which is a synergy of electricity and chemicals together (TNO, 2015). Note that this
figure is a roadmap with potential pathways to an electrified (petro)chemical industry. This
chapter is about investigating alternatives for industrial heating. Therefore the focus of this
paragraph will only be on the electricity used to produce industrial heating using the same
criteria as previous for assessment and concluding examples will be given of such appliances.
79
Capacity
Electrification of industrial processes is an ongoing trend in the past decade, electrification
rates of industrial energy consumption within Europe rises every year. The electrification
rate in Europe’s industry rose from 23% in 1990 to 32% in 2011, while coal and gas
decreased in share of energy consumption (Leonardo Energy, 2012). With heat pumps and
recompression there is large potential for economising a plant, the balance between steam
and electricity changes (VNCI, 2013). High pressurised steam is a product which can be very
easily produced with electricity. “Advantages of electric heating methods over other forms
include precision control of temperature and distribution of heat energy, combustion not
used to develop heat and the ability to attain temperatures not readily achievable with
chemical combustion. Electric heat can be accurately applied at the precise point needed in
a process, at high concentration of power per unit area or volume. The heating apparatus
can be built in any required size and can be located anywhere within a plant. The electric
heating processes are generally clean, quiet, and do not emit much by-product heat to the
surroundings. Furthermore these heating equipments have a high speed of response,
lending it to rapid-cycling mass-production equipment”(ENERZI, 2015:1). Creating steam
with electricity is a rather simple process, heating elements (basically a large resistance)
create heat which is transferred to water by direct contact or heat exchangers. The water
reaches the suitable temperature and eventually gets a phase shift to saturated steam which
can directly be applied to industrial heating facilities or further pressurised with pumps. The
production of steam by electric boilers is not very different with a fire heated boiler, the only
difference is the heat source. Electric boilers are perfect capable in supplying industrial heat
demand, the technological specifications can reach up to very high temperatures (higher
than chemical combustion) with a capacity of that is scalable to several MWth. Since we are
dealing with electrical apparatus the ramp up and ramp down time of heating elements is
very short, capacity changes can be implemented directly.
Reliability
The reliability and safety of electric steam boilers is very high. It is a mature and proven
technique which is applied both, on a large- and small-scale, throughout industries globally.
Electric driven boilers are less complicated with respect to heat exchanging than
conventional boilers. Also the maintenance is much easier due to the nature of the heating
process, electric heating is very clean and controlled. There are no foul tubing systems or
residuals which stay behind in the boiler (Junge, 2009).
The feedstock for an electric driven boiler is also very stable. The Dutch electricity grid has a
very high interconnectivity with one of the lowest power interruptions in the world. The
yearly interruption time for a client is on average 20minutes. Annually Dutch electricity grid
operators invest 800mln euros for improvements and replacing sections (Netbeheer
Nederland, 2015). In addition there are plans to apply smart IT systems that can further
reduce interruption times by tracking down the source of the power failure very swiftly,
power outages are tracked down to the source within a minute. This is a large contribution
to the reliability of an electric heating system for industrial purposes.
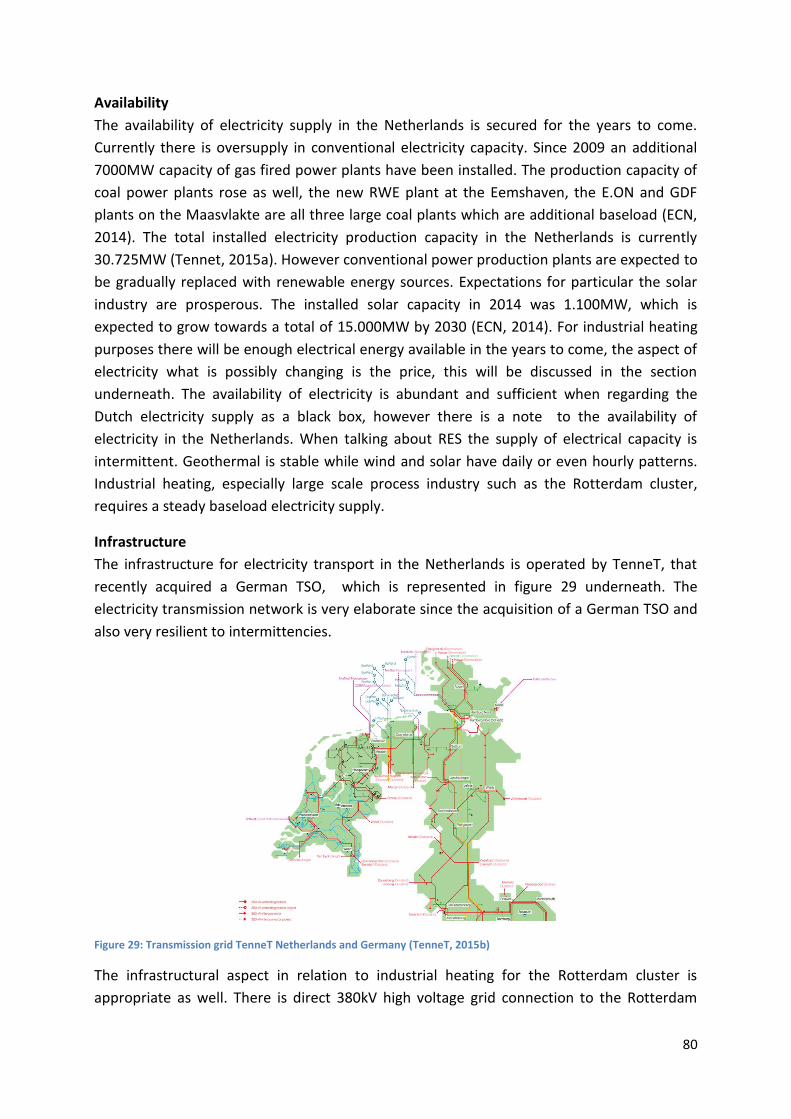
80
Availability
The availability of electricity supply in the Netherlands is secured for the years to come.
Currently there is oversupply in conventional electricity capacity. Since 2009 an additional
7000MW capacity of gas fired power plants have been installed. The production capacity of
coal power plants rose as well, the new RWE plant at the Eemshaven, the E.ON and GDF
plants on the Maasvlakte are all three large coal plants which are additional baseload (ECN,
2014). The total installed electricity production capacity in the Netherlands is currently
30.725MW (Tennet, 2015a). However conventional power production plants are expected to
be gradually replaced with renewable energy sources. Expectations for particular the solar
industry are prosperous. The installed solar capacity in 2014 was 1.100MW, which is
expected to grow towards a total of 15.000MW by 2030 (ECN, 2014). For industrial heating
purposes there will be enough electrical energy available in the years to come, the aspect of
electricity what is possibly changing is the price, this will be discussed in the section
underneath. The availability of electricity is abundant and sufficient when regarding the
Dutch electricity supply as a black box, however there is a note to the availability of
electricity in the Netherlands. When talking about RES the supply of electrical capacity is
intermittent. Geothermal is stable while wind and solar have daily or even hourly patterns.
Industrial heating, especially large scale process industry such as the Rotterdam cluster,
requires a steady baseload electricity supply.
Infrastructure
The infrastructure for electricity transport in the Netherlands is operated by TenneT, that
recently acquired a German TSO, which is represented in figure 29 underneath. The
electricity transmission network is very elaborate since the acquisition of a German TSO and
also very resilient to intermittencies.
Figure 29: Transmission grid TenneT Netherlands and Germany (TenneT, 2015b)
The infrastructural aspect in relation to industrial heating for the Rotterdam cluster is
appropriate as well. There is direct 380kV high voltage grid connection to the Rotterdam
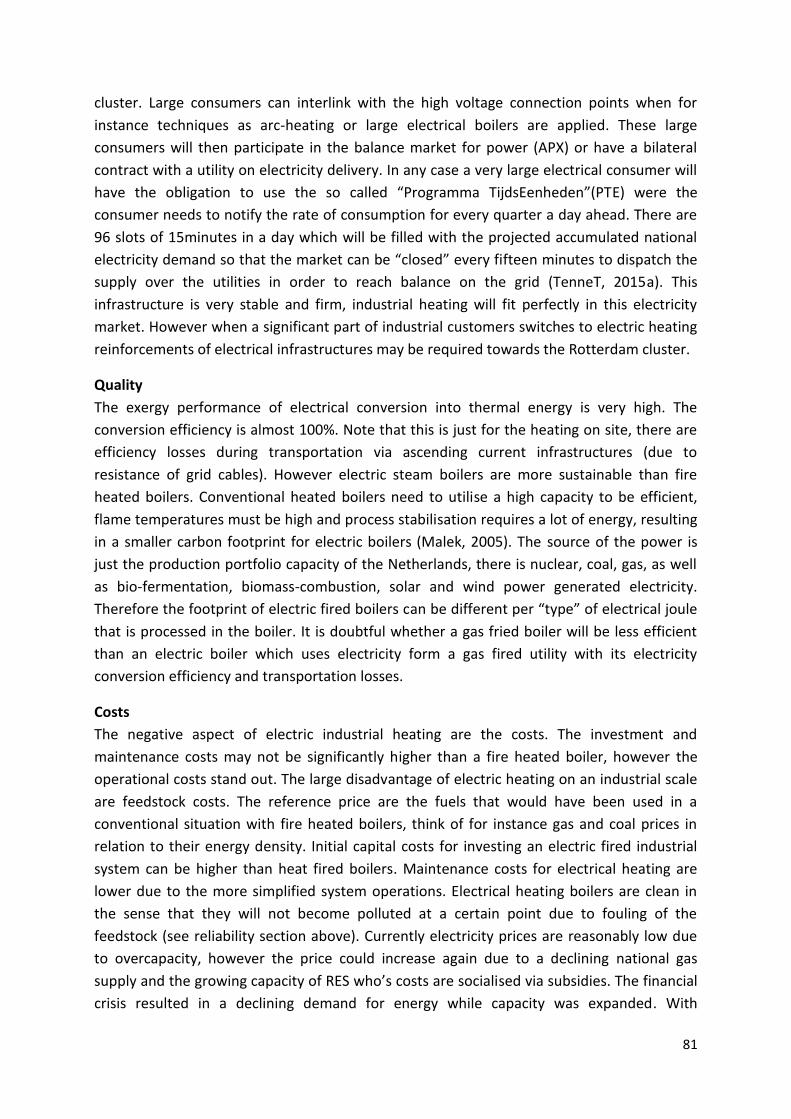
81
cluster. Large consumers can interlink with the high voltage connection points when for
instance techniques as arc-heating or large electrical boilers are applied. These large
consumers will then participate in the balance market for power (APX) or have a bilateral
contract with a utility on electricity delivery. In any case a very large electrical consumer will
have the obligation to use the so called “Programma TijdsEenheden”(PTE) were the
consumer needs to notify the rate of consumption for every quarter a day ahead. There are
96 slots of 15minutes in a day which will be filled with the projected accumulated national
electricity demand so that the market can be “closed” every fifteen minutes to dispatch the
supply over the utilities in order to reach balance on the grid (TenneT, 2015a). This
infrastructure is very stable and firm, industrial heating will fit perfectly in this electricity
market. However when a significant part of industrial customers switches to electric heating
reinforcements of electrical infrastructures may be required towards the Rotterdam cluster.
Quality
The exergy performance of electrical conversion into thermal energy is very high. The
conversion efficiency is almost 100%. Note that this is just for the heating on site, there are
efficiency losses during transportation via ascending current infrastructures (due to
resistance of grid cables). However electric steam boilers are more sustainable than fire
heated boilers. Conventional heated boilers need to utilise a high capacity to be efficient,
flame temperatures must be high and process stabilisation requires a lot of energy, resulting
in a smaller carbon footprint for electric boilers (Malek, 2005). The source of the power is
just the production portfolio capacity of the Netherlands, there is nuclear, coal, gas, as well
as bio-fermentation, biomass-combustion, solar and wind power generated electricity.
Therefore the footprint of electric fired boilers can be different per “type” of electrical joule
that is processed in the boiler. It is doubtful whether a gas fried boiler will be less efficient
than an electric boiler which uses electricity form a gas fired utility with its electricity
conversion efficiency and transportation losses.
Costs
The negative aspect of electric industrial heating are the costs. The investment and
maintenance costs may not be significantly higher than a fire heated boiler, however the
operational costs stand out. The large disadvantage of electric heating on an industrial scale
are feedstock costs. The reference price are the fuels that would have been used in a
conventional situation with fire heated boilers, think of for instance gas and coal prices in
relation to their energy density. Initial capital costs for investing an electric fired industrial
system can be higher than heat fired boilers. Maintenance costs for electrical heating are
lower due to the more simplified system operations. Electrical heating boilers are clean in
the sense that they will not become polluted at a certain point due to fouling of the
feedstock (see reliability section above). Currently electricity prices are reasonably low due
to overcapacity, however the price could increase again due to a declining national gas
supply and the growing capacity of RES who’s costs are socialised via subsidies. The financial
crisis resulted in a declining demand for energy while capacity was expanded. With
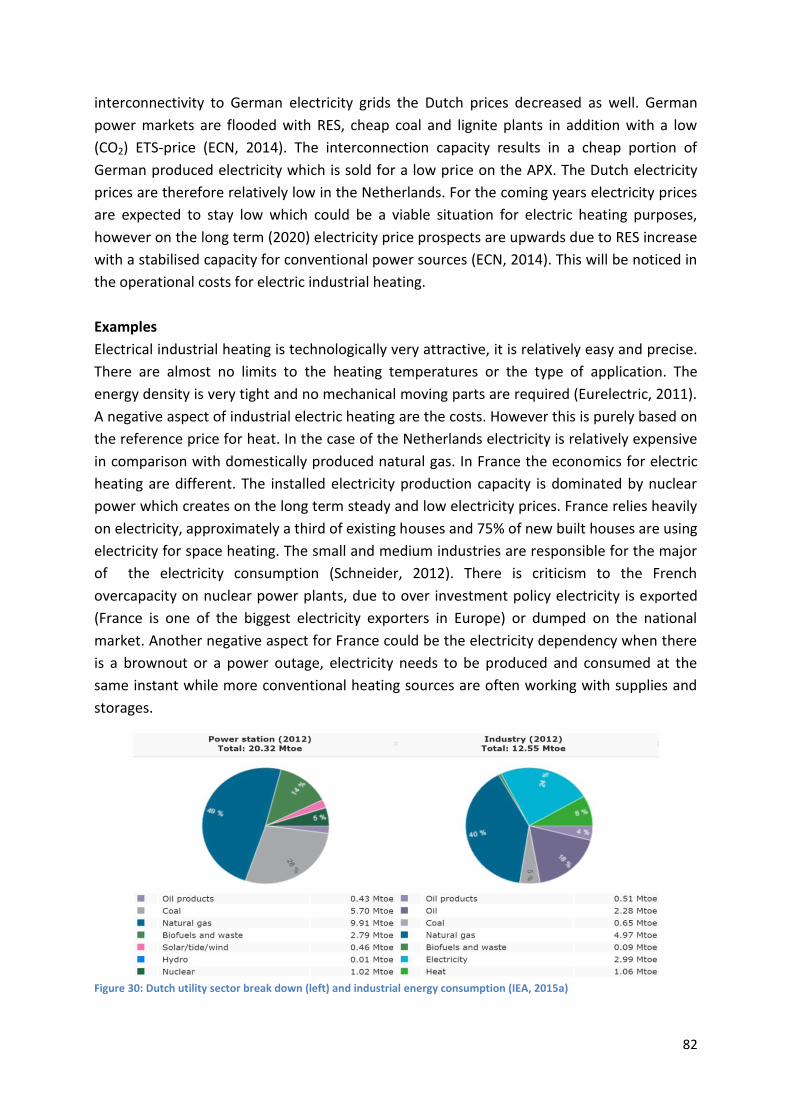
82
interconnectivity to German electricity grids the Dutch prices decreased as well. German
power markets are flooded with RES, cheap coal and lignite plants in addition with a low
(CO2) ETS-price (ECN, 2014). The interconnection capacity results in a cheap portion of
German produced electricity which is sold for a low price on the APX. The Dutch electricity
prices are therefore relatively low in the Netherlands. For the coming years electricity prices
are expected to stay low which could be a viable situation for electric heating purposes,
however on the long term (2020) electricity price prospects are upwards due to RES increase
with a stabilised capacity for conventional power sources (ECN, 2014). This will be noticed in
the operational costs for electric industrial heating.
Examples
Electrical industrial heating is technologically very attractive, it is relatively easy and precise.
There are almost no limits to the heating temperatures or the type of application. The
energy density is very tight and no mechanical moving parts are required (Eurelectric, 2011).
A negative aspect of industrial electric heating are the costs. However this is purely based on
the reference price for heat. In the case of the Netherlands electricity is relatively expensive
in comparison with domestically produced natural gas. In France the economics for electric
heating are different. The installed electricity production capacity is dominated by nuclear
power which creates on the long term steady and low electricity prices. France relies heavily
on electricity, approximately a third of existing houses and 75% of new built houses are using
electricity for space heating. The small and medium industries are responsible for the major
of the electricity consumption (Schneider, 2012). There is criticism to the French
overcapacity on nuclear power plants, due to over investment policy electricity is exported
(France is one of the biggest electricity exporters in Europe) or dumped on the national
market. Another negative aspect for France could be the electricity dependency when there
is a brownout or a power outage, electricity needs to be produced and consumed at the
same instant while more conventional heating sources are often working with supplies and
storages.
Figure 30: Dutch utility sector break down (left) and industrial energy consumption (IEA, 2015a)
83
Figure 30 shows two pie charts with IEA data of the Dutch utility sector breakdown and the
final industrial energy consumption portfolio. The Netherlands uses many natural gas and
coal in their power sector and just 5% nuclear energy. On the other hand we see the same
pie charts for France in figure 31, where the utility sector is dominated with an 83% nuclear
power generation share. Note that the power sector in the Netherlands is “only” 20.32Mtoe
whereas the French yearly electricity production is 133.8Mtoe, which is six times as big.
Figure 31: French utility sector break down (left) and industrial energy consumption (IEA, 2015a)
On the right hand side of figures 30 and 31 the national total industrial final energy
consumption is shown for the Netherlands and France respectively. The comparison of these
two pie charts are showing the influence of the utility sector per country on the industrial
organisation and their energy portfolio. The Netherlands use 40% natural gas and 24%
electricity among others while France use up to 35% of electricity and 30% natural gas. Note
that this covers the whole industry, the (petro)chemical industry will be compared in the
section underneath. Remarkably the complete French industry consumes up to 27.9Mtoe
while the Dutch industry consumes 12.55Mtoe. When this is compared with the utility
sectors there is a large difference, the French electricity production is nearly 6 times as big
while the whole industry is only two times as big as the Netherlands in terms of energy
consumption, which seems disproportional.
It becomes even more remarkable when the focus is made to just the chemical and
petrochemical industry of both countries. First of all the size is comparable, 5.3Mtoe and
6.03Mtoe which is completely disproportionate with France’s 66mln inhabitants versus the
nearly 17mln inhabitants of the Netherlands. The refining capacity is approximately the
same (France 61.8Mtoe versus 58.77 Mtoe for the Netherlands), which for the case of
France is almost completely utilised for supplying fuels for own transportation needs while
the Netherlands export many oil products as well (IEA, 2015a). Figure 32 depicts the energy
consumption breakdown of the (petro)chemical industries of both countries.

84
Figure 32: French and Dutch (Petro)chemical industry energy consumption breakdown (IEA, 2015a)
Next to the industry size the energy portfolio diversification is remarkable as well. Whereas
the Dutch energy consumption for the petrochemical sector is to a large extent fed with oil
and natural gas, the French petrochemical sector is to a large extent fed with electricity and
natural gas. The largest difference is the intake of crude oil which almost 2.16Mtoe and
France consumes nearly nothing. France does consume many oil-product (0.5Mtoe) in
comparison with the Netherlands (0.06Mtoe). Another remarkable difference is the
consumption of coal in the French (petro)chemical sector. In the Netherlands 13% of the
industrial energy demand is supplied with heat, whereas France consumes not heat as
system input (IEA, 2015a). Against all expectations, France consumes more gas in its
(petro)chemical sector than the Netherlands, in absolute numbers, and percentage wise.
Statistically there is a difference, because the Netherlands also consumes natural gas via the
production process of heat by CHP units.
However, the main difference is the substitute of electricity (34% in France) with heat in the
Netherlands (13% of heat and 18% electricity add up to 31%). The French electricity
consumption in the (petro)chemical industry is to proportion exactly twice the size of the
Dutch rate of electricity usage (IEA, 2015a). For industrial heating purposes in the
Rotterdam cluster this offers potential. It seems to be technically possible to partly electrify
such industry at least till twice the rate of current electricity usage in the Netherlands.
However there is a remark, the French (petro)chemical industry is very small in relation to
their utility sector which has low electricity prices due to large overcapacities. If the
Netherlands would electrify the (petro)chemical industry from 18% to 34% it would have a
much larger impact on its power generation sector.
85
6.5 Conclusion
This chapter is centred around the following research question:
"How can the industrial heating demand of the cluster be fulfilled by other means?”
Answering this question was not straightforward due to its vastness, there are many
alternative means to fulfil industrial heating demands. Several techniques are very promising
for delivering industrial quality heat (above 100°C) in the Netherlands. The investigated
technologies were limited to the pillars of the Warmtevisie by minister Kamp; biomass
combustion and biomass fermentation (biogas), geothermal energy, in addition
electrification was added to the scope. These technologies were tested on the criteria from
chapter 3; capacity, reliability, availability, infrastructure, quality and costs. When possible
examples were given of projects within the Netherlands or comparing projects abroad on
these techniques.
Biomass combustion is a potential source for industrial heating. Technically multiple
combustion technologies and different feedstocks are proven. Current boiler capacity can
exceed 500MWth. An expected 20-30PJ could be established with biomass for industrial
steam production by 2020 (Kamp, 2015). The most cost effective and efficient means to
produce industrial pressurised steam with biomass combustion is burning wood pellets with
a high energy density and homogeneous feedstock. This can be done in a pure form or by co-
combustion in a coal fired power plant. Biomass combustion can reach high temperatures
(Platform BioEnergie, 2015). To some extent biomass for combustion is present in the
Netherlands, however would pellets are internationally traded as a commodity. When 30%
of the Dutch energy demand by 2030 would be supplied with biomass it requires 3.5mln
hectares. To put this in contrast the Netherlands has a land surface of 3.3mln hectares
(Krebbekx, et al., 2010). The energetic efficiency of biomass combustion is fairly good when
heat is produced, in fact all energy from organic material that will be used to produce heat
will be used effectively. However a significant barrier is the relatively high costs for bio-heat.
In most of the cases bioenergy cannot compete on purely economic terms with conventional
technologies due to fuel costs and energy density (IEA, 2007). Nevertheless decarbonising
the industrial heat supply can partly be realised with medium/large scale biomass
combustion which might require government subsidies. The heat demand of the Rotterdam
cluster is 149PJ on a yearly basis which is still far out of reach when taking into account the
potential 20-30PJ of steam production by 2020.
Biomass fermentation into biogas is another method to produce industrial heating
indirectly. Biogas can be combusted on site to produce heat or it can be upgraded to
Groningen gas quality (green gas) and injected to the gas transmission infrastructure.
Biomass fermentation and upgrading can be seen as just another type of gas flowing through
the national gas grid, however, it is another means for industrial heating. Especially when
biogas on a larger scale could be produced, in that respect it is fairly different than for
instance LNG imports, which is still gas, only from another location. The calorific value of
biogas is comparable to Groningen gas after it is upgraded to green gas by blending in

86
regular gas until the proportion of CO2 to CH4 is sufficient (RVO, 2007). Green gas is very
suitable for industrial heating purposes and no different energetic value from regular gas, it
is just another commodity with a quality margin in a certain bandwidth. Infrastructural
requirements are necessary when inserting biogas into the gas grid. Clustering of biomass
fermentation facilities can induce a joint network for biogas (which is sour and corrosive) to
blend it into the gas grid centrally. In addition biogas is relatively clean and less noxious than
other fossil fuel equivalents. The potential for biomass fermentation is expected to be
3.7Bcm of biogas (or 2.2Bcm of Groningen gas or green gas) by 2030. The biogas production
on a yearly basis would then be approximately 77PJ (ECN, et al., 2014). For potential future
energy production this is already an improvement in comparison with biomass combustion.
However from an economical perspective it seems unlikely that biogas production on a large
scale will be implemented for industrial heating since most of the biogas fermentation
projects are booking bad financial results. A study of biogas fermentation facilities within the
Netherlands has shown that on average the revenues for producing biogas is for 62%
subsidised (Velghe & Wierinck, 2013). There are projects that perform better and there is a
learning curve which could make biomass fermentation cheaper. Next to small scale farmers
there are also industrial scale biogas producers which potentially could produce biogas more
efficiently. Concluding it is all about alternatives, in the case of biogas the reference price is
set by natural gas. Green gas is much more expensive than natural gas, however it could be
more attractive in comparison with other heating alternatives such as wind powered
industrial heating.
Geothermal energy is a very suitable technique for recovering industrial heat. Geothermal
drilling wells have a temperature gradient of 30°C per kilometre. To reach 130°C, a drilling
well of approximately 4000meters is required (Lako, et al., 2011). Ultra-deep geothermal
heat recovery wells, also Engineered Geothermal Systems (EGSs), are systems with a higher
operating temperature and capacity than deep geothermal wells. Both technologies deep
(500-4500m) and ultra-deep (5000m onwards) geothermal heat recovery are of interest for
industrial heating in the Rotterdam cluster. The capacity of geothermal wells increases with
the depth, along with the efficiency of heat recovery and potential electricity production.
When there is temperature difference (∆T) of for instance 90°C heat production capacities
are already up to 15.7MWth for a single well (Lako, et al., 2011). Drilling to depths of six to
ten kilometres deep steam temperatures can reach up to 350°C with electricity production
efficiencies of 25% (Sandt, 2010). Geothermal heat recovery projects tend to be a reliable
supply source of energy, there are some failures that could occur e.g. fouling of the system
due to salt sedimentation, which requires extra maintenance. Another technicality is that in
some cases radioactivity is measured, however only on a very small scale (Lako, et al., 2011).
Deep geothermal heat projects are applicable almost everywhere within the Netherlands,
some areas are more efficient due to the formation of underground layers. Ultra-deep
geothermal energy recovery is almost independent to geographical location, which makes it
attractive for industrial heating purposes because no infrastructures would be required.
Geothermal energy recovery is currently still small in the Netherlands, approximately 10
87
projects produce 2,9PJ in total on a yearly basis (RVO, 2015a). Potentials for heat recovery
are very promising, ultra-deep geothermic potential (deeper than 5km) is applicable almost
anywhere in the Netherlands. At least 20% of our national primary energy consumption can
be replaced with geothermal energy in 2050 (IF WEP, Ecofys, TNO, 2011). Note: 20%
potential is the worst case scenario in this study, which is still a staggering 411PJ, the
Rotterdam cluster uses 149PJ of heat in total on a yearly basis. In addition geothermal
energy is deployable as baseload and as peak load. The costs for geothermal heat are
relatively cheap for deeper projects. Figure 27 above shows cost price projections of deep
geothermal heat recovery in comparison to the natural gas price. Steam production at ultra-
deep geothermal recovery is even more economically viable. Steam at a level of 230°C can
be produced at a cost price of 8.6 €/GJ, steam production with a gas fired furnace is
approximately 8.5 €/GJ (Lako, et al., 2011). Industrial facilities in the Rotterdam cluster use
the reference price for conventional heating technologies (boiler- or furnace-parity). For the
case of natural gas fired furnaces the reference heating price is low since the gas price is low
currently with an additional low ETS price. On a positive note, the cost price of ultra-deep
heat recovery is expected to decrease due to the learning curve (Lako, et al., 2011).
Electrification of industrial heating is an interesting technology as well. Electrification of
heating has many advantages; precision control of temperature and distribution of heat
energy. Electrical heating can reach temperatures higher than achievable with chemical
combustion, also the energy density is very high. Electrical heating devices can be built in
any required size and can be located anywhere within a plant. The electric heating processes
are generally clean, quiet, and do not emit much by-product heat to the surroundings. The
conversion to heat on site occurs at an efficiency of almost 100%, however there are
efficiency losses during transportation. The initial conversion producing electricity can be
done in many ways. It is cleaner to directly combust natural gas for heating instead of
converting it to electricity to produce heat. The reliability and safety of electric steam boilers
is very high. It is a mature and proven technique which is applied both, on large and small
scale, throughout industries globally. The supply of electricity in the Netherlands is a very
reliable source, the Dutch transmission grid has one of the lowest intermittencies of the
world. Infrastructural requirements are hardly necessary, industrial heating will fit perfectly
within the existing electricity market. However, when a significant number of industrial
customers switch to electric heating, reinforcements of electrical infrastructures may be
required towards the Rotterdam cluster. A negative aspect of industrial electric heating are
the costs, this is based on the reference price for energy. In the case of the Netherlands
electricity is relatively expensive in comparison with domestically produced natural gas, in
for instance France the economics for electric heating are different. The Netherlands use a
high share of natural gas and coal to generate electricity, just 5% of the power generating
capacity is nuclear energy. On the other hand the French utility sector is dominated with an
83% nuclear power generation share. The Dutch utility sector produces 20.32Mtoe, whereas
the French yearly electricity production is 133.8Mtoe, which is six times as big. Electricity
prices in France are very low since there is nuclear overcapacity, power is exported or
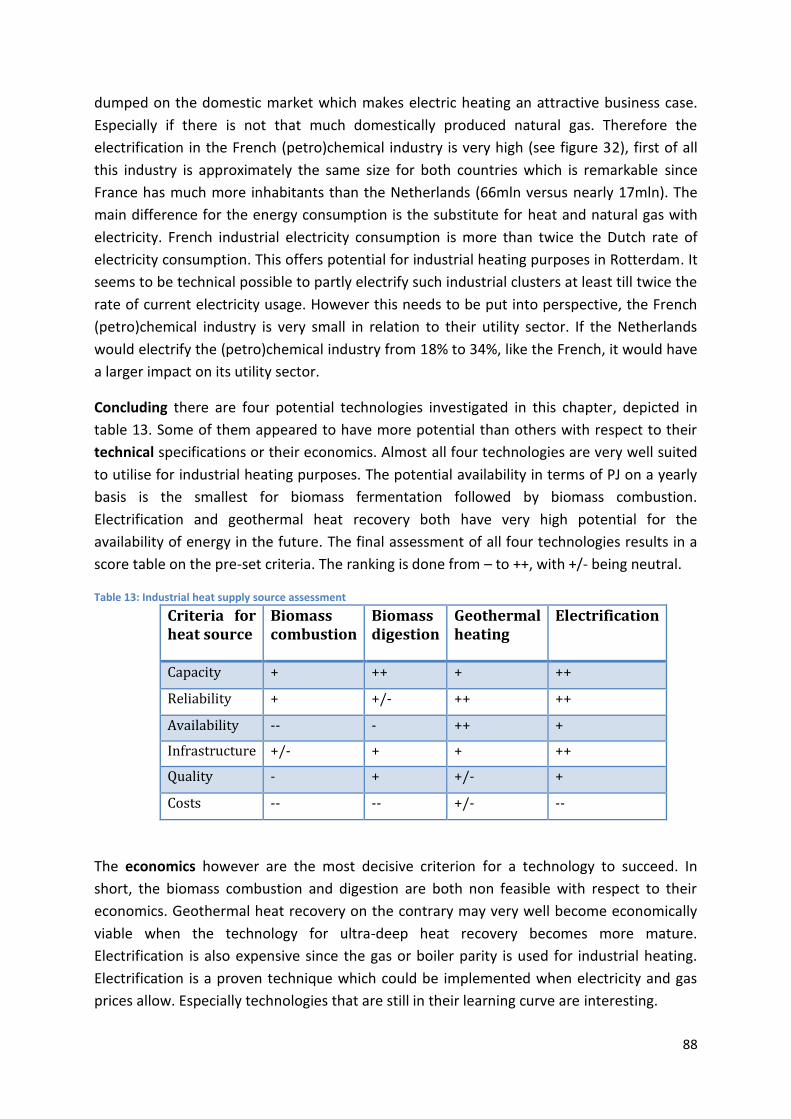
88
dumped on the domestic market which makes electric heating an attractive business case.
Especially if there is not that much domestically produced natural gas. Therefore the
electrification in the French (petro)chemical industry is very high (see figure 32), first of all
this industry is approximately the same size for both countries which is remarkable since
France has much more inhabitants than the Netherlands (66mln versus nearly 17mln). The
main difference for the energy consumption is the substitute for heat and natural gas with
electricity. French industrial electricity consumption is more than twice the Dutch rate of
electricity consumption. This offers potential for industrial heating purposes in Rotterdam. It
seems to be technical possible to partly electrify such industrial clusters at least till twice the
rate of current electricity usage. However this needs to be put into perspective, the French
(petro)chemical industry is very small in relation to their utility sector. If the Netherlands
would electrify the (petro)chemical industry from 18% to 34%, like the French, it would have
a larger impact on its utility sector.
Concluding there are four potential technologies investigated in this chapter, depicted in
table 13. Some of them appeared to have more potential than others with respect to their
technical specifications or their economics. Almost all four technologies are very well suited
to utilise for industrial heating purposes. The potential availability in terms of PJ on a yearly
basis is the smallest for biomass fermentation followed by biomass combustion.
Electrification and geothermal heat recovery both have very high potential for the
availability of energy in the future. The final assessment of all four technologies results in a
score table on the pre-set criteria. The ranking is done from – to ++, with +/- being neutral.
Table 13: Industrial heat supply source assessment Criteria for heat source
Biomass combustion
Biomass digestion
Geothermal heating
Electrification
Capacity + ++ + ++
Reliability + +/- ++ ++
Availability -- - ++ +
Infrastructure +/- + + ++
Quality - + +/- +
Costs -- -- +/- --
The economics however are the most decisive criterion for a technology to succeed. In
short, the biomass combustion and digestion are both non feasible with respect to their
economics. Geothermal heat recovery on the contrary may very well become economically
viable when the technology for ultra-deep heat recovery becomes more mature.
Electrification is also expensive since the gas or boiler parity is used for industrial heating.
Electrification is a proven technique which could be implemented when electricity and gas
prices allow. Especially technologies that are still in their learning curve are interesting.
89
Some of these technologies operate due to government subsidy and other institutional
measures, therefore the choice for a certain technology is indirectly policy driven.
Geothermal energy for industrial heating purposes could be very well likely in the near/long
term future. However it is not necessary to fully commit to one specific alternative
technology for industrial heating, a portfolio of multiple alternatives create a more stable
and resilient output, also in terms of spreading the risks for the Rotterdam cluster. This could
be both, driven by technologies, or pushed by policies.
In addition it needs to be emphasized that these four technologies are investigated due to
their potential as substitutes. Sticking to the same technology for industrial heating is a
possibility as well, on the long term this would imply additional high calorific gas imports
which is not a problem per se. The option for importing natural gas and the implications due
to diversity risks and security of supply are stressed in paragraph 9.2 and 9.3.

90
Chapter 7: Heat market potential in the
Rotterdam cluster and its configuration
This chapter is centred around the following research question: How will a future heat
market potentially look like when further elaborated? The answer to this is explorative, a
sketch what such a market could look like will be made. This sketch will include the potential
market mechanism for heat trading. Market models for other commodities such as
electricity and gas will be used for their applicability on heat pricing. Paragraph 7.1 will first
address the type of heat, which could be traded as a commodity. Does this include
pressurised steam or only warm water? Paragraph 7.2 focusses on the costs and pricing of
heat. Paragraph 7.3 applies the theoretical framework of critical transactions in order to
assess a suitable coordination mechanism for the clusters heat infrastructure. In addition
paragraph 7.4 the market mechanism models of natural gas and electricity trading are
distinguished, and in paragraph 7.5 these models will be applied to heat trading. This is done
from a physical, economical and an institutional perspective. It is clear that a heat market
has many institutional hurdles to overcome; distribution operators, Third Party Access (TPA),
regulations, contractual arrangements and trading platforms.
7.1 Heat markets in combination with industrial clusters
For a heat market in the Rotterdam cluster the quality of heat is important. Process industry
located in the Rotterdam cluster needs industrial quality heat, pressurised steam, as well as
residual heat, which is heated water. In figure 25 the heat quality profile is presented,
approximately 15% of the heat demand in the cluster is between 100°C and 200°C, the rest
of the heat demand quality is higher, temperatures above 400°C.
Residual heat is typically heated water with temperatures between 90°C and 120°C
depending on the ambient temperature (ECOFYS, 2014). This water is kept under pressure to
stay in a liquid phase. Rotterdam has infrastructure for residual heat throughout the cluster
since 2013 (Verhoeven, 2015 interview). This network was described in paragraph 4.2.
Affluent industrial heat is transported to the city centre to heat hospitals and residential
facilities. In the Rotterdam cluster there are also pressurised steam pipeline. However these
are much shorter due to high infrastructure costs and the large heat losses. These networks
operate typically at pressures of 40bar and temperatures around 400°C. This industrial
process steam is mostly produced on site by means of boilers or CHP units. Sometimes this
heat is produced elsewhere like the waste incinerator located at Rozenburg. The industrial
site Oosterhorn in Delfzijl has an industrial steam network as well, the waste incinerator of
E.On produces two qualities of steam, 290°C at 23bar and 210°C at 12bar respectively. The
total length of the two steam pipelines is 3.3km (RVO, 2011). The customers connected are
process industry facilities However, these clients are long term customers and require
process reliability. The waste incinerator provides reliable and cheaper heat than producing

91
it themselves, this led to the decrease in the amount of installed steam kettle and boiler
capacity (Kamp, 2015).
The difference with residual heat and pressurised steam is the quality of heat and its
possible utilisation. Lower heat qualities enable more possibilities by means of storage and
interchangeability. In Rotterdam residual heat can be stored in large vessels or buffer
stations. This low quality heat can be stored for approximately eight hours at temperatures
of around 70°C and can later on be upgraded by a booster station for injection into the heat
network.
Higher quality heat is in most of the cases directly combined with continuous processes. All
pressurised steam will be directly consumed the instant it is produced. Storage of high
temperature pressurised steam is not possible in large quantities due to energy losses.
Production and consumption facilities are located nearby and have a highly integrated
synergy by means of communication and exchange of products. Both type of heat qualities,
low and high, are exchanged in the Rotterdam cluster via remuneration schemes and
infrastructures.
Since this chapter focusses on a heat market or a heat market mechanism in the Rotterdam
cluster, it is sensible to focus on the low quality heat as a commodity because of the
tradability. High quality heat exchange is only possible via contracts and steady production
and demand rates while nearby siting is crucial. The contracts for such high grade heat are
often bilateral and set up for long term obligations with remuneration schemes for the
infrastructural sunk costs. Markets with, for instance, third party access (TPA) have a bigger
potential when the commodity is more flexible in trading and dispatching, like low quality
heat (warm water) instead of superheated steam.
The potential for a low quality heat exchange in the Rotterdam cluster is growing. Multiple
CHP units are currently closing, a reduction of 37,5% of CHP unit capacity is expected to
disappear by 2020 (Davidse Consultancy, 2012). In the month of November this year the
Rijnmond Energy CHP unit bankrupted, which delivered steam to Shell (Dijk, 2015). The
residual heat of processes which were initially supplied by CHP units, is indirectly a source of
low grade heat. Yet this supply will gradually decrease given shrinking CHP capacity.
Expansion of the current infrastructure for low grade industrial residual heat is planned to
connect the cluster with the city of Rotterdam. These planned interconnections of multiple
industrial sites to the heat network is not just initialised for delivering single direction heat
flows from cluster to the city. The interesting aspect of this heat network development is the
growing demand for low grade heat by the process industry too.
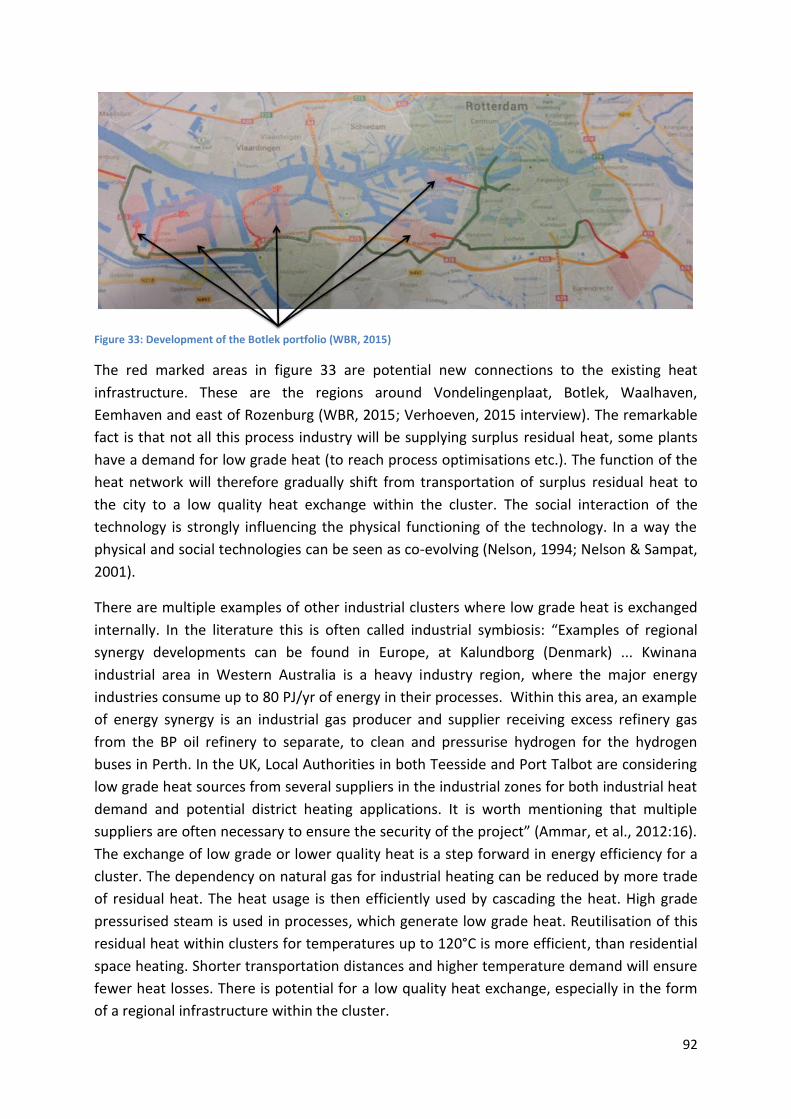
92
Figure 33: Development of the Botlek portfolio (WBR, 2015)
The red marked areas in figure 33 are potential new connections to the existing heat
infrastructure. These are the regions around Vondelingenplaat, Botlek, Waalhaven,
Eemhaven and east of Rozenburg (WBR, 2015; Verhoeven, 2015 interview). The remarkable
fact is that not all this process industry will be supplying surplus residual heat, some plants
have a demand for low grade heat (to reach process optimisations etc.). The function of the
heat network will therefore gradually shift from transportation of surplus residual heat to
the city to a low quality heat exchange within the cluster. The social interaction of the
technology is strongly influencing the physical functioning of the technology. In a way the
physical and social technologies can be seen as co-evolving (Nelson, 1994; Nelson & Sampat,
2001).
There are multiple examples of other industrial clusters where low grade heat is exchanged
internally. In the literature this is often called industrial symbiosis: “Examples of regional
synergy developments can be found in Europe, at Kalundborg (Denmark) ... Kwinana
industrial area in Western Australia is a heavy industry region, where the major energy
industries consume up to 80 PJ/yr of energy in their processes. Within this area, an example
of energy synergy is an industrial gas producer and supplier receiving excess refinery gas
from the BP oil refinery to separate, to clean and pressurise hydrogen for the hydrogen
buses in Perth. In the UK, Local Authorities in both Teesside and Port Talbot are considering
low grade heat sources from several suppliers in the industrial zones for both industrial heat
demand and potential district heating applications. It is worth mentioning that multiple
suppliers are often necessary to ensure the security of the project” (Ammar, et al., 2012:16).
The exchange of low grade or lower quality heat is a step forward in energy efficiency for a
cluster. The dependency on natural gas for industrial heating can be reduced by more trade
of residual heat. The heat usage is then efficiently used by cascading the heat. High grade
pressurised steam is used in processes, which generate low grade heat. Reutilisation of this
residual heat within clusters for temperatures up to 120°C is more efficient, than residential
space heating. Shorter transportation distances and higher temperature demand will ensure
fewer heat losses. There is potential for a low quality heat exchange, especially in the form
of a regional infrastructure within the cluster.
93
7.2 Cost and pricing of heat
The costs of a heat supply can be categorised in several cost drivers. There are mainly two
types of costs; the infrastructure and the heat as a commodity. The costs for heat supply can
also be separated by; supply related costs and non-supply related costs. The first is to a large
extent the cost price of heat production, e.g. the fuels for heat production or the price for
heat supply in a heat network. The second cost type is mostly capital costs (depreciation and
financing), maintenance cost and overhead costs.
A breakdown of the main cost drivers for heat delivery related to infrastructure are (CE Delft,
2009:4):
Initial investment costs; material, salaries, permits etc.
The age of the infrastructure and the method of depreciation
The cost of capital which are gravely influenced by the size and type of financing and
the risk profiles of the heat producers and the heat infrastructure
The size of the infrastructure alongside project specific heat circumstances
And for the operational cost drivers:
The origin of the produced heat (reference price; coal, oil, gas, biomass etc.)
Specific to each heat delivery contract with the producer of heat
The nature and the extent of heat delivery throughout the grid
The cost of a heat infrastructure varies strongly with type of customers connected to the
grid. The transportation of residual heat from source to sink (the recipients) is more or less
comparable for each project with respect to infrastructure. The difference is the distribution
of heat. When residential areas are supplied with industrial residual heat there must be a
complete distribution network. In comparison the residual heat infrastructure in the
Rotterdam cluster, is composed of a few additional large industrial customers and suppliers,
which exchange industrial heat. Nevertheless, the costs for the main transportation grid of
heat is costly. Pipeline installation costs can add up to approximately €3mln per kilometre.
Important variables for an infrastructural investment are the payback time and the capacity.
Capacities in €/MW are more important in this case than the commodity in GJ/year (WBR,
2015; Verhoeven, 2015 interview). Each stakeholder has a separate coupling or connection
to the heat transportation pipeline (suppliers and consumers). The infrastructure is two
directional to create a closed cycle with a warm or cold water flow back. The financing for
such infrastructural connections is challenging; which stakeholder pays for which section and
to what extent. Private investors that are investigating such investments in the Rotterdam
cluster in the heat network are aiming for payback periods of five years (WBR, 2015). Steam
between 120-250°C can be transported over a distance of 3km to 5km, while pressurized
heated water between 90-175°C can be transported over a distance of 30km (Ammar, et al.,
2012). There are several factors that play a role when assessing how far heat can be
transported. “If heat is assumed to be transported via a pipe, the heat loss factor … depends
on the pipe material and the efficiency of its insulation, pipe diameter and the temperature
94
of the fluid circulating in the pipe. The profitability of any heat recovery project will also
depend upon the cost invested in heat transportation, the total cost being the sum of the
pipeline installation, heat losses and pumping cost” (Ammar, et al., 2012:16).
Full utilisation of residual heat exchange is appealing since the infrastructural remuneration
is a priority. Sharp pricing of residual heat is therefore a requirement. Heat pricing is mostly
done by reference pricing, usually linked to natural gas (TTF price) or the oil price etc. Also in
industry, to reach a certain price level to compete with alternative fuels, boiler, furnace or
kettle-parity needs to be reached. This implies a price level for heat that is comparable with
the price of produced heat by boilers or other devices. Preferably slightly more competitively
priced than boiler-parity levels to make residual heat to be attractive for investors.
Current pricing of residual heat (pressurized heated water) which is in most cases delivered
to residential areas and commercial buildings is done by the NMDA-principle (Niet Meer Dan
Anders which is translated as Not More Than Usual). This type of domestic heat pricing
protects consumers against heat producers monopoly pricing. The principle will guarantee a
heat price which is the same for a joule generated heat as with for instance a natural gas
boiler. With this principle the price of domestic heat is more or less coupled with a
reference to the gas price (Kamp, 2015; CE Delft, 2009). In addition to this principle, there is
the tariff calculation of a reasonable price. The reasonable price is defined by law, in this
case the law regarding delivery of heat to households (Warmtewet). The law enables the
determination of a reasonable price for heat which consists out of the cost price allocated to
heat production and a reasonable return to cover the cost of capital (Kamp, 2015; Overheid,
2015CE Delft, 2009).
Taxes on carbon emission can be included in the pricing of heat as well. The contract for heat
delivery is to a large extent crucial for passing on the energy tax equivalent to the ratio of
the fuel used to produce the heat. When a heat contractor produces his own heat this party
is obliged to pay energy taxes to the deliverer of the fuel source. This is of course highly
determined by the type of fuel that is used to produce residual heat, and also how much
emissions are selected to residual heat in comparison with the whole process of fuel
combustion. There are exemptions as well, heat from gas fired CHP units are regarded as a
clean fuel, since it is highly efficient in terms of energy utilisation. Residual heat produced by
a gas fired CHP unit is therefore free of carbon taxation (Overheid, 2015). When heat is
bought from an external party the tax tariffs can be charged in the total heat price.
Nevertheless, the residual heat delivery which is covered by the Warmtewet is only meant
for customers up to 1000kW of heat capacity demand. Residential customers fall within the
scope of approximately 25-35kW of heat consumption. The larger commercial and large
industrial customers for residual heat are not covered under a collective measure, which
means every heat delivery contract is open for negotiations. There is no heat price direction
proposed by EnergyNed whatsoever (CE Delft, 2009). Which makes it interesting for this
95
chapter to analyse what an ideal market mechanism or coordination model could be for the
Rotterdam cluster low grade heat exchange.
7.3 Theoretical framework with modes of coordinating the Rotterdam
heat infrastructure
An infrastructure such as the heat network in the Rotterdam cluster has some peculiar
organisational features. Such an infrastructure knows lock-in effects, there is potential third
party access, there are ownership interests. Therefore a theoretic perspective is included
which will be used as a framework aligning organisational and technological aspects of a
heat network.
The theory on critical transactions and modes of organisations regarding infrastructures is
applied in this section (Kunneke, et al., 2010). This theory is focussed around critical
transactions, that are essential for the functioning of infrastructures and the organisation
behind it. “In other words: if critical transactions are not well coordinated, some
technological critical functions of the systems are not satisfied so that the system severely
fails to deliver the expected services. We are interested in modes of organisation that
guarantee the coordination of critical transactions related to critical technical functions of
liberalised infrastructures”(Kunneke, et al., 2010:6)
In order to apply the theoretic framework by Kunneke on an infrastructure it needs to meet
certain criteria. The technical functioning of the infrastructure should include the aspects of;
reliability, safety, and security of supply. For the case of heat delivery throughout the cluster
these are all three present. The reliability aspect to deliver products at a specific place on a
given time is there. Safety is an issue associated with heat delivery that goes without saying,
the security of this service should be safe by all means. The security of supply characteristic
is definitely present with heat delivery. The demand for heat together with the heat network
are a project for the long term that need energy sources in the foreseeable future, which
implies security of supply aspects.
The criticality of the infrastructure functioning is strongly influenced by the technical network externalities. Network criticality should at least occur by one of these two; critical assets (e.g. pipelines, pump stations) or critical system functions (e.g. dispatching of heat). The heat network in the Rotterdam cluster contains both aspects, which makes it highly suitable for this framework.
The framework as shown in the table has two dimensions; “scope of control” and “speed of adjustment”. The “scope of control” knows three levels; the system level, the subsystem level and the component level. This is a scale from a very extensive system, with far reaching technical complementarities, to component level, where for example a single pump station is the boundary of control.
The “speed of adjustment” involves time constraints of the mechanism. Critical control mechanisms need to be activated in a specific and often very short period of time. This is

96
decomposed in four time scales (in the table as Tx) differing from operational balancing to long term system innovation and transformation (Kunneke, 2011).
Table 14: Modes of organization to secure critical transactions of infrastructures (Kunneke, 2011:24)
With this framework coordination of the infrastructure can be satisfied by different governance styles, varying from system standardisations to contracting or even market competition. The heat exchange infrastructure of the Rotterdam cluster is regarded as one technical
network with bi-directional flows of warm pressurised water. This puts the heat
infrastructure in the first column, the scope of control of the heat infrastructure will be
needing governance as one system. A subsystem is not suitable since the heat infrastructure
is not subordinate to a larger system. Governance on a level of single components is not
practical when searching for a residual heat exchange mechanism for a complete cluster.
“At this level, investments are typically very specific since the associated technical control
mechanisms are unique and represent dedicated assets in the system … these investments
have a very long lifetime and the technical and economic conditions of the system are
difficult to predict. In addition, the extensive scope of control required and its accompanying
interdependence create opportunities for strategic behaviour for those who operate and
control these facilities” (Kunneke, 2011:24).
The “speed of adjustment” category is a bit more difficult to choose for a heat network. The
time span for a heat network to perform a feedback loop in system control differs. At a
certain point balancing is required, heat flows need to be standby to meet the demand for
residual heating in the process industry. Since low grade heat is storable for several hours
this balancing act is not on a very short notice as for instance the power market balancing.
Capacity utilisation has the same assumptions as operational balancing, however there is an
Scope of control Speed of Adjustment
System (requires directive intervention)
Subsystem (requires coordination)
Component (requires corroboration)
T0 Operational balancing (requires supervision)
Authoritative supervision (system operator)
Collaborative supervision (system regulator)
General framework conditions (system norms and standards)
T5 Capacity utilisation (requires monitoring)
Compulsory monitoring and enforced adjustment
Mutual monitoring and stimulated adjustment
Self-monitoring and voluntary adjustment
T15 Capacity allocation (requires facilitation)
Controlled allocation mechanism
Guided allocation mechanism
Competitive allocation mechanism
T50 System transformation and innovation (requires planning)
Directive planning Indicative planning Decentralised planning
97
addition. The capacity utilisation category facilitates a network with monitoring where
producers can choose to produce heat depending on the current price for heat. This
category is more suitable and has a timespan of a few hours to days. The next category
would only be an allocation mechanism, balancing and actual delivery of heat on the specific
infrastructure will be in need of a stricter governance than just facilitation of pipeline.
Compulsory monitoring and enforced adjustment requires monitoring of the operational
process of heat dispatching through the infrastructure. There are dedicated resources in
order to facilitate the networks services, think of storage facilities of warm water, pipelines
and booster stations. This lowers the degree of uncertainty due to reserve mechanisms that
prevents perverse behaviour of intentional heat deficits. Compulsory monitoring is the type
of coordination that corresponds most with the technical specifications of the Rotterdam
heat exchange infrastructure.
7.4 Pricing mechanisms gas and electricity trading
The theoretic framework of the preceding paragraph resulted a monitoring body to operate
the heat infrastructure. Since the Rotterdam cluster is facilitated with an infrastructure for
residual heat, which can potentially be used by industrial consumers in addition to
residential customers, it becomes interesting to analyse how heat prices could be
established. Prices can vary severely, due to the fuel price, carbon tax or other investments
made for heat exchange. Since the transportation infrastructure of industrial residual heat is
already present in the cluster, multiple parties are interested in a connection to this pipeline,
with multiple supplier interests to connect to the grid, Third Party Access (TPA) bears
interest. Two types of virtual trading platforms are described, the details function as
potential to learn lessons for governance of trading heat as a commodity.
Electricity market platform
The Dutch electricity market is a virtual market which ensures the balance between the
supply of electricity production and demand for electricity on the consumer side. The APX
Power NL was established in 1999 by TenneT and operates as an independent fully
electronic spot market offering distributors, producers, traders, brokers and industrial end-
users a trading platform. This virtual market sets a price for electricity between the
producers and the retailers of electricity; who in turn have a contract with the end
consumers. The electricity trading mechanism has already been explained briefly in
paragraph 6.4, where electrification of industrial heating is analysed as an alternative. From
an infrastructural perspective, the Netherlands has a very high interconnectivity rate. There
is a direct 380kV high voltage grid connection to the Rotterdam cluster. These large
consumers can directly participate on the Amsterdam Power Exchange (APX) for electricity
purchasing. To participate in this market mechanism a large electricity consumer will have
the obligation to use the so called “Programma TijdsEenheden”(PTE) where the consumer
needs to notify his consumption for every quarter a day ahead. There are 96 slots of
15minutes in a day which will be filled with the projected accumulated national electricity

98
demand so that the market can be “closed” every fifteen minutes to dispatch the supply of
the utilities in order to reach balance on the grid (TenneT, 2015a). The anonymous bids for a
specific capacity (in MW) in a timeslot for 15minutes are offered to the virtual trading
platform, this bidding takes place on the demand and the supply side. All bids are lined up
ranked by price, an demand and supply curve are being formed. The point where the curves
meet on the interface establishes a price for that time slot when it is cleared. This price for
electric capacity holds for all players regardless of their bid (VEMW, 2015).
The APX also has multiple options to market futures for electricity supply and price
guarantees and options to trade electricity capacity on the same day up till five minutes
prior to delivery. “On the Day-Ahead auction, trading takes place on one day for the delivery
of electricity the next day. Members submit their orders electronically, after which supply
and demand are compared and the market price is calculated for each hour of the following
day. Hourly contracts and flexible block contracts can be traded” (APX, 2015:1). Electricity is
the traded commodity which needs to be consumed directly upon production. Since
electricity cannot be stored, production needs to be consumed instantly. When serious
problems occur with the supply side (failing production plants) demand can be switched off
to reach balance on the grid. This intervention by the Transmission System Operator (TSO)
serves to prevent large power outages. Unbalances are also traded on the spot market and
expressed in €/MWh. Demand Side Response is growing, this is a new phenomenon since
smart meters and decentralised production and local storage become available. The
consumer has the ability to produce electricity as well, the flows of energy are becoming
lenient and grid balancing can shift to incentive driven electricity sales at certain price levels
or moments in a day. However, the capacity of decentralised storage and production is still
very limited. In all cases the commodity of electricity is equal, there a no quality differences
to the electric potential. A separation or distinction that can be made is the origin of
production of the electric MWh but this is still is not noticeable.
Gas market platform
The Dutch gas market trading mechanism is known by the Title Transfer Facility (TTF). The
TTF is also a virtual market that functions as a platform to trade gas which is already physical
present within the Dutch gas system, this is also called “entry-paid gas”. The gas molecules
that are flowing through the Dutch gas grid can easily change ownership (Gasunie, 2015c).
The actual trading of natural gas is done by digital notices on the TTF (nominations), which is
an electronic message stating the volume of gas transferred, the period, the gas quality and
the buying and selling parties. By submitting a nomination, an indication is given the
quantity of gas a party wishes to transport for each hour of the gas day (kWh/h) at a specific
network entry or exit point. Every member with a TTF subscription can trade and make
nominations on the market. There is also the possibility to trade anonymously via a gas
exchange (gasbeurs) that offers gas demand and supply, this exchange is the facilitator of
anonymous gas trade. Such gas trading deals require an additional subscription to the
Gasunie Transport Services (GTS). Multiple endexes (energy-indexes) are open for trading on
99
the TTF. This virtual market trades with short term physical flows of natural gas and longer
term futures contracts to hedge risks. A distinction between the forward- and the spot-
market, the maximum execution time of trading on the spot market, is 30 days ahead
whereas the forward market has possibilities to trade up to 41 months ahead (The ICE,
2015). “Initial matching takes place on the basis of the initial nominations of shippers
transferring gas to each other and of the lesser of rule matching rule. The confirmations get
the status “settled”. Nominations may be sent 400 days in advance. These will be matched
an ½ hour before the next full clock hour after receipt(GTS, 2015b:1).” The products are
divided into several categories; balance of day (BOD), day ahead (DA), working days next
week (WDNW), weekend, balance of month (BOM) and month ahead (MA). Not all trade
flows have a pre-set quantity of gas to be shipped, these so called “balance relations” are
arranged such that the traded quantity is determined by measuring allocations afterwards.
There are all sorts of variations possible with this type of trading, price caps, bandwidths,
quotas and minimal percentages of futures that have to be delivered physically (Gasunie,
2015c). The traded gas as a commodity is expressed in capacities and the amount of time
when this capacity has to be available. With this commodity quality can change, there are
fluctuations with the energetic value, GTS, the Transmission System Operator for gas is
responsible for realising unified gas qualities. “In principle, the quantities and qualities of gas
which market parties wished to feed into the network (from production and imports) and
withdraw from the network (for export and domestic consumption) are given for GTS. GTS
uses the conversion stations to provide for the resulting demand for quality conversion”
(ACM, 2007:26). The flows of natural gas are more tangible and easier measurable than
electricity transportation flows, however an average trader (more than 100 active at the TTF
on a regular day) has no clue where exactly the traded commodities are flowing within the
Dutch gas grid.
7.5 Suitable trading mechanisms from a physical, economic and
institutional perspective
Two market mechanisms have been described in the preceding paragraph, the electricity
APX mechanism and the gas TTF mechanism. Both market models are operating successfully
as a trading platform for their specific commodity. An interesting addition is the potential for
trading heat via one of these type of market models under the supervision of the monitoring
body resulting from paragraph 7.3. Heat exchange in the form of warm water (residual heat)
is often transported from industries to residential areas and commercial buildings. Industrial
size customers (i.e. process industrial plants) are a new segment for consumption of residual
heat which can lead to further process optimisations. The Warmtewet which applies for
residual heat delivery does not cover larger customers with heat consumptions over 1MW.
For comparison, the Rotterdam cluster consumes approximately 26PJ of residual heat
annually. This residual heat is produced by industrial process. When this total yearly residual
heat consumption amount is converted to a continuous whole year round process capacity,
it is comparable with 825MW and falls out of scope of the Warmtewet (Davidse Consultancy,
2012). EnergyNed did not propose any heat pricing directions whatsoever, every heat

100
delivery contract is open for negotiations. The residual heat delivered throughout the
Rotterdam cluster is arranged via bi- or multi-lateral contracts. There is no trading
mechanisms in place, which makes it interesting for this paragraph to assess whether the
two mechanisms described in paragraph 7.4 could be a valid market model for the
Rotterdam cluster low grade heat exchange. This forms a useful basis for assessing existing
market mechanisms on a newly created market. The assessment whether the commodity
residual heat is suitable for one of the specific market mechanisms will be approached from
three perspectives: physical, economical and institutional.
7.5.1 APX model versus residual heat commodity
Physically the commodity of heat differs strongly from residual heat. The properties of the
commodity are very influential for the power exchange platform. Electricity has no quality
differences with respect to joules, value or physical characteristics. The phenomenon of
electricity is not very tangible, the electrons are not traveling, they’re passing on an electric
potential, however nothing is physically moving. On top of that everything happens very fast
and has transmission velocity of nearly the speed of light. Residual heat on the other hand is
pressurised warm water that flows through insulated pipelines. The advantage of this low
grade heat quality is that it has fewer losses during transport and the physical properties
allow storage on a larger scale. The large difference of heat from electricity as a commodity
is the timeframe for consumption. Electricity potential has to be consumed at the same
instant when it is produced, whereas residual heat can be stored for hours. The aspect of
time and swiftness with ad hoc responses between supply and demand are typical for the
APX platform. Residual heat can have quality differences with respect to water temperate
and pressure, however when transported in a closed circuit heat network there will be a set
temperature and pressure for operational smoothness. The properties and abilities for very
swift action are not a requirement when exchanging residual heat. Demand prediction with
process industrial plants are pretty accurate. It would be different when superheated
pressurised stream would be the commodity, this substance has more comparable
properties as electricity. Means to store large quantities of pressurised steam are technically
impossible or very expensive which means that direct consumption of generated steam is
required. A market model such as the APX with balancing would be more suitable.
Economic differences are smaller than the physical differences of the commodity. For both
electricity and residual heat combustion or conversion processes are required since they are
energy carriers. So each energy carrier has a cost price which grasps the fuel costs and
operational costs. For electricity this can be the price of coal/nuclear and gas with for
instance an additional carbon price. The principles known for pricing heat is in most of the
cases a reference to alternative energy prices like that of gas. A market mechanism for
residual heat exchange could make an end to this price fix. The APX mechanism can be
explained by the approach of a merit order. Anonymous bids follow the pattern of a merit
order which eventually results in a price for electricity that holds for all players at that
specific moment when the market is cleared. Such a model could work for a market where
101
residual heat is exchanged. However a day ahead market for the process industry would be
sufficient as well. Especially when storage of warm water up to eight hours (see paragraph
7.1) is possible, this could solve scarcity and high price peaks of heat prices.
Institutionally there are some differences when regarding heat exchange and the electricity
mechanism market. The balancing role is present at the APX as well, congestion and
imbalances of electricity dispatching is taken care of by the TSO who is a large stakeholder of
the APX platform. This balancing act is only possible when there are several supplying parties
active on the grid with sufficient Security of Supply (SoS) an backup capacity to absorb large
fluctuations. The residual heat balance between supply and demand can be regulated more
easy, fewer parties are required, since storage can absorb the effect of imbalance. This
imbalance can then be traded like the APX platform, the party that deviates from its
planning needs to reimburse the difference. The mechanism of heat should institutionally be
arranged differently. There is a need for a party or institution that arranges grid balances in
collaboration with these storage facilities and booster stations. This is different from
balancing with standby capacity. This storage capacity is only available for a period of
maximum eight hours and loses quality (temperature), therefore the boosting and balancing
of residual heat needs reimbursement as well. Apart from this there are supply obligations
and longer term heat supply contracts. Those are necessary to have a longer term guarantee
on heat delivery since there are many large capital investments up front for infrastructural
connections. With electricity TenneT is responsible for infrastructural connections of which
the costs are socialised. Since residual heat exchange is partly a private initiative with private
parties producing and consuming residual heat it is illogical to directly socialise these
networks. The alternative for residual heat production of low quality heat by for instance
kettles and boilers. A residual heat mechanism is of service for several stakeholders instead
of a publicly owned entity, partly this is still a public service since up till now residual heat is
to a large extent only delivered to residential areas. Institutional differences are roughly the
type of consumer (which is of great influence for the cost distribution) and the commodity
storability which determines the type of trading required. Residual heat exchange would
rather be using a mechanism or platform that has more or less the form of a futures market.
This enables hedging risks and longer term heat supply guarantees, which tends to be more
like the market mechanism as the TTF gas platform described in paragraph 7.4.
7.5.2 TTF model versus residual heat commodity
Physically the commodity of natural gas is more comparable to residual heat than electricity.
It is both transported via a pipeline infrastructure under pressure, both commodities are
physically flowing which can be monitored. Of course there a large differences to the
specifics of the infrastructure, the transmission grid of natural gas operates at approximately
80bars and has a larger diameter than the heat exchange network throughout the
Rotterdam cluster (which is 0.5m). Gas has the ability to be stored easily without losing its
energy content. Residual heat does lose energy content with transportation or storage with
time passing; this is a natural decay. However there are physical similarities that are decisive
102
for the pattern for trading this commodity. Supply and demand pattern of natural gas are
balanced with line packing which is more or less comparable with storage in warm water
vessels. Another similarity for both commodities is that there are several qualities for each
commodity, the energetic value can differ by the content of for instance nitrogen in natural
gas or the temperature of the residual heat. Most important is the expiration date of
residual heat that has no obligation for direct consumption at the moment of production,
the aspect of time is important for a potential mechanism. The TTF platform seems to have
more suitable products in terms of futures that the APX can offer.
The economic perspective on residual heat in combination with the TTF mechanism is
interesting. Like stated above the physical time constraint (like electricity has) is not present
with the TTF mechanism where all sorts of products and futures are offered for sale. These
products are suitable for heat trading in a business to business setting. The traded gas as a
commodity is expressed in capacities (MW) and the amount of time when this capacity has
to be available. Residual heat could seamlessly be traded via such a virtual market. Especially
longer term trading, up to five years ahead on the futures market, is a characteristic
appealing to many consumers of industrial residual heat. Many of these customers possess
plants with continuous processes that are searching for long term guaranteed deliveries of
residual heat to hedge risks. There is a possibility to have own backup heat production
boilers or kettles on stand-by modus, however this is expensive. A guaranteed long term
nomination on a virtual market for residual heat is a more satisfying answer for facilities with
continuous processes. In such a case the party that offered the residual heat delivery bid is
obliged to deliver heat.
Institutionally seen such obligations can be managed by for instance larger centralised
backup CHPs or boilers in case the supply capacity of residual heat drops due to failures. An
important aspect to take into account is the smaller number of parties active in the
Rotterdam cluster with a connection to the heat infrastructure in comparison with the
number of players on the TTF platform. There will be third party access on the heat net
when there are multiple industrial producers and consumers on the grid, however this will
not be a fully operational mechanism with the ability to balance demand and supply. There
must be some sort of regulator or Heat Distribution Operator (the monitoring body from
paragraph 7.3) that operates and manages the physical and financial aspect of heat storage
and booster stations. Another important aspect to keep in mind is that the heat network is
still connected to the residential areas (the suppliers that distribute heat in residential
areas). Which means that the heat infrastructure will keep a public task as well. In light of
both functions supplying residual heat to civilians and supplying residual heat to industries
some regulatory institutions need to be arranged clearly. If a market mechanism for all
residual heat would be introduced with just several producers consumers could experience
negative effects due to strategic behaviour with excessive heat prices from time to time
(Kunneke, 2015). A separate regime for residual heat trading within the cluster and for the
103
residential heat customers for instance price coupled to the gas price as it is currently. If
these two functions are separated and regulated the public and private price mechanism can
function apart from each other. The private heat exchange within the cluster can reach
prices based on competition and marginal cost levels. A strict regulatory policy needs to be
assigned of which the compliance will for example be checked by a monitoring body (see
paragraph 7.3).
Currently the heat infrastructure in the Rotterdam cluster is operated by two companies:
Warmtebedrijf Infra NV and Warmtebedrijf Exploitatie NV. The first company is responsible
for the construction of the transportation infrastructure and maintenance, the operational
management and more importantly the security of supply (WBR, 2015). This company fulfils
the balancing role or at least the guarantee that enough residual heat flows from the cluster
towards the residential areas. The role of this company may be shifting in the future, given
bi-directional flow of residual heat within the cluster between industrial facilities. A new
institution or monitoring body with capacity utilisation may be required to physically balance
supply and demand with storage, boosters and additional heat supply sources. The other
company, Warmtebedrijf Exploitatie NV, manages the contracts and stakeholders, alongside
with the dispatching of heat and electricity (WBR, 2015). If the third party access mechanism
really shifts to a more market oriented model, the right column of table 14, the role of this
company will change completely in light of a different coordinating structure. There will be
bids and trades directly on an anonymous and virtual platform where heat capacities can be
bought. There is a co-evolution going on between the process of a market mechanism being
formed and the operations of the heat infrastructure with changing technical functions. The
social interaction of the technology influences the physical functioning of the heat
infrastructure (Nelson, 1994).
7.6 Conclusion
This chapter is centred around the following research question: “How will a future heat
market potentially look like when further elaborated?” To answer this question four
paragraphs were elaborated. Paragraph 7.1 addressed the type of heat that is seen as a
commodity. What are we dealing with pressurised steam or warm water? Paragraph 7.2
focussed on the costs and pricing of heat. A theoretical framework by Kunneke helped
pointing out the type of coordination required to this type of infrastructure. In addition
paragraph 7.4 the TTF gas mechanism and the APX power mechanism are analysed and
explained, whereas these two markets are compared for their suitability for trading residual
heat in paragraph 7.5. This is done from three perspectives: a physical, an economic and an
institutional perspective.
First of all the scope (paragraph 7.1) of this chapter is focussed around the heat network that
is already in place throughout the Rotterdam cluster. This heat network transports warm
water at temperatures between 90°C and 120°C. The trend that is going on in the Rotterdam
cluster is the eagerness from industrial plants and facilities to connect to this infrastructure.
104
The interesting aspect of this trend is that the industrial plants are not only in for a
connection to deliver heat surpluses, there is also demand for residual heat within the
process industry. In fact an exchange of residual heat throughout the cluster will arise. Not
only low grade heat will flow from the cluster to the city of Rotterdam but also flows back
and forth within the cluster. This is quite interesting for the type of market this
infrastructure will serve, next to residential areas, process industrial facilities are supplied as
well.
The price and pricing mechanism of residual heat (paragraph 7.2) generated in this cluster is
driven by the NMDA-principle (Niet Meer Dan Anders which is translated as Not More Than
Usual) This type of domestic heat pricing protects consumers against heat producers
monopoly pricing (Kamp, 2015). The delivery of residual heat is covered by a price regulation
with a coupling or reference to gas prices. However this goes for residential customers and
larger commercial buildings. The new trend in the Rotterdam cluster mentioned above, the
exchange of heat within the cluster, is not covered by the Warmtewet regarding heat price
regulations. Larger industrial facilities that produce or consume lower quality residual heat
will have heat delivery contract that are open for negotiations. Basically a Third Party Access
(TPA) is created on the already existing heat infrastructure. Therefore this chapter analysed
alternative pricing mechanism of energy commodities in order to check its suitability in case
of low grade heat trading.
The theoretic framework pointed out a coordination mechanism suitable for the heat
infrastructure in the cluster. A compulsory monitoring body which operates the
infrastructure with capacity utilisation on an hourly to daily basis would be an appropriate
mode of organisation (Kunneke, 2011). In addition, two market mechanisms are
investigated, the APX power trading platform and the TTF gas trading platform. Both virtual
trading platforms have their own characteristics. The market characteristics and the
products offered on these market mechanisms are to a large extent defined by the
commodities that are traded on it. The commodity of low grade heat quality or residual heat
has many resemblances with the commodity of natural gas. Both products are tangible and
more importantly they are storable. Whereas electricity has to be consumed the moment it
is produced residual heat can be stored in vessels and later on be upgraded in quality.
Residual heat will gradually decrease in quality since there is a natural decay of heat loss.
Nevertheless from a physical perspective it is has many resemblances with natural gas. Also
the economic aspect of residual heat trading inclines more to the TTF mechanism than the
APX mechanism. The industrial consumers and producers of residual heat are mainly dealing
with continuous processes. The nature of the surpluses and demand for residual heat are
therefore pretty much steady. Both sides of the supply and demand curve are interested in
longer term guarantees of supply and heat extraction. A Rotterdam cluster could therefore
seamlessly fit with a TTF market mechanism where longer term products are for sale as well.
Deals (or nominations) are traded up till 41 months ahead on the futures market (The ICE,
2015).
105
From an institutional perspective a more evolved market mechanism in the case of heat
exchange in the Rotterdam cluster will be a large shift. The type of market and customers
will be subjected to a transition. Heat will be exchanged within the industrial cluster next to
the supply from the industry to the residential areas. And the market potential is expanded
from residential areas and commercial buildings to industrial facilities as well. The clients
and traders within the cluster will be subjected to some sort of market mechanism, at least
every heat delivery contract is open for negotiation, whether it is in the form of a virtual
trading mechanism or not. A market mechanism for heat with just a few producers paves the
way for strategic behaviour with potential excessive heat prices from time to time (Kunneke,
2015). The cluster’s side of the residual heat exchange can endure price peaks and falls
whereas the other customers will have a protected status regarding the heat pricing. Such
heat exchange activity is in need for a monitoring body checking compliance to contracts
(paragraph 7.3). Physically there is need for a TSO or a collective institution operating the
heat infrastructure since there are bi-directional flows through the infrastructure that need
to be controlled, especially in combination with storage and boosting of low grade heat.
The institutional arrangements are also very important to the remuneration of the
infrastructure. Since the transportation infrastructure of residual heat already in place
initially had a public function, these costs were to a large extent socialised. New connections
to link this infrastructure will have a different remuneration scheme since private parties are
involved. The marketing of residual heat can roughly be split in two sections, the commodity
and the infrastructure. The commodity of residual heat is highly competitive towards the
alternatives. Boilers with target temperatures of 90°C to 120°C are easily overthrown by the
delivery of residual heat, which is in fact very efficient (WBR,2015; Kleisterlee, 2015
interview). The downside is the price of the required infrastructure. In the case of Rotterdam
this infrastructure is already present, the investments that are still required are the
connections from the industrial facilities towards to heat infrastructure.

106
Chapter 8: Changing role of gas and the future
function of the gas grid
This chapter will be focussed around the last sub question of this thesis: “What is the future
mechanism and changing function of gas and its infrastructure?” This question is formulated
quite abstractly which leaves room for an exploratory answer. There are multiple aspects
that will be highlighted in this chapter. The changing role of natural gas is one of them, will
there merely be a transit function of natural gas when domestic production is declining or is
there more to it? In addition paragraph 8.2 investigates future functions of the gas grid. Are
there alternative gases such as; hydrogen, bio-LNG, regular bio-gas and other gasses next to
high- and low-calorific gas that can be transported via the gas grid? Will the gas grid be
sufficiently up to this from a physical, chemical and economic perspective? This chapter will
analyse the possibilities and potential for the Dutch gas grid to become a smart gas grid next
to the function of a potential gas-roundabout.
8.1 The role of gas up till now and its future prospect
Historically seen the discovery of an enormous gas reserve in the Netherlands caused a large
scale rollout of the transmission and distribution grid, which changed the Dutch society
permanently. Gas started dominating the Dutch energy supply portfolio in the 1960s.
Industries switched to gas as a fuel for their production processes, households were able to
cook and heat with gas, instead of using oil and coal. Due to this transition the current Dutch
energy system became very dependent on gas. This made the energy system very energy
efficient and clean relative to other consumption with oil and coal. In addition industrial
processes and electricity generation were driven by natural gas instead of using coal, brown
coal, peat, wood or even oil. It is almost fifty years ago since the Netherlands started
exploiting gas on a large scale. Gas flows into our houses as a steady source for internal
heating or cooking, there are very few intermittencies, natural gas is so embedded in the
system that our Security of Supply is taken for granted. The amount of energy delivered to
our households via the gas grid is more than four times as much energy than electricity that
is delivered to the Dutch households on a yearly basis (CBS, 2015d). The energy content of
natural gas is very high per cubic meter, which makes it a convenient energy carrier with
respect to transportation and storage. Policy from the 1960s has exerted major influences
on the (institutional) functioning of the current Dutch gas system. Past strategic decisions
are still defining the main characteristics of the current gas grid. The rollout of the grid was
arranged via a very top-down hierarchical control. Within 5 years all the Dutch municipalities
on the mainland had been connected to the gas grid (Correljé, et al., 2003). In parallel the
physical connections, regulations and gas-laws were implemented that guaranteed supply
obligations for customers. Security of Supply was effected by supply obligations to
connected customers and affordable gas prices were realised. Natural gas created many
positive aspects for the Dutch society; residential warm water, state revenues, social
welfare, employment (apart from regions as Limburg where coal mines were closed due to

107
changes in the energy portfolio). The availability of Dutch gas made the economy rely heavily
on natural gas as an energy supply source. In 2013, the Dutch primary energy consumption
consisted for 43% of natural gas (CBS, 2015a). The Netherlands has the highest share of
natural gas in Europe for their primary energy consumption (Eurogas, 2014).
Current energy developments in the Netherlands with respect to natural gas have rapidly
changed. Safety issues in Groningen led to a cutback in production (Berentsen, 2015). The
smaller offshore gas fields are utilised more and it is doubtful whether the Netherlands can
produce enough in the coming years to satisfy its own consumption. In the long term
importing the potential shortfall between demand and domestic production is not a
problem. To some extent the gas flowing through the Dutch gas grid is already imported via
pipeline from Norway and Russia or by LNG-ship from for instance Qatar and countries in
Africa. The Groningen field can serve as a longer term strategic reserve, nevertheless, the
question arises; what are the prospects for gas in the Netherlands? Is natural gas partly
replaceable in some sectors? Will the grid be functioning as a large roundabout (official plans
by the Dutch government) with only a function of transit, import, storage, balance and
export of natural gas?
Demand for gas in the Netherlands will still be there in the near and long term future. The
question is if this role is as large as today or not? In some cases, such as residential heat
networks can induce a shift, driven by policy or technology, changing gas consumptions
heavily. Industrial heat on the other hand has multiple heat quality requirements as
described in the previous chapters. Low grade heat quality can potentially be resolved by the
exchange of surpluses and deficits within the cluster. Higher heat qualities such as mid
pressure steam can partly be generated by alternatives such as; geothermal, electrical or
biomass technologies (see chapter 6). However, some industrial energy needs which are
currently supplied with natural gas are hard to replace. Think of large quantities high
pressurised steam or the chemical conversion of the molecule CH4 into other gaseous
products or chemicals (chapter 5). Electrification of processes producing significant amounts
of steam would require vast changes to the electricity infrastructure (paragraph 6.4). Such
energy intensive processes will require natural gas in the long term. An advantage is that the
larger industrial consumers (approximately 80) use natural gas with a high calorific value.
This gas is produced at the small field on the North sea but can also be imported (RVO,
2015b; Braaksma, 2015 interview). Figure 34 shows the high-calorific natural gas
transmission grid throughout the Netherlands. Imports come from Norway and Russia
mainly, Germany, LNG terminal Belgium and Gate terminal Rotterdam e.g. Qatar and
Algeria. Large exports are done to the UK, Belgium, France, Germany and Italy. A large share
of the high calorific gas is produced by North sea small fields and the approximately 25 fields
onshore (RVO, 2015b). The high calorific gas grid can facilitate the larger industrial
customers, however when the production of low calorific gas is declining the domestic
produced high calorific gas may be used to produce Groningen-quality gas by blending
nitrogen. Moreover, it is hard to estimate how a cluster as Rotterdam will look like on the
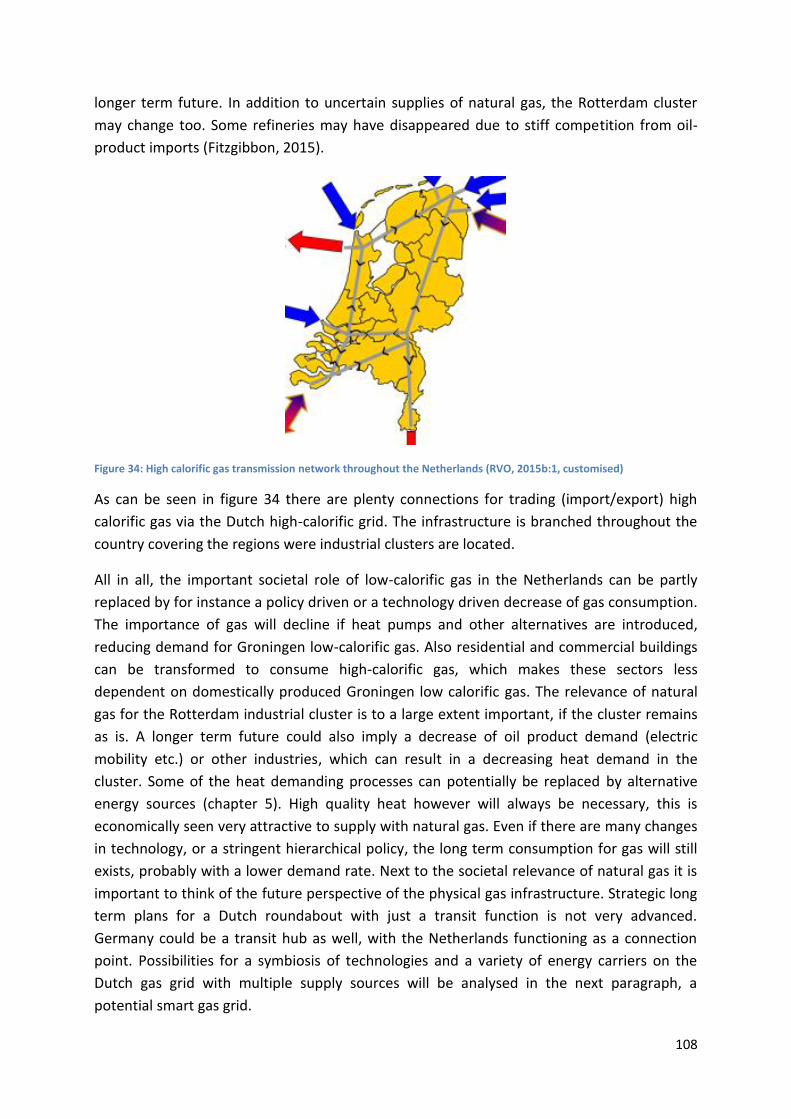
108
longer term future. In addition to uncertain supplies of natural gas, the Rotterdam cluster
may change too. Some refineries may have disappeared due to stiff competition from oil-
product imports (Fitzgibbon, 2015).
Figure 34: High calorific gas transmission network throughout the Netherlands (RVO, 2015b:1, customised)
As can be seen in figure 34 there are plenty connections for trading (import/export) high
calorific gas via the Dutch high-calorific grid. The infrastructure is branched throughout the
country covering the regions were industrial clusters are located.
All in all, the important societal role of low-calorific gas in the Netherlands can be partly
replaced by for instance a policy driven or a technology driven decrease of gas consumption.
The importance of gas will decline if heat pumps and other alternatives are introduced,
reducing demand for Groningen low-calorific gas. Also residential and commercial buildings
can be transformed to consume high-calorific gas, which makes these sectors less
dependent on domestically produced Groningen low calorific gas. The relevance of natural
gas for the Rotterdam industrial cluster is to a large extent important, if the cluster remains
as is. A longer term future could also imply a decrease of oil product demand (electric
mobility etc.) or other industries, which can result in a decreasing heat demand in the
cluster. Some of the heat demanding processes can potentially be replaced by alternative
energy sources (chapter 5). High quality heat however will always be necessary, this is
economically seen very attractive to supply with natural gas. Even if there are many changes
in technology, or a stringent hierarchical policy, the long term consumption for gas will still
exists, probably with a lower demand rate. Next to the societal relevance of natural gas it is
important to think of the future perspective of the physical gas infrastructure. Strategic long
term plans for a Dutch roundabout with just a transit function is not very advanced.
Germany could be a transit hub as well, with the Netherlands functioning as a connection
point. Possibilities for a symbiosis of technologies and a variety of energy carriers on the
Dutch gas grid with multiple supply sources will be analysed in the next paragraph, a
potential smart gas grid.
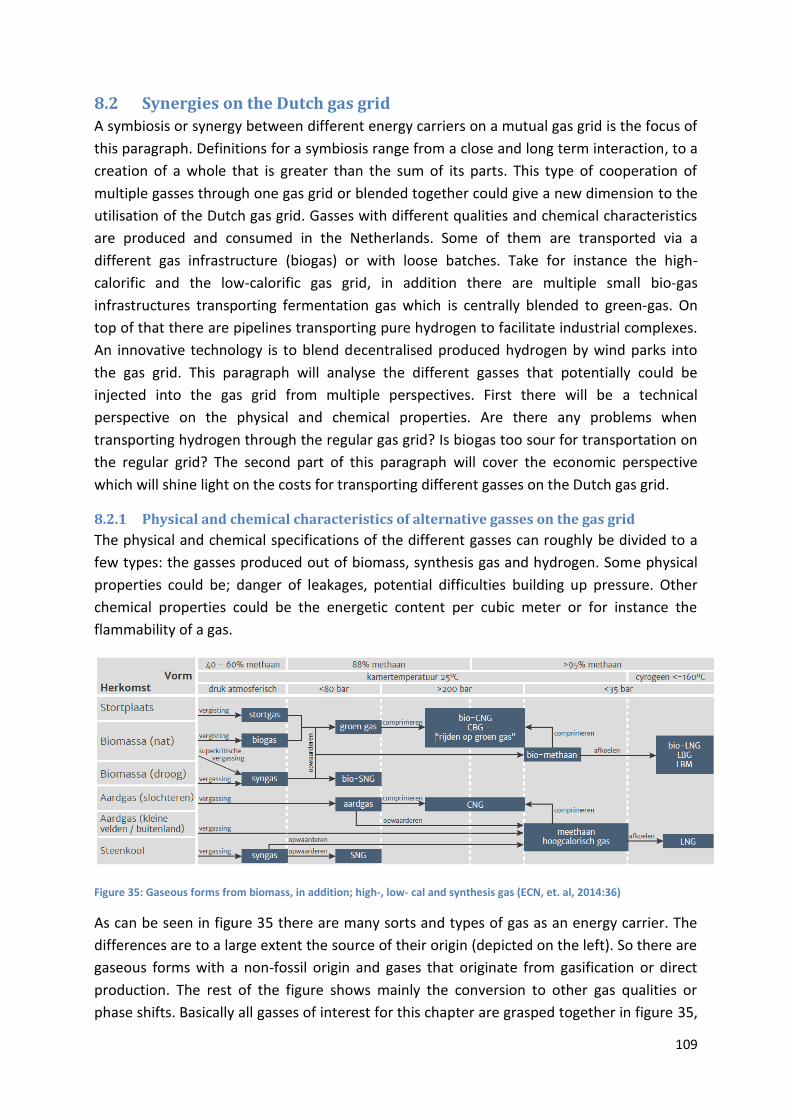
109
8.2 Synergies on the Dutch gas grid
A symbiosis or synergy between different energy carriers on a mutual gas grid is the focus of
this paragraph. Definitions for a symbiosis range from a close and long term interaction, to a
creation of a whole that is greater than the sum of its parts. This type of cooperation of
multiple gasses through one gas grid or blended together could give a new dimension to the
utilisation of the Dutch gas grid. Gasses with different qualities and chemical characteristics
are produced and consumed in the Netherlands. Some of them are transported via a
different gas infrastructure (biogas) or with loose batches. Take for instance the high-
calorific and the low-calorific gas grid, in addition there are multiple small bio-gas
infrastructures transporting fermentation gas which is centrally blended to green-gas. On
top of that there are pipelines transporting pure hydrogen to facilitate industrial complexes.
An innovative technology is to blend decentralised produced hydrogen by wind parks into
the gas grid. This paragraph will analyse the different gasses that potentially could be
injected into the gas grid from multiple perspectives. First there will be a technical
perspective on the physical and chemical properties. Are there any problems when
transporting hydrogen through the regular gas grid? Is biogas too sour for transportation on
the regular grid? The second part of this paragraph will cover the economic perspective
which will shine light on the costs for transporting different gasses on the Dutch gas grid.
8.2.1 Physical and chemical characteristics of alternative gasses on the gas grid
The physical and chemical specifications of the different gasses can roughly be divided to a
few types: the gasses produced out of biomass, synthesis gas and hydrogen. Some physical
properties could be; danger of leakages, potential difficulties building up pressure. Other
chemical properties could be the energetic content per cubic meter or for instance the
flammability of a gas.
Figure 35: Gaseous forms from biomass, in addition; high-, low- cal and synthesis gas (ECN, et. al, 2014:36)
As can be seen in figure 35 there are many sorts and types of gas as an energy carrier. The
differences are to a large extent the source of their origin (depicted on the left). So there are
gaseous forms with a non-fossil origin and gases that originate from gasification or direct
production. The rest of the figure shows mainly the conversion to other gas qualities or
phase shifts. Basically all gasses of interest for this chapter are grasped together in figure 35,
110
Hydrogen-gas as a separate gas is not included. This gas can be created by electrification,
e.g. an oversupply of renewable power. In fact it is used in the figure above for upgrading
gasified coal to produce syngas with the same calorific value as natural gas, however
hydrogen as a separate gas is not mentioned.
Grid limitations
Natural gas naturally contains no oxygen, by a number of operations and operational
conversions it can happen that some oxygen molecules occur. This frequently is the case
with gasses such as green gas or synthesis gas that undergo many treatments where oxygen
can slip in (Staatscourant, 2014). Oxygen is particularly critical for storage facilities of natural
gas, not specific for the transmission infrastructure. The gas transmission system can handle
much higher contents of oxygen only when there are no molecules of H2O present. The
oxygen content is measured in PPM (parts per million). There are no consumers connected
to the low calorific grid with restrictions of oxygen contents up to 5000PPM, therefore the
oxygen content can be higher. Recently the oxygen content is restricted to maximum of
10.000PPM internationally (Staatscourant, 2014) . This requirement applies to both the H-
gas and the G-gas transmission grid and has an origin which is partly determined by historical
decisions and contractual obligations. Carbon dioxide has a special side note as well for
transport over the gas grid. High CO2 levels are only admitted when gas contains very low
water vapours (dry gas). The combination of water and CO2 creates a risk for corrosion.
Higher CO2 levels are most likely no problem for the gas distribution and gas transmission
grids, however this is only when the gas is kept dry. The gases with a higher content of CO2
instead of a higher N2-content with the same Wobbe-index are more prone to have a so
called “flame lift” when combusted (syngas is an example of such a gas). A flame lift means
that the actual flame is ignited higher above the opening of the gas release point, which
creates a risk for a flame to be blown out (flame stability). Therefore the gasses that are
composed for 99% out of; methane, carbon dioxide, nitrogen and oxygen must increase the
lower limit of the Wobbe-index when carbon dioxide contents rise (Staatscourant, 2014).
Biogas
Gas out of biomass has many sorts and types: bio-CNG, bio-SNG, bio-gas, green-gas and bio-
LNG. To put things right, bio-gas is fermented biomass which has an methane content of
approximately 56% (20,1 MJ/m3) while Groningen gas, upgraded gas, has an energy content
of 43,46-44,41MJ/m3 (ECN, et. al, 2014; Staatscourant, 2014). Green gas has the same
quality as regular Groningen-gas with respect to its energetic content. The system function
therefore is comparable with that of natural gas. This goes for the storability, flexibility,
transportability and transportation costs. The production however is very expensive, see
chapter 6 for a further elaboration on biomass fermentation costs. There are no differences
in combustion specifications with green gas, all apparatus can directly make use of this gas.
Even the same odour is added to to give it the same scent in case of leakage. All the other
types of biogas are just variations of the original biogas with respect to the pressure and
temperature, except for bio-SNG which is a synthesis gas (combination of H2 and CO) where
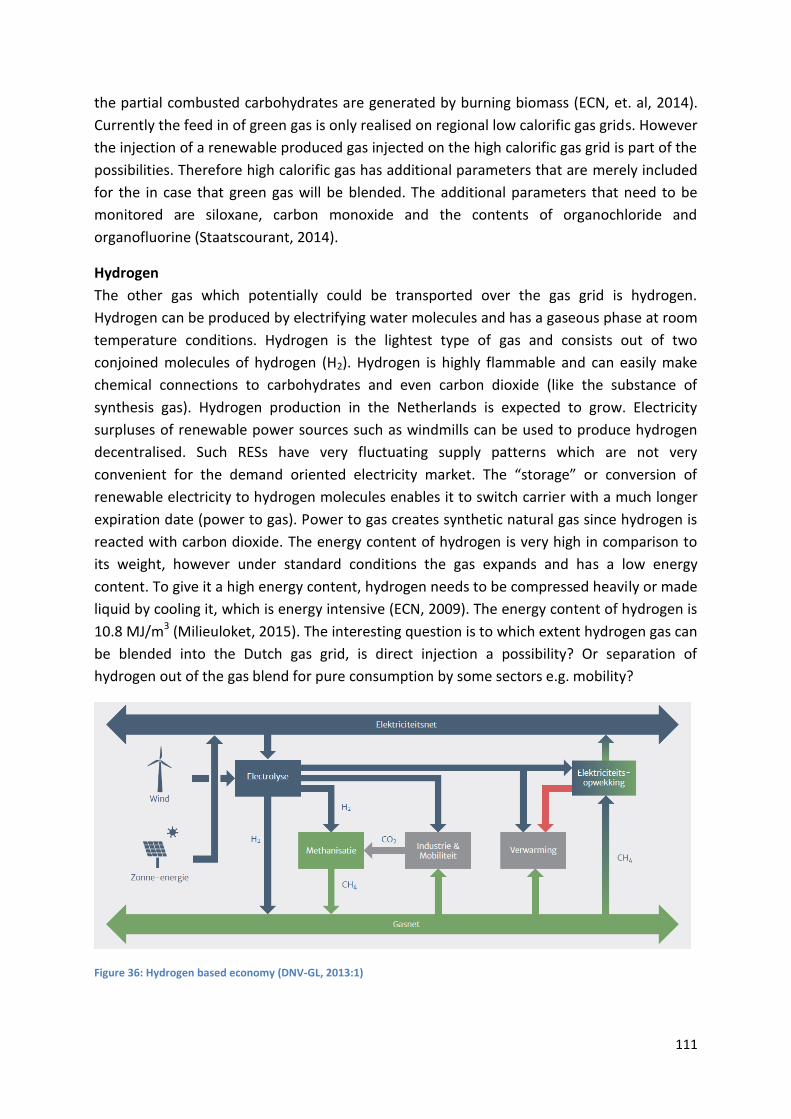
111
the partial combusted carbohydrates are generated by burning biomass (ECN, et. al, 2014).
Currently the feed in of green gas is only realised on regional low calorific gas grids. However
the injection of a renewable produced gas injected on the high calorific gas grid is part of the
possibilities. Therefore high calorific gas has additional parameters that are merely included
for the in case that green gas will be blended. The additional parameters that need to be
monitored are siloxane, carbon monoxide and the contents of organochloride and
organofluorine (Staatscourant, 2014).
Hydrogen
The other gas which potentially could be transported over the gas grid is hydrogen.
Hydrogen can be produced by electrifying water molecules and has a gaseous phase at room
temperature conditions. Hydrogen is the lightest type of gas and consists out of two
conjoined molecules of hydrogen (H2). Hydrogen is highly flammable and can easily make
chemical connections to carbohydrates and even carbon dioxide (like the substance of
synthesis gas). Hydrogen production in the Netherlands is expected to grow. Electricity
surpluses of renewable power sources such as windmills can be used to produce hydrogen
decentralised. Such RESs have very fluctuating supply patterns which are not very
convenient for the demand oriented electricity market. The “storage” or conversion of
renewable electricity to hydrogen molecules enables it to switch carrier with a much longer
expiration date (power to gas). Power to gas creates synthetic natural gas since hydrogen is
reacted with carbon dioxide. The energy content of hydrogen is very high in comparison to
its weight, however under standard conditions the gas expands and has a low energy
content. To give it a high energy content, hydrogen needs to be compressed heavily or made
liquid by cooling it, which is energy intensive (ECN, 2009). The energy content of hydrogen is
10.8 MJ/m3 (Milieuloket, 2015). The interesting question is to which extent hydrogen gas can
be blended into the Dutch gas grid, is direct injection a possibility? Or separation of
hydrogen out of the gas blend for pure consumption by some sectors e.g. mobility?
Figure 36: Hydrogen based economy (DNV-GL, 2013:1)
112
Figure 36 shows a synergy of CH4 next to H2. Interestingly there is direct hydrogen
consumption via hydrogen infrastructures to some sectors. In addition there is direct
hydrogen injection in the gas grid and indirect hydrogen consumption via the methanation
process. The increasing volumes of renewable power in the future will require electricity grid
reinforcements, luckily the existing gas infrastructure can potentially facilitate large energy
transfers in a gaseous form. “P2G is of particular interest for the North Sea area as its on-
and off-shore natural gas infrastructure is well developed. In addition, the combined
generating capacity of offshore wind farms on the North Sea could reach around 100 GW by
the year 2030, while the PV capacity installed in the countries surrounding the North Sea is
expected to increase from 35 GW in 2012 to almost 60 GW in 2020”(DNV-GL, 2013:1). The
decentralised production of hydrogen can be very extensive seen the prospects for RES by
2030. Can all this potential hydrogen be injected in the gas grid for blending? Regulations
state an upper limit of hydrogen content in gas flowing through the transmission grid, the
content may not exceed 0.02%. Green gas contains concentrations of 0.02-0.04 mol%
hydrogen sometimes. The gas grid which is not operated by GTS, called the RNB-grid, has
therefore set a maximum blend in of 0.1 mol% hydrogen (Staatscourant, 2014). The low
calorific gas grid has potential to directly insert hydrogen with larger amounts. This is a step
in the right direction for RES in combination with the Dutch gas grid. Technically seen this
has no constraints, however, when the content of hydrogen is increased further, multiple
aspects come into play. Firstly the devices connected to the low calorific gas grid that are
not calibrated for higher contents of hydrogen consumption. For industrial equipment such
as gas turbines have technical limitations that can vary from traces of hydrogen to 1% of
hydrogen and sometimes even 5% of hydrogen. Residential equipment can handle up to 5-
8% of hydrogen maximum (Staatscourant, 2014). A second technical barrier is gas metering,
which needs adaption. Current gas chromatographs do not measure hydrogen, these need
replacement (which requires substantial investments) in order to make compatible
measurements.
Thirdly it is doubtful whether the gas transmission grid withstands high contents of
hydrogen, some specific non-metal parts are not designed for the presence of hydrogen. At
the consumer’s side there are accessories that cannot resist hydrogen as well. Short term
risk are limited, however information on long term exposure to hydrogen is still lacking
(Staatscourant, 2014). Experiments have shown that on the closed circuit gas grid of
Ameland up to 20% hydrogen injections have been accomplished successfully. In Germany
discussions are going on to allow the blending of hydrogen up to 10% (ECN, et al. 2014).
Current hydrogen infrastructures are only installed for industrial customers, this hydrogen is
extremely pressurised in a pure form. Industrially seen the gas is an important facilitator
since flame temperatures can reach up to 2700°C. An infrastructure for transportation or
mobility with hydrogen has yet to be established. Some gas stations offer hydrogen for cars
with hydrogen fuel cells or hydrogen combustion technologies (ECN, 2009). Transportation
of hydrogen via pipeline infrastructures has disadvantages, since hydrogen is a very small
molecule it is very hard to store it. An iron or plastic pipeline can be seen as a sieve when
113
extremely enlarged. The very small hydrogen molecules can slowly find their way through
the material. Therefore it is very hard to transport hydrogen without leakages, especially
under high pressure. Transportation of pure hydrogen would require much higher pressures,
in relation to the gas grid, to transport the same amount of energy, which causes more
leakages. To solve this problem, storage of hydrogen can be done in the liquid phase by
cooling it down, however, the liquefaction of hydrogen leads to an energy loss of
approximately 30% (Milieuloket, 2015).
Government plans stay unchanged up till 2021 for the low calorific G-gas composition. From
2022 onwards the low calorific gas flowing through the Dutch gas grid has a Wobbe-index
between 43.46-45.3MJ/m3. The upper limit of the low calorific distribution grids stays at
44.41 MJ/m3 for safety reasons until the consumers’ devices of G-gas are prepared for gas
with a higher energetic value (Staatscourant, 2014)
8.2.2 Economics of alternative gasses
The insertion of alternative gasses on the Dutch gas grid is interesting. The gaseous energy
carriers should not be regarded individually, more like a system as a whole. Additional biogas
and hydrogen next to the different calorific values of regular produced and imported gasses
form a wide portfolio of energy carriers on the gas grid. These gasses are an ideal means to
“store” electricity surpluses generated with RES or to add green gas into the system.
Countries such as Germany and Denmark are both investigating the role of alternative
energy carriers in gaseous form on existing infrastructures. Both countries have a relatively
high RES penetration in their utility capacity which leaves them with more fluctuating supply
patterns. Storage potential in gaseous form is attractive for balancing these fluctuations and
has relatively low transportation costs (DNV GL, 2014).
Production costs of both, biogas and hydrogen, are very high. Investment costs are
considerably high as well, especially in proportion to the small number of running hours that
the installations make for hydrogen production in case of RES surpluses (ECN, 2015). Biogas
production is a capital intensive process as well. Like described in chapter 6, biomass
supplies can be twice the price of coal in terms of €/MW, due to high transportation costs
and a low energy density (IEA,2007). On top of that biogas has a lower energetic value than
natural gas while regular gas will be the reference price when it is upgraded to green gas. For
further production cost breakdown of biomass fermentation see chapter 6. Current
hydrogen supplies are for 96% produced with fossil fuels. The two most common techniques
are natural gas reforming and coal gasification, these techniques are very mature and will
not experience any production costs reductions due to learning curves. Electrification of
water to produce hydrogen is a far more expensive production method which can
experience a very big learning curve. Especially the small scale modular hydrogen production
facilities (CE Delft, 2014). Rough estimates state that the production of hydrogen will stay
approximately three times as expensive when produced with wind instead of natural gas
reforming. Cheap produced hydrogen with fossil fuels is very attractive, there are
calculations that modern hydrogen cars can drive up to 100Km per Kg of hydrogen. The price
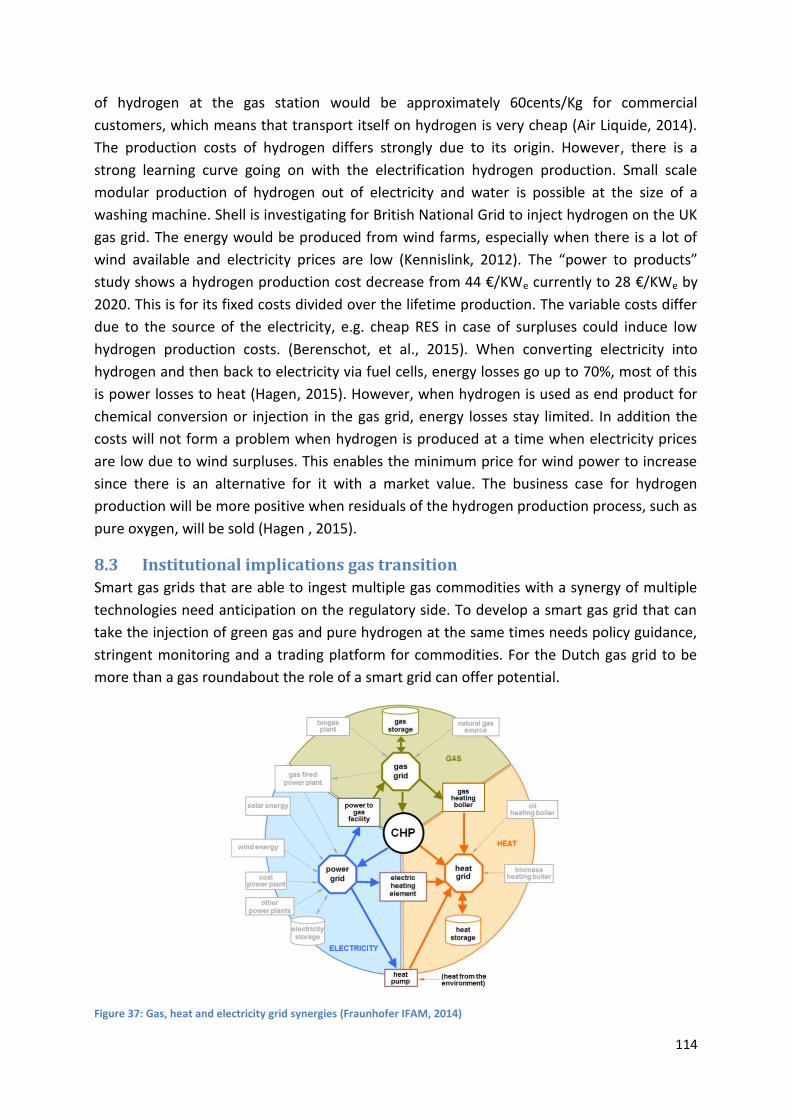
114
of hydrogen at the gas station would be approximately 60cents/Kg for commercial
customers, which means that transport itself on hydrogen is very cheap (Air Liquide, 2014).
The production costs of hydrogen differs strongly due to its origin. However, there is a
strong learning curve going on with the electrification hydrogen production. Small scale
modular production of hydrogen out of electricity and water is possible at the size of a
washing machine. Shell is investigating for British National Grid to inject hydrogen on the UK
gas grid. The energy would be produced from wind farms, especially when there is a lot of
wind available and electricity prices are low (Kennislink, 2012). The “power to products”
study shows a hydrogen production cost decrease from 44 €/KWe currently to 28 €/KWe by
2020. This is for its fixed costs divided over the lifetime production. The variable costs differ
due to the source of the electricity, e.g. cheap RES in case of surpluses could induce low
hydrogen production costs. (Berenschot, et al., 2015). When converting electricity into
hydrogen and then back to electricity via fuel cells, energy losses go up to 70%, most of this
is power losses to heat (Hagen, 2015). However, when hydrogen is used as end product for
chemical conversion or injection in the gas grid, energy losses stay limited. In addition the
costs will not form a problem when hydrogen is produced at a time when electricity prices
are low due to wind surpluses. This enables the minimum price for wind power to increase
since there is an alternative for it with a market value. The business case for hydrogen
production will be more positive when residuals of the hydrogen production process, such as
pure oxygen, will be sold (Hagen , 2015).
8.3 Institutional implications gas transition
Smart gas grids that are able to ingest multiple gas commodities with a synergy of multiple
technologies need anticipation on the regulatory side. To develop a smart gas grid that can
take the injection of green gas and pure hydrogen at the same times needs policy guidance,
stringent monitoring and a trading platform for commodities. For the Dutch gas grid to be
more than a gas roundabout the role of a smart grid can offer potential.
Figure 37: Gas, heat and electricity grid synergies (Fraunhofer IFAM, 2014)
115
Figure 37 shows the interaction of three energy carriers with multiple techniques and
infrastructures. All techniques are to some extent present in the Dutch energy system. The
overview of the three energy carriers are centred around the CHP technology which deals
with all three. The functioning of a smart gas grid will be around the borders of the three
areas. Each specific solution to create synergies for a smarter gas grid will most likely be case
specific customised e.g. hydrogen or green gas injections at different qualities and locations.
The potential future functions of the Dutch high- and low-calorific are summed up
underneath. Most of the functions are already operational, some to a larger extent than
others. LNG imports and exports are not utilised very effectively, these trade flows still have
to grow, the Gate terminal for instance has been operating at a 5% utilisation rate last year
(Gate Terminal, 2015). The blend in of green gas is small, and hydrogen injection is still in its
research phase. All potential methods (separate from storage and balancing etc.) to utilise
the Dutch gas grid are summed up underneath:
Blending hydrogen into the low-calorific gas grid
Blending hydrogen into high- calorific gas grid
Import and export via high-calorific grid
Import and export LNG
Export via low-calorific grid
Blending green-gas into the low-calorific gas grid
Blending green-gas into the high-calorific gas grid
Methanation (hydrogen with CO2), syngas on the high- and low-calorific gas grid
A future gas grid in the Netherlands could potentially be operating with all these functions.
Another trend is that the low-calorific gas grid quality is gradually increased after 2021
(Staatscourant, 2014). The composition of G-gas is changed. A very progressive thought
could be that eventually the qualities of the high- and low- calorific gas grid would reach
corresponding energetic levels. Another interesting thought is that the hydrogen production
can be used to lower the energetic value of the imported high calorific gas to G-gas for the
low-calorific grid. This would have grave implications for all small scale consumers
domestically and neighbouring countries (Westphal, 2015). However the functions in the
bullet points are much more realistic.
Institutionally seen the development of Dutch gas grid functions require adaptions.
Regulations on gas qualities needs to be adapted. Current regulations prescribe only very
limited hydrogen contents in the gas infrastructure, in order to successfully insert gasified
electricity surpluses from RESs, amendments need to be made to this regulation. Germany
has loosened the hydrogen content restriction for some pipelines up to ratios of 10%. Next
to the regulations on gas quality there is a need for monitoring and active control of
hydrogen injection. Not only physical metering will have to undergo changes also the
monitoring bodies. Since hydrogen is a different commodity from natural gas there will be
an extra trading factor for hydrogen injection. The price level of hydrogen will be established
somewhere between the price of the electricity (used to produce hydrogen) and the gas

116
price in relation to its energetic value. Yet another uncertainty is on which market or trading
platform hydrogen will be marketed, since hydrogen differs from natural gas with respect to
its specifications. This implies that a mechanism or institution is used as a factor shaping the
economic performance of infrastructures, in this case the Dutch gas grid (Nelson & Sampat,
2001). The biogas trade is TTF based and GTS (Gas Transport Services) blends it with natural
gas to upgrade the quality to green gas after which it is inserted into the low calorific grid
(Gasterra, 2009). The role of GTS will be elaborated with a potential addition of hydrogen on
the grid. Stringent requirements for the delivery and gas quality need compliance. Tight
collaboration with regional grid operators will be crucial since the injection of hydrogen can
be decentralised. A separate task force or project group (comparable with the “Projectgroep
Groen Gas”) could be established to ensure that potential barriers are cleared which
enforces a safe and reliable gas supply (GTS, 2015a). Next to institutional arrangements of
monitoring, balancing and management of gas (as a mixture of methane and hydrogen)
through the grid there are infrastructural aspects as well. Hydrogen can be injected on the
gas grid on central locations and decentralised. Decentralisation would influence the
regional gas grids with local higher contents of hydrogen. Centralised injection of pure
hydrogen on the mid- and high-pressure gas grid allows hydrogen injection at a higher rate.
Centralised hydrogen injection would require a separate infrastructure for hydrogen
transportation to the gas transmission pipelines. These separate pipelines could be privately
owned, this is then ownership of private pipelines which have a public function. The
investments costs for these hydrogen transportation pipelines should be allocated, would
the Dutch state be investing in such infrastructures? The gas network of Gasunie is socialised
over the people. This network serves the same public service as a potential hydrogen
pipeline. What are the arrangements regarding supply obligations on the hydrogen
production side? Does Gasunie have an obligation to connect Offshore Wind Parks to the gas
grid with a blend in connection? Infrastructural seen there will be negotiations regarding the
institutional obligations and financing. These institutional arrangements come along with
new developments in the gas system. New commodities interfere with technical
arrangements of different qualities and specifications, policy adaptations need to be made
how to deal with the gas and how to transport it. Economic differences occur as well when
injecting other commodities in the gas grid, it is doubtful whether hydrogen can be traded
on the TTF platform. Financial and ownership arrangements are shaken up when new
pipeline’s for hydrogen transport with a public function are required. Let alone supply and
demand obligations regarding production profiles of RES. A smart gas grid can be realised
from a technical perspective, however institutionally there are quite some adaptions that
have yet to be made in order to proceed with hydrogen injections on a large scale.
8.4 Conclusion
This chapter is centred around the following research question: “What is the future
mechanism and changing function of gas and its infrastructure?” This question was
deliberately formulated in a wide context. Paragraph 8.1 describes the role of natural gas
from a historical perspective and its embeddedness into the current energy system. A sketch

117
is made of the future function and future potential for natural gas in several sectors
throughout the Netherlands. This of course in combination with domestic production
declines. Paragraph 8.2 described alternative gasses besides natural gas which are analysed
whether they can be transported on the Dutch gas grid or not. This is done in two
perspectives: a technical and an economic perspective. The last paragraph investigates the
future functions of the Dutch gas grid and potential utilisation alongside the original plans
for a gas roundabout. These potential developments are regarded from an institutional
perspective.
Gas is very embedded in our energy system due to historical choices and institutions created
to exploit natural gas on a large scale in the Netherlands. It operates perfect as an energy
carrier and brought lots of welfare and convenience for the public. The Netherlands grew
addicted to the consumption of natural gas and has the highest primary energy consumption
rate of natural gas in Europe. However production rates of domestic produced gas are
decreasing sharply. The question arises, what are the prospects for gas in the Netherlands?
Is natural gas partly replaceable in some sectors? Some sectors show partial replacement
potential for natural gas. This can be both ways, by means of a very hierarchical government
policy or by a technology push. The residential sector can partly replace gas consumption by
means of heat pumps and insulation, however these two are still quite expensive for an
average civilian. The sector of interest for this thesis, the Rotterdam cluster, has multiple gas
consumption types: low quality heat, high quality heat and gas for chemical conversion. The
first can be partly replaced by heat exchanges within the cluster (chapter 7), this could
resolve the potential energetic misuse of natural gas for low grade heat purposes by
exchanging surpluses. High quality heat is already much more dependent on natural gas,
think of large quantities of high pressurised steam. There are some alternatives (chapter 6)
that could supply high grade heat production within an industrial cluster. Some of these
technologies show potential such as ultra-deep geothermal heat recovery. However the gas
consumption for industrial heating is very large and cannot be replaced for a large extent.
The gas conversion in the petrochemical sector of the cluster is almost completely
dependent on natural gas (chapter 5). All in all it is likely that the industrial cluster of
Rotterdam is still in need for natural gas for the long term future. The high calorific gas grid
can facilitate the larger industrial customers which can be imported. On top of that it is hard
to estimate how a cluster as Rotterdam will look like on the longer term. Basic refineries may
have left already (due to potential oil-product imports or demand decrease), there could be
just a refinery sector for special chemicals, and niche petrochemicals. The societal role of
natural gas is certainly present on the long term future, however to which extent gas will be
dominant is doubtful. Technical breakthroughs and top down policy mechanisms can reach
far in reducing gas consumption. Especially the role of low calorific Groningen gas in the
Dutch energy system on the long term is uncertain.
The second part of the chapter analysed the possibilities for a symbiosis of technologies and
a variety of energy carriers on the Dutch gas grid. Two gasses next to the regular high- and

118
low-calorific natural gas are analysed for their potential injection into the gas grid with
respect to their physical and chemical properties. These two gasses are green-gas (upgraded
biogas) and hydrogen. The Dutch gas grid knows several technical limitations transporting
gasses. There is a restriction on carbon dioxide (which tends to be present in green gas), this
can be highly corrosive with moisture. High CO2 levels are only admitted when gas contains
very low water vapours. CO2 is present in syngas which can cause “flame lift”. This is a
dangerous situation in residential areas were boiler and cooking flames can blow out. Green
gas injection is currently only realised on regional low calorific gas grids due to its low
energetic value. Since green gas is blended in, extra parameters for qualities and potential
pollution are monitored. The systemic function of green-gas is perfectly suitable in terms of;
storability, flexibility, transportability and transportation costs. However the production of
biogas and blending it to green gas is very expensive which cannot exist without subsidy.
Hydrogen as an energy carrier on the Dutch gas grid is whole different story. This can be
done in the form of methane (by methanation of H2 with CO2) or with the pure injection of
hydrogen into the gas grid. The latter can potentially lead to some barriers, hydrogen is a
very small molecule which can “leak” through the metal and plastic material of the pipelines.
High contents of hydrogen can cause problems on the demand side of natural gas. Industrial
equipment such as gas turbines have technical limitations that can vary from traces of
hydrogen to 5% of hydrogen content. Residential equipment can handle up to 5-8% of
hydrogen maximum. Experiments have shown that the closed circuit gas grid on the Dutch
island of Ameland up to 20% hydrogen injections have been accomplished successfully.
Hydrogen itself can be produced in many ways which is influential for the production costs.
For the Dutch case it is interesting to focus on hydrogen produced with the power to gas
method from RES. This is economically not viable up till now, however power to gas
technology is still in its learning curve and RES production prices are decreasing.
The potential to utilise the infrastructure more than the future scenario of a Dutch
roundabout is there. Methods to utilise the gas grid can also deviate by inserting alternative
gasses such as; green gas and hydrogen. The low-calorific gas grid quality will be gradually
increased after 2021. The composition of G-gas is changed. A very progressive thought could
be that eventually the qualities of the high- and low- calorific gas grid would reach
corresponding energetic levels. This would have grave implications for all small scale
consumers domestically and neighbouring countries. Another interesting thought is that the
hydrogen production can be used to lower the energetic value of the imported high calorific
gas to G-gas quality for insertion into the low-calorific grid. However, the functions
mentioned in the bullet points of the last paragraph are more realistic. A smart gas grid can
be realised from a technical perspective. However, institutionally there are quite some
adjustments that have to be made in order to proceed with large scale hydrogen injections.
Economically, it is not yet very attractive to induce high sunk cost investments, knowing the
high production costs of these alternative gaseous energy carriers cannot be recovered in
the current market circumstances.
119
Chapter 9: Conclusion
The last chapter of this thesis will summarise the key findings. The thesis is divided into 6
sub-questions which all contribute answering the main research question. Paragraph 9.1
summarises the points of departure of this thesis, in addition the answers to each research
question will be repeated shortly with the main findings. In paragraph 9.2 an answer will be
formulated on the main research question. Some points of discussion will be added
subsequently on several aspects throughout thesis that are debatable. A personal reflection
is given in paragraph 9.4 with advice to new graduate students how to deal with the project
of a master thesis.
9.1 Recapitulation takeaways sub questions
At the introduction of this thesis the starting points and key deliverables were stated. Some
deliverables were clear cut targets while others were difficult to develop. Making a
visualisation representing energy flows (heat and gas) in the Rotterdam industrial cluster is a
(more) tangible deliverable. This abstract model needed to be extensive enough to
understand the heat exchange within the cluster. Eventually it should also become clear to
what extent natural gas is consumed for chemical conversion. Another more practical
deliverable is the portfolio with diversification options (alternatives) for industrial heat
consumers with an assessment of several technologies. A deliverable which is more of an
explorative nature is the understanding of a potentially elaborated heat exchange and the
market mechanisms behind it, this mechanism could become important for the Rotterdam
cluster. The last deliverable on the future function and role of natural gas in the Netherlands
involves future scenarios. The last chapter explored the ability to replace natural gas in some
industrial sectors and analyses how to utilise the gas infrastructure in a smarter way in the
future. The most important deliverable will be an answer on the main research. The main
research question of this thesis is:
“What influence has the reduction of gas production in the Netherlands on the energy
sourcing of the Rotterdam industrial cluster?”
This is a case specific study for the industrial cluster of Rotterdam. The sub questions that
support answering the main research question are the following:
Q1 What are the ideal properties of an energy supply source for industrial heating
processes?
Q2 What are the industrial energy flows for heat delivery in the Rotterdam cluster?
Q3 What are important industrial conversion processes fed by natural gas in the
Rotterdam cluster?
Q4 How can the industrial heating demand of the cluster be fulfilled by other means?
Q5 How will a future heat market potentially look like when further elaborated?

120
Q6 What is the future mechanism and changing function of gas and its
infrastructure?
Q1 on the criteria for an ideal energy supply source for industrial heating revealed the
complexity of industrial heat requirements. Describing the energy needs of the Rotterdam
cluster, in chapter 3, it became clear that the multiple criteria table was hard to satisfy.
There are technical specifications: capacity, reliably and availability properties which need to
be satisfied. In addition there are infrastructural requirements, quality requirements and
especially the cost aspects. To have an ideal energy supply source it should score high on all
criteria, yet for most energy supply sources trade-offs have to be made. Chapter 3 showed,
by means of this multi criteria table, that natural gas is a highly suitable energy source for a
cluster like Rotterdam. This set of criteria is used later on in chapter 6 assessing alternative
industrial heat sources.
Q2 on the industrial energy flows for heat delivery throughout the Rotterdam cluster an in
depth analyses of the cluster was made. First of all, this question led to visualisations of the
energy balance and energy consumption of the Netherlands. By mapping all the energy flows
with the right datasets some interesting conclusion have been made. The heat demand for
the Rotterdam cluster can be seen on figure 38 below.
Figure 38: Heat consumption Rotterdam cluster in Peta Joules (Davidse Consultancy, 2012)
Heat consumption is a significant part of the Rotterdam industrial energy usage. 149 Peta
Joule of heat is consumed for industrial heat in the Rotterdam cluster, which is more than
59% of the national energy consumption in the petrochemical and chemical sector.
Therefore heat is sometimes called “the motor of the industry”. On top of that, natural gas
is a large primary energy supplier for this industrial heat production, 60% of the heat
consumption in the Rotterdam cluster is directly supplied by means of natural gas
combustion in furnaces and CHP units. Affluent gasses and derived heat are an input for
industrial heat as well, therefore indirectly the primary consumption of natural gas for

121
industrial heating is much higher. Natural gas is in its turn the largest and almost only energy
supplier for this industrial heating production in the Rotterdam cluster. Shaping the
Rotterdam cluster heat demand in perspective it is comparable with 11.500MW of electricity
production capacity which needs to be fully utilised 24h a day, whole year round. That’s
roughly 37% of the total Dutch installed electricity production capacity. This shows our
dependency on natural gas in the Rotterdam cluster to heat industrial processes.
Q3 to determine the amount of natural gas used for conversion in industrial processes was
difficult. Multiple barriers hinder this analysis. Few datasets are publicly available due to
corporate sensitive information. All the main chemical production processes in the cluster
were analysed in order to map their natural gas usage as feedstock. The production of the
main chemical components can be realised via multiple alternative production techniques.
Alternative production processes, such as steam cracking of larger hydrocarbons, refining
crude oil or treating natural gas, can result in the same products. Therefore it is not easy to
assess how gas intensive the different chemicals produced in the Rotterdam cluster are. An
interesting conclusion that occurred during the research that the producing companies of
these main chemical ingredients form an oligopolistic structure. The companies Shell
Nederland Chemie, located in Pernis and Moerdijk, in combination with ExxonMobil
Chemical are the largest in this market. In addition there are BP and Lyondell Chemical.
Those four companies are the only suppliers of the main chemical feedstocks which keep the
chemical sector running. Natural gas used for conversion in the Rotterdam cluster is hard to
map. A dataset on national scale was used to get hold of natural gas used for conversion. All
natural gas that flows into the Dutch industrial sector is for 27% used in conversion
processes of (petro)chemical facilities. Yet again all this natural gas is not combusted for
heating but used for its molecular value, the other 73% is used for combustion as shown in
figure 38.
Q4 researching the alternatives for the industrial heating demand of the Rotterdam cluster
gave another insight on its gas dependency. The larger the potentials for alternative sources
of high quality heat, the lower the gas dependency of the cluster. The focus of this chapter is
narrowed down to just several techniques which are very promising in the Netherlands. The
alternatives were limited to the pillars of the Warmtevisie: biomass combustion and
biomass fermentation (biogas), geothermal energy and electrification. The criteria table
from the first research question was used. Almost all four technologies are very well suited
for utilisation with industrial heating purposes. The potential availability in terms of PJ on a
yearly basis is the smallest for biomass fermentation followed by biomass combustion.
Electrification and geothermal heat both have very high potential for the availability of
energy in the future. The economics however is the most decisive criterion for a technology
to succeed. Biomass combustion and digestion are both not economically viable and are in
need of subsidies. Geothermal heat recovery on the contrary may very well become
economically viable since ultra-deep heat recovery technology still is at the beginning of its
learning curve. Electrification is also expensive since gas or boiler parity needs to be reached
122
for industrial heating. Electrification is a proven technique which could be implemented
when electricity and gas prices allow. Geothermal energy for industrial heating purposes
could be very well likely in the near/long term future. However it is not necessary to fully
commit to one specific alternative technology for industrial heating, a portfolio of multiple
alternatives create a more stable and resilient output, also in terms of spreading the risks for
the Rotterdam cluster.
Q5, researched a potential elaborated future heat market and shows interesting
developments for low grade heat exchange throughout the Rotterdam cluster. The scope of
this chapter is on the residual heat infrastructure from the Rotterdam cluster to the city
centre. The interesting trend is that industrial plants are not only investigating a connection
to deliver heat surpluses, but also have demand for residual heat within the process
industry. Not only will heat flow from the cluster to the city, but it also flows back and forth
within the cluster, in fact an exchange of residual heat throughout the cluster will arise. This
means that the public and private sector will be served with this more elaborated
infrastructure. Another emerging phenomenon is Third Party Access on the heat grid. Large
industrial customers fall out of scope of the Warmtewet (under which residential heat
pricing is done via the NMDA-principle) which means that every large heat contract is open
for negotiation. A theoretical framework on critical transactions pointed out a suitable
coordinating model for the heat network in the cluster. The framework by Kunneke, on
different modes of coordinating infrastructures, opts for a monitoring body that utilises
capacity on the heat network. In addition this chapter analyses pricing mechanisms of other
energy commodities in order to check its suitability for low grade heat trading. Two market
mechanisms are investigated, the APX power trading platform and the TTF gas trading
platform, which are compared from a physical, economic and institutional perspective. Both
virtual trading platforms have their own characteristics, these are to a large extent defined
by the commodities that are traded. The low grade heat has many resemblances with the
commodity of natural gas. Both products are tangible and more importantly, storable (at
least for a few hours in the case of low grade heat). The TTF mechanism seem to fit
seamlessly with the low grade heat exchange regarding products from “balance of day” up
till “month ahead”. In addition the TTF platform offers a futures market which offers trade
up till five years ahead. From an institutional perspective a more evolved market mechanism
will be a large shift compared with the heat delivery from cluster to residential areas. There
will be a need for an agency to monitor trade and compliance to contracts. Logistically there
is need for a TSO of the heat infrastructure. Also financial arrangements and remuneration
schemes of infrastructures are different since private parties are involved. The costs of the
existing infrastructure are socialised while new connections to link companies to this
infrastructure are private investments.
Q6, the study on the future role of gas and the changing functions of the gas grid was a
combination of technical and exploratory research. The Rotterdam cluster is analysed on its
gas consumption for heat production (chapter 4) and gas consumption as feedstock for
123
(petro)chemical conversion (chapter 5). Potential alternatives for high quality heat are
investigated (chapter 6), alongside the more efficient usage of low grade heat (chapter 7).
These chapters help giving an evaluation n the ability to replace natural gas to some extent
in the Rotterdam cluster. There are some alternatives for high quality industrial heat, only
two show true potential, however both are not (yet) economically viable. Low quality heat
exchange can resolve potential useless deployment of high quality natural gas for low grade
heating purposes. Natural gas converted in the (petro)chemical industry are almost non-
replaceable since it is used for its molecular value instead of its energy content. Total gas
consumption for industrial heating and conversion in the Rotterdam cluster is very large and
it is likely that the cluster is still in need for natural gas for the long term future. The
societal role of natural gas is certainly present on the long term future. However to which
extent gas will be dominant is doubtful. Technical breakthroughs and top down policy
mechanisms can reach far in reducing gas consumption. Especially the role of low calorific
Groningen-gas in the Dutch energy system on the long term is uncertain. The potential to
utilise the infrastructure more than the future scenario of a Dutch gas-roundabout is
present. Methods to utilise the gas grid can also deviate by inserting alternative gasses Such
as; green gas (already operational) and hydrogen. There are some technological limitations
to the gas grid which are surmountable. A smart gas grid can be realised from a technical
perspective. However, institutionally there are quite some alterations that have yet to be
made in order to proceed with hydrogen injections on a large scale. Also economically it is
not very attractive to make high sunk cost investments knowing the high production costs of
these alternative gaseous energy carriers.
9.2 Conclusive answer on the main research question
The answers from the sub question together contribute to a firm answer on the main
research question and will be short. MRQ: “What influence has the reduction of gas
production in the Netherlands on the energy sourcing of the Rotterdam industrial cluster?”
The dependency of the Rotterdam cluster on natural gas has been established in detail. The
share of natural gas in the clusters’ energy consumption is about 60%, and most of this
energy is allocated for the production of heat. On top of that gas is also consumed (non-
energetic consumption) as feedstock for chemical conversion. As stated, 27% of all gas
consumed in the Dutch industrial sector is used as feedstock. The gas consumption for
heating purposes could be replaced to some extent with alternative technologies, such as;
geothermal heat recovery or electrification. However such alternatives are costly and still
require subsidies to create a viable business case. Learning curves could change the cost
curve for some of these technologies. Alternatives for low grade heat can be achieved with
an extensive heat network throughout the cluster to realise utilisations of heat surpluses and
deficits within the cluster. There are also countries in Europe, such as France and Germany,
which have much higher electrification rates in the (petro)chemical industry than the
Netherlands (IEA, 2015a). Both countries have an electricity consumption proportion which
is approximately twice as high as the Netherlands. This electrification is induced by past

124
policy decisions and historical choices. France for instance, has major surpluses in (mainly
nuclear driven) electricity production capacity that results in low electricity prices. Historical
choices to realise Security of Supply by stimulating nuclear energy eventually led to a more
electrified (petro)chemical industry. Dutch historical policy choices and resource availability
induced an energy sector which is highly interwoven with natural gas. Besides residential
heating, industries were attracted and tuned for natural gas.
Gas which is used for chemical conversion shows very little potential for replacement with
alternatives. Synthetic gas could be an option, although this is costly in comparison with gas
production/import. Therefore the dependency on natural gas in the Rotterdam cluster is
clear. For some applications of natural gas this is more evident, though take for example the
conversions in (petro)chemical facilities. The dependence to natural gas is severe, especially
in the industrial sector. Gas is never irreplaceable however there are some serious technical,
economic and institutional consequences tied to the alternatives.
The first section of the main research question, the declining Dutch gas production, is the
other aspect taken into account regarding the gas dependency of the Rotterdam cluster. The
production of low calorific Groningen gas is declining substantially. The status from a net gas
exporting country will shift to a net importer of natural gas within years. The type of gas
consumed by the 80 national largest industrial gas consumers, who are equipped for high
calorific gas quality alleviate the pressure to adapt to new realities, since this gas can easily
be imported. The high calorific gas-grid can facilitate the larger industrial customers
(Braaksma, 2015).
The declining production of low calorific gas requires the addition of nitrogen to domestic
produced high calorific gas (small fields) to mimic Groningen-quality. This means additional
high calorific gas needs to be produced or imported, and also industrial high calorific gas
supply could become more import dependent with declining small field production. The
other option is finding alternative gasses or technologies to supply the heat and gas
consumption for the Rotterdam cluster. The larger the potential for alternatives of high
quality heat production, the lower the natural gas dependency of the cluster. The rate of gas
dependency of the Rotterdam cluster is high and any disturbances or price peaks related to
the delivery of this crucial energy carrier can have a large impact.
We conclude that the declining Groningen gas production is not a critical problem for the
Rotterdam cluster. The cluster is certainly highly dependent on natural gas, which is hard to
substitute, but most of the industrial gas demand is not satisfied with low calorific gas. The
largest consumers in the Dutch industry are using high calorific gas, which can be imported
or produced from the small fields. However, the small field are nearing its end as well
(NLOG, 2015).
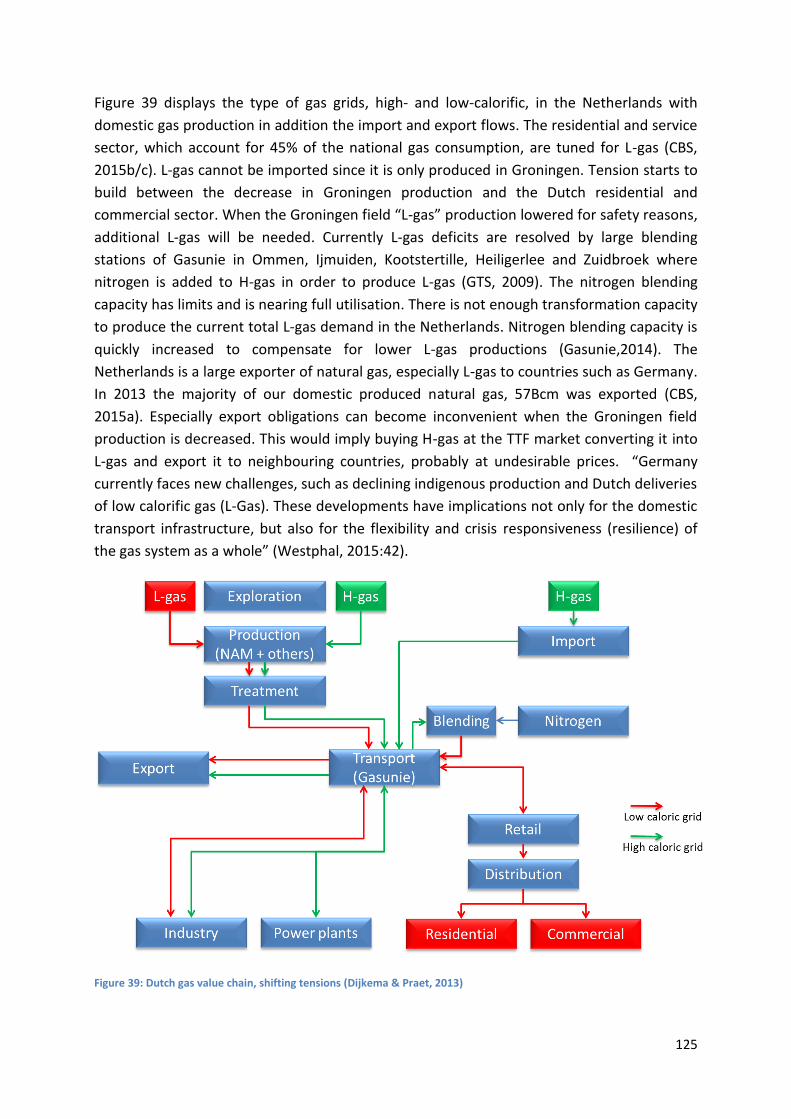
125
Figure 39 displays the type of gas grids, high- and low-calorific, in the Netherlands with
domestic gas production in addition the import and export flows. The residential and service
sector, which account for 45% of the national gas consumption, are tuned for L-gas (CBS,
2015b/c). L-gas cannot be imported since it is only produced in Groningen. Tension starts to
build between the decrease in Groningen production and the Dutch residential and
commercial sector. When the Groningen field “L-gas” production lowered for safety reasons,
additional L-gas will be needed. Currently L-gas deficits are resolved by large blending
stations of Gasunie in Ommen, Ijmuiden, Kootstertille, Heiligerlee and Zuidbroek where
nitrogen is added to H-gas in order to produce L-gas (GTS, 2009). The nitrogen blending
capacity has limits and is nearing full utilisation. There is not enough transformation capacity
to produce the current total L-gas demand in the Netherlands. Nitrogen blending capacity is
quickly increased to compensate for lower L-gas productions (Gasunie,2014). The
Netherlands is a large exporter of natural gas, especially L-gas to countries such as Germany.
In 2013 the majority of our domestic produced natural gas, 57Bcm was exported (CBS,
2015a). Especially export obligations can become inconvenient when the Groningen field
production is decreased. This would imply buying H-gas at the TTF market converting it into
L-gas and export it to neighbouring countries, probably at undesirable prices. “Germany
currently faces new challenges, such as declining indigenous production and Dutch deliveries
of low calorific gas (L-Gas). These developments have implications not only for the domestic
transport infrastructure, but also for the flexibility and crisis responsiveness (resilience) of
the gas system as a whole” (Westphal, 2015:42).
Figure 39: Dutch gas value chain, shifting tensions (Dijkema & Praet, 2013)
126
The Dutch residential and commercial sector are expected to still use low calorific gas in the
future. This implies more nitrogen blending capacity needs to be installed, which consumes
additional high calorific gas. Extra high calorific gas demand will create competition between
industrial and utility gas consumption on one hand and nitrogen blending facilities on the
other hand. The import of high calorific gas need to be increased, which makes the total
natural gas consumption in the Dutch energy sector more import dependent.
Therefore the decrease of the domestic gas production is not that big of a problem for the
Rotterdam cluster. It is rather a national problem of increased import dependency for H-gas.
Whereas competition would emerge for H-gas between high calorific gas consumers (utility
and industry) and the blending stations producing L-gas for national consumption and
export. In addition nitrogen blending capacity to produce L-gas could fall short if the
production of Groningen would decrease more rapidly than additional blending capacity can
be built. The problem of increasing national import dependency will be discussed in the
following section.
9.3 Discussion
This discussion paragraph will highlight the aspects of the Rotterdam gas dependency that
leave room for discussion. In addition topics for future research are addressed. Chapter 1 till
chapter 5 were more of an empirical nature, making a multi criteria analysis, mapping gas
and heat flows. From chapter 6 onwards more exploratory research is done. The chapter on
the alternatives for industrial heating leaves room for debate, especially regarding future
potential. There is also discussion on potential developments of the changing Dutch L-gas
quality. The comparison and testing of market models for potential low grade heat trading is
debatable. Uncertainties regarding the future situation of the Rotterdam cluster are
discussed as well. The final chapter on the dependency of the Rotterdam cluster on natural
gas is open for discussion, alongside the future function and utilisation of the gas
infrastructure.
The final answer on the gas dependency of the Rotterdam cluster on natural gas is evident.
Substitutions for natural gas are technical possible, however, in most cases they are not yet
economically viable or institutionally very difficult to obtain. The impact of decreasing
domestic production is present as well, although, the relation is indirect. As shown on figure
39, competition between the low- and high calorific gas consumers will increase with
demand for H-gas. The result is increasing volumes of H-gas import. The Netherlands will
become more import dependent on a national scale for their energy supply. Is this a
problem? The answer is no as long as imports are cheap and allow for diversified flows. “A
country which imports the majority of its energy at a sustainable cost and which ensures the
security of supply thanks to well-diversified sources will be dependent but not vulnerable”
(Reymond, 2007: 4174). Since the Netherlands operates a TTF platform that functions as a
gas trading platform for the whole of NWE market, diversification can be high (paragraph
7.4). The sources and owners of the gas flowing through the grid, in contrast with oil flows,

127
are not exactly known. Nevertheless, the origin of gas and direct dependencies on specific
countries can be proved by long term contracts.
Another uncertainty is the difficulty to estimate what a cluster as Rotterdam will look like in
the longer term future. Demand side developments could drive major changes of the cluster.
Refineries could experience competition from oil-product imports substituting for
domestically refined oil-products. Larger basic refineries may have left already, only leaving a
refinery sector for must run capacities, such as speciality chemicals and niche
petrochemicals (IEA, 2015b; Janssens, & Fitzgibbon, 2015).This would also influence the
chemical and petrochemical facilities attached to these oil-product flows. The cluster can still
be dependent on gas or crude oil flows in the long term future, but then again, if the size of
the cluster shrinks, the security of supply is less an issue. An interesting topic for future
research could be the analysis of the Dutch energy sector, in particularly the energy balance
regarding oil-products, given a scenario in which the Rotterdam cluster is significantly
smaller. What would this mean for the dependency of oil-product imports? Are there
enough political stable suppliers to diversify product imports?
The potential for alternative industrial quality heat sources is to be discussed. Ultra-deep
geothermal heat recovery shows large potential since it is a technology which can offer very
high heating temperatures for low costs. Direct heat from the ground in the form of steam,
available almost anywhere, can become a large source for industrial clusters, especially since
it is a technology still in its development phase. Internationally there are some successful
projects realised, in the Netherlands ultra-deep geothermal energy recovery is still in its
research phase. The Netherlands has a lot of experience with deep underground drillings,
reservoir stimulation and drilling in combination with seismic activity. This knowledge could
very well be applied for heat recovery. To which extent the other alternatives could be
implemented throughout the Rotterdam cluster will depend on the effect of strict top-down
policy or for example a technology push. Multiple alternatives may emerge on the long term
future for industrial heating supply. It is not necessary to fully commit to one specific
alternative technology for high grade industrial heating. A portfolio of multiple alternatives
creates a more stable and resilient output, also in terms of spreading the risks for the
Rotterdam cluster. A potential topic for future research could be a really in depth analysis of
ultra-deep geothermal heat recovery technology. This would be especially interesting when
applied for the case of the Netherlands regarding economics and public acceptance. This
thesis already did some research into this technology, however, there is room for further
elaboration.
The potential to utilise the gas infrastructure more extensively than in the future scenario of
a Dutch roundabout is there. Methods to utilise the gas grid are for example the insertion of
alternative gasses such as; green gas and hydrogen. The low-calorific gas grid quality will be
gradually increased after 2021, the composition of G-gas is changed. A forward looking
thought could be that eventually the qualities of the high- and low- calorific gas grid would
128
reach corresponding energetic levels. This would have crucial implications for all small scale
consumers domestically and in neighbouring countries. It is unknown what government
strategies could be regarding the future gas quality and use of the high- and low- calorific gas
grid. This is a topic open for discussion. Another interesting thought is that hydrogen
production can be used to lower the energetic value of the produced/imported high calorific
gas to create G-gas quality for insertion into the low-calorific grid. Since hydrogen has a low
calorific value it could substitute the function of nitrogen by blending to the right calorific
value. This allows both gas grids to co-exist with the addition of hydrogen gas (created with
RES or not) in the gas system (Nelson, 1994). The role of the Dutch government in utilising
this infrastructure is to a large extent influenced by policy and politics. The infrastructure is
there, however whether the Netherlands should facilitate just a gas roundabout or a smart
gas grid is left uncertain.
Another topic for future research could be an investigation of a heat network which
transports high pressurized steam. Means to store high grade heat is not feasible on a large
scale which makes it necessary to consume heat the same instant it is produced. A market
mechanism trading high grade heat would be institutionally and technically challenging.
9.4 Reflection
The reflective section is on three main aspects; the stronger and weaker points of this thesis,
the added value of this thesis, and the learning points of this research, which could be useful
for new graduation students how to approach the project of a master thesis.
Stronger and weaker aspects
A very strong aspect of this thesis is the factual reporting on the Rotterdam cluster. From an
energy perspective there are many things going on in a very large energy-intensive industrial
area. Throughout this thesis much information is confined which portrays a good overview
on the energy usage of the harbour. There are tables showing all the hardware of the cluster
from refineries to CHP units. Accessible visualisations of the industrial heat demand and the
sources of heat supply are depicted in Sankey diagrams that show the flows in proportions.
The chapter on natural gas used for chemical conversion is less powerful in the sense of
organising data to gain new insights. Overviews are given of the chemical products produced
and its main feedstocks. However it was not possible to give insight in the gas intensity of
these products for Rotterdam. Therefore data was used on the (petro)chemical sector on a
national scale, which led to interesting outcomes as well. Some interesting results were
deducted on the type of (petro)chemistry going on in the Rotterdam cluster and the market
structure in which it operates. The production of the main chemicals depends on just four
companies supplying basically the whole chemical sector in the cluster.
Another useful insight is chapter where four alternative technologies for high quality
industrial heating were investigated. Obviously there are more technologies to produce high
quality heat, but scope limitations had to be made, which makes this chapter less firm.
129
However, the assessment of the technologies to the framework created in chapter 3 gave
interesting results. All four technologies are technically feasible. The economics however,
which is the most decisive criterion for a technology to succeed, are problematic up till now.
Interesting examples of other countries with successful implementations are described,
which confirmed certain technologies are applicable (sometimes at a large scale) for
industrial heating.
The growing potential of low quality heat exchange in the Rotterdam cluster is another
aspect of this thesis. The potential utilisation of the already existing heat infrastructure is
interesting for energy efficiency in the cluster. This trend is described and analysed with an
empirical comparison of two energy trading platforms. The comparison of heat as a
commodity with other commodities such as electricity and natural gas are an interesting
addition to this thesis. Since this is less factual the fortitude of this piece is less certain.
However, the theoretical aspect of this chapter is elaborated. The theoretical framework on
critical transactions and coordination modes for infrastructures by Kunneke is applied for the
case of a Rotterdam heat network. This theoretic perspective pointed out an institutional
guideline for organising the governance of the heat network.
The last chapter on the utilisation of the Dutch gas infrastructure is of an exploratory nature
as well. Several trends and potential technologies for the future utilisation of the gas grid are
investigated. Whether this will be reality in the future is not the issue, it shows potential
scenarios. This does not imply the chapter is weaker than the others, there simply has more
aspects which are open for discussion. Hydrogen an biogas could be utilised on the gas grid
and are approached from a technological, economic and institutional perspective which
gives it a proper balance. The in-depth research of alternative gasses in combination with
the Dutch gas infrastructure, described from three perspectives, is a useful piece of research.
Added value
The added value of this thesis is twofold; it provides new data and there is theoretic testing.
The existing knowledge on gas usage and gas dependency of the Rotterdam cluster was
rather narrow. This thesis gives an overview of heat consumption and production on the
industrial and national scale. In addition the research has provided multiple Sankey
visualisations that give a direct overview in energy flows to its proportions; these
visualisations are easy to read and present crucial elements of the Dutch energy sector, this
is a real added value. The visualisation on the Dutch energy balance has already been
extensively used in the public and research sector. Equally interesting is the mapping of the
conversion processes and resource dependency of the natural gas as molecule for the
(petro)chemical sector.
The theoretic framework of critical transactions in combination with infrastructures by
Kunneke is tested in chapter 7. The theoretic framework is applied on the heat exchange
network of Rotterdam where it points out a suitable mode of coordination to manage the
operations. In addition the assessment of trading heat as a commodity in perspective of two

130
virtual trading markets is a theoretic addition by testing existing market models on a case
study. Contracts for low temperature heat exchanges are normally between a distributor
and residential customers. The case of Rotterdam entails potential low grade heat exchange
on a heat network with third party access. Heat delivery would expected to be arranged with
bilateral contracts. Testing different market models for several variations for this case is a
useful approach.
Learning points
This section may serve as an advice to future graduate students how to approach the project
of a master thesis. It addresses aspects that were difficult during the research or that I would
have done differently retrospective.
The start of the six month research period, which eventually became eight months, was a
period of getting accustomed to full time research on your own. Doing a master thesis at a
think tank is equally interesting as it is a challenge. Being in charge of your own master thesis
with just a vague idea of the topic and scope, leaves you with many question? This starting
period is usually spent between stacks of books, which really helps to get a grip on your topic
and forming a mental picture of your potential scope. As an advice, I would suggest start
writing your research proposal from day one. Have a text file open to note down quotes or
useful pieces of information or sources besides reading. There is a risk that after a month of
reading your scope will get wider and wider. Writing your research proposal for your kick-off
meeting and keeping it up to date is important. By constantly iterating this proposal you can
later on use it as your introduction in your thesis. This introduction and methodology
function as a sort of blueprint for your research project and as a fall-back storyline.
A time schedule planned per; section, paragraph or chapter helps you get an overview on
the whole project. From personal experience it is really hard to keep up with your original
planning. Most likely there are difficulties finding the right datasets, doing a modelling
exercise or planning interviews. By keeping a time schedule, you’re creating a hold on your
project. It is your own project, which basically entails your “own show”; managing
appointments and contacts with the graduation committee, arranging all practical things,
down to the level of reserving rooms and parking spots. This can be confusing. However,
with some planning and a large to do list at the beginning of every week, much can be
achieved.
During the research phase it is sensible to write chapters as well. The switch from gathering
information to writing plain text is difficult. It sometimes helps to have a slide pack in
addition to your thesis, which must be updated continuously. Presenting these slides or
discussing them during interviews, with colleagues or tutors, gives you a reflective moment.
These presentations are also a very useful way of feedback for the development of chapters,
crucial information can be supplied via the open discussion afterwards. During my
presentations and interviews I stated that no quotes would be used or recordings made, this

131
eased the conversations, often leading to useful information exchange. The search through
public data is much easier when guided by these expert insights and can speed up your
research project with weeks when a crucial report or the right direction is pointed out.
132
Literature Key reports Davidse Consultancy. (2012). Warmte-energie, de motor van de industrie: Ontwikkelingen in het gebruik en de opwekking van industriële warmte. Http://www.vnpi.nl/Files/file/ 20121021%20Davidse%20Rapport%20Warmteonderzoek%20MEE%20definitief.pdf IF WEP, Ecofys, TNO. Commisisoined by AgentschapNL. (2011). Diepe geothermie 2050: Een visie voor 20% duurzame energie voor Nederland. Http://geothermie.nl/fileadmin/user_upload/ documents/reports/IF_Ecofys_TNO_-_Visie_diepe_geothermie.pdf Krebbekx, J.A., Wolf, W.J., de, Lenselink, J.G.J., Nossin, P.M.M., (2010). Van glazen bol naar rondbodemkolf! Nu de sleutelrol waarmaken: Voorstudie Chemie MEE/MJA3. Http://refman.et-model.com/publications/1590/download. Lako, P., Luxembourg, S.L., Ruiter, A.J., in ’t Groen, B., (ECN & KEMA). (2011). Geothermische energie en de SDE: Inventarisatie van de kosten van geothermische energie bij opname in de SDE. Http://www.ecn.nl/docs/library/report/2011/e11022.pdf. Port of Rotterdam. (2010). Facts & figures Rotterdam Energy Port and Petrochemical Cluster. Http://www.portofrotterdam.com/nl/Business/natte-bulk/Documents/Facts-figures- Rotterdam-Energy-Port-and-Petrochemical-Cluster.pdf. VNCI. (2013). Routekaart chemie 2013-2030: Energy-efficiency. Http://www.routekaartchemie.nl/images/overzicht-rapport-per-hoofdstuk-in- pdf/routekaart-chemie_h6.pdf Scientific literature Ammar, Y., Joyce, S., Norman, R., Wang, Y., Roskilly, P.R., (2012). Low grade thermal energy sources and uses from the process industry in the UK. In: Applied Energy, Vol.89, P.3-20. Bergek, A., Jacobsson, S., Carlsson, B., Lindmark, S., Rickne, A., (2008). Analyzing the functional dynamics of technological innovation systems: A scheme of analysis. In: Research Policy, Vol.37, P.407-429. Caillat, S., Vakkilainen, E., (2013). Large-scale biomass combustion plants: an overview. In: Biomass
Combustion Science, Technology and Engineerin. ISBN: 978-0-85709-131-4. Denmark:
Woodhead Publishing.
Correljé, A.F., Linde, J.G., van der, Westerwoudt, T., (2003). Natural Gas in the Netherlands: From
Cooperation to Competition? ISBN: 90 5031 084 2.
Correljé, A.F, Verbong, G. (2004) The transition from coal to gas: radical change of the Dutch gas
system. In: Elzen, B., Geels, F., Green, K., (Eds.) Break on through to the other side:
Technological transitions to sustainability through system innovation. Cheltenham, UK:
Edward Elgar.
Denman, K.L., G. Brasseur, A. Chidthaisong, P. Ciais, P.M. Cox, R.E. Dickinson, D. Hauglustaine, C.
Heinze, E. Holland, D. Jacob, U. Lohmann, S Ramachandran, P.L. da Silva Dias, S.C. Wofsy and
X. Zhang, 2007: Couplings Between Changes in the Climate System and Biogeochemistry. In:
Climate Change 2007: The Physical Science Basis. Contribution of Working Group I to the
Fourth Assessment Report of the Intergovernmental Panel on Climate Change [Solomon, S.,
D. Qin, M. Manning, Z. Chen, M. Marquis, K.B. Averyt, M.Tignor and H.L. Miller (eds.)].
Cambridge University Press: Cambridge, United Kingdom and New York, NY, USA.
Dijkema, P.J., Praet, R., (2014). Design of Innovative Energy and Industry System (Part II). Reader SPM4510 2013/2014. Technical University of Delft, Faculty: Technology, Policy and Management.
133
Gracht, H.A., von der, Vennemann, C.R., Darkow, I.L., (2010). Corporate foresight and innovation management: A portfolio-approach in evaluating organizational development. In: Futures, Vol.42, P. 380-393. Hagen, van der, T.H.J.J, Herder, P.M., Hellinga, C. (2015). Het Delft Plan: Nederland als Energy Gateway. Http://www.tudelft.nl/fileadmin/Files/tudelft/onderzoek/energy/ HET_DELFT_PLAN.pdf. Herder, P., Dijkema, G., (2011). Reader Design of innovative systems in Energy & Industry SPM4510 Version April 2011. Number: 069S0040. Hupa, M. (2012) Ash-related issues in fluidized-bed combustion of biomasses: Recent research highlights. In: Energy Fuels , Vol. 6, Nr. 1, P. 4-14. Junge, S. (2009). Cost-effective electric boilers. In: Heating/Piping/Air Conditioning Engineering. Vol.81, Nr.1, P.22-26. Kunneke, R., Groenewegen, J., Ménard, C., (2010). Aligning modes of organization with technology: Critical transactions in the reform of infrastructures. In: Journal of Economic Behavior and Organization, Elsevier, Iss.75, Nr.3, P.494-505. Lichtenthaler, E., (2007). Managing technology intelligence processes in situations of radical technological change. In: Technological Forecasting & Social Change, Vol.,74, P.1109-1136. Liew, P.Y., Lim, J.S., Alwi, S.R.W., Manan, Z.A., Varbanov, P.S., Klemes, J.J., (2014). A retrofit framework for Total Site heat recovery systems. In: Applied Energy, Vol.135, P.778-790. Loo, van S., Koppejan, J. (2008). The Handbook of Biomass Combustion and Co-firing. Earthscan. ISBN 9781844072491. London, UK. Nelson, R.R., (1994). Co-evolution of technology, industrial structure, and supporting institutions. In: Industrial and Corporate Change, Vol.3, Nr.1, P47-63. Nelson, R.R., Sampat, B.N., (2001). Making sense of institutions as a factor shaping economic performance. In: Journal of Economic Behavior & Organization, Vol.44, P.31-54. Reymond, M., (2007). European key issues concerning natural gas: Dependence and vulnerability. In: Energy Policy, Vol.35, Nr.8, P. 4169-4176. Rooijers, F., Wielders, L., Schepers, B., Croezen, H., Bruyn, S. de, (GasTerra) (2009). Natural gas as a transitional fuel: For a sustainable energy future. ISBN 978 0 79147 09 0. Selkimäki, M., Mola-Yudego, B., Röser, D., Prinz, R. and Sikanen, L., (2010). Present and future trends in pellet markets, raw materials, and supply logistics in Sweden and Finland. In: Renewable and Sustainable Energy Reviews. Vol. 14, Nr.9, P.3068-3075. Suurs, R.A.A., Hekkert, M.P., (2009). Cumulative causation in the formation of a technological innovation system: The case of biofuels in the Netherlands. In: Technological Forecasting & Social Change, Vol.76, P.1003-1020. Westphal, K., (2015). Institutional change in European natural gas markets and implications for energy security: Lessons from the German case. In: Energy Policy, Issue74, P.35-43. Widell, H., (2013). Industrial- scale biomass combustion plants: engineering issues and operation. In: Biomass Combustion Science, Technology and Engineerin. ISBN: 978-0-85709-131-4. Denmark:Woodhead Publishing. Williamson, O.E., (1998). Transaction Cost Economics: How It Works; Where It is Headed. In: The Economist, Vol. 146, Nr.1, P.23-58. Zhang, Q. (2003). Recent Progress in Direct Partial Oxidation of Methane to Methanol. In: Natural Gas Chemistry. Issue.12, P. 81-89. Public Research ACM. Autoriteit Consument en Markt. (2007). Acceleration of the development of the TTF and the gas wholesale market. Https://www.acm.nl/download/documenten/nma/ NMa_TTF_rapport_DEF.pdf Alderliesten, P., (2013). ECN R&D plan voor 2014 Energiebesparing in de Industrie. Https://www.ecn.nl/fileadmin/ecn/units/eei/ECN_RD_plan_EBI_2014.pdf CBS Statistics Netherlands. (2015a). Energy balance sheet; key figures. Retrieved:
134
Http://statline.cbs.nl/StatWeb/publication/?DM=SLEN&PA=37281ENG&la=en. Last visited: 13-2-2015. CBS Statistics Netherlands. (2015b). Natural gas balance sheet; supply and consumption. Retrieved: Http://statline.cbs.nl/Statweb/publication/?DM=SLEN&PA=00372ENG&D1=8- 14&D2=579&LA=EN&VW=T. Last visited: 16-2-2015. CBS Statistics Netherlands. (2015c). Natural gas, electricity; supplies national grid to construction, services. Http://statline.cbs.nl/Statweb/publication/?DM=SLEN&PA=82117ENG& D1=0&D2=a&D3=l&LA=EN&HDR=T,G2&STB=G1&VW=T. Last visited: 16-2-2015. CBS Statistics Netherlands. (2015d). Energieverbruik sector particuliere huishoudens; energiedragers. Retrieved: Http://statline.cbs.nl/Statweb/publication/?DM=SLNL&PA=82375NED&D1=0&D2= a&D3=l&VW=T. Last visited: 18-2-2015. CE Delft. (2004). Op weg met Waterstof Kansen en knelpunten voor waterstof als energiedrager in transporttoepassingen. Http://www.ce.nl/publicatie/op_weg_met_waterstof/23. CE Delft, (2009). Cost drivers warmtelevering in Nederland: Inzicht in de belangrijkste cost drivers van warmteleveranciers in Nederland. Publication number: 09.3030.44. Dijkema, G.P.J. (2012). De huidige inrichting van “de chemische industrie”. Systemen in Energie, Water en Industrie - spm1530. Https://svn.eeni.tbm.tudelft.nl/Education/spm1530/ A_spm1530_hoorcolleges/spm1530_2012_2013_hc4_petrochemie_may_6_2013.pdfDNV-GL. (2013). European cooperation on power to gas for future energy systems. Http://www.dnv.nl/nieuws_events/nieuws/2013/european_cooperation_on_power-to- gas_for_future_energy_systems.asp. Last visited: 28-09-2015. ECN. (2009). Brandstofcellen en waterstof. Http://cop15.ecn.nl/uploads/media/factsheet_waterstof.pdf. Last visited: 29-09-2015. ECN, RVO, De Gemeynt, Groen Gas NL. (2014). Routekaart hernieuwbaar gas. Http://www.noord- holland.nl/web/file?uuid=cc725d6d-cbea-4001-bae8-d54fb5adad12&owner=e41d4d86- 29be-4bd7-9342-1cdba91b88bb. ECN. (2015). Power-to-Gas belangrijk voor CO2-reductie, maar te duur als back-up zon en wind Https://www.ecn.nl/nl/nieuws/item/power-to-gas-belangrijk-voor-co2-reductie-maar-te- duur-als-back-up-zon-en-wind/. Last visited: 1-10-2015. ECOFYS. (2014). Warmteladder Afwegingskader warmtebronnen voor warmtenetten. Project
number: INDNL14405
ECN. (2014). Nationale Energieverkenning 2014.
Https://www.ecn.nl/publicaties/PdfFetch.aspx?nr=ECN-O--14-036.
Publication ECN: ECN-O--14-036.
Eurogas. (2014). Statistical report 2014.
Http://www.eurogas.org/uploads/media/Eurogas_Statistical_Report_2014.pdf
Eurostat. (2013). Energy, transport and environment indicators; 2013 edition.
ISBN 978-92-79-33105-3.
Eurostat. (2014). Half-yearly electricity and gas prices. Http://ec.europa.eu/eurostat/statistics-
explained/index.php/File:Half-yearly_electricity_and_gas_prices,_first_half_of_year,_
2011%E2%80%9313_(EUR_per_kWh)_YB14.png. Last visited: 17-2-15.
Eurostat. (2015). Supply, transformation and consumption of solid fuels - annual data. Http://appsso.eurostat.ec.europa.eu/nui/show.do?dataset=nrg_101a&lang=en. Fraunhofer IFAM. (2014). Multi Grid Storage – Using Gasor Heat Networks to Improve the Flexibility of the Electricity Sector. Http://www.ifam.fraunhofer.de/content/dam/ifam/de/documents/ Formgebung_Funktionswerkstoffe/Energiesystemanalyse/140514MuGriSto-Fette-IRENEC.pdf Gasterra. (2009). Natural gas as a transitional fuel: For a sustainable energy future. Groningen: Castell International Publishers, ISBN: 978079147090.

135
Geothermal Energy Association (GEA). (2013). The Values of Geothermal Energy: A Discussion of the Benefits Geothermal Power Provides to the Future U.S. Power System. Http://www.geothermal.org/PDFs/Values_of_Geothermal_Energy.pdf Hazebroek, P., (2014). Strengere eisen belemmeren groei van groen gas: Meer groen gas uit afval. Http://www.verenigingafvalbedrijven.nl/fileadmin/user_upload/Documenten/ PDFartikelen2014/VA_Meer_groen_gas_uit_afval_juni_2014.pdf International Energy Agency (IEA). (2007). Bioenergy Project Development & Biomass Supply. Http://www.iea.org/publications/freepublications/publication/biomass.pdf International Energy Agency (IEA). (2012). Oil & Gas Security: Emergency Response of IEA Countries. The Netherlands. Http://www.iea.org/publications/freepublications/publication/ Oil&GasSecurityNL2012.pdf. International Energy Agency (IEA). (2015a). Netherlands: Balances for 2012. Http://www.iea.org/statistics/statisticssearch/report/?country=NETHLAND=&produc t=balances&year=Select. Last visited: 08-05-2015. International Energy Agency (IEA) (2015b). ‘Oil: Medium-Term Market Report’. Https://www.iea.org/bookshop/702-Medium-Term_Oil_Market_Report_2015. Janssens, T., Fitzgibbon, T. (2015). Profitability in a world of overcapacity. McKinsey&Company. Http://www.mckinsey.com/~/media/mckinsey/dotcom/client_service/oil%20and%20gas/pdf s/profitability_in_a_world_of_over_capacity.ashx Kramers, L., Wees, J.D., van, Pluymaekers, M.P.D., Kronimus, A., Boxem, T., (2012). Direct heat resource assessment and subsurface information systems for geothermal aquifers; the Dutch perspective. In: Netherlands Journal of Geosciences - Geologie en Mijnbouw. Vol.91. Nr.4, P.637-649. Malek, M. (2005). Boiler Design. Power boiler design, inspection and repair. New York: McGraw-Hill. ISBN: 0071432027 NATO support and procurement agency. (2015). CEPS Network. Http://www.nspa.nato.int/en/organization/CEPS/network.htm. Last visited: 21-10-2015. Overheid. (2015). Warmtewet. Http://wetten.overheid.nl/BWBR0033729/geldigheidsdatum_16-11- 2015. Last visited: 16-11-2015. Oxford Institute for Energy Studies. (2014). Reducing European Dependence on Russian Gas: distinguishing natural gas security from geopolitics. Http://www.oxfordenergy.org/wpcms/ wp-content/uploads/2014/10/NG-92.pdf. ISBN 978-1-78467-014-6. Oxford Institute for Energy Studies (2015). The Role of Gas in UK Energy Policy. Http://www.oxfordenergy.org/wpcms/wp-content/uploads/2015/07/NG-100.pdf. ISBN 978-1-78467-034-4. Velghe, F., Wierinck, I. (Organic Waste Systems). (2013). Evaluatie van de vergisters in Nederland: Fase II. Commissioned by: Agentschap NL. Http://www.rvo.nl/sites/default/files/2013/10/ Evaluatie%20vergisting%20NL%20Fase%202%20eindrapport_finaal_okt%202013.pdf Netbeheer Nederland. (2015). Storingen. Http://www.netbeheernederland.nl/netbeheer-voor- u/storingen/. Last visited: 04-08-2015. Oldenziel, J. (2012). Deltalinqs Energy Forum, November 14th 2012. Http://www.deltalinqsenergyforum.nl/documents/2012/EUROGEN%20CV%20DEF%2014- 11-2012.pdf Port of Rotterdam. (2013). Haven Infrastructuur. Http://www.portofrotterdam.com/nl/Over-de- haven/havenstatistieken/Documents/Haveninfrastructuur.pdf Port of Rotterdam. (2015). Havensegmenten. Http://www.portofrotterdam.com/NL/OVER-DE- HAVEN/HAVENKAARTEN/Pages/havensectoren.aspx. Last visited: 8-04-2015. Rotterdam Climate Initiative (2011). Air Liquide. Http://www.rotterdamclimateinitiative.com/ documents/Factsheets/Air-Liquide.pdf. RVO. (2007). VOL GAS VOORUIT! De rol van Groen Gas in de Nederlandse energiehuishouding. Http://www.rvo.nl/sites/default/files/bijlagen/Vol%20Gas%20Vooruit%20-
136
%20De%20rol%20van%20Groen%20Gas%20in%20de%20Nederlandse%20energiehui shouding_0.pdf RVO. (2011). Stoomgrid Delfzijl voorziet industrieterrein van stoom en warmte. Http://www.rvo.nl/sites/default/files/bijlagen/restwarmte_Stoomgrid_ Delfzijl%20AVI%20stoomnetwerk.pdf Ybema, R., Sypkens Smit, A., Jurjus, A., (2014). Energietrends 2014: Een uitgave van ECN, Energie- Nederland en Netbeheer Nederland. Publication ECN: ECN-O--14-041. News Berentsen, L., (2015). Henk Kamp raakt verstrikt in strijdige gasbelangen en Gronings wantrouwen. In: Financiële Dagblad. Http://fd.nl/economie-politiek/1090833/henk-kamp-raakt- verstrikt-in-strijdige-gasbelangen-en-Gronings-wantrouwen. 31-1-2015. Dijk, B., (2015). Gascentrales in voortbestaan bedreigd. In: Financiële Dagblad. Http://fd.nl/ondernemen/1124474/gascentrales-in-voortbestaan-bedreigd. 26-11-2015. Kamp, H.G.J., (2015). Minister of Economic Affairs. Kamerbrief Warmtevisie. Http://www.rijksoverheid.nl/documenten-en-publicaties/kamerstukken/2015/04/02/ kamerbrief-warmtevisie.html. Published: 02-04-2015. Schneider, M. (2012). "Nuclear power post-Fukushima: Maybe France no exception after all". Kyodo News. Https://english.kyodonews.jp/news/2012/04/152117.html. Last visited 06-08-2015. Staatscourant. (2014). Regeling van de Minister van Economische Zaken van 11 juli 2014, nr. WJZ/13196684, tot vaststelling van regels voor de gaskwaliteit (Regeling gaskwaliteit). Nr. 20452. Https://zoek.officielebekendmakingen.nl/stcrt-2014-20452.html. Swedish Gas Centre. (2012). Basic Data on Biogas. ISBN: 978-91-85207-10-7. Www.sgc.se. Weissink. (2015). Raad van State verlaagt plafond Groningse gaswinning. In: Financiële Dagblad. Http://fd.nl/economie-politiek/1127741/raad-van-state-wijst-groningse-gaswinning-af. Published: 18-11-2015. Last visited: 20-11-2015. Weblinks Air Liquide. (2014). Waterstof: DE weg naar elektrische mobiliteit: Tankpro Congres Http://www.tankpro.nl/wp-content/uploads/2014/11/4-Presentatie-Air-Liquide.pdf. APX. (2015). APX Power NL. Https://www.apxgroup.com/trading-clearing/apx-power-nl/. Last visited: 16-09-2016. AVR (2015). AVR Rozenburg. Http://www.avr.nl/over-avr/onze-locaties/avr-rozenburg/ Last visited: 02-06-2015. ENERZI (heating reinvented).(2015). Heating methods. Http://www.enerzi.co/heatingnmethod.aspx. Last visited: 04-08-2015. Eurelectric (electricity for Europe). (2011). Electrification of Heating and Cooling: A Eurelectric policy paper. Http://www.danskenergi.dk/~/media/Filer_til_nyheder/Final_Policy_Heating_and_Co oling_2011_421_0001_01_E.ashx. Gasunie. (2014). Results in 2014. Http://report2014.gasunie.nl/en/2014/results-in-2014. Gasunie. (2015a). Het Transportnetwerk. Http://www.gasunietransportservices.nl/transportinformatie/het-transportnetwerk. Last visited: 07-05-2015. Gasunie. (2015b). Unit Converter. Http://www.gasunietransportservices.nl/en/unit-converter-2. Last visited: 05-06-2015. Gasunie. (2015c). TTF. Http://www.gasunietransportservices.nl/producten-diensten/entry- exitcapaciteit/ttf. Last visited: 16-09-2015. Gate Terminal. (2015). Historical data Http://gate.nl/en/commercial/operational-data.html. Last visited: 01-10-2015. GTS. (2009). Quality and Capacity Document 2009. Http://www.gasunietransportservices.nl/ uploads/bestanden/ad9206b1-c574-48e9-8e62-5fd78d844ebb. GTS. (2015a). Groen gas. Http://www.gasunietransportservices.nl/over-gts/groen-gas. Last visited:
137
01-10-2015. GTS. (2015b). Nominations for TTF and TTFB. Http://www.gasunietransportservices.nl/en/transportinformation/operational- handling/nominations-for-ttf-and-ttfb. Last visited: 17-11-2015. Inside-R. (2015). What is R?. Http://www.inside-r.org/what-is-r. Last visited: 13-05-2015. Keeton, R., (2014). Rotterdam Is Building an Ingenious, Super-Green City Heating System. Http://nextcity.org/daily/entry/rotterdam-is-building-an-ingenious-carbon-slashing- heating-system. Kennislink. (2012). Koken op waterstofgas. Http://www.kennislink.nl/publicaties/koken-op- waterstofgas. Last visited: 01-10-2015. Leonardo Energy. (2012). UNDERSTANDING THE ELECTRIFICATION OF INDUSTRIAL ENERGY CONSUMPTION IN EUROPE. Http://www.leonardo-energy.org/blog/understanding- electrification-industrial-energy-consumption-europe. Last visited: 04-08-2015. Milieuloket. (2015). Waterstof. Http://www.milieuloket.nl/id/vhurdyxrmmz2/waterstof. Last visited: 29-09-2015. Nederlands Olie en Gas Portaal (NLOG). (2015). Olie & Gas. Http://www.nlog.nl/nl/oilGas/oilGas.html. Last visited: 18-2-2015. Petrochemicals Europe. (2015). Http://www.petrochemistry.eu/flowchart.html. Last visited: 25-06- 2015. Platform Bioenergie (PBE) (2015). PBE-bijdrage aan de open consultatie ‘Energieadvies 2050’ van de Raad voor de leefomgeving en infrastructuur. Letter to RLI by Fokke Goudswaard (PBE). May 29, 2015. Rattner, A.S., Garimella, S., (2015). USA Waste Heat Resources and Applications. Http://www.stwing.upenn.edu/~salexa/Research-WasteHeat.htm. Last visited: 10-04-2015. RVO. (2015a). Bodemenergie/Aardwarmte. Http://www.rvo.nl/onderwerpen/duurzaam- ondernemen/duurzame-energie-opwekken/bodemenergie/aardwarmte. Last visited: 29- 07-2015. RVO. (2015b). Hoogcalorisch gas (H-gas). Http://www.rvo.nl/onderwerpen/duurzaam- ondernemen/energie-en-milieu-innovaties/projectbureau-nieuw-aardgas/hoogcalorisch-gas- h-gas. Last visited: 25-09-2015. Sandt, T., van de. (2010). Onderzoek naar elektriciteit uit ultradiepe aardwarmte. Http://www.technischweekblad.nl/nieuws/onderzoek-naar-elektriciteit-uit-ultradiepe- aardwarmte/item4541. The ICE. (2015). Dutch TTF gas futures. Https://www.theice.com/products/27996665. Last visited: 17-11-2015. Tennet. (2015a). Installed capacity and fuel type. Http://www.tennet.org/english/ operational_management/system_data_preparation/Reported_production_capacity/ Installed_capacity.aspx. Last visited: 08-06-2015. Tennet. (2015b). Elektriciteitsnet. Http://www.tennet.eu/nl/nl/net-projecten/elektriciteitsnet.html. Last visited: 05-08-2015. TLV, a Steam specialist company. (2015). Superheated Steam Table. Http://www.tlv.com/global/TI/ calculator/superheated-steam-table.html. Last visited: 03-06-2015. TNO. (2015). ELECTRIFICATION OF THE CHEMICAL INDUSTRY. Https://www.tno.nl/en/focus- area/industry/sustainable-chemical-industry/efficient-processing/electrification-of-the- chemical-industry/. Last visited: 04-08-2015. Union Gas. (2015). Chemical Composition of Natural Gas. Http://www.uniongas.com/about- us/about-natural-gas/Chemical-Composition-of-Natural-Gas. Last visited: 07-05-2015. Van Gansewinkel Groep. (2015). Persdossier Stoomnetwerk Botlek (Rotterdam). Http://www.vangansewinkelgroep.nl/media/persdossiers/stoomnetwerk-botlek- rotterdam.aspx . Last visited: 01-06-2015. WEMW. (2015). Vereniging voor Energie, Milieu en Water Prijsvorming
138
Http://www.vemw.nl/Elektriciteit/Elektriciteitsmarkt/Prijsvorming.aspx. Last visited: 17-11- 2015. Visser & Smit Hanab. (2015). Stoompijp Botlek West. Http://www.vshanab.nl/nl/projecten/
detail/stoompijp-botlek-west. Last visited: 01-06-2015.
Warmtebedrijf Rotterdam, (WBR). (2015). Ontwikkeling portfolio botlek. Hand-out.
Www.warmtebedrijfrotterdam.nl
Interviews (by date)
- Ruud Melieste, corporate strategist Port of Rotterdam, and
- Hans van ’t Noordenede, Coordinator Deltalinqs Energy Forum. May 20th 2015, 10:30-12:00.
- Jacob Rookmaker, Head of Regulatory Affairs at RWE. June 16th 2015, 13:00-14:00.
- Wouter Verhoeven, Manager Business Development Warmtebedrijf Rotterdam. July 6th
2015, 15:30-17:00.
- Geert Kleisterlee, Manager Operations at Essent Moerdijk, and
- Carlo de Best, Performance Engineer at Essent Moerdijk. July 10th 2015, 13:00-16:30.
- Robert P.M. Stuyt, Partner at Brabers Corporate Counselling. August 11th 2015, 16:00-17:00.
- Robert P.M. Stuyt (Partner), Leo Melissen (Partner), Tom Jonker, Jan Verschoor, Willem van
Lanschot and Joppe van Onna. (Energy-panel of Brabers ). September 21st 2015, 16:00-18:00.
- Mr. Anne Braaksma, Public Affairs Adviser at GasTerra, and
- Noel Regan, EU Affairs Director Eurogas. August 11th 2015, 10:30- 13:00.
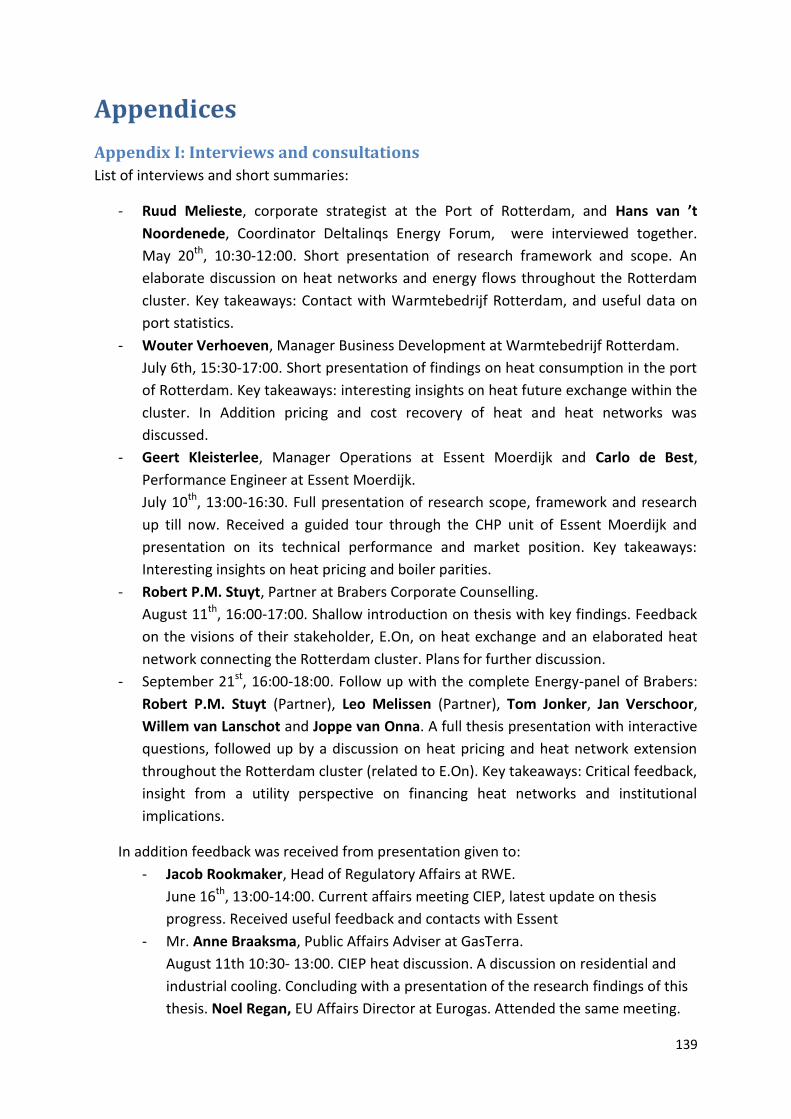
139
Appendices
Appendix I: Interviews and consultations
List of interviews and short summaries:
- Ruud Melieste, corporate strategist at the Port of Rotterdam, and Hans van ’t
Noordenede, Coordinator Deltalinqs Energy Forum, were interviewed together.
May 20th, 10:30-12:00. Short presentation of research framework and scope. An
elaborate discussion on heat networks and energy flows throughout the Rotterdam
cluster. Key takeaways: Contact with Warmtebedrijf Rotterdam, and useful data on
port statistics.
- Wouter Verhoeven, Manager Business Development at Warmtebedrijf Rotterdam.
July 6th, 15:30-17:00. Short presentation of findings on heat consumption in the port
of Rotterdam. Key takeaways: interesting insights on heat future exchange within the
cluster. In Addition pricing and cost recovery of heat and heat networks was
discussed.
- Geert Kleisterlee, Manager Operations at Essent Moerdijk and Carlo de Best,
Performance Engineer at Essent Moerdijk.
July 10th, 13:00-16:30. Full presentation of research scope, framework and research
up till now. Received a guided tour through the CHP unit of Essent Moerdijk and
presentation on its technical performance and market position. Key takeaways:
Interesting insights on heat pricing and boiler parities.
- Robert P.M. Stuyt, Partner at Brabers Corporate Counselling.
August 11th, 16:00-17:00. Shallow introduction on thesis with key findings. Feedback
on the visions of their stakeholder, E.On, on heat exchange and an elaborated heat
network connecting the Rotterdam cluster. Plans for further discussion.
- September 21st, 16:00-18:00. Follow up with the complete Energy-panel of Brabers:
Robert P.M. Stuyt (Partner), Leo Melissen (Partner), Tom Jonker, Jan Verschoor,
Willem van Lanschot and Joppe van Onna. A full thesis presentation with interactive
questions, followed up by a discussion on heat pricing and heat network extension
throughout the Rotterdam cluster (related to E.On). Key takeaways: Critical feedback,
insight from a utility perspective on financing heat networks and institutional
implications.
In addition feedback was received from presentation given to:
- Jacob Rookmaker, Head of Regulatory Affairs at RWE.
June 16th, 13:00-14:00. Current affairs meeting CIEP, latest update on thesis
progress. Received useful feedback and contacts with Essent
- Mr. Anne Braaksma, Public Affairs Adviser at GasTerra.
August 11th 10:30- 13:00. CIEP heat discussion. A discussion on residential and
industrial cooling. Concluding with a presentation of the research findings of this
thesis. Noel Regan, EU Affairs Director at Eurogas. Attended the same meeting.
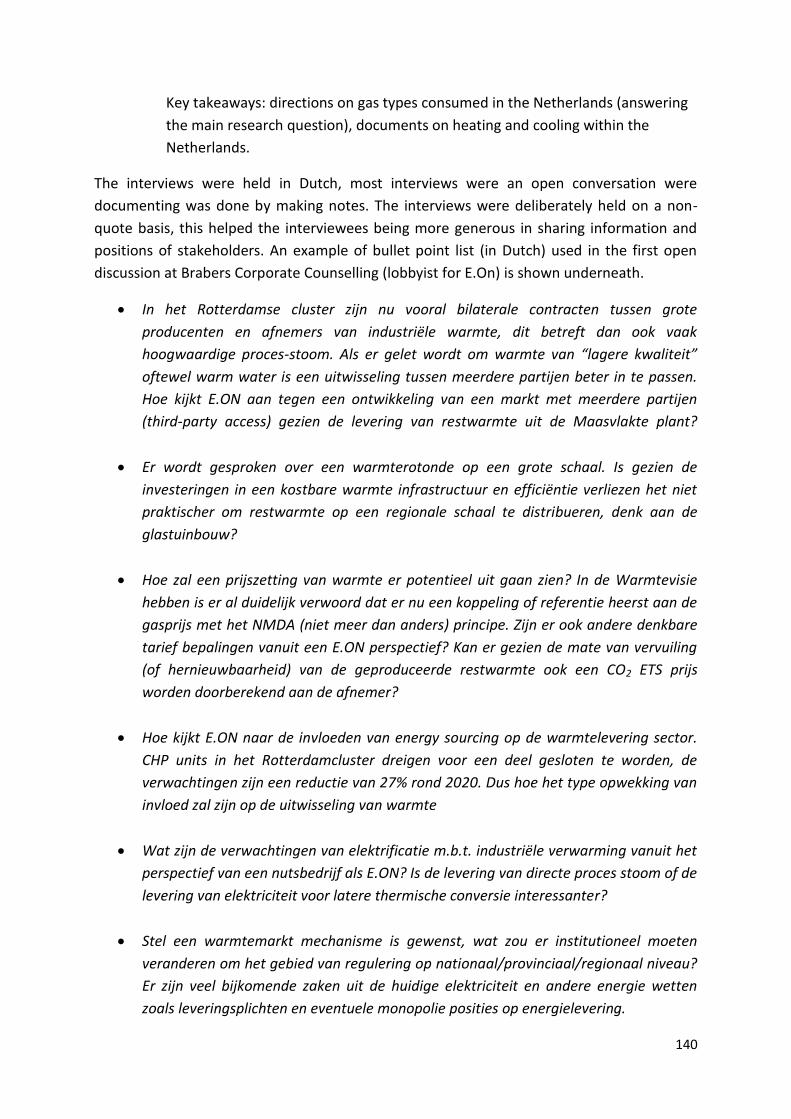
140
Key takeaways: directions on gas types consumed in the Netherlands (answering
the main research question), documents on heating and cooling within the
Netherlands.
The interviews were held in Dutch, most interviews were an open conversation were
documenting was done by making notes. The interviews were deliberately held on a non-
quote basis, this helped the interviewees being more generous in sharing information and
positions of stakeholders. An example of bullet point list (in Dutch) used in the first open
discussion at Brabers Corporate Counselling (lobbyist for E.On) is shown underneath.
In het Rotterdamse cluster zijn nu vooral bilaterale contracten tussen grote
producenten en afnemers van industriële warmte, dit betreft dan ook vaak
hoogwaardige proces-stoom. Als er gelet wordt om warmte van “lagere kwaliteit”
oftewel warm water is een uitwisseling tussen meerdere partijen beter in te passen.
Hoe kijkt E.ON aan tegen een ontwikkeling van een markt met meerdere partijen
(third-party access) gezien de levering van restwarmte uit de Maasvlakte plant?
Er wordt gesproken over een warmterotonde op een grote schaal. Is gezien de
investeringen in een kostbare warmte infrastructuur en efficiëntie verliezen het niet
praktischer om restwarmte op een regionale schaal te distribueren, denk aan de
glastuinbouw?
Hoe zal een prijszetting van warmte er potentieel uit gaan zien? In de Warmtevisie
hebben is er al duidelijk verwoord dat er nu een koppeling of referentie heerst aan de
gasprijs met het NMDA (niet meer dan anders) principe. Zijn er ook andere denkbare
tarief bepalingen vanuit een E.ON perspectief? Kan er gezien de mate van vervuiling
(of hernieuwbaarheid) van de geproduceerde restwarmte ook een CO2 ETS prijs
worden doorberekend aan de afnemer?
Hoe kijkt E.ON naar de invloeden van energy sourcing op de warmtelevering sector.
CHP units in het Rotterdamcluster dreigen voor een deel gesloten te worden, de
verwachtingen zijn een reductie van 27% rond 2020. Dus hoe het type opwekking van
invloed zal zijn op de uitwisseling van warmte
Wat zijn de verwachtingen van elektrificatie m.b.t. industriële verwarming vanuit het
perspectief van een nutsbedrijf als E.ON? Is de levering van directe proces stoom of de
levering van elektriciteit voor latere thermische conversie interessanter?
Stel een warmtemarkt mechanisme is gewenst, wat zou er institutioneel moeten
veranderen om het gebied van regulering op nationaal/provinciaal/regionaal niveau?
Er zijn veel bijkomende zaken uit de huidige elektriciteit en andere energie wetten
zoals leveringsplichten en eventuele monopolie posities op energielevering.
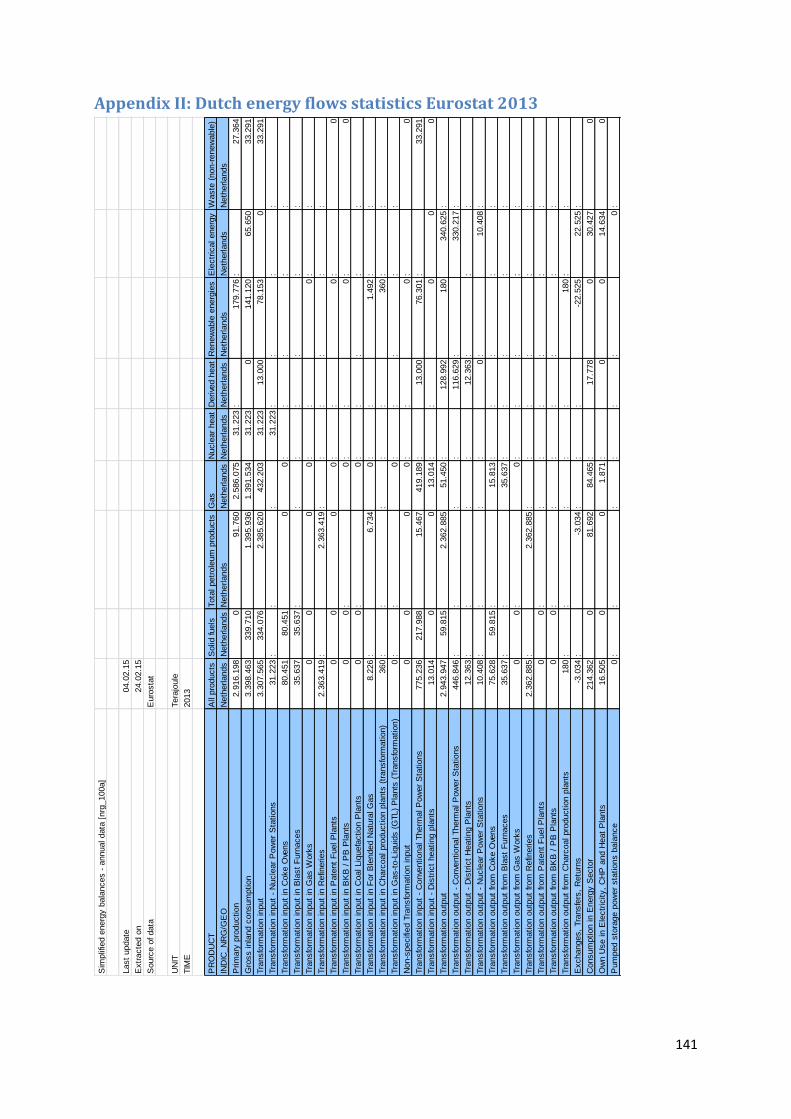
141
Appendix II: Dutch energy flows statistics Eurostat 2013
Sim
plif
ied e
nerg
y b
ala
nces -
annual data
[nrg
_100a]
Last
update
04.0
2.1
5
Extr
acte
d o
n24.0
2.1
5
Sourc
e o
f data
Euro
sta
t
UN
ITTera
joule
TIM
E2013
PR
OD
UC
TA
ll pro
ducts
Solid
fuels
Tota
l petr
ole
um
pro
ducts
Gas
Nucle
ar
heat
Derive
d h
eat
Renew
able
energ
ies
Ele
ctr
ical energ
yW
aste
(non-r
enew
able
)
IND
IC_N
RG
/GE
ON
eth
erlands
Neth
erlands
Neth
erlands
Neth
erlands
Neth
erlands
Neth
erlands
Neth
erlands
Neth
erlands
Neth
erlands
Prim
ary
pro
duction
2.9
16.1
98
091.7
60
2.5
86.0
75
31.2
23
:179.7
76
:27.3
64
Gro
ss inla
nd c
onsum
ption
3.3
98.4
63
339.7
10
1.3
95.9
36
1.3
91.5
34
31.2
23
0141.1
20
65.6
50
33.2
91
Tra
nsfo
rmation input
3.3
07.5
65
334.0
76
2.3
85.6
20
432.2
03
31.2
23
13.0
00
78.1
53
033.2
91
Tra
nsfo
rmation input
- N
ucle
ar
Pow
er
Sta
tions
31.2
23
::
:31.2
23
::
::
Tra
nsfo
rmation input
in C
oke O
vens
80.4
51
80.4
51
00
::
::
:
Tra
nsfo
rmation input
in B
last
Furn
aces
35.6
37
35.6
37
::
::
::
:
Tra
nsfo
rmation input
in G
as W
ork
s0
00
0:
:0
::
Tra
nsfo
rmation input
in R
efin
eries
2.3
63.4
19
:2.3
63.4
19
::
::
::
Tra
nsfo
rmation input
in P
ate
nt
Fuel P
lants
00
00
::
0:
0
Tra
nsfo
rmation input
in B
KB
/ P
B P
lants
00
:0
::
0:
0
Tra
nsfo
rmation input
in C
oal Liq
uefa
ction P
lants
00
:0
::
::
:
Tra
nsfo
rmation input
in F
or
Ble
nded N
atu
ral G
as
8.2
26
:6.7
34
0:
:1.4
92
::
Tra
nsfo
rmation input
in C
harc
oal pro
duction p
lants
(tr
ansfo
rmation)
360
::
::
:360
::
Tra
nsfo
rmation input
in G
as-t
o-L
iquid
s (
GTL)
Pla
nts
(Tra
nsfo
rmation)
0:
:0
::
::
:
Non-s
pecifi
ed T
ransfo
rmation input
00
00
::
0:
0
Tra
nsfo
rmation input
- C
onve
ntional Therm
al P
ow
er
Sta
tions
775.2
36
217.9
88
15.4
67
419.1
89
:13.0
00
76.3
01
:33.2
91
Tra
nsfo
rmation input
- D
istr
ict
heating p
lants
13.0
14
00
13.0
14
::
00
0
Tra
nsfo
rmation o
utp
ut
2.9
43.9
47
59.8
15
2.3
62.8
85
51.4
50
:128.9
92
180
340.6
25
:
Tra
nsfo
rmation o
utp
ut
- C
onve
ntional Therm
al P
ow
er
Sta
tions
446.8
46
::
::
116.6
29
:330.2
17
:
Tra
nsfo
rmation o
utp
ut
- D
istr
ict
Heating P
lants
12.3
63
::
::
12.3
63
::
:
Tra
nsfo
rmation o
utp
ut
- N
ucle
ar
Pow
er
Sta
tions
10.4
08
::
::
0:
10.4
08
:
Tra
nsfo
rmation o
utp
ut
from
Coke O
vens
75.6
28
59.8
15
:15.8
13
::
::
:
Tra
nsfo
rmation o
utp
ut
from
Bla
st
Furn
aces
35.6
37
::
35.6
37
::
::
:
Tra
nsfo
rmation o
utp
ut
from
Gas W
ork
s0
0:
0:
::
::
Tra
nsfo
rmation o
utp
ut
from
Refin
eries
2.3
62.8
85
:2.3
62.8
85
::
::
::
Tra
nsfo
rmation o
utp
ut
from
Pate
nt
Fuel P
lants
00
::
::
::
:
Tra
nsfo
rmation o
utp
ut
from
BK
B /
PB
Pla
nts
00
::
::
::
:
Tra
nsfo
rmation o
utp
ut
from
Charc
oal pro
duction p
lants
180
::
::
:180
::
Exchanges,
Tra
nsfe
rs,
Retu
rns
-3.0
34
:-3
.034
::
:-2
2.5
25
22.5
25
:
Consum
ption in E
nerg
y S
ecto
r214.3
62
081.6
92
84.4
65
:17.7
78
030.4
27
0
Ow
n U
se in E
lectr
icity,
CH
P a
nd H
eat
Pla
nts
16.5
05
00
1.8
71
:0
014.6
34
0
Pum
ped s
tora
ge p
ow
er
sta
tions b
ala
nce
0:
::
::
:0
:
Consum
ption in O
il and g
as e
xtr
action
36.7
12
:0
31.4
06
:0
:5.3
06
:
Consum
ption in P
etr
ole
um
Refin
eries
149.1
14
081.6
92
43.6
90
:14.2
78
09.4
54
0
Consum
ption in N
ucle
ar
industr
y0
::
::
0:
0:
Consum
ption in C
oal M
ines
00
00
:0
00
0
Consum
ption in P
ate
nt
Fuel P
lants
00
:0
:0
00
0
Consum
ption in C
oke O
vens
7.8
12
00
7.4
98
:0
0313
0
Consum
ption in B
KB
/ P
B P
lants
00
:0
:0
00
0
Consum
ption in G
as W
ork
s0
00
0:
00
00
Consum
ption in B
last
Furn
aces
0:
::
:0
00
:
Consum
ption in C
oal Liq
uefa
ction P
lants
00
:0
:0
:0
:
Consum
ption in L
iquefa
ction (
LN
G)
/ re
gasifi
cation p
lants
0:
:0
:0
:0
:
Consum
ption in G
asifi
cation p
lants
for
bio
gas
0:
::
:0
00
0
Consum
ption in G
as-t
o-liq
uid
s (
GTL)
pla
nts
(energ
y)
0:
:0
:0
:0
:
Consum
ption in N
on-s
pecifi
ed (
Energ
y)
4.2
20
00
0:
3.5
00
0720
0
Consum
ption in C
harc
oal pro
duction p
lants
(E
nerg
y)
0:
::
:0
00
0
Dis
trib
ution L
osses
35.5
02
00
0:
19.3
49
016.1
53
0
Energ
y A
vaila
ble
for
Fin
al C
onsum
ption
2.7
81.9
46
65.4
49
1.2
88.4
75
926.3
16
078.8
65
40.6
22
382.2
19
0
Fin
al N
on-e
nerg
y C
onsum
ption
637.6
84
4.2
90
551.4
64
81.9
30
::
0:
:
Non-e
nerg
y u
se in T
ransfo
rmation s
ecto
r0
:0
::
:0
::
Non-e
nerg
y u
se in E
nerg
y s
ecto
r0
:0
::
:0
::
Non-e
nerg
y u
se in Industr
y s
ecto
r629.9
66
:548.0
37
81.9
30
::
0:
:
Non-e
nerg
y u
se in T
ransport
Secto
r1.7
80
01.7
80
0:
:0
::
Non-e
nerg
y u
se in O
ther
Secto
rs1.6
48
01.6
48
0:
:0
::
Non-e
nerg
y u
se in Industr
y,
Tra
nsfo
rmation &
Energ
y S
ecto
rs4.2
90
4.2
90
:0
::
::
:
Fin
al E
nerg
y C
onsum
ption
2.1
41.7
78
61.1
59
737.0
11
844.3
87
:78.8
65
38.1
37
382.2
19
0
Fin
al E
nerg
y C
onsum
ption -
Industr
y568.4
66
60.8
14
108.5
84
226.6
46
:42.9
71
3.7
56
125.6
94
0
Iron a
nd S
teel
97.9
69
58.5
44
171
29.7
14
:8
09.5
33
0
Non-F
err
ous M
eta
ls12.9
43
00
2.6
98
:21
010.2
24
0
Chem
ical and P
etr
ochem
ical
252.0
37
092.7
39
81.0
62
:33.3
22
55
44.8
60
0
Non-M
eta
llic M
inera
ls22.9
35
1.2
04
461
16.8
58
:2
04.4
10
0
Min
ing a
nd Q
uarr
yin
g4.5
97
160
342
3.3
14
:0
0781
0
Food a
nd T
obacco
79.7
01
850
88
51.1
14
:3.7
06
785
23.1
59
0
Textile
and L
eath
er
4.3
68
00
2.9
67
:44
01.3
57
0
Paper,
Pulp
and P
rint
28.7
53
00
13.7
92
:5.6
16
165
9.1
80
0
Tra
nsport
Equip
ment
3.9
20
00
1.9
54
:4
01.9
62
0
Machin
ery
21.5
37
0306
11.4
53
:97
09.6
80
0
Wood a
nd W
ood P
roducts
2.3
34
00
808
:38
872
616
0
Constr
uction
20.0
37
57
14.3
47
3.7
79
:0
97
1.7
57
0
Non-s
pecifi
ed (
Industr
y)
17.3
35
0131
7.1
33
:113
1.7
82
8.1
76
0

142
Sim
plif
ied e
nerg
y b
ala
nces -
annual data
[nrg
_100a]
Last
update
04.0
2.1
5
Extr
acte
d o
n24.0
2.1
5
Sourc
e o
f data
Euro
sta
t
UN
ITTera
joule
TIM
E2013
PR
OD
UC
TA
ll pro
ducts
Solid
fuels
Tota
l petr
ole
um
pro
ducts
Gas
Nucle
ar
heat
Derive
d h
eat
Renew
able
energ
ies
Ele
ctr
ical energ
yW
aste
(non-r
enew
able
)
IND
IC_N
RG
/GE
ON
eth
erlands
Neth
erlands
Neth
erlands
Neth
erlands
Neth
erlands
Neth
erlands
Neth
erlands
Neth
erlands
Neth
erlands
Prim
ary
pro
duction
2.9
16.1
98
091.7
60
2.5
86.0
75
31.2
23
:179.7
76
:27.3
64
Gro
ss inla
nd c
onsum
ption
3.3
98.4
63
339.7
10
1.3
95.9
36
1.3
91.5
34
31.2
23
0141.1
20
65.6
50
33.2
91
Tra
nsfo
rmation input
3.3
07.5
65
334.0
76
2.3
85.6
20
432.2
03
31.2
23
13.0
00
78.1
53
033.2
91
Tra
nsfo
rmation input
- N
ucle
ar
Pow
er
Sta
tions
31.2
23
::
:31.2
23
::
::
Tra
nsfo
rmation input
in C
oke O
vens
80.4
51
80.4
51
00
::
::
:
Tra
nsfo
rmation input
in B
last
Furn
aces
35.6
37
35.6
37
::
::
::
:
Tra
nsfo
rmation input
in G
as W
ork
s0
00
0:
:0
::
Tra
nsfo
rmation input
in R
efin
eries
2.3
63.4
19
:2.3
63.4
19
::
::
::
Tra
nsfo
rmation input
in P
ate
nt
Fuel P
lants
00
00
::
0:
0
Tra
nsfo
rmation input
in B
KB
/ P
B P
lants
00
:0
::
0:
0
Tra
nsfo
rmation input
in C
oal Liq
uefa
ction P
lants
00
:0
::
::
:
Tra
nsfo
rmation input
in F
or
Ble
nded N
atu
ral G
as
8.2
26
:6.7
34
0:
:1.4
92
::
Tra
nsfo
rmation input
in C
harc
oal pro
duction p
lants
(tr
ansfo
rmation)
360
::
::
:360
::
Tra
nsfo
rmation input
in G
as-t
o-L
iquid
s (
GTL)
Pla
nts
(Tra
nsfo
rmation)
0:
:0
::
::
:
Non-s
pecifi
ed T
ransfo
rmation input
00
00
::
0:
0
Tra
nsfo
rmation input
- C
onve
ntional Therm
al P
ow
er
Sta
tions
775.2
36
217.9
88
15.4
67
419.1
89
:13.0
00
76.3
01
:33.2
91
Tra
nsfo
rmation input
- D
istr
ict
heating p
lants
13.0
14
00
13.0
14
::
00
0
Tra
nsfo
rmation o
utp
ut
2.9
43.9
47
59.8
15
2.3
62.8
85
51.4
50
:128.9
92
180
340.6
25
:
Tra
nsfo
rmation o
utp
ut
- C
onve
ntional Therm
al P
ow
er
Sta
tions
446.8
46
::
::
116.6
29
:330.2
17
:
Tra
nsfo
rmation o
utp
ut
- D
istr
ict
Heating P
lants
12.3
63
::
::
12.3
63
::
:
Tra
nsfo
rmation o
utp
ut
- N
ucle
ar
Pow
er
Sta
tions
10.4
08
::
::
0:
10.4
08
:
Tra
nsfo
rmation o
utp
ut
from
Coke O
vens
75.6
28
59.8
15
:15.8
13
::
::
:
Tra
nsfo
rmation o
utp
ut
from
Bla
st
Furn
aces
35.6
37
::
35.6
37
::
::
:
Tra
nsfo
rmation o
utp
ut
from
Gas W
ork
s0
0:
0:
::
::
Tra
nsfo
rmation o
utp
ut
from
Refin
eries
2.3
62.8
85
:2.3
62.8
85
::
::
::
Tra
nsfo
rmation o
utp
ut
from
Pate
nt
Fuel P
lants
00
::
::
::
:
Tra
nsfo
rmation o
utp
ut
from
BK
B /
PB
Pla
nts
00
::
::
::
:
Tra
nsfo
rmation o
utp
ut
from
Charc
oal pro
duction p
lants
180
::
::
:180
::
Exchanges,
Tra
nsfe
rs,
Retu
rns
-3.0
34
:-3
.034
::
:-2
2.5
25
22.5
25
:
Consum
ption in E
nerg
y S
ecto
r214.3
62
081.6
92
84.4
65
:17.7
78
030.4
27
0
Ow
n U
se in E
lectr
icity,
CH
P a
nd H
eat
Pla
nts
16.5
05
00
1.8
71
:0
014.6
34
0
Pum
ped s
tora
ge p
ow
er
sta
tions b
ala
nce
0:
::
::
:0
:
Consum
ption in O
il and g
as e
xtr
action
36.7
12
:0
31.4
06
:0
:5.3
06
:
Consum
ption in P
etr
ole
um
Refin
eries
149.1
14
081.6
92
43.6
90
:14.2
78
09.4
54
0
Consum
ption in N
ucle
ar
industr
y0
::
::
0:
0:
Consum
ption in C
oal M
ines
00
00
:0
00
0
Consum
ption in P
ate
nt
Fuel P
lants
00
:0
:0
00
0
Consum
ption in C
oke O
vens
7.8
12
00
7.4
98
:0
0313
0
Consum
ption in B
KB
/ P
B P
lants
00
:0
:0
00
0
Consum
ption in G
as W
ork
s0
00
0:
00
00
Consum
ption in B
last
Furn
aces
0:
::
:0
00
:
Consum
ption in C
oal Liq
uefa
ction P
lants
00
:0
:0
:0
:
Consum
ption in L
iquefa
ction (
LN
G)
/ re
gasifi
cation p
lants
0:
:0
:0
:0
:
Consum
ption in G
asifi
cation p
lants
for
bio
gas
0:
::
:0
00
0
Consum
ption in G
as-t
o-liq
uid
s (
GTL)
pla
nts
(energ
y)
0:
:0
:0
:0
:
Consum
ption in N
on-s
pecifi
ed (
Energ
y)
4.2
20
00
0:
3.5
00
0720
0
Consum
ption in C
harc
oal pro
duction p
lants
(E
nerg
y)
0:
::
:0
00
0
Dis
trib
ution L
osses
35.5
02
00
0:
19.3
49
016.1
53
0
Energ
y A
vaila
ble
for
Fin
al C
onsum
ption
2.7
81.9
46
65.4
49
1.2
88.4
75
926.3
16
078.8
65
40.6
22
382.2
19
0
Fin
al N
on-e
nerg
y C
onsum
ption
637.6
84
4.2
90
551.4
64
81.9
30
::
0:
:
Non-e
nerg
y u
se in T
ransfo
rmation s
ecto
r0
:0
::
:0
::
Non-e
nerg
y u
se in E
nerg
y s
ecto
r0
:0
::
:0
::
Non-e
nerg
y u
se in Industr
y s
ecto
r629.9
66
:548.0
37
81.9
30
::
0:
:
Non-e
nerg
y u
se in T
ransport
Secto
r1.7
80
01.7
80
0:
:0
::
Non-e
nerg
y u
se in O
ther
Secto
rs1.6
48
01.6
48
0:
:0
::
Non-e
nerg
y u
se in Industr
y,
Tra
nsfo
rmation &
Energ
y S
ecto
rs4.2
90
4.2
90
:0
::
::
:
Fin
al E
nerg
y C
onsum
ption
2.1
41.7
78
61.1
59
737.0
11
844.3
87
:78.8
65
38.1
37
382.2
19
0
Fin
al E
nerg
y C
onsum
ption -
Industr
y568.4
66
60.8
14
108.5
84
226.6
46
:42.9
71
3.7
56
125.6
94
0
Iron a
nd S
teel
97.9
69
58.5
44
171
29.7
14
:8
09.5
33
0
Non-F
err
ous M
eta
ls12.9
43
00
2.6
98
:21
010.2
24
0
Chem
ical and P
etr
ochem
ical
252.0
37
092.7
39
81.0
62
:33.3
22
55
44.8
60
0
Non-M
eta
llic M
inera
ls22.9
35
1.2
04
461
16.8
58
:2
04.4
10
0
Min
ing a
nd Q
uarr
yin
g4.5
97
160
342
3.3
14
:0
0781
0
Food a
nd T
obacco
79.7
01
850
88
51.1
14
:3.7
06
785
23.1
59
0
Textile
and L
eath
er
4.3
68
00
2.9
67
:44
01.3
57
0
Paper,
Pulp
and P
rint
28.7
53
00
13.7
92
:5.6
16
165
9.1
80
0
Tra
nsport
Equip
ment
3.9
20
00
1.9
54
:4
01.9
62
0
Machin
ery
21.5
37
0306
11.4
53
:97
09.6
80
0
Wood a
nd W
ood P
roducts
2.3
34
00
808
:38
872
616
0
Constr
uction
20.0
37
57
14.3
47
3.7
79
:0
97
1.7
57
0
Non-s
pecifi
ed (
Industr
y)
17.3
35
0131
7.1
33
:113
1.7
82
8.1
76
0
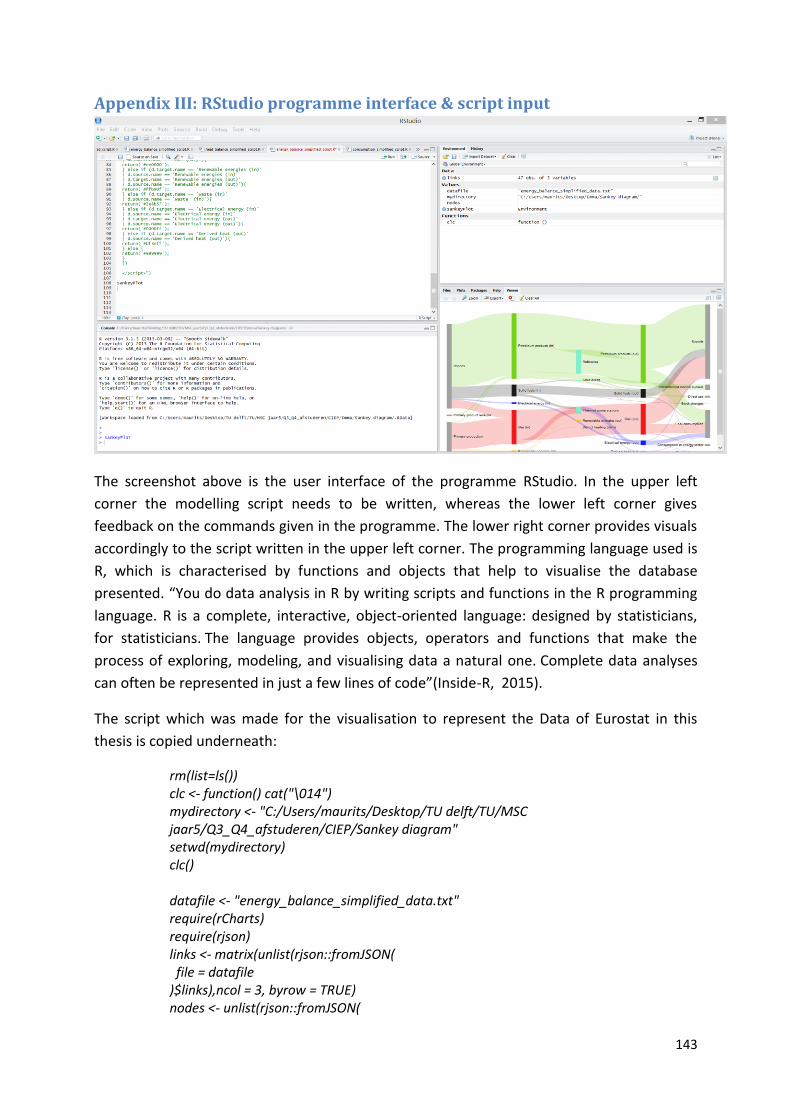
143
Appendix III: RStudio programme interface & script input
The screenshot above is the user interface of the programme RStudio. In the upper left
corner the modelling script needs to be written, whereas the lower left corner gives
feedback on the commands given in the programme. The lower right corner provides visuals
accordingly to the script written in the upper left corner. The programming language used is
R, which is characterised by functions and objects that help to visualise the database
presented. “You do data analysis in R by writing scripts and functions in the R programming
language. R is a complete, interactive, object-oriented language: designed by statisticians,
for statisticians. The language provides objects, operators and functions that make the
process of exploring, modeling, and visualising data a natural one. Complete data analyses
can often be represented in just a few lines of code”(Inside-R, 2015).
The script which was made for the visualisation to represent the Data of Eurostat in this
thesis is copied underneath:
rm(list=ls()) clc <- function() cat("\014") mydirectory <- "C:/Users/maurits/Desktop/TU delft/TU/MSC jaar5/Q3_Q4_afstuderen/CIEP/Sankey diagram" setwd(mydirectory) clc() datafile <- "energy_balance_simplified_data.txt" require(rCharts) require(rjson) links <- matrix(unlist(rjson::fromJSON( file = datafile )$links),ncol = 3, byrow = TRUE) nodes <- unlist(rjson::fromJSON(

144
file = datafile )$nodes) #convert to data.frame so souce and target can be character and value numeric links <- data.frame(links) colnames(links) <- c("source", "target", "value") links$source <- sapply(links$source, FUN = function(x) {return(as.character(nodes[x+1]))}) #x+1 since js starts at 0 links$target <- sapply(links$target, FUN = function(x) {return(nodes[x+1])}) #x+1 since js starts at 0 #now we finally have the data in the form we need sankeyPlot <- rCharts$new() sankeyPlot$setLib('.') sankeyPlot$setLib('http://timelyportfolio.github.io/rCharts_d3_sankey/libraries/widgets/d3_sankey') sankeyPlot$set( data = links, nodeWidth = 15, nodePadding = 18, layout = 32, width = 800, height = 450, units = "J", title = "Energy balance NL simplified (>9.000J)" ) # nodes sankeyPlot$setTemplate( afterScript = "<script> d3.selectAll('#{{ chartId }} svg .node rect') .style('stroke', 'none') .style('fill', function(d){ if (d.name == 'Solid fuels (in)' | d.name == 'Solid fuels (out)'){ return('#000000'); } else if (d.name == 'Petroleum products (in)' | d.name == 'Petroleum products (out)'){ return('#66cd00'); } else if (d.name == 'Gas (in)' | d.name == 'Gas (out)'){ return('#ee0000'); } else if (d.name == 'Renewable energies (in)' | d.name == 'Renewable energies (out)'){ return('#ffb90f'); } else if (d.name == 'Waste (in)'){ return('#2e8b57'); } else if (d.name == 'Electrical energy (in)' | d.name == 'Electrical energy (out)'){ return('#0000ff'); } else if (d.name == 'Derived heat (out)'){ return('#bf3eff'); } else if (d.name == 'Blast furnaces' | d.name == 'Coke ovens' | d.name == 'Thermal power stations' | d.name == 'District heating plants' | d.name == 'Nuclear power stations' | d.name == 'Refineries' | d.name == 'Charcoal production plants'){

145
return('#76eec6'); } else { return('#999999'); } }) d3.selectAll('#{{ chartId }} svg path.link') .style('stroke', function(d){ if (d.target.name == 'Solid fuels (in)' | d.source.name == 'Solid fuels (in)' | d.target.name == 'Solid fuels (out)' | d.source.name == 'Solid fuels (out)'){ return('#000000'); } else if (d.target.name == 'Petroleum products (in)' | d.source.name == 'Petroleum products (in)' | d.target.name == 'Petroleum products (out)' | d.source.name == 'Petroleum products (out)'){ return('#66cd00'); } else if (d.target.name == 'Gas (in)' | d.source.name == 'Gas (in)' | d.target.name == 'Gas (out)' | d.source.name == 'Gas (out)'){ return('#ee0000'); } else if (d.target.name == 'Renewable energies (in)' | d.source.name == 'Renewable energies (in)' | d.target.name == 'Renewable energies (out)' | d.source.name == 'Renewable energies (out)'){ return('#ffb90f'); } else if (d.target.name == 'Waste (in)' | d.source.name == 'Waste (in)'){ return('#2e8b57'); } else if (d.target.name == 'Electrical energy (in)' | d.source.name == 'Electrical energy (in)' | d.target.name == 'Electrical energy (out)' | d.source.name == 'Electrical energy (out)'){ return('#0000ff'); } else if (d.target.name == 'Derived heat (out)' | d.source.name == 'Derived heat (out)'){ return('#bf3eff'); } else { return('#999999'); } }) </script>") sankeyPlot
This script is specific for the Dutch energy balance visualisation of 2013, for the other two
visualisations a different script is made. These other scripts have more or less the same
programming layout, the only difference is the structure and the values of the energy flows.
The Sankey modelling works like the Graph Theory. The processes that use or convert energy

146
can be seen as nodes while the flows of energy are the links. For programming the Sankey
model in RStudio, several tools needed to be downloaded as add-in (R-Charts etc.) for the
Sankey visualisation to work. After that it is a process of defining the nodes, the links and
their values. When that process was done, each link got a colour and the nodes were
coordinated on the visualisation. The programming code in the script works with feedback
loops (else-if functions), each line in the script is a task within the parenthesis of a function.
As can be read in lower part of the script the last feedback loops are all closed with
parenthesis. This part of the script defines all the structural visuals and values of the model.
The script is closed and with the command “sankeyPlot” RStudio gives a visual
representation of the data imported from the Eurostat database.
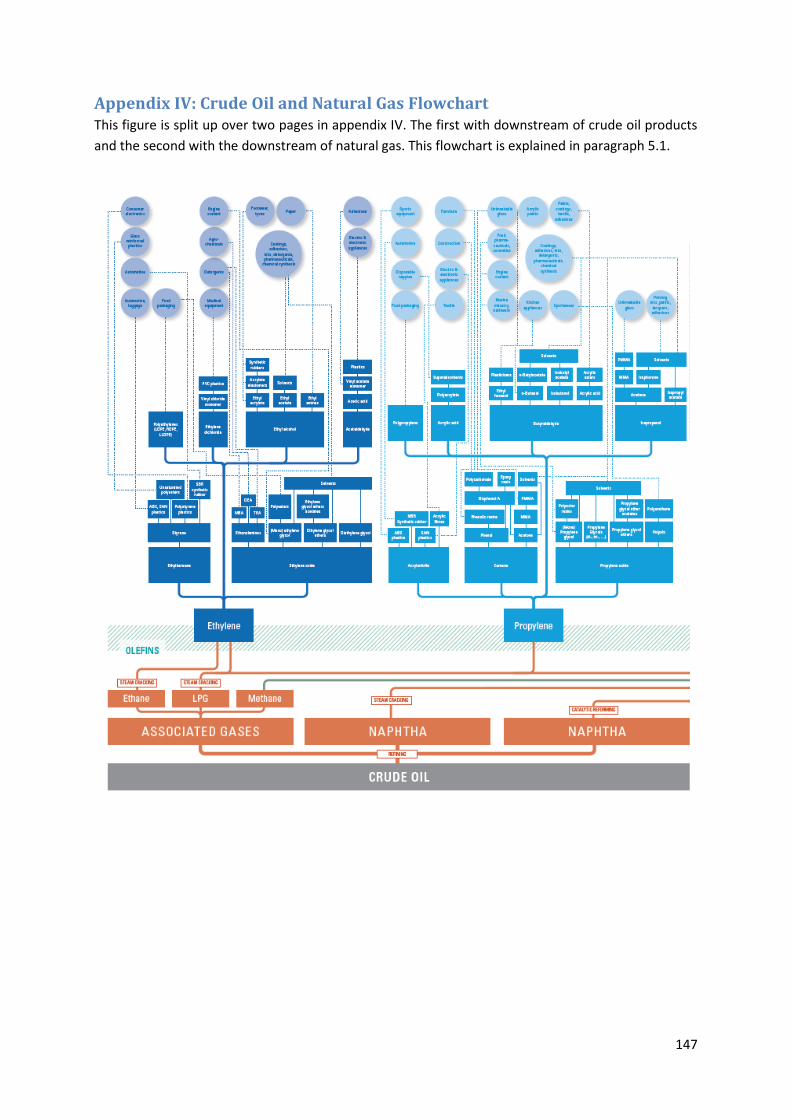
147
Appendix IV: Crude Oil and Natural Gas Flowchart This figure is split up over two pages in appendix IV. The first with downstream of crude oil products
and the second with the downstream of natural gas. This flowchart is explained in paragraph 5.1.

148
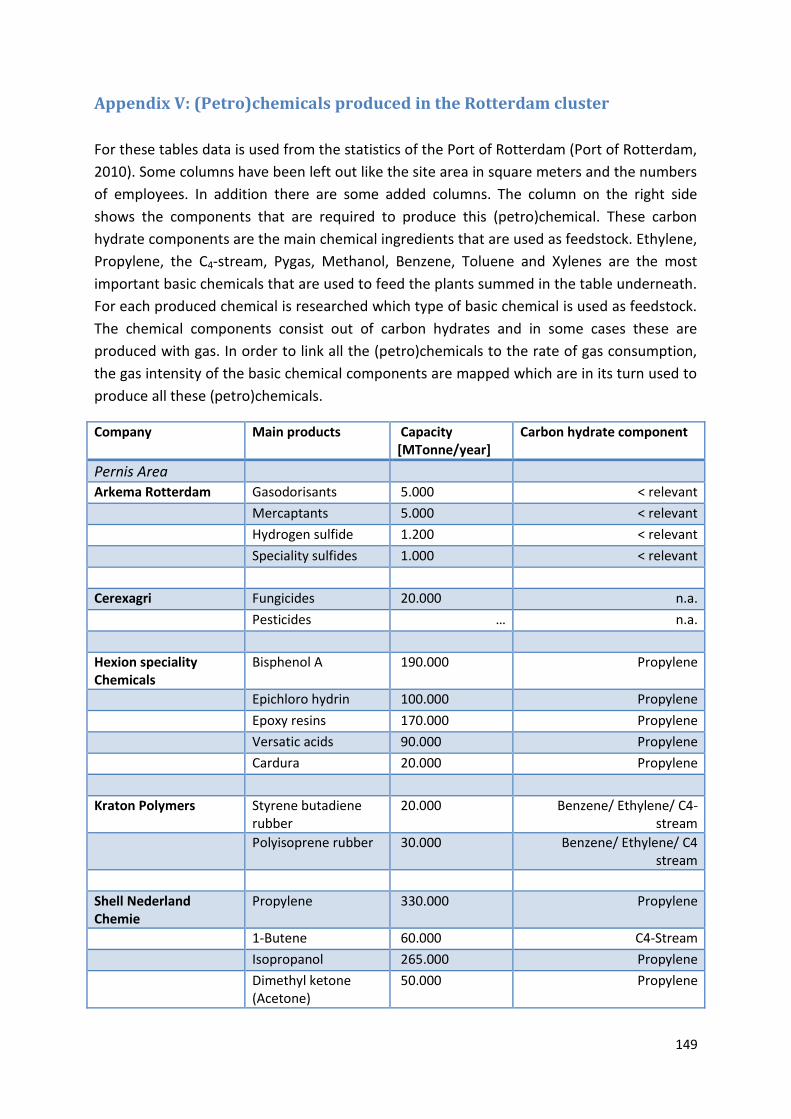
149
Appendix V: (Petro)chemicals produced in the Rotterdam cluster
For these tables data is used from the statistics of the Port of Rotterdam (Port of Rotterdam,
2010). Some columns have been left out like the site area in square meters and the numbers
of employees. In addition there are some added columns. The column on the right side
shows the components that are required to produce this (petro)chemical. These carbon
hydrate components are the main chemical ingredients that are used as feedstock. Ethylene,
Propylene, the C4-stream, Pygas, Methanol, Benzene, Toluene and Xylenes are the most
important basic chemicals that are used to feed the plants summed in the table underneath.
For each produced chemical is researched which type of basic chemical is used as feedstock.
The chemical components consist out of carbon hydrates and in some cases these are
produced with gas. In order to link all the (petro)chemicals to the rate of gas consumption,
the gas intensity of the basic chemical components are mapped which are in its turn used to
produce all these (petro)chemicals.
Company Main products Capacity [MTonne/year]
Carbon hydrate component
Pernis Area
Arkema Rotterdam Gasodorisants 5.000 < relevant
Mercaptants 5.000 < relevant
Hydrogen sulfide 1.200 < relevant
Speciality sulfides 1.000 < relevant
Cerexagri Fungicides 20.000 n.a.
Pesticides … n.a.
Hexion speciality Chemicals
Bisphenol A 190.000 Propylene
Epichloro hydrin 100.000 Propylene
Epoxy resins 170.000 Propylene
Versatic acids 90.000 Propylene
Cardura 20.000 Propylene
Kraton Polymers Styrene butadiene rubber
20.000 Benzene/ Ethylene/ C4-stream
Polyisoprene rubber 30.000 Benzene/ Ethylene/ C4 stream
Shell Nederland Chemie
Propylene 330.000 Propylene
1-Butene 60.000 C4-Stream
Isopropanol 265.000 Propylene
Dimethyl ketone (Acetone)
50.000 Propylene
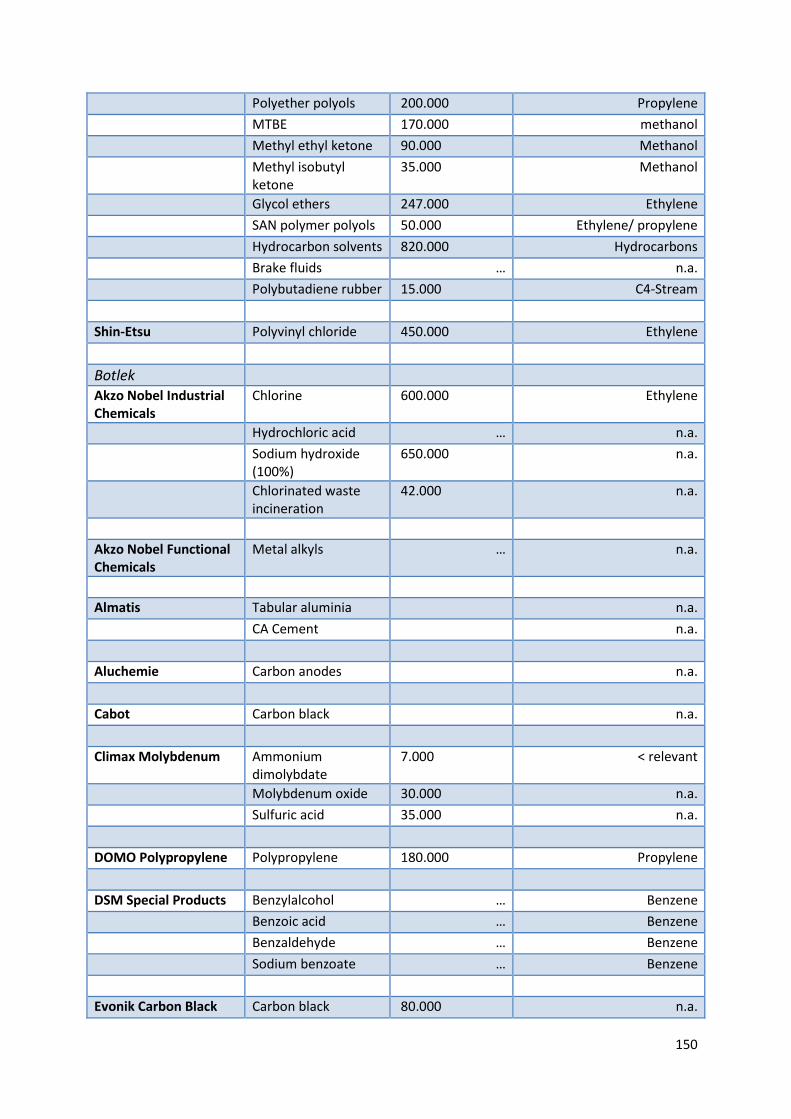
150
Polyether polyols 200.000 Propylene
MTBE 170.000 methanol
Methyl ethyl ketone 90.000 Methanol
Methyl isobutyl ketone
35.000 Methanol
Glycol ethers 247.000 Ethylene
SAN polymer polyols 50.000 Ethylene/ propylene
Hydrocarbon solvents 820.000 Hydrocarbons
Brake fluids … n.a.
Polybutadiene rubber 15.000 C4-Stream
Shin-Etsu Polyvinyl chloride 450.000 Ethylene
Botlek
Akzo Nobel Industrial Chemicals
Chlorine 600.000 Ethylene
Hydrochloric acid … n.a.
Sodium hydroxide (100%)
650.000 n.a.
Chlorinated waste incineration
42.000 n.a.
Akzo Nobel Functional Chemicals
Metal alkyls … n.a.
Almatis Tabular aluminia n.a.
CA Cement n.a.
Aluchemie Carbon anodes n.a.
Cabot Carbon black n.a.
Climax Molybdenum Ammonium dimolybdate
7.000 < relevant
Molybdenum oxide 30.000 n.a.
Sulfuric acid 35.000 n.a.
DOMO Polypropylene Polypropylene 180.000 Propylene
DSM Special Products Benzylalcohol … Benzene
Benzoic acid … Benzene
Benzaldehyde … Benzene
Sodium benzoate … Benzene
Evonik Carbon Black Carbon black 80.000 n.a.

151
Nederland
ExxonMobil Chemical Benzene 750.000 Benzene
Ortho xylene 130.000 Xylenes
Para xylene 690.000 Xylenes
Cyclohexane 270.000 Benzene
Phthalic anhydride 70.000 n.a.
Plasticizers 400.000 Ethylene/ Propylene/ Methanol/ Benzene
Hexion Specialty Chemicals
Formaline 140.000 Methanol
Huntsman Holland MDI 400.000 Methanol/ Benzene
Polyols 65.000 Propylene
Variants 145.000 Propylene
Formulaties 40.000 Propylene
Invista Polyamides (nylon 6.6)
90.000 Ethylene/ Propylene
Kemira Water Solutions
Polyacrylamides 150.000 Ethylene/ Propylene
Lucite International Polymethyl methacrylate
25.000 Methanol
Lyondell Chemical Propylene oxide 250.000 Propylene
Propylene glycol 80.000 Propylene
Propylene glycol ether
90.000 Propylene
Tertbutyl hydroperoxide
12.000 C4-Stream
MTBE/ ETBE 400.000 C4-Stream
Gasoline grade TBA 589.000 C4-Stream
Isobutylene 100.000 C4-Stream
BDO 126.000 C4-Stream
Allyl alcohol 16.000 Propylene/C4-Stream
Methyl propanediol 20.000 Methanol
Nufarm Phenoxy herbicides 14.500 Propylene/C4 Stream
Organic Kimya Acryl polymers 45.000 Propylene
Shin-Etsu Ethylene dichlorine 80.000 Ethylene
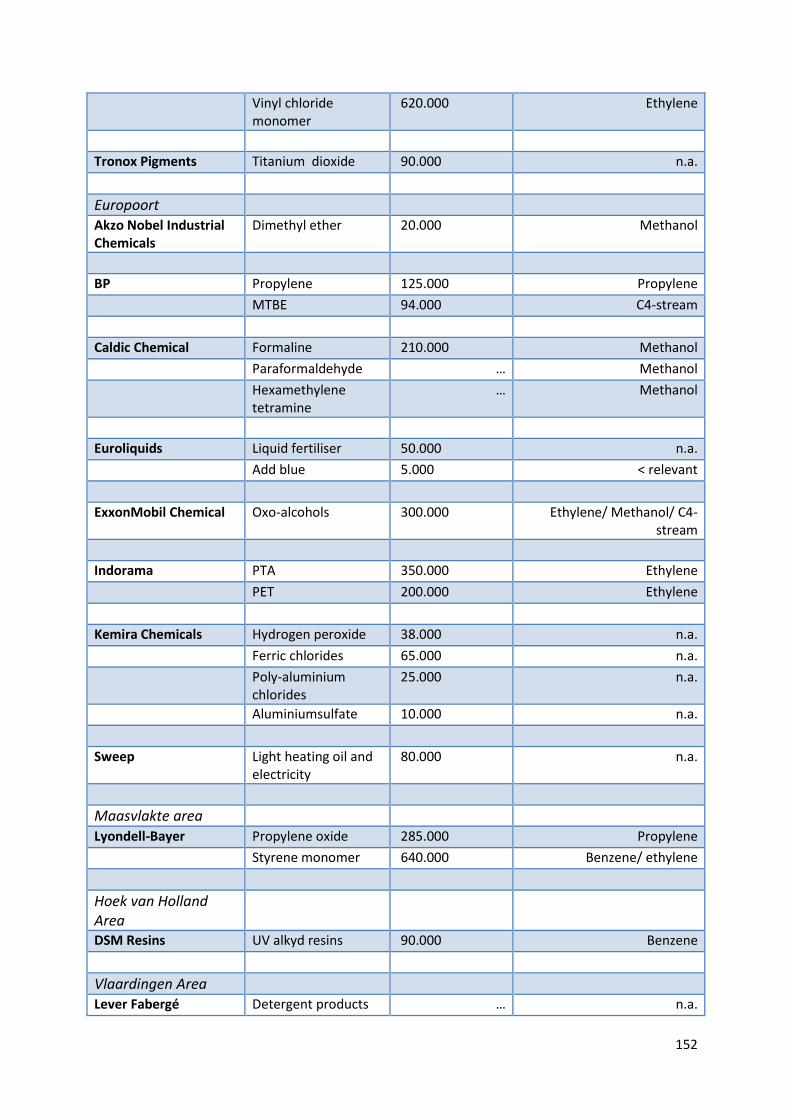
152
Vinyl chloride monomer
620.000 Ethylene
Tronox Pigments Titanium dioxide 90.000 n.a.
Europoort
Akzo Nobel Industrial Chemicals
Dimethyl ether 20.000 Methanol
BP Propylene 125.000 Propylene
MTBE 94.000 C4-stream
Caldic Chemical Formaline 210.000 Methanol
Paraformaldehyde … Methanol
Hexamethylene tetramine
… Methanol
Euroliquids Liquid fertiliser 50.000 n.a.
Add blue 5.000 < relevant
ExxonMobil Chemical Oxo-alcohols 300.000 Ethylene/ Methanol/ C4- stream
Indorama PTA 350.000 Ethylene
PET 200.000 Ethylene
Kemira Chemicals Hydrogen peroxide 38.000 n.a.
Ferric chlorides 65.000 n.a.
Poly-aluminium chlorides
25.000 n.a.
Aluminiumsulfate 10.000 n.a.
Sweep Light heating oil and electricity
80.000 n.a.
Maasvlakte area
Lyondell-Bayer Propylene oxide 285.000 Propylene
Styrene monomer 640.000 Benzene/ ethylene
Hoek van Holland Area
DSM Resins UV alkyd resins 90.000 Benzene
Vlaardingen Area
Lever Fabergé Detergent products … n.a.
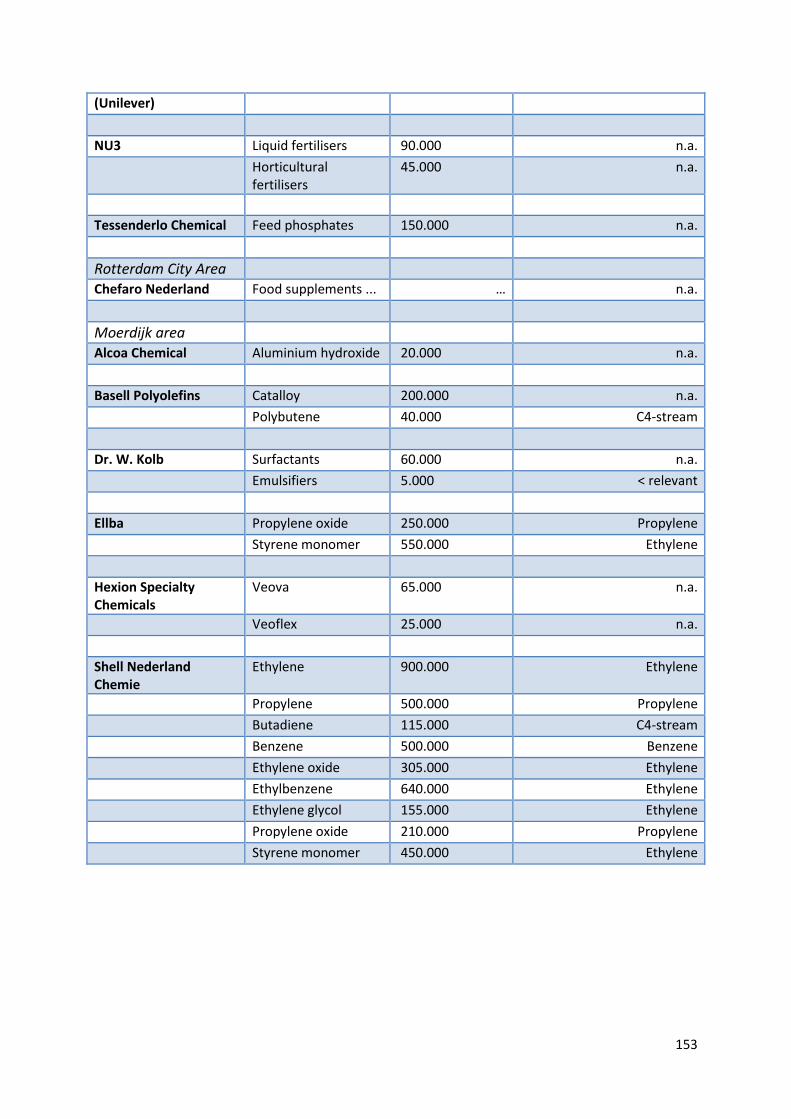
153
(Unilever)
NU3 Liquid fertilisers 90.000 n.a.
Horticultural fertilisers
45.000 n.a.
Tessenderlo Chemical Feed phosphates 150.000 n.a.
Rotterdam City Area
Chefaro Nederland Food supplements ... … n.a.
Moerdijk area
Alcoa Chemical Aluminium hydroxide 20.000 n.a.
Basell Polyolefins Catalloy 200.000 n.a.
Polybutene 40.000 C4-stream
Dr. W. Kolb Surfactants 60.000 n.a.
Emulsifiers 5.000 < relevant
Ellba Propylene oxide 250.000 Propylene
Styrene monomer 550.000 Ethylene
Hexion Specialty Chemicals
Veova 65.000 n.a.
Veoflex 25.000 n.a.
Shell Nederland Chemie
Ethylene 900.000 Ethylene
Propylene 500.000 Propylene
Butadiene 115.000 C4-stream
Benzene 500.000 Benzene
Ethylene oxide 305.000 Ethylene
Ethylbenzene 640.000 Ethylene
Ethylene glycol 155.000 Ethylene
Propylene oxide 210.000 Propylene
Styrene monomer 450.000 Ethylene

154