Embed Size (px)
Citation preview
European Scientific Journal November 2019 edition Vol.15, No.31 ISSN: 1857 – 7881 (Print) e - ISSN 1857- 7431
38
Gross Domestic Product and Foreign Direct
Investment: Empirical Evidence from Vietnam
Nguyen Huu Cung, Hanoi University of Industry, Vietnam
Doi:10.19044/esj.2019.v15n31p38 URL:http://dx.doi.org/10.19044/esj.2019.v15n31p38
Abstract
Foreign direct investment contributes to stimulating sustainable
economic growth of each country, but economic growth plays an important
role in attracting foreign direct investment. The empirical method was
employed on a secondary time series data set during the period 2003-2018 to
determine the impact of gross domestic product at current prices on foreign
direct investment in Vietnam using a linear approach. The empirical results
find that the relationship between gross domestic product and foreign direct
investment is a positive sign at 1% significant level. Moreover, the study also
shows that business freedom index and investment freedom index has a
positive effect on foreign direct investment at 5% significant level. Based on
the findings, the article recommends that Vietnam continues to seek positive
solutions to enhance the economic growth rate, continuation in investment and
business liberalization.
Keywords: GDP, FDI, Foreign investment, Foreign investment attraction,
Vietnam
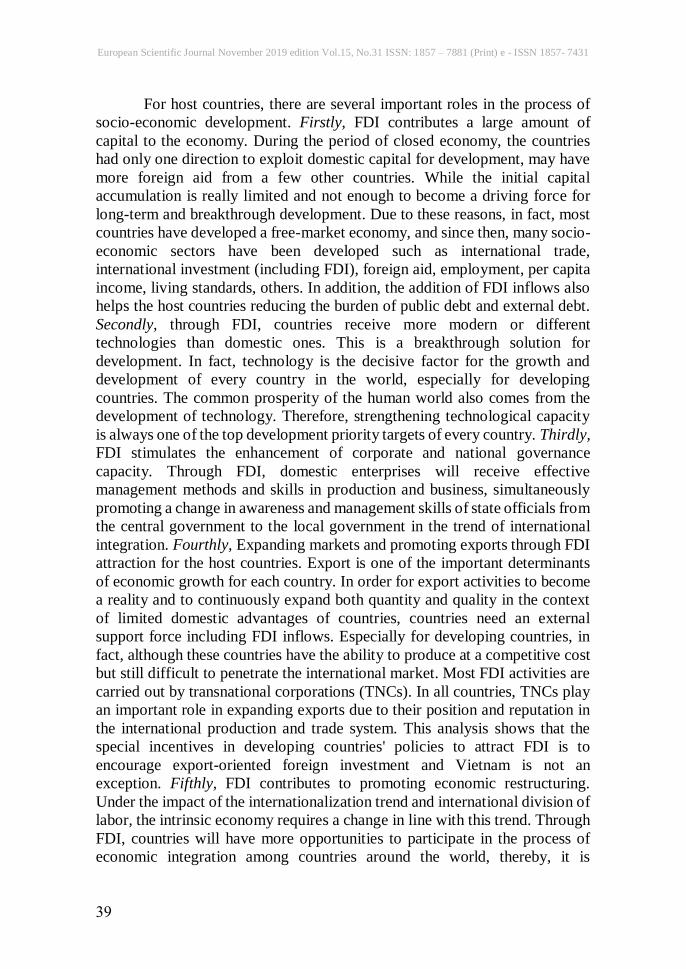
Introduction
Foreign direct investment (FDI) is an important source of capital for
both developed and developing countries. FDI not only adds development
investment capital but also is a more stable source of capital than other foreign
investment flows. The cause that FDI is based on a long-term view of the
market, growth prospects, and does not create the government debt for the host
country, therefore it is less likely to change when there are adverse situations.
FDI flows have been achieved on a large scale and global scope. According to
the study of Nguyen and Liu (2013) suppose that almost all countries and
territories around the world have been attracting a certain amount of FDI, only
differ in quality and quantity. The positive impact of foreign direct investment
is not only on the home country but also on the host country.
European Scientific Journal November 2019 edition Vol.15, No.31 ISSN: 1857 – 7881 (Print) e - ISSN 1857- 7431
39
For host countries, there are several important roles in the process of
socio-economic development. Firstly, FDI contributes a large amount of
capital to the economy. During the period of closed economy, the countries
had only one direction to exploit domestic capital for development, may have
more foreign aid from a few other countries. While the initial capital
accumulation is really limited and not enough to become a driving force for
long-term and breakthrough development. Due to these reasons, in fact, most
countries have developed a free-market economy, and since then, many socio-
economic sectors have been developed such as international trade,
international investment (including FDI), foreign aid, employment, per capita
income, living standards, others. In addition, the addition of FDI inflows also
helps the host countries reducing the burden of public debt and external debt.
Secondly, through FDI, countries receive more modern or different
technologies than domestic ones. This is a breakthrough solution for
development. In fact, technology is the decisive factor for the growth and
development of every country in the world, especially for developing
countries. The common prosperity of the human world also comes from the
development of technology. Therefore, strengthening technological capacity
is always one of the top development priority targets of every country. Thirdly,
FDI stimulates the enhancement of corporate and national governance
capacity. Through FDI, domestic enterprises will receive effective
management methods and skills in production and business, simultaneously
promoting a change in awareness and management skills of state officials from
the central government to the local government in the trend of international
integration. Fourthly, Expanding markets and promoting exports through FDI
attraction for the host countries. Export is one of the important determinants
of economic growth for each country. In order for export activities to become
a reality and to continuously expand both quantity and quality in the context
of limited domestic advantages of countries, countries need an external
support force including FDI inflows. Especially for developing countries, in
fact, although these countries have the ability to produce at a competitive cost
but still difficult to penetrate the international market. Most FDI activities are
carried out by transnational corporations (TNCs). In all countries, TNCs play
an important role in expanding exports due to their position and reputation in
the international production and trade system. This analysis shows that the
special incentives in developing countries' policies to attract FDI is to
encourage export-oriented foreign investment and Vietnam is not an
exception. Fifthly, FDI contributes to promoting economic restructuring.
Under the impact of the internationalization trend and international division of
labor, the intrinsic economy requires a change in line with this trend. Through
FDI, countries will have more opportunities to participate in the process of
economic integration among countries around the world, thereby, it is
European Scientific Journal November 2019 edition Vol.15, No.31 ISSN: 1857 – 7881 (Print) e - ISSN 1857- 7431
40
necessary to change the domestic economic structure to suit the international
division of labor and the general level of development, creating favorable
conditions in attracting FDI inflows. Sixthly, FDI contributes to developing
human resources and job creation. One of the important factors promoting
economic growth is human resource development and job creation. Foreign
investors are particularly interested in taking advantage of cheap labor in host
countries to maximize profits, strengthen their foothold and maintain a
competitive advantage in the world market. Therefore, the number of
employees are directly worked in FDI enterprises is increasing rapidly in
countries, especially in developing countries. Moreover, service provision and
outsourcing activities for FDI projects also create more job opportunities.
Finally, FDI contributes to the state budget. Through investment activities for
production and business sectors in the host country, FDI enterprises contribute
to the state budget through taxes such as value-added tax, import, and export
tax, special consumption tax, resources tax, individual income tax, others.
How to attract FDI inflows? FDI inflows have been expanded on a large scale
and a global scale, causing countries to pay special attention through incentive
policies to attract these capital flows, and Vietnam is not an exception. In the
history of attracting foreign investment, Vietnam applied Law on foreign
investment in 1987. This law could be considered as a first milestone to realize
the management mindset shifting from subsidized concentration to free-
market economy, integration with the world, at the same time, it is also the
starting time for FDI flows into Vietnam. At the time, Vietnam's foreign
investment law was judged by economists to be relatively open and had some
of the most progressive contents in the region. However, Vietnam was still a
strange region for foreign businesses and investors. Their understanding of the
Vietnamese economy was unclear. Moreover, Vietnam's integration with the
world economy had many barriers, not yet became a member of many
international economic organizations, and not yet had many bilateral and
multilateral economic cooperation with other countries, especially to be with
developed countries. Growth rate, economic size, and market size were still
economic indicators of an underdeveloped country. Per capita income was still
a socio-economic indicator of a low-income country. The socio-economic
infrastructure had not been invested much by the lack of investment capital.
The above-analyzed reasons became the limitations in attracting foreign
investment capital, although Vietnam had a number of advantages to attract
foreign investors such as the diversity and abundance of natural resources,
young and cheap labor force, openness of policies, others. As a result, from
1987 to 1990, the total registered FDI capital was only about USD 1.1 billion,
but the total realized FDI capital was lower and only reached a few hundred
million USD (Nguyen and Liu, 2013).
European Scientific Journal November 2019 edition Vol.15, No.31 ISSN: 1857 – 7881 (Print) e - ISSN 1857- 7431
41
Since 1991, Vietnam implemented many economic reforms and made a
breakthrough for the comprehensive development of the economy, including
attracting FDI inflows. As a result, TNCs had gradually been present in
Vietnam and there was a rapid increase in both quality and quantity of FDI
flows. Based on World Bank data, Vietnam's FDI (net inflows, BoP, current)
was USD 0.375 billion in 1991 and increased to USD 2.395 billion in 1996.
The Asian financial crisis had happened since 1997 in Thailand and as a
consequence that stock markets, large currency centers and prices of other
assets in some Asian countries had been effected simultaneously. The
economy of several countries was affected serious such as Indonesia, South
Korean, and Thailand, and some other countries were slightly impacted such
as Hongkong, Malaysia, Laos, Philippines, China, Singapore, Taiwan, Japan,
and Vietnam. Several countries had invested directly in Vietnam with a large
amount of capital such as Korea, Japan, Taiwan, and others. Therefore, FDI
(net inflows, BoP, current) was attracted by Vietnam only about USD 1.59
billion/year in the period 1997-2005. After that, the Asian economy has
recovered to the development direction and as a positive phenomenon that
many countries continued to increase investment capital into Vietnam, and at
the same time, Vietnam also had many reform policies to increase FDI
attraction. As a positive result, the average per year during the period 2006-
2018, Vietnam had attracted about USD 9.4 billion (FDI, net inflows, BoP,
current). How to attract FDI inflows? What factors affect FDI inflows to
Vietnam? Within the scope of this article, the author focuses on analyzing the
effect of GDP at current prices on FDI in Vietnam. In addition, the author will
also build a second model when adding two other independent variables
(investment freedom index, business freedom index) to compare the important
role of GDP versus these two variables.
2. Literature Reviews
There are many theories related to the appearance and development of
FDI flows that were moved from one country to another such as Life-
Cycle Hypothesis, Market Segmentation Theory, Theory of Competition and
Market Performance, Product Cycle Theory, Dispersion Theory of Risk,
others. These theories are considered as the light leading investors around the
world to discover, plan and implement investment projects in other countries
in order to seek maximum benefits, especially economic benefits. FDI inflows
have been being implemented in fact not only due to the self-demand of the
home countries but also the urgent needs of the host countries in the context
of investment capital scarcity, especially with developing countries. To attract
FDI inflows, in the first stage, developing countries exploit available
advantages such as natural resources, cheap labor, new markets, and potential
development, without many competitors, preferential tax policies, others.
European Scientific Journal November 2019 edition Vol.15, No.31 ISSN: 1857 – 7881 (Print) e - ISSN 1857- 7431
42
During the period of these available advantages were no longer effective and
the quality demand of FDI flows rises up, developing countries like developed
countries attract FDI by preferential tax policies for high-tech fields, high
quality labor, credit interest rates, development of economic infrastructure,
economic liberalization, investment liberalization, business liberalization,
high growth rate, economic stability, high per capita income, political stability,
others.
In fact, whether in development or developing period, the attraction of
FDI flows in countries is based on four main groups of factors such as
economic (GDP or GNP, GDP per capita, GDP growth rate, purchasing power
of currency, ratio of raw material exports to GDP, manufactured imports/GDP,
ratio of exports to imports, others), social (ratio of literacy and school
enrolment, availability of technical and professional workers, modernization
of outlook, strength of labours movement, extent of urbanization), political
(frequency of government change by type and period, number of internal
armed attacks period, degree of administrative efficiency, degree on
nationalism, colonial affiliation, others), policy (corporate taxation, tax
incentive laws, attitude toward joint ventures, local content requirements,
limitations on foreign personnel) (Franklin and Ahmed, 1978). Thus, the
relationship between these groups of factors and FDI inflows is a positive or
negative sign?
There are several types of research on the relationship between
taxation and FDI from different perspectives. Peters and Kiabel (2015)
studied the influence of tax incentives in the decision of an investor to locate
FDI in Nigeria. The results found that the relationship between tax incentives
and FDI is a negative effect and significant. This means that tax incentives
increase but an increase in FDI is not corresponding. Hsu et al. (2018) had a
study with the aim to prove why China stopped tax incentives on FDI since
2008. This article used the provincial-level panel data during the period 1998-
2008 before the reform. The finds show that tax incentives are not a
determinant of FDI flows into China in this period but the effect of market size
and geographic location on FDI inflows is a positive sign and significant.
Another research employed a secondary time series data set for the years 1999-
2011 to analyze the relationship between three independent variables (tax
burden for foreign-invested enterprises, unit labor costs, inflation index) and
FDI flows in Vietnam (Nguyen and Liu, 2015). The results found that the tax
burden for foreign-invested enterprises has a negative effect and significant on
FDI flows while the impact of unit labor costs and inflation index on FDI flows
is a positive significant at 1% level of significance. Thus, the relationship
between taxation and FDI inflows has a negative sign and significant in all
previous studies that this article has reviewed above.
European Scientific Journal November 2019 edition Vol.15, No.31 ISSN: 1857 – 7881 (Print) e - ISSN 1857- 7431
43
Ali and Guo (2005) surveyed 22 enterprises operating in China. The purpose
of this survey is to find an answer as to why these companies invest directly
in China. This means that what factors affect the attraction of FDI flows into
China. The results showed that market size is the most important factor for
FDI flows, especially for US enterprises. At the same time, the article also
found several other main factors affecting the attraction of FDI inflows into
China such as local, export-orientated, Asian firms, low labor costs. Ang
(2007) employed an annual time series data for the period 1960–2005 to
examine and analyze the determinants of FDI in Malaysia. The finds show that
the effect of real GDP on FDI is a positive sign and significant while the
relationship between GDP growth rate and FDI has a positive sign and
negligible significance. Moreover, there are several other factors promoting
FDI into Malaysia such as level of financial development, infrastructure
development, and trade openness. Finally, higher statutory corporate tax rates
and appreciation of the real exchange rate have a negative impact and
discouraged FDI inflows into Malaysia. A data set of macro indicators during
the period from FY 1973-74 to FY 2007-08 was employed by the study of
Mohiuddin and Salam (2011) to analyze factors attracting FDI inflows into
Pakistan. The results show that the exchange rate and Real GDP have a
positive effect on FDI, this means, an increase in Rupee and real GDP results
in a rise in FDI. Moreover, this study also found that a decrease in price level
would have a positive impact on FDI flows. Enisan (2017) researched the
determinants of FDI in Nigeria. The results found that there are several main
factors affecting FDI such as GDP growth, macro instability, financial
development, exchange rate, inflation, and discount rate. Demirhan and Masca
(2008) estimated a cross-sectional econometric model to determinate factors
affecting FDI inflows in developing countries by employing average value of
all data for the 2000-2004 period. Mottaleb and Kalirajan (2010) supposed that
developing countries have become more favorable destinations than
developing countries. This research employed a panel data set from 68
countries including low-income and lower-middle-income developing
countries. The results showed, countries where are more successful in
attracting FDI under conditions of larger GDP, high GDP growth rate, higher
proportion of international trade and more friendly business environment. This
means that the relationship between these factors and FDI has a positive effect.
Another study used an unbalanced panel data set during the period 1990-2012
to determinate factors affecting FDI flows in developing countries (Kumari
and Sharma, 2017). This research found that these are four determinants of
FDI flows such as market size, trade openness, interest rate, and human
capital. This relationship is a positive sign and significant. Especially, market
size is one most significant factors affecting FDI inflows. In Afghanistan,
there is a study on determinants of FDI (Wani and Rehman, 2017). This
European Scientific Journal November 2019 edition Vol.15, No.31 ISSN: 1857 – 7881 (Print) e - ISSN 1857- 7431
44
research employed a time series data set for the years 2005-2015. The results
showed that total debt service, total external debt, GDP and gross fixed capital
have a strong positive effect, at the same time, the relationship between
inflation and FDI is a negative effect.
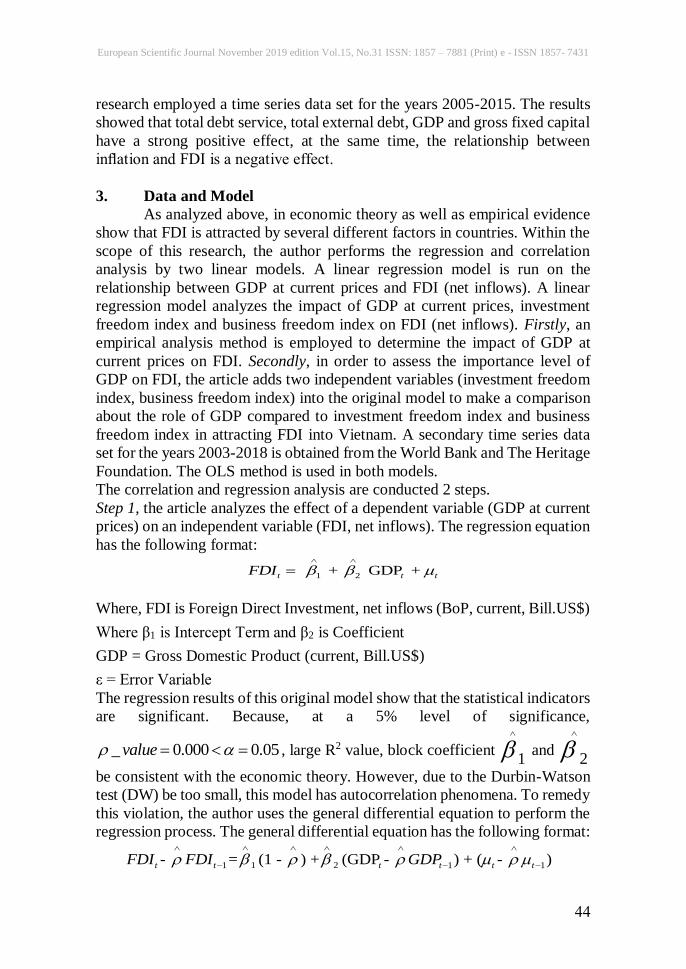
3. Data and Model
As analyzed above, in economic theory as well as empirical evidence
show that FDI is attracted by several different factors in countries. Within the
scope of this research, the author performs the regression and correlation
analysis by two linear models. A linear regression model is run on the
relationship between GDP at current prices and FDI (net inflows). A linear
regression model analyzes the impact of GDP at current prices, investment
freedom index and business freedom index on FDI (net inflows). Firstly, an
empirical analysis method is employed to determine the impact of GDP at
current prices on FDI. Secondly, in order to assess the importance level of
GDP on FDI, the article adds two independent variables (investment freedom
index, business freedom index) into the original model to make a comparison
about the role of GDP compared to investment freedom index and business
freedom index in attracting FDI into Vietnam. A secondary time series data
set for the years 2003-2018 is obtained from the World Bank and The Heritage
Foundation. The OLS method is used in both models.
The correlation and regression analysis are conducted 2 steps.
Step 1, the article analyzes the effect of a dependent variable (GDP at current
prices) on an independent variable (FDI, net inflows). The regression equation
has the following format:
1 2 + GDP +
t t tFDI
Where, FDI is Foreign Direct Investment, net inflows (BoP, current, Bill.US$)
Where β1 is Intercept Term and β2 is Coefficient
GDP = Gross Domestic Product (current, Bill.US$)
ε = Error Variable
The regression results of this original model show that the statistical indicators
are significant. Because, at a 5% level of significance,
_ 0.000 0.05value , large R2 value, block coefficient 1
and 2
be consistent with the economic theory. However, due to the Durbin-Watson
test (DW) be too small, this model has autocorrelation phenomena. To remedy
this violation, the author uses the general differential equation to perform the
regression process. The general differential equation has the following format:
1 21 1 1- = (1 - ) + (GDP - ) + ( - ) t t t t t tFDI FDI GDP
European Scientific Journal November 2019 edition Vol.15, No.31 ISSN: 1857 – 7881 (Print) e - ISSN 1857- 7431
45
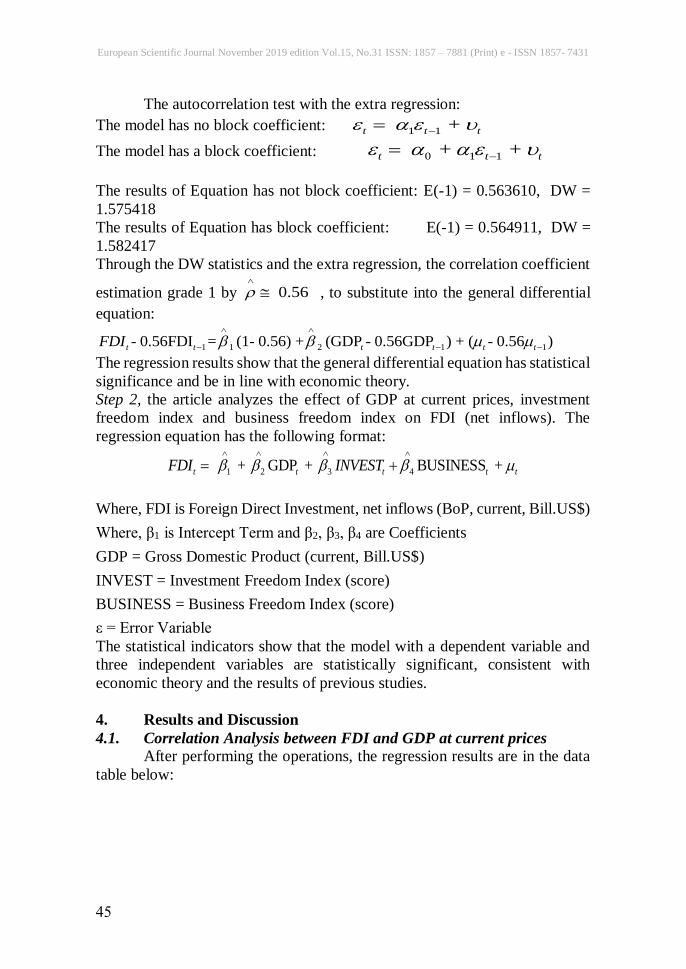
The autocorrelation test with the extra regression:
The model has no block coefficient: 1 1 + t t t
The model has a block coefficient: 0 1 1 + + t t t
The results of Equation has not block coefficient: E(-1) = 0.563610, DW =
1.575418
The results of Equation has block coefficient: E(-1) = 0.564911, DW =
1.582417
Through the DW statistics and the extra regression, the correlation coefficient
estimation grade 1 by 0.56
, to substitute into the general differential
equation:
1 21 1 1- 0.56FDI = (1- 0.56) + (GDP - 0.56GDP ) + ( - 0.56 ) t t t t t tFDI
The regression results show that the general differential equation has statistical
significance and be in line with economic theory.
Step 2, the article analyzes the effect of GDP at current prices, investment
freedom index and business freedom index on FDI (net inflows). The
regression equation has the following format:
1 2 3 4 + GDP + BUSINESS +
t t t t tFDI INVEST
Where, FDI is Foreign Direct Investment, net inflows (BoP, current, Bill.US$)
Where, β1 is Intercept Term and β2, β3, β4 are Coefficients
GDP = Gross Domestic Product (current, Bill.US$)
INVEST = Investment Freedom Index (score)
BUSINESS = Business Freedom Index (score)
ε = Error Variable
The statistical indicators show that the model with a dependent variable and
three independent variables are statistically significant, consistent with
economic theory and the results of previous studies.
4. Results and Discussion
4.1. Correlation Analysis between FDI and GDP at current prices After performing the operations, the regression results are in the data
table below:
European Scientific Journal November 2019 edition Vol.15, No.31 ISSN: 1857 – 7881 (Print) e - ISSN 1857- 7431
46
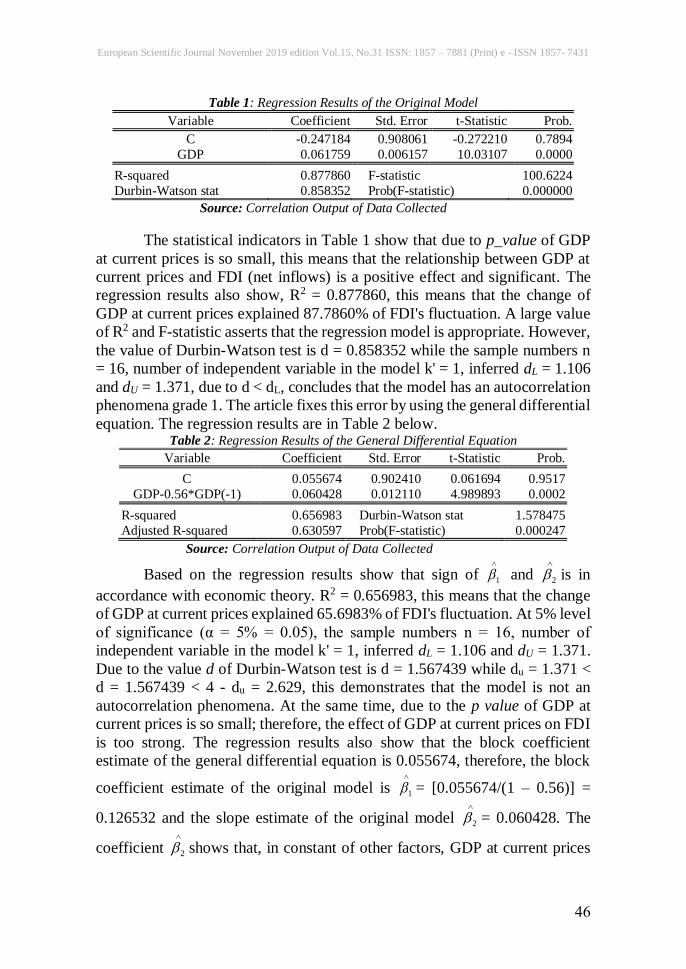
Table 1: Regression Results of the Original Model
Variable Coefficient Std. Error t-Statistic Prob.
C -0.247184 0.908061 -0.272210 0.7894
GDP 0.061759 0.006157 10.03107 0.0000
R-squared 0.877860 F-statistic 100.6224
Durbin-Watson stat 0.858352 Prob(F-statistic) 0.000000
Source: Correlation Output of Data Collected
The statistical indicators in Table 1 show that due to p_value of GDP
at current prices is so small, this means that the relationship between GDP at
current prices and FDI (net inflows) is a positive effect and significant. The
regression results also show, R2 = 0.877860, this means that the change of
GDP at current prices explained 87.7860% of FDI's fluctuation. A large value
of R2 and F-statistic asserts that the regression model is appropriate. However,
the value of Durbin-Watson test is d = 0.858352 while the sample numbers n
= 16, number of independent variable in the model k' = 1, inferred dL = 1.106
and dU = 1.371, due to d < dL, concludes that the model has an autocorrelation
phenomena grade 1. The article fixes this error by using the general differential
equation. The regression results are in Table 2 below. Table 2: Regression Results of the General Differential Equation
Variable Coefficient Std. Error t-Statistic Prob.
C 0.055674 0.902410 0.061694 0.9517
GDP-0.56*GDP(-1) 0.060428 0.012110 4.989893 0.0002
R-squared 0.656983 Durbin-Watson stat 1.578475
Adjusted R-squared 0.630597 Prob(F-statistic) 0.000247
Source: Correlation Output of Data Collected
Based on the regression results show that sign of 1
and 2
is in
accordance with economic theory. R2 = 0.656983, this means that the change
of GDP at current prices explained 65.6983% of FDI's fluctuation. At 5% level
of significance (α = 5% = 0.05), the sample numbers n = 16, number of
independent variable in the model k' = 1, inferred dL = 1.106 and dU = 1.371.
Due to the value d of Durbin-Watson test is d = 1.567439 while du = 1.371 <
d = 1.567439 < 4 - du = 2.629, this demonstrates that the model is not an
autocorrelation phenomena. At the same time, due to the p value of GDP at
current prices is so small; therefore, the effect of GDP at current prices on FDI
is too strong. The regression results also show that the block coefficient
estimate of the general differential equation is 0.055674, therefore, the block
coefficient estimate of the original model is 1
= [0.055674/(1 – 0.56)] =
0.126532 and the slope estimate of the original model 2
= 0.060428. The
coefficient 2
shows that, in constant of other factors, GDP at current prices
European Scientific Journal November 2019 edition Vol.15, No.31 ISSN: 1857 – 7881 (Print) e - ISSN 1857- 7431
47
increases to USD 1 billion, FDI (net inflows) increases to USD 0.060428
billion. Thus, the relationship between GDP at current prices and FDI (net
inflows) has a positive effect and significant. This means that GDP at current
prices has an important role in attracting FDI net inflows in Vietnam during
the period 2003-2018. The result of this study is also consistent with economic
theory and a number of previous studies such as Ang (2007), Mohiuddin and
Salam (2011), Mottaleb and Kalirajan (2010), Wani and Rehman (2017).
4.2. Correlation and Regression Analysis between TAX and Independent
Variables
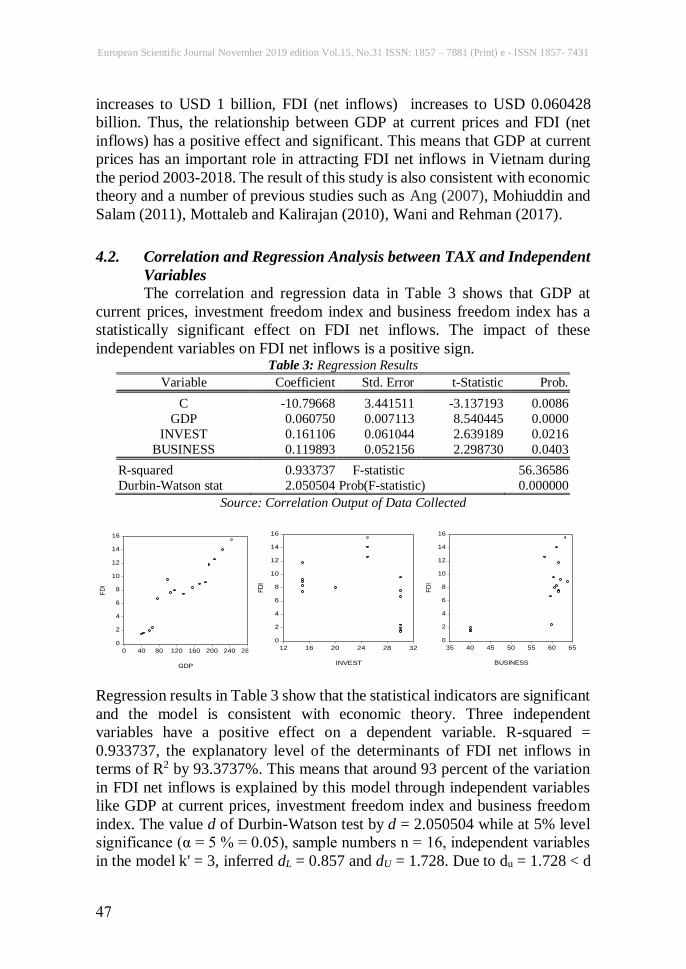
The correlation and regression data in Table 3 shows that GDP at
current prices, investment freedom index and business freedom index has a
statistically significant effect on FDI net inflows. The impact of these
independent variables on FDI net inflows is a positive sign. Table 3: Regression Results
Variable Coefficient Std. Error t-Statistic Prob.
C -10.79668 3.441511 -3.137193 0.0086
GDP 0.060750 0.007113 8.540445 0.0000
INVEST 0.161106 0.061044 2.639189 0.0216
BUSINESS 0.119893 0.052156 2.298730 0.0403
R-squared 0.933737 F-statistic 56.36586
Durbin-Watson stat 2.050504 Prob(F-statistic) 0.000000
Source: Correlation Output of Data Collected
Regression results in Table 3 show that the statistical indicators are significant
and the model is consistent with economic theory. Three independent
variables have a positive effect on a dependent variable. R-squared =
0.933737, the explanatory level of the determinants of FDI net inflows in
terms of R2 by 93.3737%. This means that around 93 percent of the variation
in FDI net inflows is explained by this model through independent variables
like GDP at current prices, investment freedom index and business freedom
index. The value d of Durbin-Watson test by d = 2.050504 while at 5% level
significance (α = 5 % = 0.05), sample numbers n = 16, independent variables
in the model k' = 3, inferred dL = 0.857 and dU = 1.728. Due to du = 1.728 < d
0
2
4
6
8
10
12
14
16
0 40 80 120 160 200 240 280
GDP
FD
I
0
2
4
6
8
10
12
14
16
12 16 20 24 28 32
INVEST
FD
I
0
2
4
6
8
10
12
14
16
35 40 45 50 55 60 65
BUSINESS
FD
I
European Scientific Journal November 2019 edition Vol.15, No.31 ISSN: 1857 – 7881 (Print) e - ISSN 1857- 7431
48
= 2.050504 < 4 - du = 2.272, this concludes that the model has not and
autocorrelation phenomena. With Prob(F-statistic) = 0.000000, the model is
suitable at 1% level of significance. The author continues to analyze the
regression results of each factor to make a comparison of the importance level
among the factors.
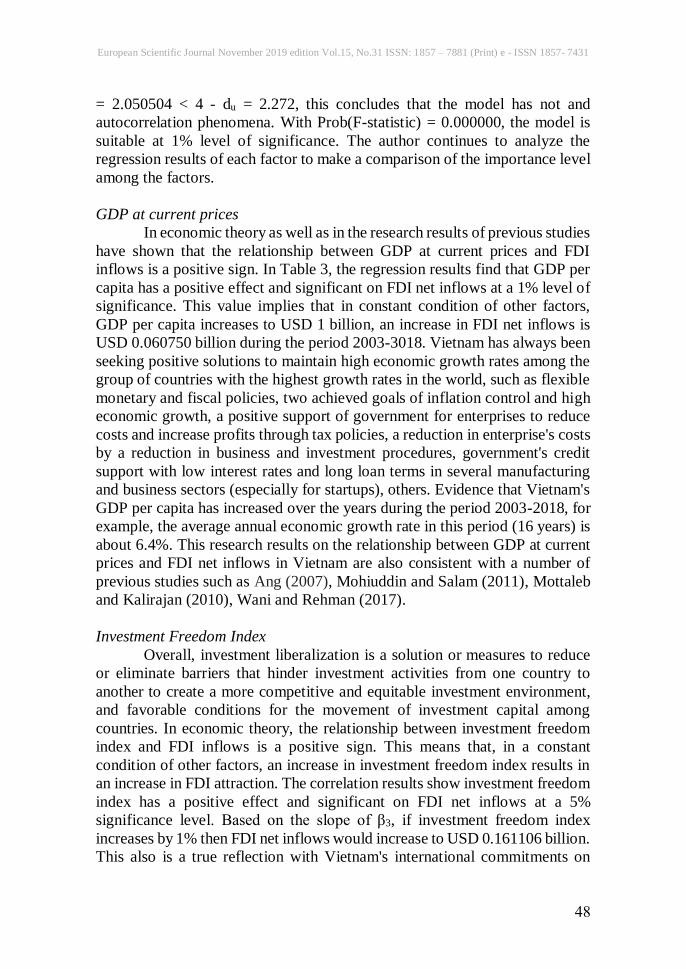
GDP at current prices
In economic theory as well as in the research results of previous studies
have shown that the relationship between GDP at current prices and FDI
inflows is a positive sign. In Table 3, the regression results find that GDP per
capita has a positive effect and significant on FDI net inflows at a 1% level of
significance. This value implies that in constant condition of other factors,
GDP per capita increases to USD 1 billion, an increase in FDI net inflows is
USD 0.060750 billion during the period 2003-3018. Vietnam has always been
seeking positive solutions to maintain high economic growth rates among the
group of countries with the highest growth rates in the world, such as flexible
monetary and fiscal policies, two achieved goals of inflation control and high
economic growth, a positive support of government for enterprises to reduce
costs and increase profits through tax policies, a reduction in enterprise's costs
by a reduction in business and investment procedures, government's credit
support with low interest rates and long loan terms in several manufacturing
and business sectors (especially for startups), others. Evidence that Vietnam's
GDP per capita has increased over the years during the period 2003-2018, for
example, the average annual economic growth rate in this period (16 years) is
about 6.4%. This research results on the relationship between GDP at current
prices and FDI net inflows in Vietnam are also consistent with a number of
previous studies such as Ang (2007), Mohiuddin and Salam (2011), Mottaleb
and Kalirajan (2010), Wani and Rehman (2017).
Investment Freedom Index
Overall, investment liberalization is a solution or measures to reduce
or eliminate barriers that hinder investment activities from one country to
another to create a more competitive and equitable investment environment,
and favorable conditions for the movement of investment capital among
countries. In economic theory, the relationship between investment freedom
index and FDI inflows is a positive sign. This means that, in a constant
condition of other factors, an increase in investment freedom index results in
an increase in FDI attraction. The correlation results show investment freedom
index has a positive effect and significant on FDI net inflows at a 5%
significance level. Based on the slope of β3, if investment freedom index
increases by 1% then FDI net inflows would increase to USD 0.161106 billion.
This also is a true reflection with Vietnam's international commitments on
European Scientific Journal November 2019 edition Vol.15, No.31 ISSN: 1857 – 7881 (Print) e - ISSN 1857- 7431
49
investment liberalization in the process of international economic integration.
Vietnam's overall goal in implementing international commitments on
investment liberalization is to liberalize foreign investment activities by
opening business activities and implementing non-discriminatory regime
dealing with foreign investors according to a certain schedule. Within the
scope of the author’s research, this result is a new finding in the case study of
Vietnam during the period 2003-2018.
Business Freedom Index
Business Freedom Index is a set of 10 indicators by using data from
the World Bank's Doing Business study: Starting a business-procedures
(number), time (days), cost (% of income per capita), and minimum capital (%
of income per capita); Obtaining a license—procedures (number), time (days),
and cost (% of income per capita); Closing a business—time (years), cost (%
of estate), and recovery rate (cents on the dollar) (According to The
GlobalEconomy.com). In theory, as well as practice in countries show that the
higher the index is, the stronger its attractiveness to FDI inflows. According
to the correlation results from the case of Vietnam shows, business freedom
index has a positive effect and significant on FDI net inflows at 5%
significance level. Based on the slope of β4, if the business freedom index
increases by 1% then FDI net inflows would increase to USD 0.119893 billion.
The research results on the relationship between business freedom index and
FDI net inflows are consistent with economic theory and also to be a new
finding that does not coincide with previous studies on the trend of the impact
between these two factors in the case of Vietnam during the period of 2003-
2018.
Within the scope of this research, the results show that GDP at current
prices, investment freedom index and business freedom index effect on FDI
net inflows into Vietnam. In fact, there are still several other factors that could
also impact on FDI net inflows such as per capita income, tax policies, labor
costs, distance, political stability, annual inflation index, infrastructure
development, others. Therefore, this is the research gap for the next studies of
the author.
5. Conclusion and Policy Implication
The research results of this article reflect that the effect of GDP at
current prices, investment freedom index and business freedom index on FDI
net inflows has a positive and significant sign in the Vietnam case for the years
2003-2018. The role of GDP at current prices in attracting FDI net inflows is
strongest at a 1% level of significance while the impact of investment freedom
index and business freedom index in attracting FDI net inflows is at 5%
significant level. Thus, in order to compete with regional countries such as
European Scientific Journal November 2019 edition Vol.15, No.31 ISSN: 1857 – 7881 (Print) e - ISSN 1857- 7431
50
China, Thailand, Malaysia, Indonesia, and Cambodia in attracting FDI
inflows, Vietnam needs to continue flexibly applying fiscal and monetary
policies to stimulate economic growth in condition of controlling inflation.
GDP growth rate indicates the size of the economy in the future. That is an
increase in real GDP, GDP per capita, people's purchasing power. If Vietnam
with a high economic growth rate will have many opportunities to attract
foreign investors more than other countries in region. Moreover, from the
results of this study, Vietnam needs to continue improving investment
freedom index and business freedom index. Because these two indexes of
Vietnam are lower than in some countries in the region. Average annual in the
period of 2003-2018: China (27% and 51%), Thailand (41% and 72%),
Malaysia (43% and 77%), Indonesia (35% and 52%), Cambodia (56% and
41%), Vietnam (24% and 57%).
References: 1. Nguyen and Liu (2013). Tax Burden and Foreign Direct Investment:
Theory and Practice in Vietnam. Advances in Management and
Applied Economics, 3(3), 85-103.
2. Franklin and Ahmed (1978). The influence of policy instruments on
manufacturing direct foreign investment in developing countries.
Journal of International Business Studies, 9(3), 81-94.
3. Peters and Kiabel (2015). Tax Incentives and Foreign Direct
Investment in Nigeria. IOSR Journal of Economics and Finance, 6(5),
10-20.
4. Hsu et al. (2018). Tax Incentives and Foreign Direct Investment in
China. Applied Economics Letters, 26(4):1-4.
5. Ali and Guo (2005). Determinants of FDI in China. Journal of Global
Business and Technology, 1(2), 21-33.
6. James B. Ang (2005). Determinants of foreign direct investment in
Malaysia. Journal of Policy Modeling, 30(2008) 185–189.
DOI:10.1016/j.jpolmod.2007.06.014
7. Mohiuddin and Salam (2011). Determinants of Foreign Direct
Investment in Pakistan. Journal of Independent Studies and
Research_MSSE, 9(1), 117-124.
8. Enisan (2017). Determinants of Foreign Direct Investment in Nigeria:
A Markov Regime-Switching Approach. Review of Innovation and
Competitiveness, 3(1), 21-48.
9. Demirhan and Masca (2008). Determinants of Foreign Direct
Investment Flows to Developing Countries: A Cross-Sectional
Analysis. Prague Economic Paper, 2008(4), 356-369. DOI:
10.18267/j.pep.337
European Scientific Journal November 2019 edition Vol.15, No.31 ISSN: 1857 – 7881 (Print) e - ISSN 1857- 7431
51
10. Mottaleb and Kalirajan (2010). Determinants of Foreign Direct
Investment in Developing Countries: A Comparative Analysis.
Margin The Journal of Applied Economic Research, ASARC Working
Paper 2010/13, 4(4), 1-28. DOI: 10.1177/097380101000400401
11. Kumari and Sharma (2017). Determinants of Foreign Direct
Investment in Developing Countries: A Panel Data Study.
International Journal of Emerging Markets, 12(4), 658-682.
12. Wani and Rehman (2017). Determinants of FDI in Afghanistan: An
Empirical Analysis. Munich Personal RePEc Archive, MPRA Paper
No. 81975. Online at https://mpra.ub.uni-muenchen.de/81975/
13. https://www.heritage.org/index/visualize
14. https://databank.worldbank.org/home.aspx
15. https://www.theglobaleconomy.com/rankings/herit_business_freedo
m/

Copyright of European Scientific Journal is the property of European Scientific Journal andits content may not be copied or emailed to multiple sites or posted to a listserv without thecopyright holder's express written permission. However, users may print, download, or emailarticles for individual use.