Embed Size (px)
Citation preview

!,
.
WSRC-TR-99-O0455
Ground Truth Measurements Plan for the Multispectral ThermalImager (MTI) Satellite
by
A. J. Garrett
Westinghouse Savannah River CompanySavannah River SiteAiken, South Carolina 29808
R. J. KurzeJa
B. L. Osteen
M. M. Pendergast
E. Villa-Aleman
M. J. Parker
DOE Contract No. DE-AC09-96SR18500
This paper was prepared in connection with work done under the above contract number with the U. S.Department of Energy. By acceptance of this paper, the publisher ancf/or recipient acknowledges the U. S.Government’s right to retain a nonexclusive, royalty-free license in and to any copyright covering this paper, alongwith the right to reproduce and to authorize others to reproduce all or part of the copyrighted paper.
DISCLAIMER
This report was prepared as an account of work sponsored by an agency of the United States Government.Neither the United States Government nor any agency thereof, nor any of their employees, makes anywarranty, express or implied, or assumes any legal liability or responsibility for the accuracy,completeness, or usefulness of any information, apparatus, product or process disclosed, or represents thatits use would not infringe privately owned rights. Reference herein to any specific commercial product,process or service by trade name, trademark, manufacturer, or otherwise does not necessarily constitute orimply its endorsement, recommendation, or favoring by the United States Government or any agencythereof. The views and opinions of authors expressed herein do not necessarily state or reflect those of theUnited States Government or any agency thereof.
This report has been reproduced directly from the best available copy.
Available for sale to the public, in paper, from U.S. Department of Commerce, National TechnicalInformation Service, 5285 Port Royal Road, Springt3eld, VA 22161,phone: (800) 553-6847,fax: (703) 605-6900email: orders @ntis.fedworld.govonline ordering: http://www.ntis. gov/ordering.htm
Available electronically at http:lfwww.doe.govlbridgeAvailable for a processing fee to U.S. Department of Energy and its contractors, in paper, fiornU.S. Department of Energy, Office of Scientific and Technical Information, P.O. Box 62,Oak Ridge, TN 37831-0062,phonti (865)576-8401,fax: (865)576-5728email: reports @adonis. osti. gov
. . — ..... . ..—- ——— ---- . - . .. ——- -— —.. . ..

DISCLAIMER
Portions of this document may be illegiblein electronic image products. Images areproduced from the best available originaldocument.

.1, . .-
WSRC TR-99-00455 .
Ground Truth Measurements Planfor the
Multispectral Thermal ~ager (MTI) Satellite (U)
Alfred J. Garrett, Robert,J. Kurzeja, B. Lance O’Steen, Matthew J. Parker,Malcolm M. Pendergast, Eliel Villa-Aleman
Savannah River Technology Center, Aiken, SC”29808.
ABSTR4CT
Sandia National Laboratories (SNL), Los Alamos National Laboratory (LANL) and the Savannah RiverTechnology Center (SRTC) have developed a diverse group of algorithms for processing and analyzing thedata that will be collected by the Multispectral Thermal Imager (MTI) after launch late in 1999. Each of thesealgorithms must be verified by comparison to independent surface and atmospheric measurements. SRTC hasselected 13 sites in the continental U.S. for ground truth data collections. These sites include a high altitudecold water target (Crater L~e), cooling lakes and towers in the warm, humid southeastern US, Department ofEnergy (DOE) climate research sites, the NASA Stennis satelMe Validation and Verification (V&V) targetarray, waste sites at the Savannah River Site, mining sites in the Four Comers area and dry lake beds in thesouthwestern US. SRTC has established mutually beneficial relationships with the organizations that managethese sites to make use of their operating and research data and to install additional instrumentation needed
.-for MTI algorithm V&V.
Keywords: Validation, Verification, Oround Truth, Muhispectral Imaging
1
.. . . . .. . . .... .
Ground Truth Measurements Plan for theMuIti-spectral Thermal Imager (MTI) Satellite
.’ -3 ... .
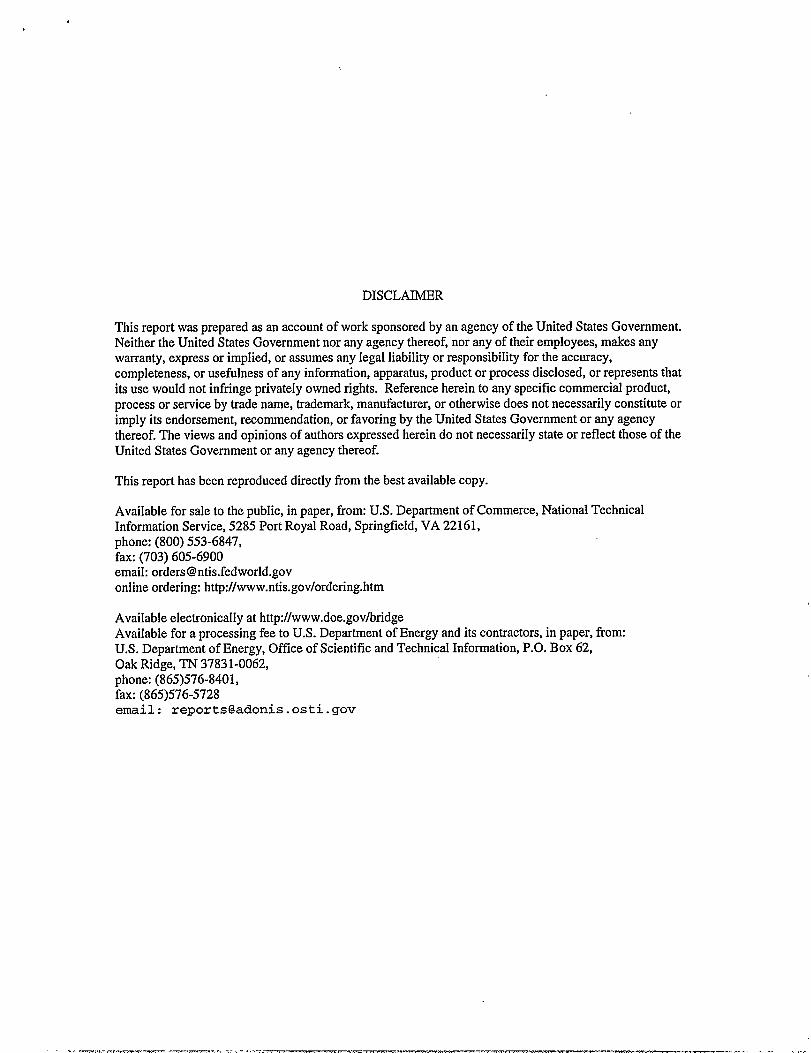
1. INTRODUCTION
The DOE Multispectral Thermal Imager (MTJ) satellite will produce large amounts of high resolutionimagery over ’15wavebands covering the visible, near-infrared (N@, short-wave infmred (SWIR), mid-waveinfrared (MWIR) and long-wave inllared (LWIR). The imagery will be used to demonstrate enhancedcapabilities in a vaiiety of applications, including temperature retrieval, analysis of thermal and pticulatepollutant transpoti in surface water systems and the atmosphere, waste and mining site monitoring, vegetationhealth and material identification. Verification of MTI’s performance in these different applications requiresindependent radiometric measurements and the collection of necessary collateral daa. such as atmospherictemperature and humidity profiles, direct water temperature measurements and target material samples forlaboratory spatral analyses. The Savannah River Technology Center (SRTC) is the DOE laboratory that isresponsible for ground truth data collections. In the following sections we describe the MTI sciencealgorithms to be verified, the ground truth collection sites and instruments and methods to be used to performthe collections.
2. MTI SCIENCE ALGORITHMS
2.1 Summary of algorithms and site selection
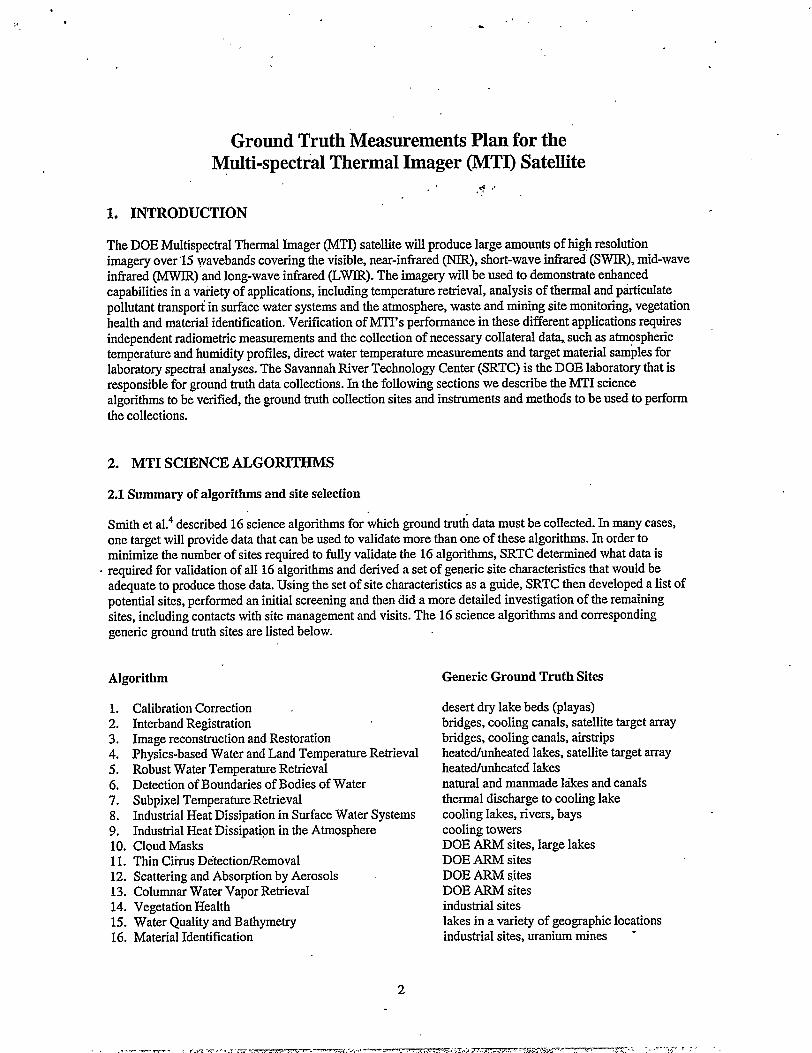
Smith et al.4 described 16 science algorithms for which ground tru~ data must be collected. In many cases,one target will provide data that can be used to validate more than one of these algorithms. In order tominimize the number of sites required to fully validate the 16 algorithms, SRTC determined what data is
. required for validation of all 16 algorithms and derived a set of generic site characteristics that would beadequate to produce those data. Using the set of site characteristics as a guide, SRTC then developed a list ofpotential sites, performed an initial screening and then did a more detailed investigation of the remainingsites, including contacts with site management and visits. The 16 science algorithms and correspondinggeneric groun~ truth sites are listed below.
Algorithm
1.2.3.4.5,6.7.8.9.10.11.12.13.14.15.16.
Calibration Correction .Interband RegistrationImage reconstruction and RestorationPhysics-based Water and Land Temperature RetrievalRobust Water Temperature RetrievalDetection of Boundaries of Bodies of WaterSubpixel Temperature RetrievalIndustrial Heat Dissipation in Surface Water SystemsIndustrial Heat Dissipation in the AtmosphereCloud MasksThin Ciirus Detection/RemovalScattering and Absorption by AerosolsColumnar Water Vapor RetrievalVegetation HealthWater Quality and BathymetryMaterial Identification
2
Generic Ground Truth Sites
desert dry lake beds (playas)bridges, cooling canals, satellite target arraybridges, cooling canals, airstripsheatedhnheated lakes, satellite target arrayheatedhbeated lakesnatural and manmade Mces and canalsthermal discharge to cooling lakecooling lakes, rivers, bayscooling towersDOE ARM sites, large lakesDOE ARM sitesDOE ARM sitesDOE ARM sitesindustrial siteslakes in a variety of geographic locationsindustrial sites, uranium mines -
I

.,.
f .
SRTC has selected fourteen ground truth sites across the continental US and in the western Pacific that fulfillthe generic site requirements (Figure 1).
,“
..4 ..,.. /
ARM-TWP(western Pacific)
‘vLake Pontchartrain
bridge
v
*TurkeyPoint
Figure 1: Locations of MTI ground truth sites.
A diverse set of organizations owns and/or manages these 14 sites. Five of the sites are nuclear power plants(Comanche Peak, Vogtle, Turkey Poin~ Pil@m and H. B. Robinson) which are owned by five differentutilities. The Southern Great Plains (SGP) Atmospheric Radiation Measurements (ARM) site is operated byDOE’s Brookhaven National Laboratory. The Tropical Western Pacific (TWP) ARM site is on the island ofNauru, which is near the equator in the weste”mPacific and is operated by Los Alamos National Laboratory(LANL). Nauru is an independent political entity. The Savannah River Site (SRS) is a DOE nuclear complexlargely focused on environmental restoration and storage of nuclear materials and waste. Dahlgren is a USNavy Base. Stennis is a NASA site that combines research facilities relating to remote sensing with satellitecalibration and rocket engine test facilities. The Lake Pontchartrain bridges are public (roads) and private(railroads) prope~. The National Park Service manages Crater Lake National Park. Ivanpah playa is ongovernment property managed by the Bureau of Land Management. The Navajo uqmium mine sites aremanaged by the Navajo Abandoned Mke Lands (AML) Reclamation Department, which is part of theNavajo Nation’s Division of Natural Resources. SRTC has developed relationships with the managers ofthese 14 sites. In many cases, the MTI Project is critically dependent on these site managers for support,including ground truth data, operational data and logistical support for short-term and long-term datacollections. Most of the site managers want to receive MTI imagery to help them improve various aspects oftheir operations. MI 14 site managers can terminate their relationships with SRTC (and DOE) at anYtime> ,because the working relationships are informal and not legally binding.
Key information about those sites is given below. The site information will be followed by an algorithm-byalgorithm discussion that will describe the ground truth,data to be taken at each of the sites.
.
●
3
.—..—.— -- —..., .— —. .,. ....—__ ,., . . .. .... . .. . ... . .z>---- . . .. -—.—- --- --r :> . n--- --7- — ---
. .’
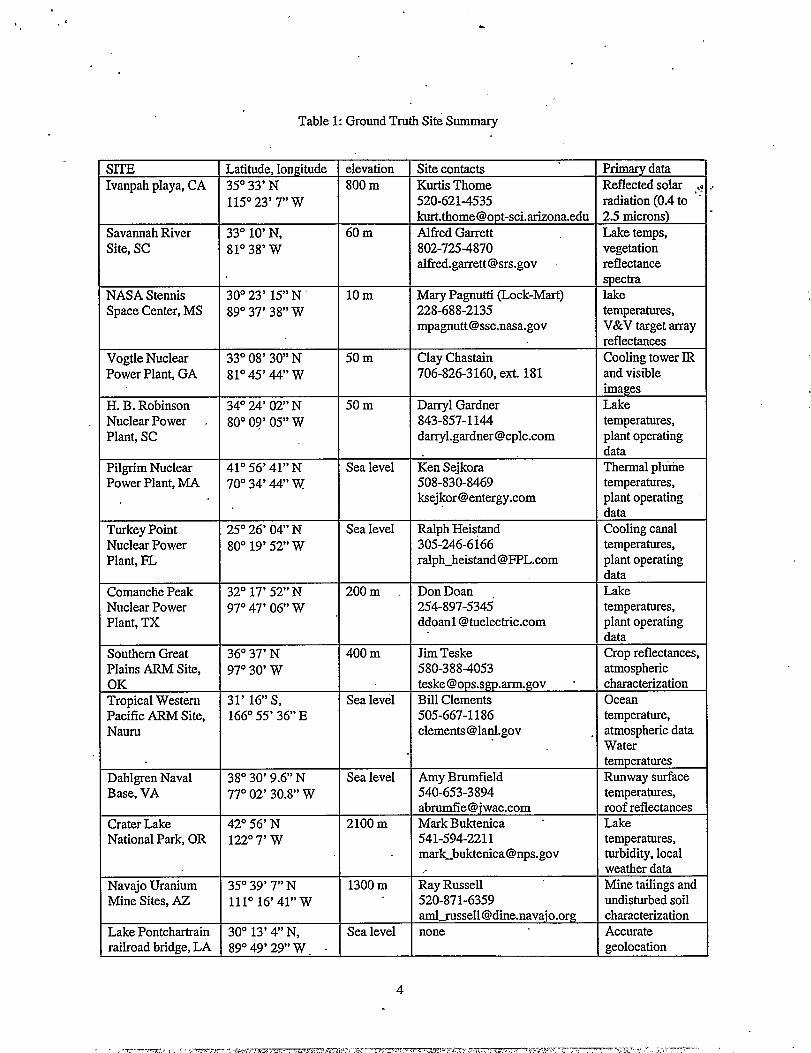
Table 1: Ground Truth Site Summary
SITE I Latitude. Iomzitude I elevation ].Site contacts I Primarv data.–, ———[vanpah playa, CA 35°33’ N 800 m Kurds Theme Reflected solar ,<
115°23’ 7“ W 520-621-4535 radiation (0.4 to “[email protected] 2.5 microns)
Savannah River 33°10’ N, 60 m Alfred Garrett Lake temps,Site, SC 81°38’ W 802-725-4870 vegetation
alfred.garrett@ srs.gov reflectancespectra
NASA Stennis 30°23’15” N 10 m Mary Pagnutti (Lock-Mart) lakeSpace Center, MS 89°37’38” W 228-688-2135 temperatures,
[email protected]. gov V&V target arrayreflectance
Vogtle Nuclear 33°08’30” N 50 m Clay Chastain Cooling tower IllPower PlanL GA 81°45’44” W 706-826-3160, ext. 181 and visible
imagesH. B. Robinson 34°24’02” N 50 m Darryl Gardner LakeNuclear Power . 80°09’05” W 843-857-1144 temperatures,Plant, SC [email protected] plant operating
dataPilgrim Nuclear 41°56’41” N Sea level Ken Sejkora Thermal plumePower Plant, MA 70°34’44” w 508-830-8469 temperatures,
ksejkor@entergy:com plant operatingdata
Turkey Point 25°26’04” N Sea level Ralph Heis,tand Cooling canalNuclear Power 80°19’52” W 305-246-6166 temperatures,Plant, FL ralph_heistand @FPL.com plant operating
dataComanche Peak 32°17’52” N 200 m . Don Doan LakeNuclear Power 97°47’06” w 254-897-5345 temperatures,Plant, TX ddoanl @tuelectric.com plant operating
dataSouthern Great 36°37’ N 400 m Jim Teske Crop reflectance,Plains ARM Site, 97°30’ w 580-388-4053 atmosphericOK [email protected]. gov - characterizationTropical Western 31’ 16”s, Sea level Bill Clements OceanPacific ARM Site, 166°55’36” E 505-667-1186 temperature,Naum elements @lard.gov atmospheric data
Watertemperatures
Dahlgren Naval 38°30’9.6” N Sea level Amy Brnmfield Runway surfaceBase, VA 77°02’30.8” w 540-653-3894 temperatures,
abrumfie@j wac.com roof reflectanceCrater Lake 42°56’ N 2100 m Mark Buktenica - LakeNational Park, OR 122°7’ w 541-594-2211 temperatures,
mark_buktenica @nps.gov turbidity, local,. weather data
Navajo Uranium 35°39’ 7“ N 1300 m Ray Russell Mine tailings andMine Sites, AZ 111°16’41” W 520-871-6359 undisturbed soil
[email protected]. org characterizationLake Pontchartrain 30°13’ 4“ N, Sea level none Accuraterailroad bridge, LA 89°49’29” W . geolocation
4

2.2 Description of Algorithms and Ground Truth Sites
1. Calibration Correction ..
MTI has been extensively calibrated at Los Alamos using well-known source radiances traceable to standardsat the National Institute of Standards and Techn@ogy (IWST). Atler launch, mainterymce of the laboratorycalibration will rely on on-bead calibration sources consisting of two blackbodles, two lamps, and a reflectoron a calibration wheel near the focal plane. Full-aperture calibrations will use the aperture door assembly, -which is both a temperature-controlled blackbody and a d~er for solar calibrations. (Clodius et al.s). Alsoafter launch, we will perform vicarious calibrations using some combination of measurements of groundsurface and atmospheric properties by ground-based devices and measurements from an aircraft. We will usethe methods described by Slater et al.Gwhich require’that the surface being imaged be as large and uniform aspossible. We will use the sun, moon and selected stars for additional vicarious calibrations.
SRTC plans to take ground-based measurements at one of the desert playas in Nevada or C#lfornia. Both ofthese sites have been used extensively to check-satellite c~lbrations btiause they are very flat and show littlespatial variation in spedral properties over distances that are large relative to MTI’s resolution (5 m in visiblewavebands, 20 m in infrared). SRTC will measure radiances in the reflective wavebands (0.4 to 2.5P) with anASD field spectrometer. An automated balloon-borne instrument package will take concurrent atmosphericprofiles of humidity and temperature. SRTC will use a Sun photometer to measure aerosol content alongMTI’s imaging path. SRTC will also probably use visibility and particle measurement sensors.
2. Interband Registration
Pixels from each of MTI’s 15 wavebands must be registered to the same frame of reference so that anobject’s location in a scene is the same in all of the images. Interband registration is crucial to most MTIapplications, including material identification, water temperature, columnar water vapor and vegetationhealth. Scenes with long straight objects that are accurately gee-located are best suited to testing of interbandregistration algorithms. Examples include bridges, channels and Iandmg strips.
SRTC has selected the following objects as candidate line sources for interband registration testing 1)bridges and railroads (Figure 2) over Lake Pontchartrain just north of New Orleans, and 2) the airstrip atDahlgren Naval Base in Virginia (Figure 3). SRTC plans to accurately geolocate both of these candidate linesources and characterize thii spectral properties. -.
I.-, , .,., Ii. ;
Figure 2: Railroad extending over Lake Pontchartrain, Louisiana
5

.- /
,+ ..
..
Figure 3: Dahlgren Naval Base, Virginia
3. Image Restoration and Reconstruction
Image restoration algorithnis attempt to correct the measured image for degradation caused by sources ofblurring and noise. Blurring can be caused by atmospheric turbulence, scattering of light from adjacentsurface elements and aerosols, telescope point spread function, motion and jitter during image acquisition andsatellite electronics. Sources of noise include thermal noise, correlated noise (streaking) and quantizationnoise.
The same objects that will used for testing of interband registration algorithms will also be suitable for testingof image restoration and reconstruction algorithms. In addition, uniform surfaces such as lakes with weaktemperature gradients on calm days can be used to quantify the amount of correlated noise.
4. Physics-based Water and Land Temperature Retrieval
MTI’s physics-based temperature retrieval algorithm uses MODTRAN to iterate columnar water vapor andatmospheric temperatures over a small range until the retrieved stiace temperature is the same for allspectral channels and at the same time the measured radiances are matched. For land surfaces du@ig the day,the NLRand SWIR charnels will be used to identify the siuface material, emissivities will be taken fromstandard sources and the iteration will be performed based on those emissivities.
SRTC will provide highly accurate water temperatures from unheated lakes at the Savannah River Site andfrom the H. B. Robinson cooling lake to test the temperature retrieval algorithm (l?igure 4). The dala providedby SRTC will include radiometer measurements of the true surface (skin) temperature, which can be dir@ly.
6
..-=— ——-,,--..7 ., . -. ,. ,-- TF’3=:..>~=. . . -m-m ;?.,, ,: -.:. -- - -

. . .,
.“
.’
.
compared to temperatures measured by the satellhe, and the bu!k water temperature, which is often the onlytemperature measured by in situ devices. Remote sensing systems measure the temperature of a very thin
layer or “skin” of water which is less than one millimeter tilckand which usually is colder than the bulkwater temperature just below. The skin temperature ii often lower than the bulk water temperature because itstrikes a balance between evaporative energy losses to the atmosphere above and the upward transport of heatfrom the bulk water layer below. SRTC will also provide atmospheric profile data from those,~tes.
I
.. . I
I
Figure 4: H. B.Robinson nuclear and fossil units viewed from lower end of cooling lake. The cooling lake isshallow and turbid due to natural tarmins.in the water, which along with the waste heat from the power plantproduce water temperatures above 40° C near the cooling water discharge in the summer. ” .
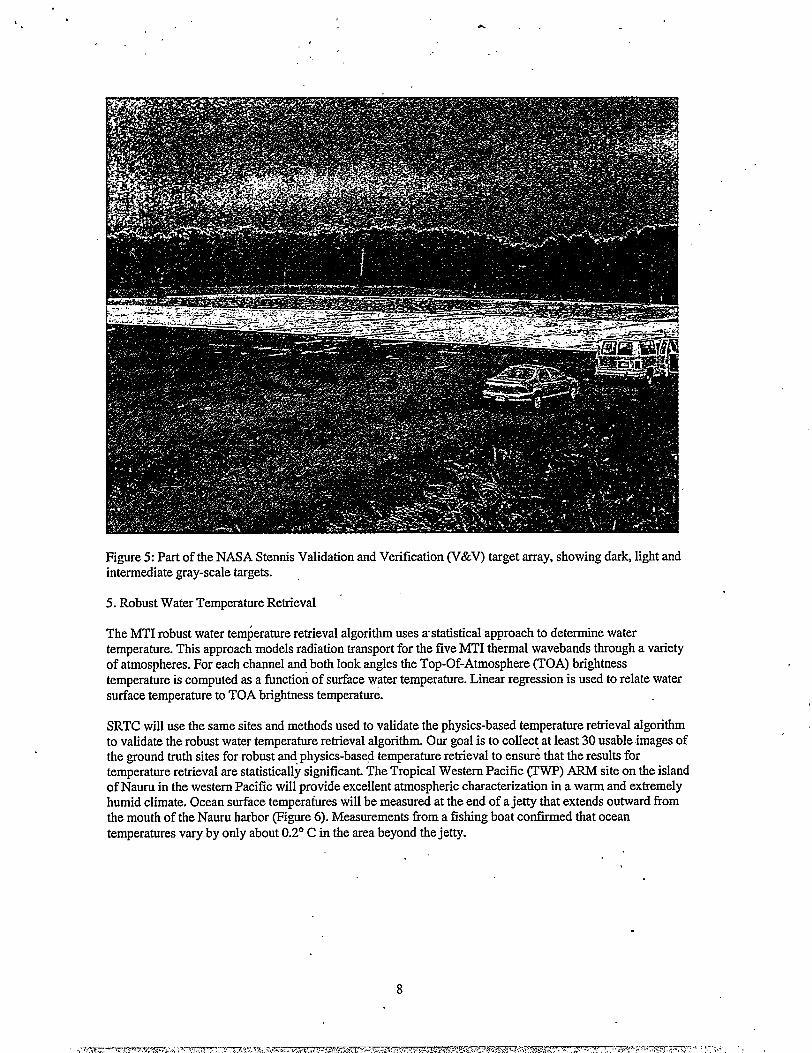
NASA’s Stennis Space Center (SSC) also plans to make skin and subsurface water temperaturemeasurements in their HPIW reservoir, along with meteorological measurements and thermal images from athermal camera mounted on a boom over the reservoir. For land temperatures, SRTC will use surfaces suchas those at the NASA SSC V&V target array, which are huge and uniform and characterized spectrally(Figure 5). The brown stains on the target array were caused by water seepage. The target array is to bewaterproofed and repainted prior to MTI launch.
I
7
.
Figure 5: Part of the NASA Stennis Validation and Verification (V&V) target array, showing darh light andintermediate gray-scale targets.
5. Robust Water Temperature Retrieval
The MTI robust water temperature retrieval algorithm uses tistatistical approach to determine watertemperature. This approach models radiation transport for the five MTI thermal wavebands through a varietyof atmospheres. For each channel and both look angles the Top-Of-Atmosphere (TOA) brightnesstemperature is computed as a function of surface water temperature. Linear regression is used to relate watersurface temperature to TOA brightness temperature.
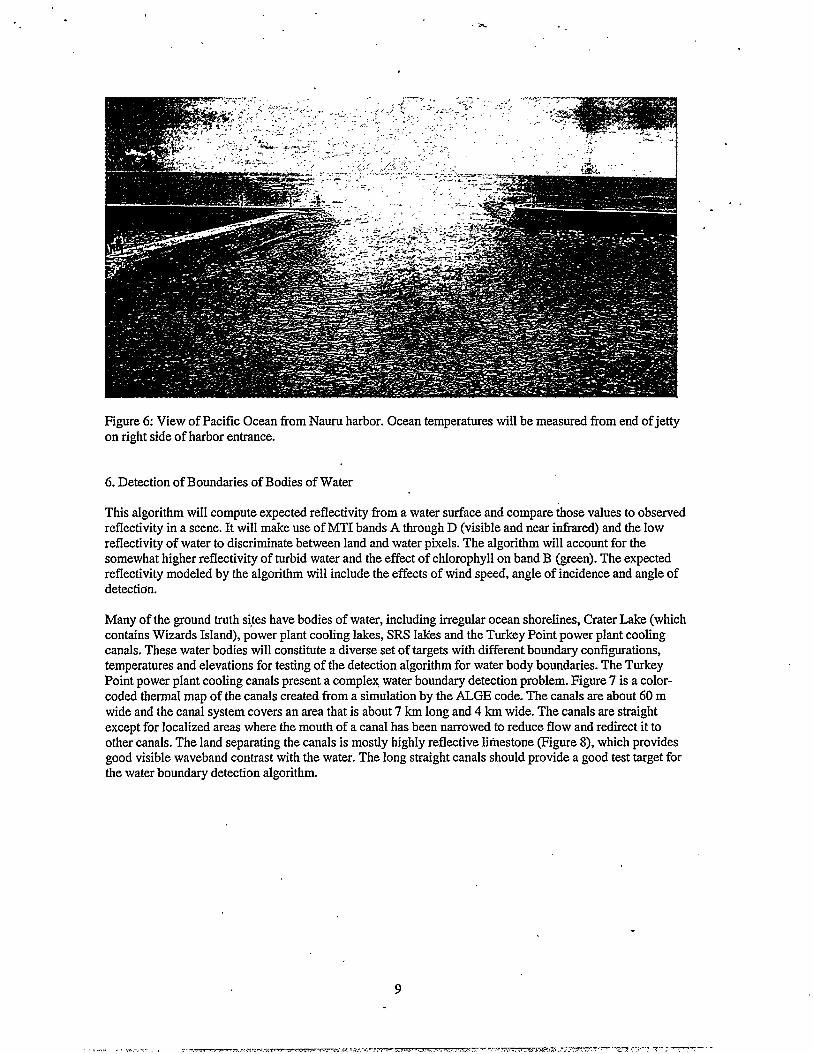
SRTC will use the same sites and methods used to validate the physics-based temperature retrieval algorithmto validate the robust water temperature retrieval algorithm. Our goal is to collect at least 30 usable images ofthe ground truth sites for robust and physics-bastyi temperature retrieval to ensure that the results fortemperature retrieval are statistically significant. The Tropical Western Pacific (TWP) ARM site on the islandof Nauru in the western Pacific will provide excellent atmospheric characterization in a warm and extremelyhumid climate. Ocean surface temperatures will be measured at the end of a jetty that extends outward fromthe mouth of the Nauru harbor (13gure 6). Measurements from a fishing boat confiied that oceantemperatures vary by only about 0.2° C in the area beyond the jetty.
.
8
\
.
,’
Figure 6: View of Pacific Ocean from Nauru harbor. Ocean temperatures will be measured from end of jettyon right side of harbor entrance.
6. Detection of Boundaries of Bodies of Water
This algorithm will compute expected reflectivity from a water surface and compare those values to observedreflectivity in a scene. It will make use of MTI bands A through D (visible and near infrared) and the lowreflectivity of water to discriminate between land and water pixels. The rdgonthm will account for thesomewhat higher reflectivity of turbid water and the effect of chlorophyll on band B (green). The expectedreflectivity modeled by the algorithm will include the effects of wind speed, angle of incidence and angle ofdetecticm.
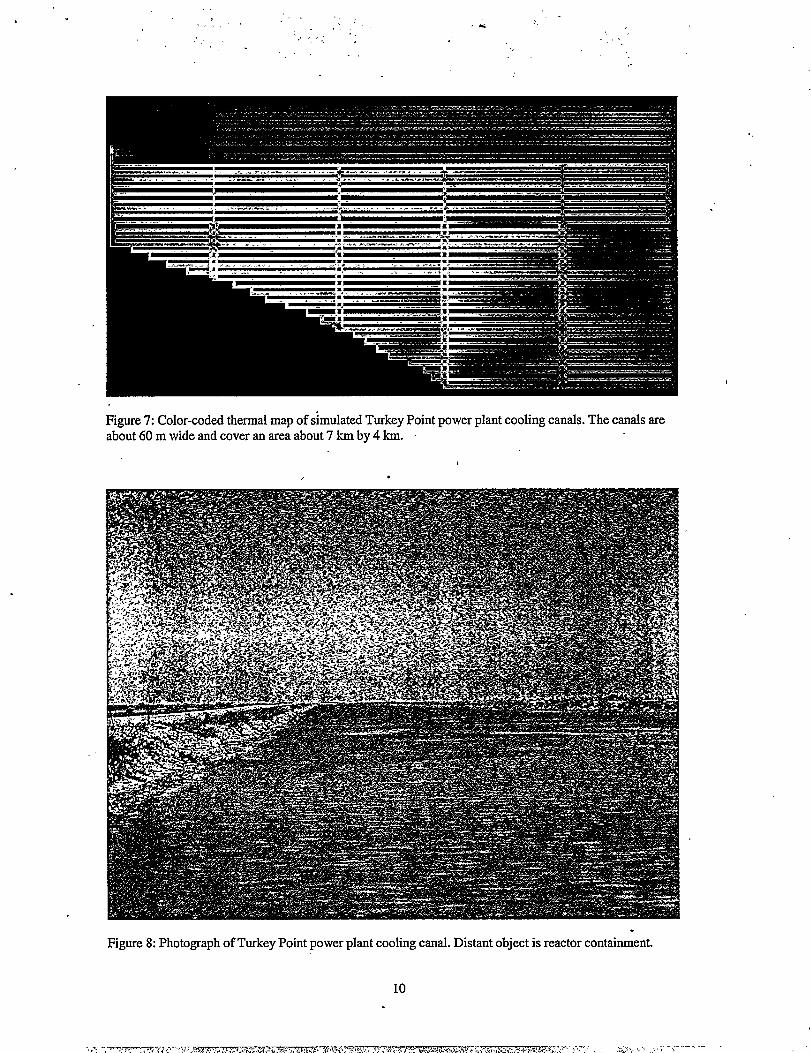
Many of the ground truth si,teshave bodies of water, including irregular ocean shorelines, Crater Lake (whichcontains Wizards Island), power plant cooling lakes, SRS lakes and the Turkey Point power plant coolingcanals. These water bodies will constitute a diverse set of targets with different boundary configurations,temperatures and elevations for testing of the detection algorithm for water body boundaries. The TurkeyPoint power plant cooling canals present a complex water boundary detection problem. Figure 7 is a color-coded thermal map of the canals created from a simulation by the ALGE code. The canals are about 60 mwide and the canal system covers an area that is about 7 km long and 4 km wide. The canals are straightexcept for localized areas where the mouth of a canal has been narrowed to reduce flow and redirect it toother canals. The land separating the canals is mostly highly reflective litiestone (Figure 8), which providesgood visible waveband contrast with the water. The long straight canals should provide a good test target forthe water boundary detection algorithm.
9
. ‘,.,.,, . . ><. ,
., -.:... ,, ‘,, ,. .:,”
,-,“, .,
“ . ..’
.’
‘ .
Figure 7: Color-coded thermal map of simulated Turkey Point power plant cooling canals. The canals areabout 60 m wide and cover an area about 7 km by 4 km. “
,/ .
Figure 8: Photograph of Turkey Point power plant cooling canal. Distant object is reactor containment..
10

. .
7. Subpixel Temperature Retrieval
The subpixel temperat~e retrieval algorithm is directed primarily at recovering water temperatures fromnarrow channel; or small bodies of water, which have many mixed Iand:water pixels. The.algorithm assumes~at some pure (unmixed) pixels are available in the scene, which can be used to compute columnar watervapor and effective atmospheric temperature with the physics-based temperature retrieval algorithm.Radiance in the five MTI thermal wavebands, an emissivity estimate for tie land s~ace, and an estimate of - . ‘the fractional coverage of the pixel by land and water (derived from visible wavebands) are also needed. Withthese inputs, temperatures for the water and land parts of the pixel can be derived by finding a best fit to the ‘measured radiances from the five MTI thermal wavebands.
Surface thermal discharges into power plant cooling lakes produce areas of water that are much warmer thanadjacent land. These dkcharge locations are well suited to testing of this algorithm. Some power plants, suchas the H. B. Robinson plant in South Carolina, use long, narrow dkcharge canals to carry heated water farfrom the cooling water intake (Tigure 9). These long narrow canals are well suited to testing of the sub-pixeltemperature retrieval algorithm, because there are many pixels with varying proportions of land and canal in asingle image, but the canal and land temperatures are nearly constant along the entire length of the canal.
Figure 9: Color-coded mosaic of thermal images of the H. B. Robinson power plant’s cooling lake. Thedischarge canal is about 8 km long and 20 m wide. The temperature drop horn the cooling water discharge(lower right) to the point wherethe heated water enters the lake (lower left) is about 1.O”C.
Other candidate subpixel temperature retrieval targets are rocket engine tests at NASA SSC and Iavawents onthe sides of Kllauea Volcano on the Big Island of Hawaii.
8. Thermal Energy Discharge Rates Into Surface Water Systems
This algorithm uses MTI imagery to determine the rate at which waste heat is discharged by an industrial’ ‘facility to water bodies such as a cooling lakes, rivers and bays. Power plants and many other industrialfacilities fkquently tie surface water systems to dissipate large quantities of waste heat. The temperature andamount of the.water being discharged determine whether it has any adverse environmental effects. The. -thermal plumes created by the disch~ge of waste heat to the environment are well suited to analysis bythermal imaging. This algorithm combines calibrated thermal imagery ti-omMTI, 3-D hydrodynamicmodeling, local meteorological data and the physical characteristics of the surface water system to find thedischarge rate (Garrett and Hayes7). Given the discharge rate, the amount of heat being injected into theenvironment can be found, and information about transport of other non-visible pollutants is generated.Figure 10 compares observed surface temperatures from Daedalus imagery of a SRS cooling lake io .simulated temperatures for the same time generated by t.hk algorithm.
11
., ----- . ... . ... . -—— ...7-... . . -me. 7.-., . . . . . .-.W-- -, .-r%?7r.T .,.,< ------- :-.. , .- --- -. -

.A
.,
I
Figure 10:Observedand simulatedSavannahRiverSite coolinglakes.
SRTC will validate this algorithm with data from-four power plants in different parts of the country that usecooling lakes, cooling canals and ocean discharge to dissipate waste heat.
9. Thermal Energy Discharge Rates Into the Atmosphere
This algorithm use: MTI imagery to determine the rate at ‘whichwaste heat is discharged to the atmosphereby an industrial facdity. Power plants and other industrial facilities often use natural draft or forced draftcooling towers to dissipate waste heat in the atmosphere. Cooling towers can have several local impacts onthe environment, including fog generation, icing, light snowfall and mist formation and cumulus cloudinitiation. This algorithm will use calibrated thermal and visible MTI imagery, 3-D hydrodynamic modeling,local meteorological data and cooling tower specifications to estimate the rate at which water mass andenthalpy are being discharged to the atmosphere (0’Steen8).
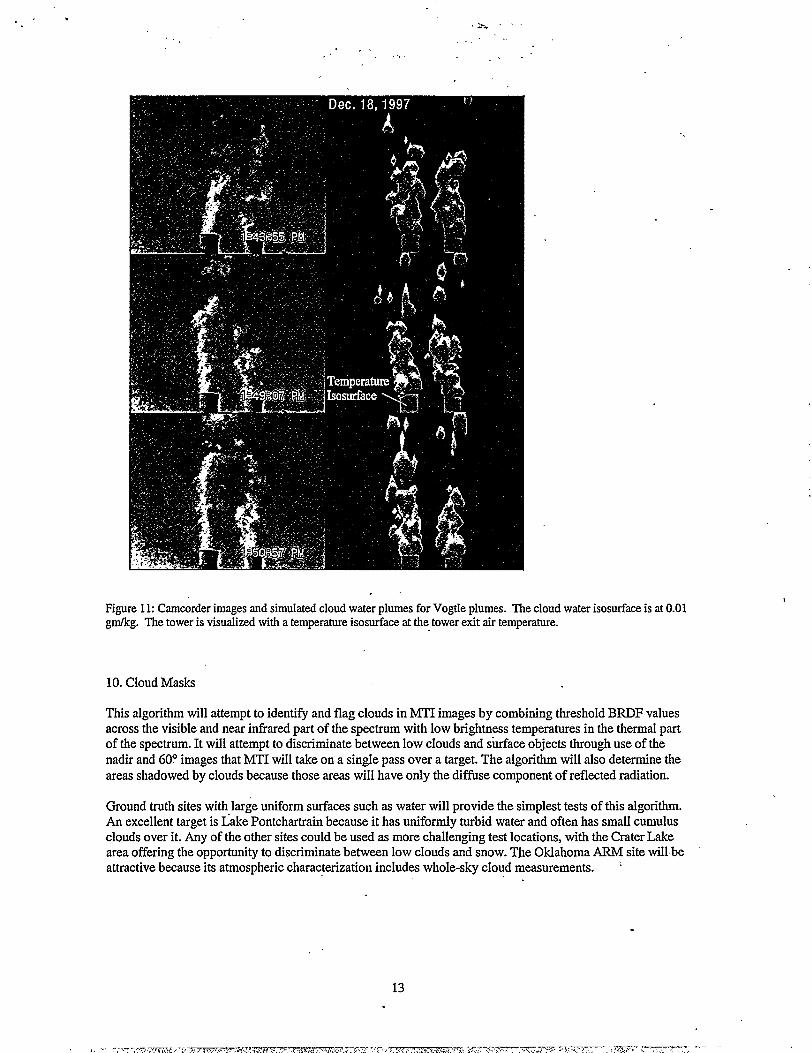
SRTC will collect ground trux data at the Vogtle power plant in Georgia to validate this algorithm. TheVogtle plant uses natural draft cooling towers. ~Ground truth data will include simultaneous visible and ~thermal images of the cooling tower plumes, ambient meteorology and internal cooling tower temperaturesand flow rates. The visible imagery will be usti to compute the”volume of the cooling tower plumes at thetime images are taken by MTI. The thermal imagery will be compared to MTI imagery and witfi radiativetransfer calculations based on plume simulations. Figure 11 shows a series of photographs and simulatedVogtle plumes under calm meteorological conditions.
.
12
. .
-5 ...:. .
.,-
!
. . ... :---’-
‘,, ,
. ... .,, .
..
Figure 11:Crun~rder imagesand simulatedcloudwaterplumesfor Vogtleplumes. The cloud waterisosurfaceis at 0.011
gin/kg. The toweris visualizedwitha temperatureisosurfaceat the towerexit air temperature.
10. Cloud Masks
This algorithm will attempt to identi~ and flag clouds in MTI irnages,by combining threshold BRDF valuesacross the visible and near infrared part of the spectrum with low brightness temperatures in the thermal partof the spectrum. It will attempt to discriminate between low clouds and siuface objects through use of thenadir and 60° images that MTI will take on a single pass over a target. The algorithm will also determine theareas shadowed by clouds because those areas will have only the diffuse component of reflected radiation.
Ground truth sites withlarge uniform surfaces such as water will provide the simplest tests of thk algoritlun.An excellent target is Lake Pontchartrain because it has uniformly turbid water and often has small cumulusclouds over it. Any of the other sites could be used as more challenging test locations, with the Crater Lakearea offering the opportunity to discriminate between low clouds and snow. The Oklahoma ARM site will-beattractive because its atmospheric characterization includes whole-sky cloud measurements. :
13

.
11. Thin Cirms Detection/Removal
This algorithm uses MTI band H (1.36-139P) to detect the presence of thin (sub-visible) ’cirms clouds, whichreflect solar radiation in this waveband that would otherwise be absorbed by water vapor in the lower depthsof the atmosphere. It also uses band H to correct for the effect of thin cirrus clouds on the visible and near
<4.. infrared channels (A through l?). Since til~ algorithm can only be used during the day, some effort will bemade to develop an algorithm that detects and removes the effmts of thin CiITUS at night. This app~s to be.
possible, given MTI’s well-calibrated thermal radiometry.
The ARM site in northern Oklahoma will provide the comprehensive atmospheric measurements nekded tovalidate this algorithm. The central facility has a micro-pulse Iidar, which is sensitive enough to detect kub-visual cirrus.
12. Scattering and Absorption by Aerosols
This algorithm corrects the MTI visible and nem-infkmd channels for aerosol path radiance to derive trueground refl~tance. The algorithm will use dark targets in the scene, such as thick stands of trees, todetermine surface reflectance in the SWIR channel O where atmospheric scattering and absorption are veryweak. Reflectance values in MTI channels A and C are highly correlated with channel O reflectance for darktargets. Aerosol optical depths in channels A and C can be calculated from the measured TOA radiances andthe calculated surface reflectance. Remaining channel aerosol optical depths can be determined empiricallythrough use of curve fits through channel .A and C data. Given the aerosol optical depths for all channels,surface reflectance for the non-dark target scene pixels can then be calculated.
Crops such as sorghum and soybeans are grown on the farms surrounding the Southern Great Plains (SGP)ARM site in north central Oklahoma. The reflectance of these crops during growing season when they aredark green will be collected. These spectra, ph.Isthe comprehensive atmospheric characterization at the ARMsites (including aerosol measurements) will provide a ground truth database for validation of the algorithm.Figure 12 is a photo of the SGP ARM site showing the gently rolling, primarily agricultural landscape.
Figure 12: Southern Great Plains (SGP) Atmospheric Radiation Measurements (ARM) site in north centralOklahoma. Several MTI algorithms will be tested by combining the excellent atmospheric characterization atthis site with crop reflectance spectra taken by ground-based instruments and by MTI.
14
!
. . .
.> .“
.’
13. Cohunm Water Vapor Retrieval
This algorithm will derive the atmospheric columnar water vapor content using reflected sunlight and the0.94 micron water vapor absorption band (MTI Band F). A new technique called Atmospheric..~$e-correctedDifferential Absorption (APDA) has been developed, which based on preliminary tests, appeafs to be moreaccurate than traditional Continuum Interpolated Band Ratio (CIBR) methods over many surface types..APDA improves on the empirical CB3Rmethod by adding physics based on radiative transfer. .
Validation of the algorithm will require atmospheric profiles of humidity and temperature as a function ofpressure. It will also require simultaneous ground-based sun photometer measurements of optical depth,uniform ground coverage with a 10 run sampling reflectance spectrum, and cross-calibration of MTI channelsE, F and G with an airborne imaging spectrometer such as AVIRIS. We hope to have some simulirmeousAVIRIS collections over the desert playas and the NASA-Stennis V&V target array in Mississippi. TheOklahoma ARM site is another verification site, since it will have the atmospheric, sun photometer and otherradiometric data.
14. Vegetation Health
The goal of thk algorithm is to identify vegetation that has been stressed by atmospheric, surface orsubsurface releases of pollutants from ind,ustriai sites. Since there are many natural sources of stress forvegetation, e.g.,lack of water, dkcrimination between anthropogenic and natural sources of siress willrequire time series of images and/or collateral information about the industrial site. The algorithm makes useof the fundamental observation that tie chlorophyll content of vegetation under stress decreasb, and alongwith it the relative peak in reflectance of green light (MTI Channel B). The algorithm will also use Channel I(1.55 to 1.75P) to attempt to discriminate between stress caused by lack of water dd other types of stress(Hunt et al?). The algorithm will use a neural network to classi@ leaf reflectance data that has been binnedand averaged over six MTI channels.
Vegetation stress has been studied at the Savannah River Site (SRS) for many years as a part of theenvironmental restoration program for areas affected by chemical and radioactive contaminants as a result ofCold War nuclear materials production (BIohm et al?). Forested areas near SRS’S D-Area have been affectedby acidic runoff from coal ash and have already been the subject of research. Figure 13 shows the parts ofSavannah River Site’s D-Area where coal for power generation is stored, along with the associated runoffcontainment and ash basins. Effects of acidic water seepage from these btiins on nearby trees maybedetectable by applying the vegetation stress algorithm to IWTIimagery of D-Area.
15
..—--- -.. —..-——-.. ..—...= ——.—.-.—- —- -.<.--.— .-

.‘.
Figure 13: Savannah River Site’s D-Area power plant uses coal to generate electricity. Vegetation stress maybe detectable around the associated runoff containment basin and ash basins.
a
15. Water Quality and Bathymetry
Since there is an extensive literature on retrieval of water quality parameters from remote sensing data, wewill apply existing methods and MTI charnels A,B and C (blue, green, red) to retrieve water quality data.Primary quantities of interest are chlorophyll content, suspended sediments and yellow substance (dissolvedorganic matter). Codes such as 6S will be used in the retrieval algorithm because they include relationshipsbetween water color and chlorophyll and the effects of wind on water refl@mce.
The turbid lakes of the southeast U. S. typically have high chlorophyll contents due to high algalconcentrations and even algal mats. Sites include power plant cooling lakes and unheated lakes at SRS, whichare monitored as part of site environmental programs. Water quality is also a research focus at Crater Lake(Figure 14) which is an extremely clean body of water and which will provide data that sharply contrasts withimagery from the southeast U.S. lakes.
.
16

,“.
..*” -
. ..,-’
.’.
Figure 14 Crater Lake is an exiremely clean, high altitude lake in southwest Oregon. MTI images of CraterLake will be used to test water quality, bathyme~ and temperature retrieval algorithms. .
16. Material Identification
A k-means clustering algorithm will be used to distinguish between various types of materials within an MTIscene. This algorithm will use the three visible MTI channels (A, B, C), the near Ill channel D and the short-waye Ill channels I and O. The cluster centers will be determined from a library of spectral reflectance datafor a wide variety of man-made and natural materials. The algorithm will assign each MTI pixel to one of thematerial categories.
The Savannah River Site (SRS) combines several huge industrial facilities with large areas of natural forestedterrain. There are asphalt, concrete and gravel roads, large metal waste tanks, coal piles, buildings withrooftops made of various materials and painted surfaces. Natural surfaces include fores~ swamp, bare soil andwaste sites that have clay caps with grass on top. Another target will be the uranium mining sites andassociated tailings in New Mexico and Arizona. Figure 15 is a photograph of a huge abandoned uranium pitmine in northeastern Arizona on Navajo lands. The pit is about 200 m long and about 100 m wide. Soilsamples taken from the pit contain uranium ore and have reflectance spectra that are somewhat different fromthe surrounding undisturbed soil.
17 “

.
. ;“.,. ~-_,,:
,“.-
Figure 15: Abandoned uranium pit mine in northeastern Arizona.
3. GroundTruth Measurements and Analyses
A diverse set of radiometric and atmospheric sensors will be need+ to collect ground truth data for MTI. Atsome sites it will not be possible to measure skin temperatures directly with a radiometer, so the skintemperature will have to be derived from bulk water and meteorological data. This section describes theinstrumentation that SRTC will use to collect ground truth data, and the method that it will use to derive skintemperatures from bulk water data.
3.1 Radiometric Measurements
The intervening atmosphere between satellite and ground level surfaces affects the quality of the imageryrecorded-by the satellite. The MTI satellite characterizes ground targets by measuring reflected and emittedradiance from 15 spectral bands in the range of 0.45 to 10.70 microns. The broad spectral range observed bythe satellite encompasses the visible, NIR, SWIR, NWIll and LWIR. Present technology cannot satis~ allground truth requirements needed by the satellite with a simple instrument. The broad spectral region hasbeen subdivided in smaller regions based on availability of instrumentation, technical application, spatial andwavelength resolution.
MTI spectral bands A-D and O are spectral bands primarily used for material identification. Bands E-F areused for the determination of atmospheric water vapor and band H for detection cirrus clouds. Band I willprovide information related to vegetation stress through measurement of leaf water content. The retrieval ofthe temperature’s surface is accomplished with the remaining 5 bands (J-N).
‘The FR spectroradiometer (Figure 16) and the Sun Photometer (Figure 17) manufactured by AnalyticalSpectral Devices (ASD) and the University of ~zona respectively, will be used to measure the visible andnear infrared spectral regions. The primary function of the ASD FR spectroradiometer is to provide relativereflectance and absolute radiances of ground targets. The ASD FR spectroradiometer will be used in the 0.35.to 2.5-micron spectral range encompassing bands A-I and band O. The Sun Photometer’s primary purpose isto evaluate the skies’ optical depth and therefore the aerosol concentration by measuring the solar radiationreaching the earth’s surface. The Sun Photometer uses 10 spectral bands from 0.38 to 1.03 microns tocalculate the sun’s radiance.

., ..< ~. ... .,!
..?...,. .——.. --?------.-,.-..-t—------,——.— .--.---”---25
..%
--- ..1 :,.. . . . ----.,,
J
Figure 16 ASDFR spectroradiometer.Figure 17: Fourier Transform Infrared Radiometer
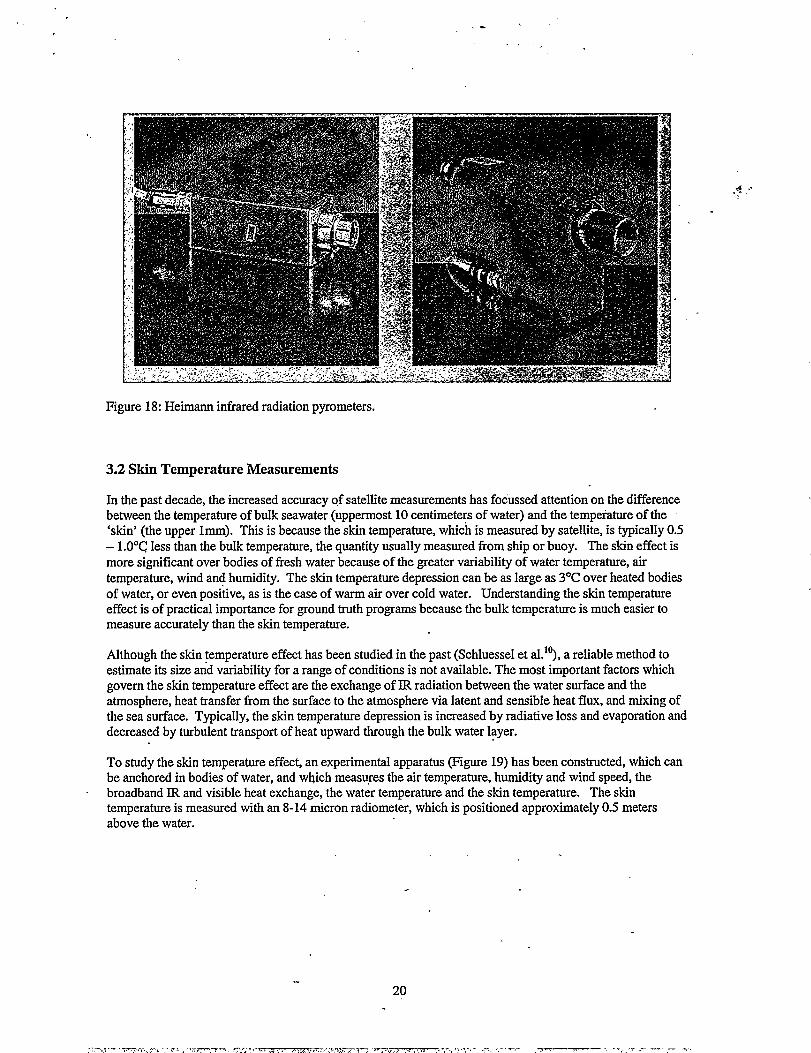
The water and ground surface temperature is calculated from the radiance of the 5 (J-N) bands in the MWIRand LWIR. Temperature measurements will be acquired witl accurate glass thermometers traceable to NIST,hand-held digital thermometers, point radiometers, and imaging radiometers. Surface temperaturemeasurements will be recorded using Heimann point radiometers manufactured by Heitronics (Figure 18).The radiometer’s accuracy will be verified using blackbodiei manufactured by MIKRON Corp. Thetemperature of extended, surface areas will be measured using imaging radiometers manufactured byInfiametrics Corp. Two cameras from Infiametrics will be used to characterize the surface (model 760 and aportable SC2000). A Fourier transform infrared spectrometer manufactured by Midac Corp. will be used to -measure the spectral radiance of the 5 bands used by the MTI satellite.
.
19
. . . . . .. ... . . ..-. ———- ---- .. . . -.....—-------- ... ...-.——— -. .- . ..— —— . .
. . .- .,’
.,, ,
Figure 18: Heimann infrared radiation pyrometers.
3.2 Skin Temperature Measurements
In the past decade, the increased accuracy of satellite measurements has focussed attention on the differencebetween the temperature of bulk seawater (uppermost 10 centimeters of water) and the temperature of the‘skin’ (the upper lmm). This is because the skin temperature, which is measured by satellite, is typically 0.5– l.O°C less than the bulk temperature, the quantity usually measured from ship or buoy. The skin effect ismore significant over bodies of fresh water because of the greater variability of water temperature, airtemperature, wind and humidity. The skin temperature depression can be as large as 3°C over heated bodiesof water, or even positive, as is the case of warm air over cold water. Understanding the skin temperatureeffect is of practical importance for ground truth programs because the bulk temperature is much easier tomeasure accurately than the skin temperature.
Although the skin temperature effect has been studied in the past (Schluessel et al.1~, a reliable method toestimate its size and variability for a range of conditions is not available. The most important factors whichgovern the skin temperature effect are the exchange of JR radiation between the water surface and theatmosphere, heat transfer from the surface to the atmosphere via latent and sensible heat flux, and mixing ofthe sea surface. Typically, the skin temperature depression is increased by radiative loss and evaporation anddecreased by turbulent transport of heat upward through the bulk water layer.
To study the skin temperature effect, an experimental apparatus (Figure 19) has been constructed, which canbe anchored in bodies of water, and wtich meas~es the air temperature, humidity and wind speed, thebroadband IR and visible heat exchange, the water temperature and the skin temperature. The skintemperature is measured with an 8-14 micron radiometer, which is positioned approximately 0.5 metersabove the water.
20

. . .-&-
,. ,,‘.
. .
Figure 19: Skin temperature measurement apparatus being towed into H. B. Robinson cooling lake as Dr.Robert J. Kurzeja, developer of the skin temperature apparatus, looks for a mooring location.
The skin depression is determined by comp@g the temperature measured with the radiometer (skintemperature) and a thermocouple at 10 cm below the surface (bulk temperature). Because of the inherentditllculties of this approach, the skin temperature depression was also determined by comparing radiometermeasurements of the natural water surface and the ‘stirred’ surface. The ‘stirred’ surface temperature wasobt&ned by pumping a jet of water from 10cm below the surface into the radiometer’s field of view. Becausethe skin depression takes -10 sw to form, the stirred-temperature will be equivalent to the bulk temperature.
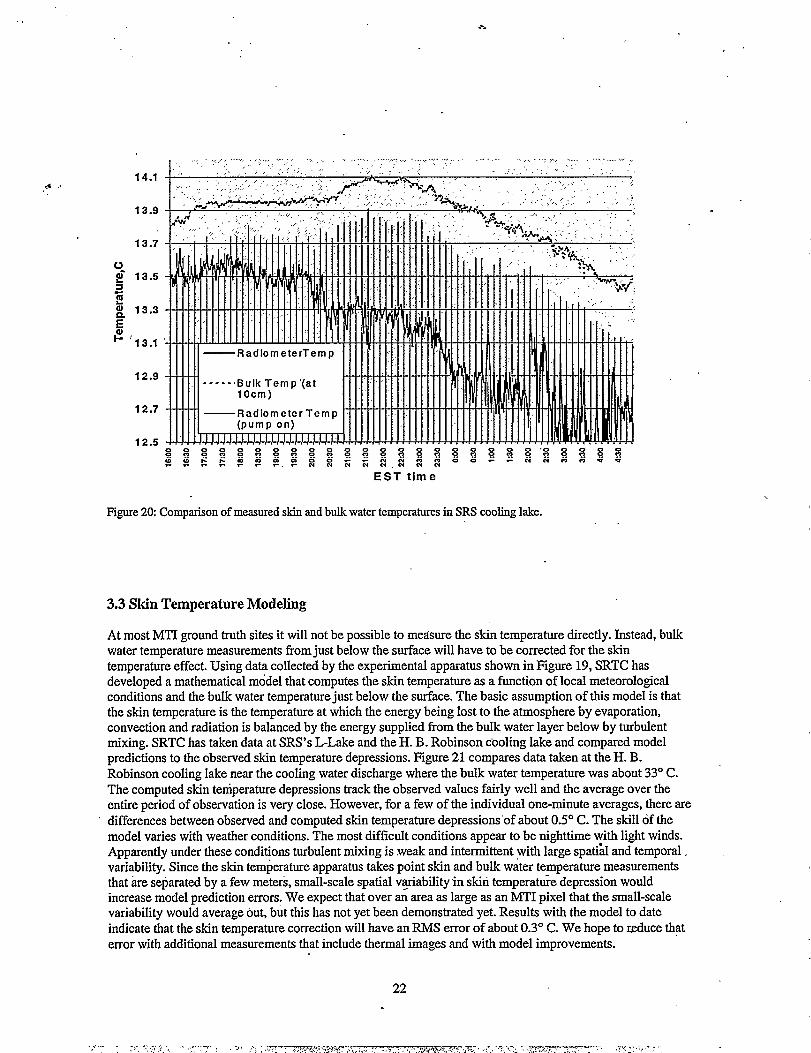
Figure 20 shows results obtained from an unheated SRS lake on March 18 and 19 of 1999. The figure showsthe bulk water temperature at 10 cm deep (thermocouple), the radiometer temperature of the natural watersurface, and the radiometer temperature of the pumped water (the vertical bars at 10 minute intervals). Thepump “wasoperated every 10 minutes for 10 seconds. The radiometer “pump temperature” is the average ofthe radiometer measurements at 4,6,8 and 10 seconds after the pump was turned on. Ideally, the bulk watertemperature will equal the temperature of the pumped water as measured by the radiometer. Figure 20shows, however, that the radiometer pumped water temperature is -0.2C cooler than the bulk temperature.This is due to a bias of the radiometer of -0.05C compared to the thermocouple and to the contribution to theradiometer temperature from reflected (cooler) sky radiation. This effect is estimated to about -0.2C.
An interesting feature in Figure 20 is the greater variability of the temperature of the natural water surfacecompared with the pumped water temperatur~ both obtained with the radiometer. This difference issurprising since the former is an average of 30 values while the latter is an average of 4 values. However,this difference is believed to reflect the large variability of the skin temperature in very light winds (less than1 mfs), when large skin temperature depressions can form because in the absence of mixing in the bulk waterlayer. The results also suggest that the skin temperature effect may be most difficult to account for over smallinland bodies of water on clear nights, when&e winds will be near cd-m. Conversely, the most reliableestimates of the skin temperature maybe possible during windy days, when the water surface andatmospheric boundary layer are well mixed.
.
21
\
.-.. .
. .
.4 ..,,
14.1
13.9
13.7
0g- 13.53%k 13.3
2
~ ‘13.1
12.9
12.7
12.5
EST time
\
Figure 20 Comparisonof measuredskinandbulk watertemperaturesin SRScoolinglake.. .
3.3 Skin Temperature Modeling
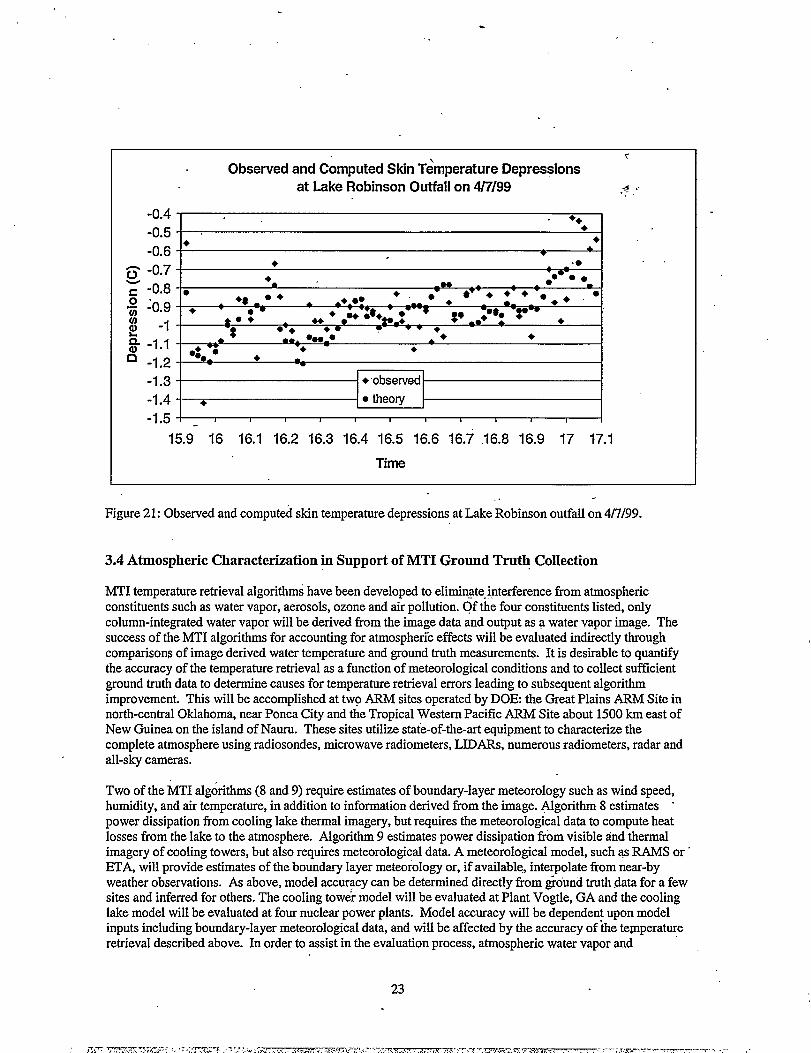
At most MTI ground truth sites it will not be possible to measure the skin temperature directly. Instead, bulkwater temperature measurements from just below the surface will have to be corrected for the skintemperature effect. Using data collected by the experimental apparatus shown in Figure 19, SRTC hasdeveloped a mathematical model that computes the skin temperature as a function of local meteorologicalconditions and the bulk water temperature just below the surface. The basic assumption of this model is thatthe skin temperature is the temperature at which the energy being lost to the atmosphere by evaporation,convection and radiation is balanced by the energy supplied from the bulk water layer below by turbulentmixing. SRTC has taken data at SRS’S L-Lake and the H. B. Robinson cooling lake and compared modelpredictions to the observed skin temperature depressions. Figure 21 compares data taken at the H. B.Robinson cooling lake near the cooling water discharge where the bulk water temperature was about 33° C.The computed skin temperature depressions track the observed values fairly well and the average over theentire period of observation is very close. However, for a few of the individual one-minute averages, there aredifferences between observed and computed skin temperature depression.iof about 0.5° C. The skill of themodel varies with weather condhions. The most dlftlcult condhions appear to be nighttime with light winds.Apparently under these conditions turbulent mixing is weak and intermittent with large spati~ and temporal.variability. Since the skin temperature apparatus takes point skin and bulk water temperature measurementsthat tie separated by a few meters, small-scale spatial wy-iabilityin skin temperafie depression wouldincrease model prediction errors. We expect that over an area as large as an MTI pixel that the small-scalevariability would average out, but this has not yet been demonstrated yet. Results with the model to dateindicate that the skin temperature correction will have an RMS error of about 0.3° C. We hope to rxxlucethaterror with additional measurements that include thermal images and with model improvements.
22
.
Observed and Computed Skin Temperature Depressionsc
at Lake Robinson Outfall on 4/7/99 4 ......
-0.41 . ++ i
15.9 16 16.1 16.2 16.3 16.4 16.5 16.6 16.7 .16.8 16.9 17 17.1
Time
Figure 21: Observed and comput&l skin temperature depressions at Lake Robinson outfall on 4/7/99.
3.4Atmospheric Characterization in Support of MTI Ground Truth Collection
MTI temperature retrieval algorithti have been developed to eliminate~nterference from atmosphericconstituents such as water vapor, aerosols, ozone and air pollution. Of the four constituents listed, onlycolumn-integrated water vapor will be derived tlom the image data and output as a water vapor image. Thesuccess of the MTI algorithms for accounting for atmospheric effects will be evaluated indirectly throughcomparisons of image derived water temperature and ground truth measurements. It is desirable to quantifythe accuracy of the temperature retrieval as a function of meteorological conditions and to collect suftlcientground truth data to determine causes for temperature retrieval errors leading to subsequent algorithmimprovement. This will be accomplished at two ARM sites operated by DOE the Great Plains ARM Site innorth-central Oklahoma, near Ponca Chy and the Tropical Western Pacific ARM Site about 1500 km east ofNew Guinea on the island of Nauru. These sites utilize state-of-the-art equipment to characterize thecomplete atmosphere using radiosondes, microwave radiometers, LIDARs, numerous radiometers, radar andall-sky cameras.
Two of the MTI algorithms (8 and 9) require estimates of boundary-layer meteorology such as wind speed,humidity, and air temperature, in addition to information derived from the image. @gorithm 8 estimates “power dissipation from cooling lake thermal imagery, but requires the meteorological data to compute heatlosses from the lake to the atmosphere. Algorithm 9 estimates power dissipation from visible rind thermalimagery of cooling towers, but also requires meteorological data. A meteorological model, such w RAMS or”ETA, will provide estimates of the boundary layer meteorology or, if available, interpolate from near-byweather observations. As above, model accuracy can be determined directly from @ound truth data for a fewsites and inferred for others. The cooling tower model will be evaluated at Plant Vogtle, GA and the coolinglake model will be evaluated at four nuclear power plants. Model accuracy will be dependen~ upon modelinputs including boundary-layer meteorological data, and will be affected by the accuracy of the temperatureretrieval described above. In order to assist in the evaluation process, atmospheric water vapor and
23
“
),
..
,
4.
temperature profiles’will be measured with the balloon-borne Atmospheric Meteorological Research System(AMRS) and atmospheric aerosols will be measured wi~ a 6-channel spe&ral photometer. Thesemeasurements are not as complete as fiose made to characterize the atmosphere at the ARM sites but willprovide a means by which model errorwcan be separated from those affecting temperahire retrieval.
Measurements of surface wa~$r.temperatures are critical for ground-truth corroboration against MTI satelliteimagery. Typical monitoring’ locations include areas where large temperature gradients are present such aspower plant cooling lakes. Measurements must be made within the upper 10 cm of.the water body to ensure -a proper representation of the surface water temperature. Where necessary, buoys or other similar flotationdevices will be used to maintain the proper monitoring level. Probe types include precision thermocouple orplatinum resistance devices that are calibrated against traceable standards. Data will be collected locally and,in some cases, are made available remotely via telecommunication hardware in near-real time. .,
We have used the 16 IvfH science algorithms as our guide for selection of ground truth collection sites. Thesesites are in a variety of climatic regimes including humid subtropical (Southeast U. S.), hot dry desert(Southwest), cool, high altitude (Pacific Northwest) and cool maritime (Northeast). Collectively, these siteswill provide data needed to validate all of the MTI algorit@. The data will be collected in collaborativerelationships with other government agencies, universities and private organizations.
ACKNOWLEDGMENTS
The US Department of Energy supports this work at Sandia National Laboratories, Los Alarnos NationalLaboratory and the Savamah River Technology Center. We appreciate the support of our colleagues at theselaboratories and the support of the different private and public organizations working with us on MTI groundtruth collections.
REFERENCES
1.
2.
3.
4.
5.
6.
7.
8.
9.
D. S. Negri, J. E. Shines, ‘“Thermalinfrared surveys of the Savannah River Plant”, DOE(ONS-SRL)-8601, DOE Remote Sensing Laboratory, Las Vegas, Nevada, 1986.J. D. B1ohm,L. R. Tinney, and H. E. Mackey, Jr., “The integration of airborne multispectral scanner dataand geographic information system technology for wetland remediation and vegetation stress detectionstudies at the Savamah River Site.” Proceeding of ER ’93,Environmental Remediation Conference,October 24-28,1993, Augusta, Georgia, WSRC-MS-93-0385X, 1993.P. J: Bresnahan, D. J. Cowen. J. R. Jensen, and H.E. Mackey, Jr., “Integrating heterogeneous data todevelop a large-scale environmental data atlas for multi-platform users.” Proceeding GIS/LIS ’94Annual Conference and Exposition, October 25-27,1994. Phoenix, Arizona. pp. 96-104.,WSRC-MS-94-0418,1994.B. W. Smith (editor), “Handbook of science algorithms for the Multispec~al Thermal Imager”, LA-UR ,98-306, Los Alamos National Laboratory, Los Alamos, New Mexico, 1998.W. B. Clodius, S. C. Bender and B. W. Smith: “MTI On-orbit Calibration”, in Imaging Spectrometry V,M. R. Descour and S. S. Shen, Editors, Denver, 18-23 July 1999, Pro6. SPIE Vol. 3753, (1999).P. N. Slater, S. F. Biggar, K. J. Theme, D. I. Gellman, P. R. Spyak, “Vicarious radiometric calibrations .of EOS sensors”, J. Atmos. And Oceanic Tech., 13,349-359, 1996.A. J. G~ett and D. W. Hayes, “Cooling lake simulations compared to the,pnal imagery and dye tracers”,J. Hydr. Engrg., ASCE, 123,885-894,1997. ‘ . .“
B.%. O’steen, “Plant Vogtle cooling tower studies”, WSRC-TR-99-O0174, Savannah River TechnologyCenter, Aiken, SC, 29808,1999.E. R. Hunt, B. N. Rock, P.S. Nobel, “Measurement of leaf relative water content by infkared - .reflectance”, Remote Sens, Environ. 22,429-435, 1987.
24
..
-.
‘ :.
\
10. P. Schluessel, W. J. Emery, H. Gr@, T. Mammen, “On bulk-skin temperature difference and its impacton satellite remote sensing of sea surface temperatures”, .l.”Geophy.r.Res., 95, 13341-13356, 1990.
J
25