Embed Size (px)
Citation preview
Prepared in cooperation with the
OFFICE OF ENVIRONMENTAL RESTORATION AND WASTE MANAGEMENT,
U.S. DEPARTMENT OF ENERGY
National Nuclear Security Administration
Nevada Operations Office, under
Interagency Agreement DE-AI08-96NV11967
Ground-Water Discharge Determined from Estimates of Evapotranspiration, Death Valley Regional Flow System, Nevada and CaliforniaFlow System, Nevada and California
U.S. Department of the InteriorU.S. Geological Survey
Water-Resources Investigations Report 01-4195
Prepared in cooperation with theOFFICE OF ENVIRONMENTAL RESTORATION AND WASTE MANAGEMENT, U.S. DEPARTMENT OF ENERGYNational Nuclear Security AdministrationNevada Operations Office, underInteragency Agreement DE-AI08-96NV11967
Ground-Water Discharge Determined from Estimates of Evapotranspiration, Death Valley Regional Flow System, Nevada and California
U.S. Department of the InteriorU.S. Geological Survey
Water-Resources Investigations Report 01-4195
By Randell J. Laczniak, J. LaRue Smith, Peggy E. Elliott, Guy A. DeMeo, and Melissa A. Chatigny, U.S. Geological Survey; and Gaius J. Roemer, GeoTrans
Carson City, Nevada
2001

U.S. DEPARTMENT OF THE INTERIOR GALE A. NORTON, Secretary
U.S. GEOLOGICAL SURVEY CHARLES G. GROAT, Director
Any use of trade, product, or firm names in this publication is for descriptive purposes only and does not imply endorsement by the U.S. Government
For additional information contact:
District Chief U.S. Geological Survey 333 West Nye Lane, Room 203 Carson City, NV 89706–0866
email: [email protected]
http://nevada.usgs.gov

CONTENTS III
CONTENTS
Abstract.................................................................................................................................................................................. 1Introduction............................................................................................................................................................................ 2
Purpose and Scope ..................................................................................................................................................... 2Acknowledgments...................................................................................................................................................... 4Stewardship ................................................................................................................................................................ 4
General Description and Setting............................................................................................................................................ 4Physiography and Geology........................................................................................................................................ 4Climate ....................................................................................................................................................................... 4Vegetation and Wildlife.............................................................................................................................................. 6Drainage ..................................................................................................................................................................... 6Hydrogeology............................................................................................................................................................. 6
Estimation of Annual Evapotranspiration and Ground-Water Discharge.............................................................................. 8Evapotranspiration ..................................................................................................................................................... 9Evapotranspiration Units............................................................................................................................................ 10Evapotranspiration Rate and Volume Estimates ........................................................................................................ 16Ground-Water Discharge ........................................................................................................................................... 26Limitations of Methodology ...................................................................................................................................... 31
Summary................................................................................................................................................................................ 37References Cited.................................................................................................................................................................... 38Appendix: Uncertainty and Sensitivity Analysis of Annual Estimates of Ground-Water Discharge
for Death Valley Regional Flow System, by G.J. Roemer ..................................................................................... 43
FIGURES
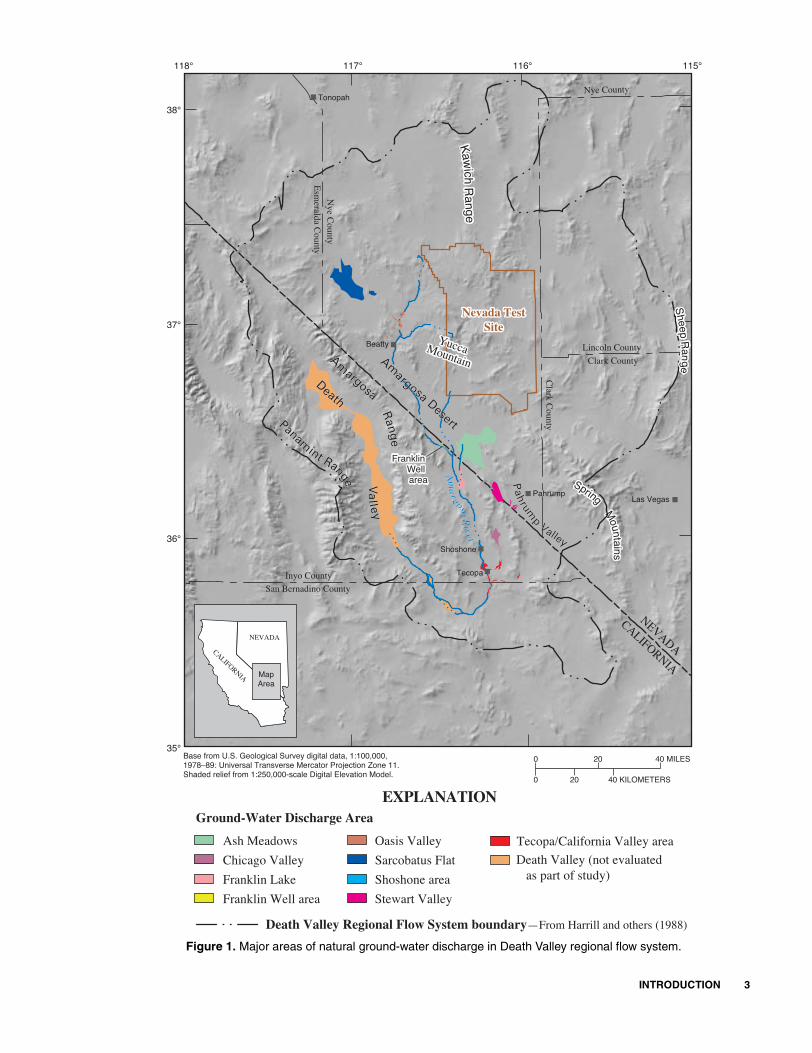
1. Map showing major areas of natural ground-water discharge in Death Valley regional flow system ........................................................................................................................................................... 3
2. Map showing major areas of Federally administered land in Death Valley regional flow system...... ................... 5
3. Map showing hydrographic areas of Death Valley regional flow system............................................................. 7
4. Graphs showing spectral response of land covers having different vegetation, soil, and moisture conditions ................................................................................................................................................ 11
5. Map showing pseudo-color infrared false color composite of Death Valley regional flow system ............................................................................................................................................................ 14
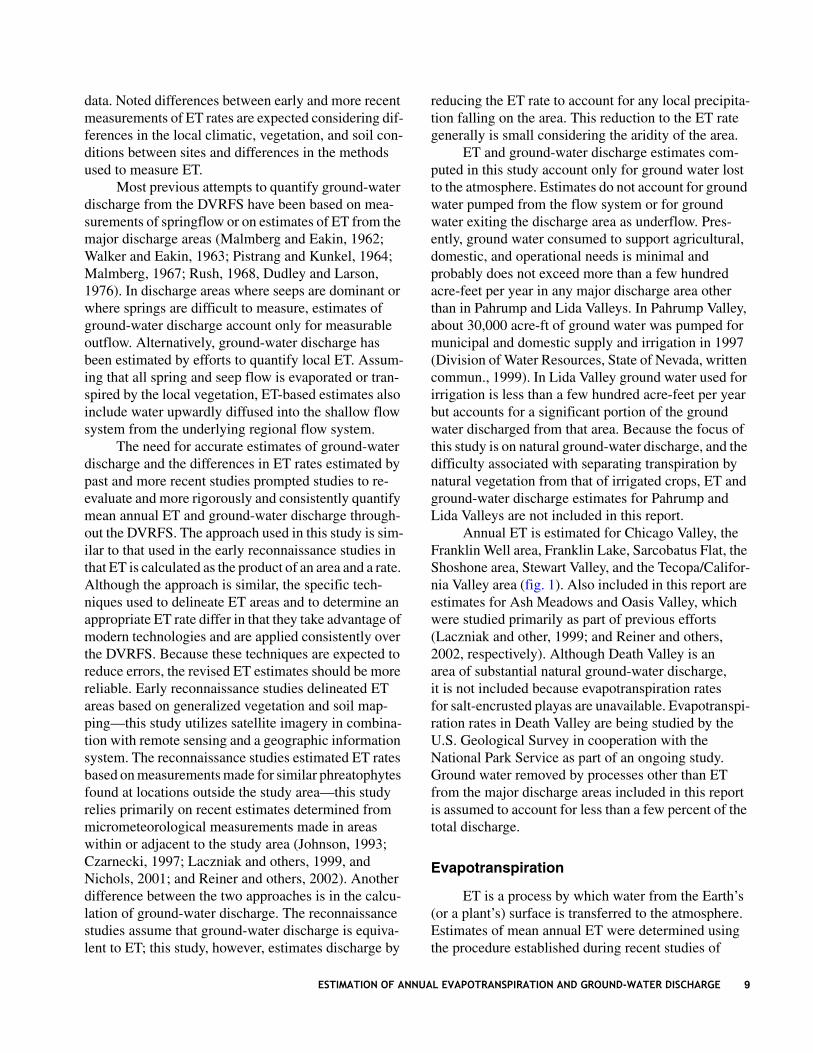
6. Graphs showing spectral clusters used to classify evapotranspiration units in discharge areas of Death Valley regional flow system ........................................................................................................... 15
7–15. Maps showing classification of evapotranspiration units in:7. Ash Meadows, Nevada and California............................................................................................................ 178. Chicago Valley, California .............................................................................................................................. 189. Franklin Lake, California................................................................................................................................ 19
10. Franklin Well area, California......................................................................................................................... 2011. Oasis Valley, Nevada....................................................................................................................................... 2112. Sarcobatus Flat, Nevada.................................................................................................................................. 2213. Shoshone area, California ............................................................................................................................... 2314. Stewart Valley, California ............................................................................................................................... 2415. Tecopa/California Valley area, California....................................................................................................... 25
16. Map showing modified soil-adjusted vegetation index of Death Valley regional flow system ............................. 27

IV Ground-Water Discharge Determined from Estimates of Evapotranspiration, Death Valley Regional Flow System
17. Graph showing parameters having the greatest effect on simulated annual ground-water discharge, measured by Rank Correlation, from:
A. Ash Meadows .......................................................................................................................................... 49
B. Chicago Valley......................................................................................................................................... 49
C. Franklin Lake........................................................................................................................................... 49
D. Franklin Well area.................................................................................................................................... 49
E. Oasis Valley ............................................................................................................................................. 49
F. Sarcobatus Flat ........................................................................................................................................ 49
G. Shoshone area .......................................................................................................................................... 49
H. Stewart Valley .......................................................................................................................................... 49
I. Tecopa/California Valley area.................................................................................................................. 49
18. Frequency charts generated from 1,000 realizations of simulated annual ground-water discharge from major discharge areas:
A. Ash Meadows .......................................................................................................................................... 50
B. Chicago Valley......................................................................................................................................... 50
C. Franklin Lake........................................................................................................................................... 50
D. Franklin Well area.................................................................................................................................... 50
E. Oasis Valley ............................................................................................................................................. 50
F. Sarcobatus Flat ........................................................................................................................................ 51
G. Shoshone area .......................................................................................................................................... 51
H. Stewart Valley .......................................................................................................................................... 51
I. Tecopa/California Valley area.................................................................................................................. 51
TABLES
1. Evapotranspiration units identified and classified in major discharge areas of Death Valley regional flow system, Nevada and California ..................................................................................................................... 13
2. Acreage of evapotranspiration units by major discharge area in Death Valley regional flow system, Nevada and California ........................................................................................................................................... 16
3. Location and general description of sites equipped with micrometeorological instruments and used to determine evapotranspiration in Ash Meadows and Oasis Valley, Nevada .............................................. 28
4. Estimated evapotranspiration rates for evapotranspiration units classified in major discharge areasof Death Valley regional flow system, Nevada and California ............................................................................. 29
5. Mean annual evapotranspiration from major areas of ground-water discharge in Death Valley regional flow system, Nevada and California ........................................................................................................ 30
6. Mean modified soil-adjusted vegetation index value by evapotranspiration unit for major discharge areas in Death Valley regional flow system, Nevada and California ..................................................................... 31
7. Annual precipitation estimated from bulk precipitation measurements taken at evapotranspirationsites in Ash Meadows, Oasis Valley, and Death Valley areas, Nevada and California .......................................... 32
8. Annual precipitation measurements from National Weather Service climate stations near the major discharge areas of Death Valley regional flow system, Nevada and California..................................... 33
9. National Weather Service climate stations near major discharge areas of Death Valley regional flow system, Nevada and California ...................................................................................................................... 35
10. Mean annual ground-water discharge from major areas of ground-water discharge in Death Valley regional flow system, Nevada and California ........................................................................................................ 36
11. Values of coefficient of variability used in Monte Carlo analysis to simulate ground-water discharge; (A) evapotranspiration rate, and (B) precipitation rate .......................................................................................... 45

CONTENTS V
12–20. Simulated mean annual evapotranspiration and ground-water discharge from:
12. Ash Meadows .......................................................................................................................................... 46
13. Chicago Valley......................................................................................................................................... 46
14. Franklin Lake........................................................................................................................................... 46
15. Franklin Well area.................................................................................................................................... 46
16. Oasis Valley ............................................................................................................................................. 47
17. Sacrobatus Flat ........................................................................................................................................ 47
18. Shoshone area .......................................................................................................................................... 47
19. Stewart Valley .......................................................................................................................................... 47
20. Tecopa/California Valley area.................................................................................................................. 48
21. Summary statistics data are simulated means of 1,000 realizations by discharge area for the Monte Carlo analysis used to simulate annual ground-water discharge......................................................... 48
22. Differences in the standard deviation of ground-water discharge estimates resulting from correlating similar evapotranspiration units in Ash Meadows ....................................................................... 48
CONVERSION FACTORS AND VERTICAL DATUM
Multiply By To obtain
acre 0.4047 square hectometer
acre-foot (acre-ft 0.001233 cubic hectometer
acre-foot per year (acre-ft/yr) 0.001233 cubic hectometer per year
cubic foot per day (ft3/d) 0.02832 cubic meter per day
cubic foot per second (ft3/s) 0.02832 cubic meter per second
foot (ft) 0.3048 meter
foot per second (ft/s) 0.3048 meter per second
foot per year (ft/yr 0.3048 meter per year
gallons per minute (gal/min) 0.0631 liter per secondinch (in.) 25.4 millimeter
mile (mi) 1.609 kilometer
square mile (mi2) 2.590 square kilometer
Temperature: Degrees Celsius (°C) can be converted to degrees Fahrenheit (°F) by using the formula °F � [1.8(°C)] � 32. Degrees Fahrenheit can be converted to degrees Celsius by using the formula °C � 0.556(°F-32).
Sea level: In this report, “sea level” refers to the National Geodetic Vertical Datum of 1929 (NGVD of 1929, formerly called “Sea-Level Datum of 1929”), which is derived from a general adjustment of the first-order leveling networks of the United States and Canada.
ACRONYMS
DVRFS Death Valley regional flow systemET EvapotranspirationMSAVI Modified soil-adjusted vegetation indexNTS Nevada Test SiteTM Thematic Mapper

ABSTRACT 1
ABSTRACT
The Death Valley regional flow system (DVRFS) is one of the larger ground-water flow systems in the southwestern United States and includes much of southern Nevada and the Death Valley region of eastern California. Centrally located within the ground-water flow system is the Nevada Test Site (NTS). The NTS, a large tract covering about 1,375 square miles, historically has been used for testing nuclear devices and currently is being studied as a potential repository for the long-term storage of high-level nuclear waste gen-erated in the United States. The U.S. Department of Energy, as mandated by Federal and State regula-tors, is evaluating the risk associated with contam-inants that have been or may be introduced into the subsurface as a consequence of any past or future activities at the NTS. Because subsurface contami-nants can be transported away from the NTS by ground water, components of the ground-water budget are of great interest. One such component is regional ground-water discharge.
Most of the ground water leaving the DVRFS is limited to local areas where geologic and hydrologic conditions force ground water upward toward the surface to discharge at springs and seeps. Available estimates of ground-water dis-charge are based primarily on early work done as part of regional reconnaissance studies. These early efforts covered large, geologically complex areas and often applied substantially different techniques to estimate ground-water discharge. This report
describes the results of a study that provides more consistent, accurate, and scientifically defensible measures of regional ground-water losses from each of the major discharge areas of the DVRFS.
Estimates of ground-water discharge pre-sented in this report are based on a rigorous quantification of local evapotranspiration (ET). The study identifies areas of ongoing ground-water ET, delineates different ET areas based on similar-ities in vegetation and soil-moisture conditions, and determines an ET rate for each delineated area. Each area, referred to as an ET unit, generally con-sists of one or more assemblages of local phreato-phytes or a unique moist soil environment. Ten ET units are identified throughout the DVRFS based on differences in spectral-reflectance characteris-tics. Spectral differences are determined from sat-ellite imagery acquired June 21, 1989, and June 13, 1992. The units identified include areas of open playa, moist bare soils, sparse to dense vegetation, and open water. ET rates estimated for each ET unit range from a few tenths of a foot per year for open playa to nearly 9 feet per year for open water.
Mean annual ET estimates are computed for each discharge area by summing estimates of annual ET from each ET unit within a discharge area. The estimate of annual ET from each ET unit is computed as the product of an ET unit’s acreage and estimated ET rate. Estimates of mean annual ET range from 450 acre-feet in the Franklin Well area to 30,000 acre-feet in Sarcobatus Flat. Ground- water discharge is estimated as annual ET minus that part of ET attributed to local precipitation
Ground-Water Discharge Determined from Estimates of Evapotranspiration, Death Valley Regional Flow System, Nevada and California
By Randell J. Laczniak, J. LaRue Smith, Peggy E. Elliott, Guy A. DeMeo, and Melissa A. Chatigny, U.S. Geological Survey; and Gaius J. Roemer, GeoTrans

Mean annual ground-water discharge estimatesrange from 350 acre-feet in the Franklin Well area to 18,000 acre-feet in Ash Meadows. Gene- rally, these estimates are greater for the northerndischarge areas (Sarcobatus Flat and Oasis Valley) and less for the southern discharge areas (Franklin Lake, Shoshone area, and Tecopa/ CaliforniaValley area) than those previously reported.
INTRODUCTION
The Death Valley regional flow system (DVRFS) as delineated by Harrill and others (1988, sheet 1) cov-ers an area of 15,800 mi2 of southern Nevada and south-eastern California. This ground-water flow system is west of Las Vegas, Nevada, and includes parts of Clark, Esmeralda, Lincoln, and Nye Counties, Nevada and Inyo and San Bernardino Counties, California. Death Valley, the largest valley within the flow system, forms the southwestern boundary of the flow system.
The DVRFS is centered about the Nevada Test Site (NTS) and Yucca Mountain. The NTS is fairly extensive at approximately 1,375 mi2 and serves as the primary continental location for testing nuclear devices. Yucca Mountain, which borders the NTS on the west, is the site for a potential high-level nuclear waste disposal facility. The U.S. Department of Energy is currently evaluating the risk to the general public associated with past testing activities and the future storage of high-level radioactive waste as required by Federal and State mandates. As part of this evaluation, studies are being done to develop ground-water flow and transport models of the region. The accuracy of these models and confidence given to their results are dependent on an understanding of the region’s geology and hydrology. Ground-water discharge is a major component of the hydrology controlling ground-water flow throughout the region.
Accurate estimates of ground-water discharge from the DVRFS are crucial to developing realistic simulations of ground-water flow and contaminant transport away from the NTS and Yucca Mountain. Although early reconnaissance studies completed in the 1960s and 1970s (Malmberg and Eakin, 1962; Walker and Eakin, 1963; Pistrang and Kunkel, 1964; Malmberg, 1967; Cardinalli and others, 1968; Rush, 1968; Winograd and Thordarson, 1975) provide general estimates of regional discharge from many
2 Ground-Water Discharge Determined from Estimates of Evapo
of the major valleys in the region, the methodologies and techniques applied often differed among the vari-ous investigations. More accurate and defensible esti-mates of regional ground-water discharge across the DVRFS require that a more thorough and consistent approach be applied to all major discharge areas within its boundaries.
The U.S. Geological Survey, in cooperation with the U.S. Department of Energy, began long-term studies to refine and improve estimates of mean annual ground-water discharge from the Ash Meadows (Laczniak and others, 1999) and Oasis Valley discharge areas (Reiner and others, 2002). In 1998, the U.S. Geological Survey, also in cooperation with the U.S. Department of Energy, initiated a 2-year effort to extend the knowledge gained and techniques developed during these investigations to estimate ground-water discharge from other major discharge areas throughout the DVRFS. The latter effort is the focus of this report.
Purpose and Scope
The purpose of the study was to reduce uncer-tainty in estimates of ground-water discharge from the DVRFS by refining existing estimates for most major discharge areas in the flow system (fig. 1). Discharge areas evaluated specifically for this study include Chicago Valley, the Franklin Well area, Franklin Lake, the Shoshone area, Stewart Valley, and the Tecopa/California Valley area in California and Sarcobatus Flat in Nevada (fig. 1). Estimates for Ash Meadows and Oasis Valley in Nevada, although studied and docu-mented independently as part of more detailed efforts (Laczniak and others, 1999; and Reiner and others, 2002, respectively), are included for completeness. For reasons given in a later section, estimates for other major discharge areas, namely Death Valley in Califor-nia and Pahrump and Lida Valleys in Nevada, are not given.
The report presents estimates of mean annual ground-water discharge and evapotranspiration, and describes the general procedure used to make the esti-mates. This effort resulted in many digital products that are available from the USGS node of the NationalSpatial Data Infrastructure (NSDI) at URL: <http:// nsdi.usgs.gov/>. These revised estimates of ground-water discharge can be used to improve general con-cepts of regional flow and as input to models simulating ground-water flow and transport, and should increase confidence in model-based risk assessments of past,
transpiration, Death Valley Regional Flow System
���� ������
� �� ����� ������
�� � ������
������� ������
�� �
������
���������
���
� ��������
��� ������
������
�������
�����
�����
��� �����
Nevada TestNevada TestSiteSite
Nevada TestSite
���� ���� ���� ����
�����������
�����������
Pahrum
p
Valley
Pahrum
p
Valley
����� ��������
����� ��������
Panamint Range
Death
Valley
Death
Valley
��������
!��
!��
!��
!��
Panamint Range Am
arg osa
River
Ama
rg osaR
iver
������
������
����
��� "�� #$�$ %��&�����& ��'�� (�����& (���) �*�++)+++)�,��-�,* #��'���& ����'��� ����� �.������ /��� ��$���(�( �&��" "�� �*0�+)+++1���&� 2�����& 3&�'����� �(�&$
��&��� ���
���� �����
� ����� '��� � ��( � �����
�� )���(�
� ����� ���
� ��*� �����
�� ��� �
+���,-���.� �� ����� �
��� ����� !��� �/�����
� , � �. �����%
Ground-Water Discharge Area
EXPLANATION
+ 4+ 5�3�
4+ �5�6 3�3��
0+
+ 0+
Am
argosa Desert
����������
����������Am
argosa Desert
0���)������
0���)������Amargosa
Range
Amargosa
Range
7��8&��9�&&���
7��8&��9�&&���
������
������
���� ��
:��
Death Valley Regional Flow System boundary�� �� � ��� �� �� � � !"#$$%
Figure 1. Major areas of natural ground-water discharge in Death Valley regional flow system.
INTRODUCTION 3

ongoing, or future activities at the NTS and Yucca Mountain site. To provide readers, and flow and trans-port modelers, with a quantification of the error associ-ated with these estimates, an uncertainty analysis is included as an appendix.
Acknowledgments
The authors express their appreciation to the U.S. Fish and Wildlife Service, the National Park Service, the Bureau of Land Management, and the many private landowners in the area that openly provided access to their property. The authors wish to thank S.R. Reiner for providing meteorological data and imagery from the Oasis Valley area. Author appreciation also is due to the U.S. Department of Energy for continued support given to this and other investigations of ground-water discharge throughout the Death Valley region.
StewardshIp
Much of the land in the Death Valley region is owned and administered by the U.S. Government (fig. 2). The primary stewards of these Federal lands are the National Park Service, U.S. Forest Service, Bureau of Land Management, U.S. Air Force, U.S. Department of Energy, and U.S. Fish and Wildlife Service. Much smaller parcels of privately owned land are concen-trated in a few agricultural areas, mining centers, and recreational gateways including Pahrump, Amargosa Farms, Amargosa Valley, and Beatty, Nevada, and Tecopa and Shoshone, California.
GENERAL DESCRIPTION AND SETTING
Physiography and Geology
The DVRFS lies within the southern Great Basin region, an internally drained subdivision of the Basin and Range physiographic province. The region is char-acterized by low rainfall, intermittent streams, large internal surface drainages, and sparsely distributed spring-fed oases. The dominant physiographic features are linear, north trending mountain ranges separating broad, elongated valleys, formed in response to a long and ongoing period of crustal extension (Stewart, 1980, p. 110). Large vertical displacements along faults offset bedrock blocks separating north-trending mountain ranges from similar trending alluvial-filled valleys. The
4 Ground-Water Discharge Determined from Estimates of Evapo
region includes several large, prominent valleys (Amargosa Desert, and Pahrump and Death Valleys; fig. 1) and major mountain ranges (Amargosa, Pana-mint, Kawich, and Sheep Ranges, and Spring Moun-tains; fig. 1).
Major mountain ranges rimming the larger valleys typically rise more than 5,000 ft above valley floors. Higher peaks typically crest at more than 8,000 ft above sea level. The highest peaks, reaching more than 11,000 ft above sea level, are found in the Spring Mountains and Panamint Range. One of the more striking elevation contrasts occurs in Death Valley where peaks in the Panamint Range rise as much as 11,000 ft above the valley floor. Valley floors are typified by a gently sloping terrain and range in altitude from about 200 ft below sea level in Death Valley to about 5,000 ft above sea level in the northernmost valleys.
Most of the major mountain ranges in the general region are composed of pre-Cenozoic rocks of diverse age and lithology (Stewart, 1980). Paleozoic carbonate rock and Paleozoic and Proterozoic siliciclastic rock, and Tertiary volcanic rock constitute the primary rock types of the hills, ridges, and mountain ranges. The intervening valleys are filled primarily with alluvium, lacustrine and palustrine deposits, and volcanic rock.
Climate
The climate of the DVRFS is arid in the south to semiarid in the north. The southern part of the flow sys-tem lies within the Mojave Desert, an area character-ized by short mild winters, long hot summers, and low annual rainfall and humidity. The northern part of the flow system lies within the Great Basin Desert, an area characterized by cold winters, warm summers, and low-to-moderate annual rainfall and humidity. The wide ranges in altitude and latitude over the DVRFS contribute to climatic conditions that vary dramatically on both seasonal and daily time scales. Temperatures, higher at lower altitudes and more southern latitudes of the DVRFS, range from winter lows below zero in mountainous areas to summer highs that exceed 120°F in Death Valley. In many valleys, the daily temperature range exceeds 30°F. Precipitation also ranges widely over the DVRFS and is dependent on altitude, latitude, and location relative to surrounding mountain peaks. Mean annual precipitation is lowest on the valley floors
transpiration, Death Valley Regional Flow System

���
���
���
���� ���� ���� ����
������
����
����
��� � �����
��� � ���
��� �
�� �� ��
� � ��
�����
�����
�� ����
�� � �����
��� ��������� �����
����� �����
������� �����
����� �����
������� �����
� � �����
�����
�����
� ������
���
�����������
! "#�$�
! %#�&"$�$'�
(
(
EXPLANATION
Toiyabe National Forest
Nellis Air Force Range
Death Valley National Park
Ash Meadows National Wildlife Refuge Desert National Wildlife Range
Yucca Mountain Control Area
Nevada Test Site
Death Valley Regional Flow System boundary���� ������� ��� �� ��� !"#$$%
��� )� *+�+ ,� � �-�� ���.�� /-�-�� /�0 �1� 0 0�2��3�21 *�-.���� ����.���� "���� � �� 4���- � 5 �� ��
Figure 2. Major areas of Federally administered land in Death Valley regional flow system.
GENERAL DESCRIPTION AND SETTING 5

at the more southern latitudes and ranges from less than 2 in. in Death Valley to more than 25 in. in the Spring Mountains (Daly and others, 1994).
Vegetation and Wildlife
A great diversity of plants, fish, and local wildlife are found throughout the area. Much of the biota relies on water originating from mountain runoff and from mountain and valley springs scattered about the area for survival. Spring pools and their associated drainages and wetlands provide habitat for numerous species of endemic and rare fish, aquatic insects, and plants. Ash Meadows, a major ground-water discharge area (fig. 1), has the highest concentration of endemic species in the continental United States (Chaplin and others, 2000, p. 198). A notable example of one of these endemic species is the endangered Devils Hole pupfish (Cyprinodon diabolis) whose only natural habitat is limited to a small ground-water pool known as Devils Hole in Ash Meadows. Other prominent species preva-lent throughout the area are the Desert Bighorn Sheep (Ovis canadensis) and the Desert Tortoise (Gopherus agassizii).
Vegetation throughout the area is diverse and exhibits a strong dependence on climate, water avail-ability, and soil chemistry. More dense growths are con-centrated near springs, on poorly drained bottomland, and at higher altitudes in the major mountain ranges. This vegetation provides food and shelter to numerous birds, insects, reptiles, and small mammals. Although the area is characterized as desert, plant assemblages and species are numerous and include many varieties of grasses, reeds, shrubs, and trees. Vegetation supported by local springflow includes groves of ash, cottonwood, willow, and mesquite; thick stands of saltcedar; expan-sive meadows of salt, wire, and bunch grasses; and open marshland of cattails, reeds, and bulrush. Exten-sive stands of phreatophytic shrubs, including grease-wood, rabbitbrush, seepweed, seep willow, and wolfberry, are found in many valley lowlands. Upland areas beyond the influence of local drainages support more classic desert flora including sparse covers of healthy creosote bush, saltbush, and desert holly. Mountainous areas and highlands are dominated by sparse to dense woodlands that primarily include juni-per, piñon pine, and various species of conifer.
6 Ground-Water Discharge Determined from Estimates of Evapo
Drainage
The area occupied by the DVRFS is drainedinternally with Death Valley serving as the terminal drainage of the flow system. Drainage features consist primarily of intermittent streams fed by spring snow-melt or infrequent, major storms. Only a few short reaches, located downgradient of major springs, flow year round. Perennial flows are greatest in winter, when cooler temperatures and dormant vegetation result in reduced ET rates. Many of the individual intermountain basins are themselves internally drained with only a few having any surface outlet. The Amargosa River, the largest and most continuous drainage within the flow system, drains about 5,800 mi2 and is the only major drainage into Death Valley originating outside the valley proper (fig. 1).
A total of 27 hydrographic areas1 (fig. 3) are recognized within the DVRFS. Hydrographic areas are delineated primarily from topography and geologic structures, and generally correspond to major surface drainages. These areas serve as the basic units used by State and local agencies for water-resources planning, and in combination, form the regional flow systems delineated throughout the area (Harrill and others, 1988).
Hydrogeology
Ground water in the DVRFS passes through a diverse assemblage of rocks. These rocks differ sub-stantially in terms of age, composition, and water-trans-mitting properties. The northwestern part of the flow system is predominantly volcanic rock, the eastern and southern parts are predominantly carbonate and silici-clastic rocks, and most major valleys are filled with unconsolidated deposits derived from the surrounding highlands (Laczniak and others, 1996, fig. 4).
Ground water originates from precipitation falling on the higher mountain ranges and mesas in the northern and eastern parts of the region (Winograd
1 Formal hydrographic areas in Nevada were delineated sys-tematically by the U.S. Geological Survey and Nevada Division of Water Resources in the late 1960’s (Rush, 1968; Cardinalli and others, 1968) for scientific and administrative purposes. The offi-cial hydrographic-area names, numbers, and geographic bound-aries continue to be used in U.S. Geological Survey scientific reports and Nevada Division of Water Resources administrative activities.
transpiration, Death Valley Regional Flow System

144 Lida Valley145 Stonewall Flat146 Sarcobatus Flat147 Gold Flat148 Cactus Flat157 Kawich Valley158 Emigrant Valley A. Groom Lake Valley B. Papoose Lake Valley159 Yucca Flat160 Frenchman Flat161 Indian Springs Valley162 Pahrump Valley168 Three Lakes Valley (Northern Part)169 Tikaboo Valley A. Northern Part B. Southern Part173 Railroad Valley A. Southern Part211 Three Lakes Valley (Southern Part)225 Mercury Valley226 Rock Valley227 Fortymile Canyon A. Jackass Flats B. Buckboard Mesa228 Oasis Valley229 Crater Flat230 Amargosa Desert240 Chicago Valley241 California Valley242 Lower Amargosa Valley243 Death Valley244 Valjean Valley245 Shadow Valley
Hydrographic Area
173A
148
147
145
157144
169A158A
146
243
228
169B
227B 159 158B
168
160
161
227A229
230
226
211225
162
242240
241
244
245
173A
148
147
145
157144
169A158A
146
243
228
169B
227B 159 158B
168
160
161
227A229
230
226
211225
162
242240
241
244
245
EXPLANATION
Tecopa
Tonopah
Pahrump
Beatty
Las Vegas
36°
37°
38°
118° 117° 116° 115°
35°
Ground-water discharge area
NEVADA
CALIFORNIA
San Bernadino Co
Clark CoLincoln Co
Lincoln Co
Clark C
o
Nye C
o
Esm
eralda Co
Nye Co
Inyo Co
0
0
40 MILES
40 KILOMETERS
20
20
Base from U.S. Geological Survey digital data, 1:100,000,1978–89: Universal Transverse Mercator Projection Zone 11.Shaded relief from 1:250,000-scale Digital Elevation Model
Hydrographic area boundary—Label shows hydrographic area number. See table on right for hydrographic area name. Modified from Cardinalli and others (1968), Rush (1968), and Harrill and others (1988)
Death Valley Regional Flow System Boundary—From Harrill and others (1988)
Nevada Test Site boundary
Figure 3. Hydrographic areas of Death Valley regional flow system.
GENERAL DESCRIPTION AND SETTING 7

and Thordarson, 1975; Waddell and others, 1984; Laczniak and others, 1996; Harrill and Prudic, 1998). Regional flow generally is southward and westward away from the major recharge areas toward Death Valley and other intermediate areas of ground-water discharge (fig. 1). Ground water flows primarily through faults, fractures, and joints in consolidated rock, and through the coarser grained sand and gravel deposits in unconsolidated sediment. Beneath the major valleys, ground water flows primarily through unconsolidated valley-fill deposits and, where present, through underlying fractured and faulted volcanic and carbonate rocks. Beneath highland areas, ground-water flows through fractured and faulted volcanic and car-bonate rock. Low permeability siliciclastic (quartzite and siltsone) and crystalline rocks, fine-grained valley-fill deposits (clay), and non-fractured volcanic rock form the major confining units of the flow system. Total ground-water flow is estimated at about 70,000 acre-ft/yr with the largest proportion moving through highly transmissive, fractured and faulted carbonate rock in the eastern and southern parts of the flow system (Winograd and Pearson, 1976; Harrill and others, 1988, sheet 2; Dettinger and others, 1995).
Ground-water flow rates and directions are influ-enced by abrupt changes in the water-transmitting properties of the rocks. Tectonic movements along major faults often juxtapose rocks of differing perme-ability and can intensely fracture the nearby host rock. Permeability contrasts caused by these faults and other lithologic controls create local pathways by which some ground water exits the regional flow system and discharges to land surface. Ground water, some of which originates at or flows beneath the NTS and Yucca Mountain area, emerges as seeps and springs in the alluvium, and as springs in fractured and faulted volcanic and carbonate rock. Most local springflow evaporates or is transpired by the local vegetation. Springflow, while relatively constant throughout recent history (Tim Mayer, U.S. Fish and Wildlife Service, written commun., 1997), varies substantially across the flow system. Measured springflow ranges from less than 1 gal/min at numerous small springs scattered about the area to nearly 3,000 gal/min at the largest spring in Ash Meadows (fig. 1). Ground water not discharged to the surface, exits the discharge area and continues flowing down gradient toward the next area of discharge. This underflow differs from area to area and can be a major component of the water budget.
8 Ground-Water Discharge Determined from Estimates of Evapo
The few communities, Federal facilities, and agricultural, mining, ranching, and recreational inter-ests within the area of the DVRFS rely almost entirely on ground water for their water supply. A large part of this need is fulfilled by spring-flow diversions, but the demands of larger users and those more distant from springs are met by pumping ground water. Most wells produce water from valley-fill deposits, but some larger supply wells produce from fractured and faulted car-bonate and volcanic rock. The withdrawal of ground water from much of the area is limited by Federal man-dates instituted to protect rare and endangered species dependent for their survival on regional springflow in Ash Meadows and Death Valley.
ESTIMATION OF ANNUAL EVAPOTRANSPIRATION AND GROUND-WATER DISCHARGE
Historically, estimates of evapotranspiration in the DVRFS were computed as part of regional assess-ments of the ground-water resource (Malmberg and Eakin, 1962; Walker and Eakin, 1963; Pistrang and Kunkel, 1964; Malmberg, 1967; Rush, 1968). These regional assessments estimated annual ET losses as the product of the acreage of phreatophytes within a dis-charge area and an annual ET rate representative of the vegetation and soil conditions of the discharge area. Acreages were estimated by delineating vegetation from aerial photographs and field mapping. Annual ET rates typically were estimated from values reported for similar plant assemblages found throughout the west-ern United States (Lee, 1912; White, 1932; Young and Blaney, 1942; Gatewood and others, 1950; Robinson, 1958). Most of these rates were determined from tank experiments as described by Gatewood and others (1950, p. 105–111). Although the methodology is tech-nically sound, its overall accuracy depends on the accu-racy of the individual components. Inexact estimates of the acreage, the annual ET rate, or both could intro-duce substantial error into the calculation. Recent stud-ies of ET rates for vegetation and soil conditions in and near the DVRFS (Johnson, 1993; Czarnecki, 1997; Laczniak and others, 1999; Nichols, 2001) indicate rates somewhat different than those presented in earlier reconnaissance studies. These more recent estimates of ET rates were determined primarily from energy-bal-ance techniques (Brutsaert, 1982) that require rigorous and long-term measurements of micrometeorological
transpiration, Death Valley Regional Flow System
data. Noted differences between early and more recent measurements of ET rates are expected considering dif-ferences in the local climatic, vegetation, and soil con-ditions between sites and differences in the methods used to measure ET.
Most previous attempts to quantify ground-water discharge from the DVRFS have been based on mea-surements of springflow or on estimates of ET from the major discharge areas (Malmberg and Eakin, 1962; Walker and Eakin, 1963; Pistrang and Kunkel, 1964; Malmberg, 1967; Rush, 1968, Dudley and Larson, 1976). In discharge areas where seeps are dominant or where springs are difficult to measure, estimates of ground-water discharge account only for measurable outflow. Alternatively, ground-water discharge has been estimated by efforts to quantify local ET. Assum-ing that all spring and seep flow is evaporated or tran-spired by the local vegetation, ET-based estimates also include water upwardly diffused into the shallow flow system from the underlying regional flow system.
The need for accurate estimates of ground-water discharge and the differences in ET rates estimated by past and more recent studies prompted studies to re-evaluate and more rigorously and consistently quantify mean annual ET and ground-water discharge through-out the DVRFS. The approach used in this study is sim-ilar to that used in the early reconnaissance studies in that ET is calculated as the product of an area and a rate. Although the approach is similar, the specific tech-niques used to delineate ET areas and to determine an appropriate ET rate differ in that they take advantage of modern technologies and are applied consistently over the DVRFS. Because these techniques are expected to reduce errors, the revised ET estimates should be more reliable. Early reconnaissance studies delineated ET areas based on generalized vegetation and soil map-ping—this study utilizes satellite imagery in combina-tion with remote sensing and a geographic information system. The reconnaissance studies estimated ET rates based on measurements made for similar phreatophytes found at locations outside the study area—this study relies primarily on recent estimates determined from micrometeorological measurements made in areas within or adjacent to the study area (Johnson, 1993; Czarnecki, 1997; Laczniak and others, 1999, and Nichols, 2001; and Reiner and others, 2002). Another difference between the two approaches is in the calcu-lation of ground-water discharge. The reconnaissance studies assume that ground-water discharge is equiva-lent to ET; this study, however, estimates discharge by
ESTIMATION OF ANNU
reducing the ET rate to account for any local precipita-tion falling on the area. This reduction to the ET rate generally is small considering the aridity of the area.
ET and ground-water discharge estimates com-puted in this study account only for ground water lost to the atmosphere. Estimates do not account for ground water pumped from the flow system or for ground water exiting the discharge area as underflow. Pres-ently, ground water consumed to support agricultural, domestic, and operational needs is minimal and probably does not exceed more than a few hundred acre-feet per year in any major discharge area other than in Pahrump and Lida Valleys. In Pahrump Valley, about 30,000 acre-ft of ground water was pumped for municipal and domestic supply and irrigation in 1997 (Division of Water Resources, State of Nevada, written commun., 1999). In Lida Valley ground water used for irrigation is less than a few hundred acre-feet per year but accounts for a significant portion of the ground water discharged from that area. Because the focus of this study is on natural ground-water discharge, and the difficulty associated with separating transpiration by natural vegetation from that of irrigated crops, ET and ground-water discharge estimates for Pahrump and Lida Valleys are not included in this report.
Annual ET is estimated for Chicago Valley, the Franklin Well area, Franklin Lake, Sarcobatus Flat, the Shoshone area, Stewart Valley, and the Tecopa/Califor-nia Valley area (fig. 1). Also included in this report are estimates for Ash Meadows and Oasis Valley, which were studied primarily as part of previous efforts (Laczniak and other, 1999; and Reiner and others, 2002, respectively). Although Death Valley is an area of substantial natural ground-water discharge, it is not included because evapotranspiration rates for salt-encrusted playas are unavailable. Evapotranspi-ration rates in Death Valley are being studied by the U.S. Geological Survey in cooperation with the National Park Service as part of an ongoing study. Ground water removed by processes other than ET from the major discharge areas included in this report is assumed to account for less than a few percent of the total discharge.
Evapotranspiration
ET is a process by which water from the Earth’s (or a plant’s) surface is transferred to the atmosphere. Estimates of mean annual ET were determined using the procedure established during recent studies of
AL EVAPOTRANSPIRATION AND GROUND-WATER DISCHARGE 9

Ash Meadows (Laczniak and others, 1999) and Oasis Valley (Reiner and others, 2002). The underlying assumption of this procedure is that ET rates vary with the health, density, and type of the vegetation and the wetness of the soil. The procedure assumes ET rates within a discharge area can be generalized on the basis of similarities in vegetation and soil conditions. Areas of similar vegetation and soil conditions are referred to in this report as ET units. The procedure computes annual ET from each ET unit within a discharge area and sums these values to estimate the total annual ET from the discharge area. Annual ET estimates for each ET unit are computed by multiplying the acreage of the unit by an appropriate ET rate for the unit’s vegetation and soil conditions. Acreage was determined through a combination of field mapping and satellite imagery analyzed using remote-sensing techniques. ET rates were estimated primarily from data collected at micrometeorological stations established in different vegetation and soil assemblages found throughout Ash Meadows (Laczniak and others, 1999) and Oasis Valley (Reiner and others, 2002), and supplemented with val-ues reported in Young and Blaney (1942), Walker and Eakin (1963), Weeks and others (1987), Johnson (1993), Nichols (1993), Czarnecki (1997), DeMeo and others (1999), and Nichols (2001).
Evapotranspiration Units
Past studies have shown that ET rates throughout the Great Basin region vary with vegetation and soil conditions. In general, the more dense and healthy the vegetation and the wetter the soil, the greater the rateof ET (Ustin, 1992; Nichols, 2001). Vegetation, water, and soil covers reflect incoming solar radiation differ-ently. These differences have been used to determine type, density, and health of vegetation, and type and moisture content of soil from aerial and satellite imag-ery (Anderson and others, 1976, p. 2; American Society of Photogrammetry, 1983, p. 23–25; Goetz and others, 1983, p. 576–581). This process is referred to as a land-cover classification. The procedure used in this study takes advantage of (1) the relation between ET, and vegetation and soil conditions, and (2) differences in the spectral reflectance of the different vegetation and soil covers to map distinct ET units within the major discharge areas of the DVRFS, and hereafter is referred to as an ET-unit classification.
10 Ground-Water Discharge Determined from Estimates of Evapo
Thematic Mapper (TM) imagery was the source of the spectral data used to classify ET units. Earth-orbiting satellites equipped with sensors to detect solar-reflected and earth-emitted radiation acquire TM imag-ery. TM satellites collect spectral information across seven wavelength bands referred to as TM channels (fig. 4). Each channel spans a discrete part of the elec-tromagnetic spectrum. Six of the channels (1, 2, 3, 4, 5, and 7) measure reflected radiation in the visible, near infrared, and short-wave infrared regions. These six channels were used in this study to define the spectral character or response of an area imaged by the satellite. A seventh band, TM channel 6, measures thermal energy radiated from the Earth and was not used in this study. Spectral reflectance, as acquired by TM sensors, represents an average value over an area measuring about 100 ft by 100 ft. Each square area is referred to as a pixel (picture element) and defines the spatial res-olution of the imagery. Differences in the spectral response of land covers having different vegetation, soil, and moisture conditions are shown in figure 4A.
Figure 4B shows these same spectral responses as would be inferred from TM imagery. The TM imagery used to classify all discharge areas, except Sarcobatus Flat, was acquired June 13, 1992. The decision to use June 1992 imagery was based on (1) June typically being a period of high vegetation vigor, and (2) 1992 having slightly above normal in terms of precipitation. Two TM scenes (entity-id number LT5040034009216510 and LT5040035009216510) were required for complete coverage of the area of interest. A pseudo-color infrared composite of the combined TM imagery is shown in figure 5. Excessive cloud cover in the June 13, 1992, imagery precluded accurate classification of ET units in the Sarcobatus Flat area. Instead, the Sarcobatus Flat area was classified from imagery acquired June 21, 1989 (LT5040034008917210). One major difference between the procedure used here and that used by Laczniak and others (1999) for the Ash Meadows area was in the number of dates used for the classification process. Here only June imagery was used to classify ET units, whereas, Laczniak and others used both imagery from June and September 1999. The June imagery represented conditions of near maximum plant vigor and high moisture, whereas the September imagery represented conditions of high plant stress (dormancy) and low moisture. Based on the Ash
transpiration, Death Valley Regional Flow System

0.3 0.5 0.7 0.9 1.1 1.3 1.5 1.7 1.9 2.1 2.3 2.50
10
20
30
40
50
60
70
80
RE
FLE
CTA
NC
E, I
N P
ER
CE
NT
4 5 7 1 2 3
Atm
osp
her
ic w
ater
ab
sorp
tio
n
Atm
osp
her
ic w
ater
ab
sorp
tio
n
TM Channel
VISIBLENEAR
INFRARED SHORT WAVE INFRAREDELECTROMAGNETICSPECTRAL REGIONS
WAVE LENGTH, IN MICROMETERS
1 2 3 4 5 7
THEMATIC MAPPER (TM) CHANNEL NUMBER
0
10
20
30
40
50
60
70
80
RE
FLE
CTA
NC
E, I
N P
ER
CE
NT
B
A
Corn leaves with greater than 66 percent moisture content—From Hoffer and Johannsen (1969)
Corn leaves with 44 to 45 percent moisture content—From Hoffer and Johannsen (1969)
Segal (1983)Soil—From Podwysocki and
Sage—From Milton (1978)
Rock—From Podwysocki and Segal (1983)
Playa—Modified from Crowley (1986)
Spectral ResponseEXPLANATION
Pinon Pine—From Milton (1978)~
Water—Modifed from Lillesand and Kiefer (1987)
Figure 4. Spectral response of land covers having different vegetation, soil, and moisture conditions.
ESTIMATION OF ANNUAL EVAPOTRANSPIRATION AND GROUND-WATER DISCHARGE 11

.
Meadows results, a single-date classification was assumed adequate for the discharge areas being evalu-ated.
The procedure used to classify ET units applied an unsupervised approach (Avery and Berlin, 1992, p. 452) to identify the unique spectral responses present within the TM imagery. Uniqueness of the spectral response was based on statistical differences between reflectance values in TM channels 1, 2, 3, 4, 5, and 7 of the imaged pixels falling within the boundaries of the major discharge areas (fig. 1). Boundaries initially were located using a raster image representing a modified soil adjusted vegetation index (Qi and others, 1994) developed from June 13, 1992, TM imagery. Bound-aries were refined continually on the basis of informa-tion acquired during numerous field visits. The use of boundaries reduced the area within the TM image that needed to be classified to that of the major discharge areas. Final boundary locations are available in digital format from the USGS node of NSDI at URL: <http://water.usgs.gov/lookup/getspatial?darea>.
Each pixel was assigned a unique spectral re-sponse using the maximum likelihood classification technique (Lillesand and Kiefer, 1987, p. 685–689). This technique compares reflectance values of each pixel with the statistics defining each unique spectral response, calculates the statistical probability of a pixel being associated with each unique spectral response, and assigns each pixel to the unique response having the highest probability.
The classification process then reduces the num-ber of unique spectral responses by grouping them on the basis of similarities in their reflectance statistics. Each group typically represents a unique land cover. Groupings were further lumped into clusters on the basis of similarities in vegetation and soil conditions. The consolidation process was an interactive procedure that involved comparing similarities in the spectral response with information gathered in the field. The process continued until a manageable number of clus-ters remained whereby each represented a distinct ET unit. This process ultimately resulted in 10 clusters, each representing a unique area of significant ground-water ET typified by a land cover dominated by open water, phreatophytes, or moist bare soil (table 1; fig. 6). An eleventh cluster included all spectral responses representing areas of insignificant ground-water ET typified by land covers dominated by sparse upland desert vegetation and xeric landscape. Each cluster was given a number from 0 to 10 (table 1; fig. 6).
12 Ground-Water Discharge Determined from Estimates of Evapo
Most spectral responses included within a cluster exhibit a characteristic shape (fig. 6). The two excep-tions are clusters 4 (dense meadow and forested vege-tation) and 7 (moist bare soil). Each of these clusters is defined by spectral responses exhibiting multiple char-acteristic shapes. The multiple patterns within each of these clusters are explained by the inclusion of more than one vegetation or soil type within the cluster. For example, cluster 4 includes dense meadow and forested vegetation, each of which exhibits a different spectral response. The two spectral responses are combined into one cluster because ET rates between the vegetation types are assumed to be similar.
The final step in the classification procedure is to assign an ET unit to each pixel. Pixels outside the boundary of a major discharge area were assigned a value of zero (an area of insignificant ground-water ET). Pixels within discharge areas were assigned a value of 1 through 10 to represent their associated cluster. This process created a raster image whereby each pixel within the image was associated with a single ET unit. The image was resampled at a finer resolution (60 ft by 60 ft) to allow for direct comparison with results presented for Ash Meadows (Laczniak and others, 1999) and Oasis Valley (Reiner and others, 2002). The resampled image was then smoothed using a filter, which replaced spuriously classified pixels (areas defined by less than three adjacent pixels) in the image and filled single-pixel gaps by assigning the pixel to the ET unit most representative of its neighbors.
The spatial distribution of ET units as classified by the above procedure was mapped for each major discharge area (figs. 7–15). The classification shown for Ash Meadows (fig. 7) is that given by Laczniak and others (1999) with the addition of one ET unit to repre-sent open playa. Open playa was added to maintain consistency with other mapped discharge areas. Raster data sets representing the final classification of each dis- charge area are available from the USGS node of NSDI at URL: <http://water.usgs.gov/lookup/getspatial?etunit>The acreage of each ET unit and the total ET-unit acreageare given for each discharge area in table 2.
The discharge area having the largest ET unit acreage is Sarcobatus Flat at 34,250 acres (table 2; fig. 12). Of this total, the majority is classified as sparse to moderately dense shrubs at 19,372 acres or open playa at 10,817 acres (tables 1 and 2). The dominant phreatophyte found in the shrubland area of Sarcobatus Flat is greasewood (Sarcobatus vermiculatus). The
transpiration, Death Valley Regional Flow System

Table 1. Evapotransregional flow system
[Sources for depth to watJune 1999) and Laczniak
ET-unitxnumber 1
1 Integer value assi2 Vegetation cover
than 75 percent.
Area of ngreater th
Area of o
Area of spart of o
Area domtypically
Area domor mixedtable typ
Area domand/or shless than
Area domincludes feet to ab
Area domwater tabmaximum
Area domrabbitbrubelow la
Area domranges fr
Area domranges frperiods a
2
3
4
5
6
7
8
9
10
2
3
4
5
6
7
8
9
10
0
11
piration (ET) units identified and classified in major discharge areas of Death Valley , Nevada and California
er information given in description: U.S. Geological Survey National Water Information System (accessed and others (1999)]
gned to each grid cell to identify ET unit. Numbers are color coded to match ET unit as mapped in figures 7–15.
ET-unit description 2
descriptors: very sparse, less than 5 percent; sparse, 5 to 20 percent; moderate, 20 to 75 percent; and dense, greater
o significant ET from ground-water source (unclassified); water table typically an 50 feet below land surface.
pen water, primarily reservoir or large spring pool.
ubmerged aquatic vegetation; includes sparse emergent vegetation and shallow pen water areas; perennially flooded; water at surface.
inated by dense wetland vegetation, primarily tall reedy and rushy marsh plants, tule, cattail, or giant reed; perennially flooded; water at surface.
inated by dense meadow and forested vegetation, primarily trees, meadow grasses, trees, shrubs, and grasses; trees include saltcedar, mesquite, or desert willow; water ically ranges from a few feet to about 20 feet below land surface; soil moist to dry.
inated by dense to moderately dense grassland vegetation, primarily saltgrass, ort rushes with an occasional tree or shrub; intermittently flooded; water table typically 5 feet below land surface; soil wet to moist.
inated by sparse grassland vegetation, primarily salt and bunch grasses but also areas of very low density shrubs (mesquite); water table typically ranges from a few out 12 feet below land surface; soil dry.
inated by moist bare soil; vegetation very sparse, primarily grasses; intermittently flooded, le typically near land surface throughout most of the year but in some areas declines to a depth of about 5 feet below land surface during late summer and early fall; soil typically moist.
inated by sparse to moderately dense shrubland vegetation, primarily greasewood, sh, wolfberry, and seepweed; water table typically ranges from about 5 feet to about 20 feet
nd surface; soil dry.
inated by sparse woodland vegetation, primarily mesquite; water table typically om about 10 to 40 feet below land surface; soil dry.
inated by open playa, primarily bare soil, often encrusted with salts; water table om about 5 to 40 feet below land surface; soil typically dry but can be moist for short fter intermittent flooding.
ESTIMATION OF ANNUAL EVAPOTRANSPIRATION AND GROUND-WATER DISCHARGE 13

14 Ground-Wa
������
�������
����� �� �����
���
���
���
���� ���� ���� ����
���
������
�����
������
����
����
�� � �����
��� ��������� �����
����� �����
������� �����
�����
�����
�� � �����
��� ��������� �����
����� �����
������� �����
�����
�����
� ������
���
�����������
� � �����
�
�
�� �� ��
�� �� ����!�
"�
"�
#��� $�� %&�& '��(��)��( ��*�+ ,)�)-�( ,�-�. �/���.���.�0��1�0/ %�)*���( ����*��� ����-� �2��-)�� 3��� ��
Death Valley Regional Flow System boundary����
������� ��� �� ��� !"#$$%
Ground-water discharge areaEXPLANATION
4�*�,� ���-
�)-�
4�*�,� ���-
�)-�
Figure 5. Pseudo-color infrared false color composite of Death Valley regional flow system.
ter Discharge Determined from Estimates of Evapotranspiration, Death Valley Regional Flow System
ES
TIM
AT
ION
OF
AN
NU
AL
EV
AP
OT
RA
NS
PIR
AT
ION
AN
D G
RO
UN
D-W
AT
ER
DIS
CH
AR
GE
15
Figure 6. Spectral clusters used to classify evapotranspiration units in discharge areas of Dea regional flow system.
ET Unit 1Open water
ET Unit 6Sparse grassland
vegetation
ET Unit 2Submerged aquatic
vegetation
RE
FLE
CTA
NC
E, I
N P
ER
CE
NT
ET Unit 7Moist bare soil
ET Unit 3Dense wetland
vegetation
ET Unit 8Sparse to moderately
dense shrublandvegetation
EDens ow
and ed ve n
ESpars land
ve n
ET Unit 5Dense to moderately
dense grassland vegetation
ET Unit 10Open playa
1 2 3 4 5 7
1 2 3 4 5 7 1 2 3 4 5 7 1 2 3 4 5 7 1 2 3 7 1 2 3 4 5 7
1 2 3 4 5 7 1 2 3 4 5 7 1 2 3 7 1 2 3 4 5 7
0
20
40
60
0
20
40
60
THEMATIC MAPPER (TM) CHANNEL NUMBER
th Valley
T Unit 4e mead forestgetatio
T Unit 9e woodgetatio
4 5
4 5

discharge area having the next largest acreage is Ash Meadows at 12,467 acres (table 2; fig. 7). This area is about 2,100 acres greater than that given by Laczniak and others (1999, table 10). This difference results from a slightly different interpretation of the Ash Meadows boundary and the inclusion of 2,241 acres of open playa as an ET unit. The largest ET unit classified within Ash Meadows is sparse grassland vegetation at 7,059 acres (tables 1 and 2). This grassland vegetation is dominated by expansive meadows of saltgrass (Distichlis spicata var. stricata). The area for sparse grassland vegetation and moist bare soil is about 150 acres less than that reported in Laczniak and others (1999, table 10). This area was not overlooked but is instead included in the adjacent Franklin Lake discharge area (figs. 1 and 10). Together these two disparities account for the differ-ence in total acreage between the two reports. The dis-charge area having the smallest total acreage is the Franklin Well area at 297 acres (table 2; fig. 9). This discharge area is a narrow crescent shape that spans only about a 5-mi section of the Amargosa River along the Nevada–California border (fig. 1).
Evapotranspiration Rate and Volume Estimates
The rate at which water is evaporated and tran-spired is defined as the ET rate. The ET rate is a func-tion of the vegetation, soil, soil moisture conditions, and micrometeorological factors. Because project timelines did not allow the opportunity to quantify
16 Ground-Water Discharge Determined from Estimates of Evapo
ET rates for each of the identified ET units, ET rates instead were estimated from those given in other studies of the general area.
The primary sources of ET rates were from recent studies of Ash Meadows (Laczniak and others, 1999, table 7) and Oasis Valley (Reiner and others, 2002). As part of these two studies, 15 sites were instrumented to collect micrometeorological data (table 3; figs. 7 and 11). These data were used to quantify ET rates for most of the ET units found within the discharge areas of interest. Daily ET rates were computed using the Bowen ratio solution of the energy-budget equation (Bowen, 1926). ET sites were instrumented from 1 to 3 years, and annual ET rates were determined from the data collected.
ET rates for each ET unit are presented as ranges in table 4. The range given for each ET unit is inclusive of all ET rates computed for Ash Meadows (Laczniak and others, 1999) and Oasis Valley (Reiner and others, 2002), and of rates estimated in other selected studies of ET throughout the general area. Data sources and the relative significance of each source used to construct the range are listed in table 4. The range includes ET rates computed for different sites during different years. The highest annual rate is near 9 ft for open water and submerged aquatic vegetation. The lowest annual rate is less than 1 ft for open playa. The difference between the minimum and maximum values varies among ET units, ranging from 0.4 ft/yr for open water and sub-merged aquatic vegetation to 1.8 ft/yr for sparse to
Table 2. Acreage of evapotranspiration (ET) units by major discharge area in Death Valley regional flow system, Nevada and California
Major discharge area 1
1 Discharge areas are shown in figure 1.
ET-unit number 2
2 ET unit is described in table 1 and mapped in figures 7–15.
1 2 3 4 5 6 7 8 9 10 Total
Ash Meadows 158 81 385 490 1,499 7,059 554 0 0 2,241 12,467
Chicago Valley 0 0 1 0 11 0 3 0 596 1 612
Franklin Lake 0 0 0 0 9 550 148 136 0 1,488 2,331
Franklin Well area 0 0 0 13 15 0 1 0 268 0 297
Oasis Valley 1 5 40 931 645 962 81 807 0 1 3,473
Sarcobatus Flat 0 0 0 0 0 2,611 1,450 19,372 0 10,817 34,250
Shoshone area 0 1 12 62 344 659 152 22 136 0 1,388
Stewart Valley 0 1 0 22 18 49 87 9 382 2,443 3,011
Tecopa/California Valley area 2 12 16 655 379 396 894 45 1,106 8 3,513
transpiration, Death Valley Regional Flow System

���� ��� ���� ��� �������
�� ��� ���� ��������� ������ ������ ��� ����������� !"#" � �$������ %�$������ &������ '��(�����$ )�$� ��
BigSpring
*�� *��
*�� ���
*�� ���
�
�
* &+,-�
* .+,/&-%-0�
� �
� �
ET Unit [area in acres]
���� ���� �� �
�������� ������� ���������� ��
����� ������� ���������� � ��
����� ������ ��� �������
���������� � !�
����� �� ��������" �����
�������� ���������� �#� �
����� �������� ���������� $#!� �
%���� ��� ���� ����
���� ���"� &#&���
RoadET Site
EXPLANATION
SpringPlaya
'()*�*
+*,-.�
/'-*
1����� 2��1����� 2��
Crystal Pool
Fairbanks Spring
Point of Rocks Spring
Crystal Pool
Fairbanks Spring
Point of Rocks Spring
Car
son
Slo
ugh
Car
son
Slo
ugh
Figure 7. Classification of evapotranspiration (ET) units in Ash Meadows, Nevada and California.
ESTIMATION OF ANNUAL EVAPOTRANSPIRATION AND GROUND-WATER DISCHARGE 17

18 Ground-W
���� ��� ��� ��������� ������ ������� ����� ������������������ �������� ��������� !������� "��#������ $��� ��
��%& ��'
()& )�' (�*
(%&
(%& �+' (�*
��%& ��' (�*
�
�
+ !,-.�
+ /,-0!. .1�
�
�
ET Unit [area in acres]����� ����� ������ �� ���
����� �� �������� ����
������ ������ �� ����
����� ����� ������ ��
�����
�� �� ��� �� � ���
���� ��� ���
EXPLANATION
ET-area boundary
Road
Figure 8. Classification of evapotranspiration (ET) units in Chicago Valley, California.
ater Discharge Determined from Estimates of Evapotranspiration, Death Valley Regional Flow System

a.
���� ��� ��� ��������� ������ ������� ����� ������������������ �������� ��������� !������� "��#������ $��� ��
��%& '() ��%& '') *�+ ��%& '�)
36° 20'
*%& ��) *�+
*%& �()
�
�
' !,-.�
' /,-0!. .1�
�
�
ET Unit [area in acres]����� �� ������� ����
������� ���������� ���
����� ������� ���������� �����
����� ��� ���� �����
���� ��� � �������
EXPLANATION
����� �� ������� ����
�� ���� ���������� ��!"�
ET-area boundary
Road
Playa
#$%&�&
'&()*�
+#)&
Carson
Slough
Figure 9. Classification of evapotranspiration (ET) units in Franklin Lake, Californi
ESTIMATION OF ANNUAL EVAPOTRANSPIRATION AND GROUND-WATER DISCHARGE 19

20 Grou
��� ��� ����
Base from U.S. Geological Survey digital data, 1:100,000,1978–89: Universal Transverse Mercator Projection Zone 11
Amarg osa River
��� ���
��� �� ������ ��� �� �� ����
�
�
� �� ��
� �� �������
EXPLANATION
ET Unit [area in acres]����� ���� ��� ���� ��
���� � �� ����
����� ����� ��� �����
��������� ���� � �� ����
��� ���� ��� ���
������ ����� ���� � �� �����
ET-area boundaryRoad
Figure 10. Classification of evapotranspiration (ET) units in Franklin Well area, California.
nd-Water Discharge Determined from Estimates of Evapotranspiration, Death Valley Regional Flow System

Base from U.S. Geological Survey digital data, 1:100,000,1978–89: Universal Transverse Mercator Projection Zone 11.
0
0
3 MILES
3 KILOMETERS
1 2
1 2
������
���
������
������� ������ ������
ET Unit [area in acres]
���� ���� ��
������� ������� ���������� ��
����� ������� ���������� ���
����� ������ ��� ������� ����������
� ��
����� �� ��������! �����
�������� ���������� "���
���� �������� ���������� �"#�
$���� ��� ���� %��
���� ���!� ��
EXPLANATION
���� �� ��������!
����� �&������ ���������� %�'�
ET Site
ET-area boundary
Road
Am
argosaR
i ver
Figure 11. Classification of evapotranspiration (ET) units in Oasis Valley, Nevada.
ESTIMATION OF ANNUAL EVAPOTRANSPIRATION AND GROUND-WATER DISCHARGE 21

22 G
Base from U.S. Geological Survey digital data, 1:100,000,1978–89: Universal Transverse Mercator Projection Zone 11
���� ���
��� ���
��� ��
��� ���
��� ��
���� �� ���� ��� � ��� ��
�
�
�� ��
�� �������
� �
� �
EXPLANATIONET Unit [area in acres]������ ������� ���� � ��
�������
���� ���� ��� �������
������ � ������ �� ����
������� ���� � �� ���� !��
"�� ���� ����#�!�
ET-area boundary
Road
Playa
Figure 12. Classification of evapotranspiration (ET) units in Sarcobatus Flat, Nevada.
round-Water Discharge Determined from Estimates of Evapotranspiration, Death Valley Regional Flow System

���� ��� ��� ��������� ������ ������� ����� ������������������ �������� ��������� !������� "��#������ $��� ��
��%& ��' ��%& �(' ��%& �)'
)(& (*'
)(& (%'
)(& (�'
)%&
�
�
+ !,-.�
+ /,-0!. .1�
�
�
ET Unit [area in acres]��������� ��� � ������ �� ���
����� ������ ������ �� ����
����� ����� �� ��������
������ �� ����
����� �� ��������� �����
������� ������ �� �����
����� ������� ������ �� �� !�
"� �� ��� �� � �� ��
����� ������� ������ �� �����
EXPLANATION
����� �� ��������� �����
�#������ ������ �� ����
ET-area boundary
Road
Amargosa River
Figure 13. Classification of evapotranspiration (ET) units in Shoshone area, California.
ESTIMATION OF ANNUAL EVAPOTRANSPIRATION AND GROUND-WATER DISCHARGE 23

24 Ground-Water
���� ��� ��� ��������� ������ ������� ����� ������������������ �������� ��������� !������� "��#������ $��� ��
�
�
% !&'(�
% )&'*!( (+�
� ,
� ,
ET Unit [area in acres]
��������� ��� � ������ �� ���
����� ����� �� ��������
������ �� ����
����� �� ��������� �����
������� ������ �� ����
����� ������� ������ �� ����
� �� ��� �� � ��!�
"��� ��� ��#��$�
EXPLANATION
����� �� ��������� �����
�%������ ������ �� ���
����� ������� ������ �� �$���
ET-area boundary
Road
Playa
&'()�)
*)+,-".&,)
%-. �/0
%-. ��0
��-. ��0 ��-. �/0
Figure 14. Classification of evapotranspiration (ET) units in Stewart Valley, California.
Discharge Determined from Estimates of Evapotranspiration, Death Valley Regional Flow System
ia.
���� ��� ��� ��������� ������ ������� ����� ������������������ �������� ��������� !������� "��#������ $��� ��
�
�
% !&'(�
% )&'*!( (+�
� ,
� ,
��-. �/0 ��-. ��0 ��-. �/0%/. //0
%/. /�0
%/. 1/0
EXPLANATIONET Unit [area in acres]
���� ���� ��
������� ������� ���������� ���
����� ������� ���������� ���
����� ������ ��� �������
���������� ����
����� �� ��������� �����
�������� ���������� !"�
���� �������� ���������� "��
#���� ��� ���� $"%�
���� �� ��������� �����
�&������ ���������� %��
���� �������� ���������� �'�(��
���� ����� $�
ET-area boundary Road
Am
argo
s aR
iver
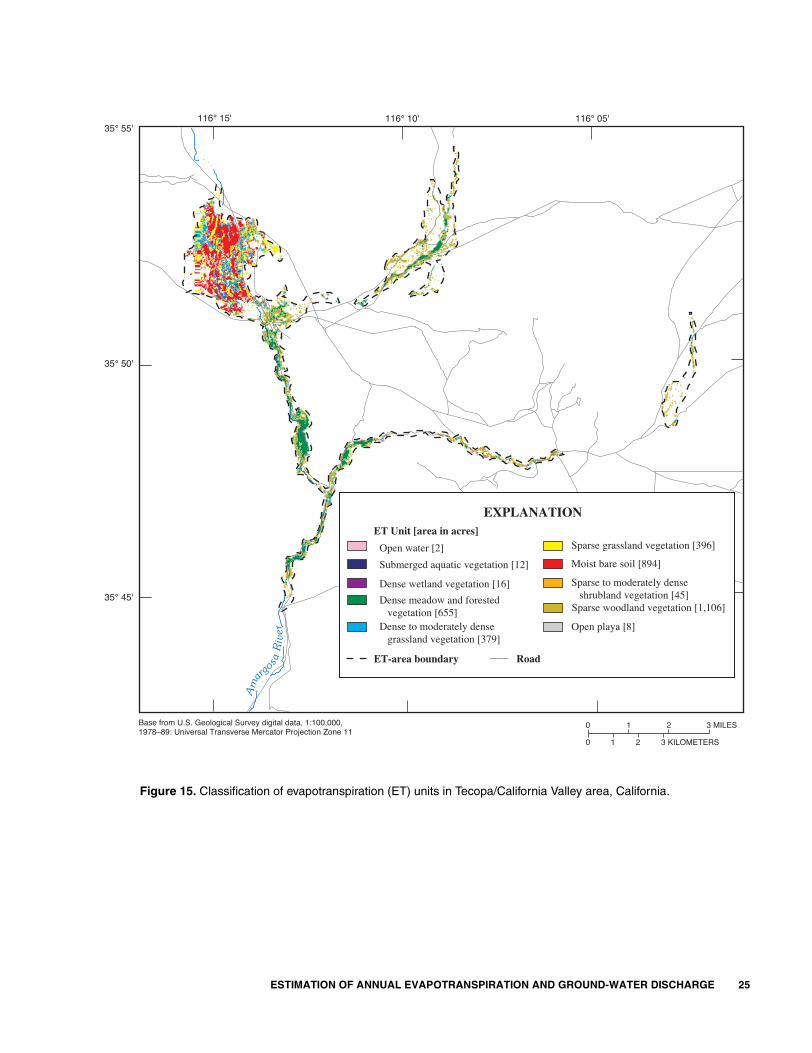
Figure 15. Classification of evapotranspiration (ET) units in Tecopa/California Valley area, Californ
ESTIMATION OF ANNUAL EVAPOTRANSPIRATION AND GROUND-WATER DISCHARGE 25

26 Ground-Water Discharge Determined from Estimates of Evapotranspiration, Death Valley Regional Flow System
The estimated ET rate for each ET unit within a discharge area is listed in table 5. Estimates represent the mean annual ET rate. Excluding open playa, ET rates given for Ash Meadows are those estimated by Laczniak and others (1999). Rates given for ET units in other discharge areas reflect differences between the different discharge areas in vegetation density. The den-sity adjustment was made based on Ash Meadows val-ues for ET units within Ash Meadows, and for other discharge areas on the mean value of the range.
Density differences between ET units were deter-mined from a modified soil adjusted vegetation index (MSAVI; Qi and others, 1994). The MSAVI uses TM channels 3 and 4 to compute a vegetation index for each pixel in the imagery. The MSAVI increases the dynamic range of the vegetation signal by minimizing back-ground influences from the soil. Index values range from 0 to 1, where 1 represents the strongest vegetation signal. A MSAVI was computed using the June 13, 1992 (fig. 16), and June 21, 1989, TM imagery. Raster data sets representing these indices are available from the USGS node of NSDI at <http:// water.usgs. gov/lookup/getspatial?msavi89> and <http://water. usgs.gov/lookup/getspatial?msavi92>. The average MSAVI computed for each ET unit is listed in table 6. Averages are based on an index computed from the imagery used to classify the discharge area, and range from 0.045 for submerged aquatic vegetation to nearly 0.395 for wetland vegetation. In general, lower values are associated with units having the sparsest vegetation and higher values with units having the densest vegeta-tion. ET units having a greater average MSAVI were assigned higher ET rates, and those having a lesser average were assigned lower rates.
Estimates of the mean annual volume of ET from each ET unit and discharge area are listed in table 5. Volume estimates for each ET unit are computed as the product of a unit's acreage and rate, and the total for each discharge area is computed by summing the individual ET-unit estimates. Mean annual ET ranges from about 450 to 30,000 acre-ft. Discharge areas having the largest mean annual ET are Ash Meadows and Sarcobatus Flat at 22,000 and 30,000 acre-ft, respectively, and those having the smallest are the Franklin Well area and Chicago Valley at 450 and 650 acre-ft, respectively.
Ground-Water Discharge
Sources contributing water to ET include direct precipitation, surface-water inflow from the surround-ing drainage area, and regional ground-water inflow. Regional ground-water inflow includes recycled spring and seep flow and any diffuse upward flow from the underlying regional flow system. Assuming that all ground water discharged from the regional flow system is locally evaporated or transpired, ground-water dis-charge can be estimated from ET knowing the precipi-tation and surface-water inflow components. In this study ground-water discharge is computed assuming that (1) the surface-water contribution is negligible, and (2) the precipitation component of ET is approximately equal to precipitation falling on the area—assumptions considered reasonable for these arid valleys. Spring and seep flow are not directly accounted for in ET-based estimates, but are indirectly included by the assumption that all local surface discharge (spring and seep flow) is evaporated or recycled back into the shallow ground-water flow system, where eventually, it is evaporated or transpired from within the area.
The average annual precipitation to each dis-charge area was estimated from precipitation measure-ments made at ET sites in Ash Meadows, Oasis Valley, and Death Valley (table 7); long-term continuous data collected at nearby National Weather Service (NWS) climate stations (tables 8 and 9); and values interpreted from different published maps of precipitation (Hardman, 1965; Houghton and others, 1975, fig. 40; Winograd and Thordarson, 1975, fig. 3) and a map generated by parameter-elevation regressions on inde-pendent slopes model (PRISM; Daly and others, 1994). Estimates range from 3.5 in. in the Shoshone and Tecopa/California Valley discharge areas to 6 in. in the Sarcobatus Flat and Oasis Valley discharge areas.
An estimate of mean annual ground-water dis-charge from each discharge area was computed by sum-ming individual estimates of mean annual ground-water discharge computed for each ET unit within the dis-charge area (table 10). Mean annual ground-water dis-charge from each ET unit was computed as the product of an adjusted mean annual ET rate and the acreage of the ET unit. Adjustments were made to remove any water from the ET estimate that was contributed by pre-cipitation. The remainder of the water consumed by ET is assumed to have originated from ground water. Mean annual ET rates (table 5) were adjusted for precipitation

Death Valley Regional Flow System boundary����� ���� ��� � ���� ������
Ground-water discharge area
EXPLANATION
�����
���� �� ���� �� �� ���� � �� ���� ��
Low High
���� �!� �
"���� �!� �
#�� �!� �
��$
�!� �
#�� �!� �
��� %������� �!� �
��$ �!� �
&������
� �!� �
���� �!� �
"���� �!� �
��$
�!� �
#�� �!� �
��� %������� �!� �
��$ �!� �
#&��'�
�"��(
)#��
������
�����
�����
�� ��
��� �����
������
�����
�� ��
������ ����
����
������ ����
����
�
�
�� �����
�� ��� ����!�
"�
"�
���� # �� $%�% &��'�����' �� ��� ������' ����( )*)��(���()+,-.-+* $���� ��' � ����� �� �� ���� � �/������ 0��� ))
123
1,3
1-3
))-3 )),3 ))23 ))43
143
Figure 16. Modified soil-adjusted vegetation index (MSAVI) of Death Valley regional flow system.
ESTIMATION OF ANNUAL EVAPOTRANSPIRATION AND GROUND-WATER DISCHARGE 27

scharge Determined from Estimates of Evapotranspiration, Death Valley Regional Flow System
Table 3. Location and general description of sites equipped with micrometeorological instruments and used to determine evapotranspiration (ET) in Ash Meadows and Oasis Valley, Nevada
[Geographic coordinates given in degrees, minutes, seconds and referenced to North American Datum of 1927. Sites in Ash Meadows are shown as ET sites in figure 7 �and in Oasis Valley in figure 11. Abbreviations: L, lower; M, middle; and U, upper]
Site name Latitude LongitudeAltitude
(feet abovesea level)
Period of data acquisition
Description of dominant vegetation cover 1 and
soil moisture conditions 2
ET-unit number 3
Ash Meadows
Rogers Spring 1 36°28'53" 116°20' 05" 2,256 Dec. 1993–Jan. 1996 Sparse to moderate saltgrass; soil moist in winter; very dry in summer. 6
Rogers Spring 2 36°28'55" 116°19' 55" 2,253 Dec. 1993–Jan. 1996 Moderate wire and saltgrass; soil wet in winter; moist in summer.
Fairbanks Swamp 36°29'01" 116°20'22" 2,248 Mar. 1995–Sept. 1997 Dense cattails and reeds; surface flooded throughout year.
Carson Meadow 36°25'17" 116°20'23" 2,171 Mar. 1995–Mar. 1997 Dense mixed grasses, clover, and scattered shrubs; soil moist in winter, dry in summer.
4
Spring Meadow 36°25'38" 116°21'20" 2,139 June 1995–Sept. 1997 Sparse to very sparse saltgrass; soil dry in winter, very dry in summer.
6
Lower Crystal Flat 36°24'22" 116°20'06" 2,148 Nov. 1995–June 1997 Very sparse bunch grass; soil wet in winter, moist in summer.
7
Bole Spring North 36°22'27" 116°18'11" 2,180 Jan. 1996–Sept. 1997 Sparse to very sparse bunch grass; soil moist in winter, dry in summer.
7
Bole Spring South 36°22'13" 116°18'17" 2,175 Jan. 1996–Sept. 1997 Sparse saltgrass; surface periodically floods during late winter and early spring, otherwise soil moist in winter, very dry in summer.
6
Peterson Reservoir 36°26'44" 116°21'05" 2,169 March 1996–Sept. 1997 Open-water body.1
Fairbanks Meadow 4 36°28'59" 116°20'18" 2,249 March 1997–June 1999 Dense saltgrass; surface periodically floods during late winter, otherwise soil wet in winter, dry in summer.
Oasis Valley
Middle Oasis Valley4 37°00'39" 116°43'24" 3,691 April 1997–June 1999 Moderate saltgrass, periodically flooded in early spring; soil wet in winter, dry in summer.
5
Springdale4 37°01'13" 116°43'49" 3,714 July 1996–Dec. 1998 Dense marsh grass, soil moist year-round.
4
Upper Oasis Valley L4 37°02'42" 116°42'29" 3,861 July 1998–June 1999 Moderate shrubs, primarily greasewood, soil dry year round.
Upper Oasis Valley U4 37°03'49" 116°41'39" 3,930 Jan. 1998–June 1999 Sparse shrubs, primarily rabbit brush and wolfberry; soil moist in winter, dry in summer.
Upper Oasis Valley M4 37°02'49" 116°42'41" 3,856 Dec. 1998–June 1999 Sparse saltgrass; soil moist in winter, dry in summer.
1 Vegetation cover descriptors: very sparse, less than 5 percent; sparse, 5 to 20 percent; moderate, 20 to 75 percent; and dense, greater than 75 percent.2 Soil moisture descriptors are presented as relative terms.3 ET unit identified and described in table 1. Numbers are color coded to match ET units as mapped in figures 7–15.4 Operation of site continued beyond end date specified by period of record (Reiner and others, 2002).
6
5
3
4
6
6
7
7
1
5
4
6
28 Ground-Water Discharge Determined from Estimates of Evapotranspiration, Death Valley Regional Flow System
8
33
44
44
55
55
55
66
66
66
66
77
77
8
11
2
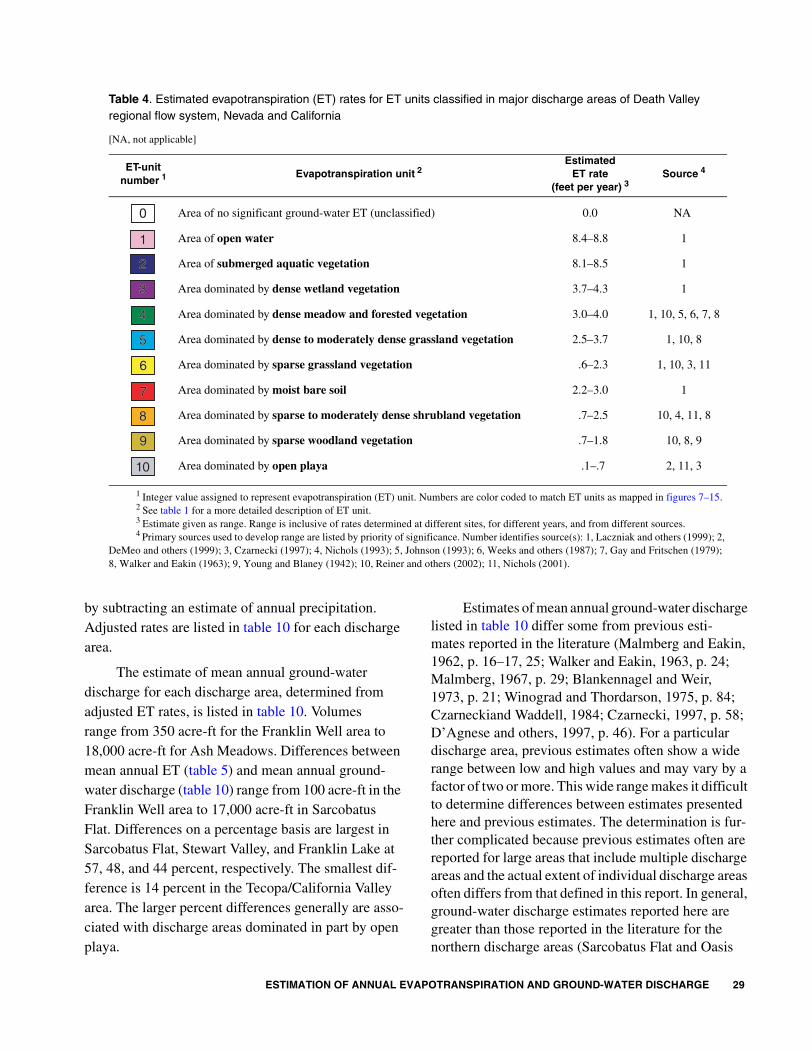
Table 4. Estimated evapotranspiration (ET) rates for ET units classified in major discharge areas of Death Valley regional flow system, Nevada and California
[NA, not applicable]
ET-unitnumber 1 Evapotranspiration unit 2
Estimated ET rate
(feet per year) 3Source 4
Area of no significant ground-water ET (unclassified) 0.0 NA
Area of open water 8.4–8.8 1
Area of submerged aquatic vegetation 8.1–8.5 1
Area dominated by dense wetland vegetation 3.7–4.3 1
Area dominated by dense meadow and forested vegetation 3.0–4.0 1, 10, 5, 6, 7, 8
Area dominated by dense to moderately dense grassland vegetation 2.5–3.7 1, 10, 8
Area dominated by sparse grassland vegetation .6–2.3 1, 10, 3, 11
Area dominated by moist bare soil 2.2–3.0 1
Area dominated by sparse to moderately dense shrubland vegetation .7–2.5 10, 4, 11, 8
Area dominated by sparse woodland vegetation .7–1.8 10, 8, 9
Area dominated by open playa .1–.7 2, 11, 3
1 Integer value assigned to represent evapotranspiration (ET) unit. Numbers are color coded to match ET units as mapped in figures 7–15.2 See table 1 for a more detailed description of ET unit.3 Estimate given as range. Range is inclusive of rates determined at different sites, for different years, and from different sources.4 Primary sources used to develop range are listed by priority of significance. Number identifies source(s): 1, Laczniak and others (1999); 2,
DeMeo and others (1999); 3, Czarnecki (1997); 4, Nichols (1993); 5, Johnson (1993); 6, Weeks and others (1987); 7, Gay and Fritschen (1979); 8, Walker and Eakin (1963); 9, Young and Blaney (1942); 10, Reiner and others (2002); 11, Nichols (2001).
22
33
44
55
0
11
66
77
88
99
1010
by subtracting an estimate of annual precipitation. Adjusted rates are listed in table 10 for each discharge area.
The estimate of mean annual ground-water discharge for each discharge area, determined from adjusted ET rates, is listed in table 10. Volumes range from 350 acre-ft for the Franklin Well area to 18,000 acre-ft for Ash Meadows. Differences between mean annual ET (table 5) and mean annual ground-water discharge (table 10) range from 100 acre-ft in the Franklin Well area to 17,000 acre-ft in Sarcobatus Flat. Differences on a percentage basis are largest in Sarcobatus Flat, Stewart Valley, and Franklin Lake at 57, 48, and 44 percent, respectively. The smallest dif-ference is 14 percent in the Tecopa/California Valley area. The larger percent differences generally are asso-ciated with discharge areas dominated in part by open playa.
ESTIMATION OF ANNUAL EVA
Estimates of mean annual ground-water discharge listed in table 10 differ some from previous esti-mates reported in the literature (Malmberg and Eakin, 1962, p. 16–17, 25; Walker and Eakin, 1963, p. 24; Malmberg, 1967, p. 29; Blankennagel and Weir, 1973, p. 21; Winograd and Thordarson, 1975, p. 84; Czarneckiand Waddell, 1984; Czarnecki, 1997, p. 58; D’Agnese and others, 1997, p. 46). For a particular discharge area, previous estimates often show a wide range between low and high values and may vary by a factor of two or more. This wide range makes it difficult to determine differences between estimates presented here and previous estimates. The determination is fur-ther complicated because previous estimates often are reported for large areas that include multiple discharge areas and the actual extent of individual discharge areas often differs from that defined in this report. In general, ground-water discharge estimates reported here are greater than those reported in the literature for the northern discharge areas (Sarcobatus Flat and Oasis
POTRANSPIRATION AND GROUND-WATER DISCHARGE 29

30 G
rou
nd
-Water D
ischarg
e Determ
ined
from
Estim
ates of E
vapo
transp
iration
, Death
Valley R
egio
nal F
low
System
Table 5. Mean annual evapotranspiration (ET) from major areas of ground-water discharge in Death Valley regional flow system, Nevada and California
[ft/yr, feet per year; acre-ft, acre-feet; —, no data]
Discharge area ET componentET-unit number a
a ET unit is described in table 1 and shown in figures 7–15.
1 2 3 4 5 6 7 8 9 10 Total
Ash Meadows Acreage (acre) 158 81 385 490 1,499 7,059 554 0 0 2,241 12,467
ET Rate (ft/yr) 8.6 8.5 4.0 3.4 3.5 1.3 2.6 — — 0.5 b1.8
b Number is not a total but the area-weighted average of ET rates for ET units in the discharge area.
Annual ET (acre-ft) c
c Annual ET is rounded to two significant digits. Total is computed as the sum of the rounded values listed for each ET unit and may not be consistent with that computed as the product of the area-weighted average and the total acreage.
1,400 690 1,500 1,700 5,200 9,200 1,400 — — 1,100 22,000
Chicago Valley Acreage (acre) 0 0 1 0 11 0 3 0 596 1 612
ET Rate (ft/yr) — — 4.1 — 3.3 — 2.8 — 1.0 0.5 21.1
Annual ET (acre-ft)3 — — 4 — 36 — 8 — 600 1 650
Franklin Lake Acreage (acre) 0 0 0 0 9 550 148 136 0 1,488 2,331
ET Rate (ft/yr) — — — — 2.9 1.0 2.4 1.0 — 0.5 20.77
Annual ET (acre-ft)3 — — — — 26 550 360 140 — 740 1,800
Franklin Well area Acreage (acre) 0 0 0 13 15 0 1 0 268 0 297
ET Rate (ft/yr) — — — 3.4 3.3 — 2.8 — 1.3 — 21.5
Annual ET (acre-ft)3 — — — 44 50 — 3 — 350 — 450
Oasis Valley Acreage (acre) 1 5 40 931 645 962 81 807 0 1 3,473
ET Rate (ft/yr) 8.6 8.5 4.2 3.1 3.1 1.2 2.7 1.9 — 0.5 22.3
Annual ET (acre-ft)3 9 42 170 2,900 2,000 1,200 220 1,500 — 1 8,000
Sarcobatus Flat Acreage (acre) 0 0 0 0 0 2,611 1,450 19,372 0 10,817 34,250
ET Rate (ft/yr) — — — — — 0.8 2.4 1.0 — 0.5 20.88
Annual ET (acre-ft)3 — — — — — 2,100 3,500 19,000 — 5,400 30,000
Shoshone area Acreage (acre) 0 1 12 62 344 659 152 22 136 0 1,388
ET Rate (ft/yr) — 8.4 4.3 3.6 2.8 1.0 2.4 1.5 1.3 — 21.8
Annual ET (acre-ft)3 — 8 52 220 960 660 360 33 180 — 2,500
Stewart Valley Acreage (acre) 0 1 0 22 18 49 87 9 382 2,443 3,011
ET Rate (ft/yr) — 8.4 — 3.1 3.1 1.2 2.4 1.9 1.1 0.5 20.66
Annual ET (acre-ft)3 — 8 — 68 56 59 210 17 420 1,200 2,000
Tecopa/California Valley area
Acreage (acre) 2 12 16 655 379 396 894 45 1,106 8 3,513
ET Rate (ft/yr) 8.6 8.5 3.9 3.3 2.9 0.9 2.4 1.8 1.2 0.5 22.1
Annual ET (acre-ft)3 17 100 62 2,200 1,100 360 2,100 81 1,300 4 7,300

Valley) and less than those reported in the literature for the southern discharge areas (Chicago Valley, Franklin Lake, Shoshone, and Tecopa/California Valley). These discrepancies relate to differences in estimates of ET acreage, ET rates, or both.
Limitations of Methodology
The accuracy of the ground-water discharge esti-mates is limited primarily by the assumptions inherent in the classification procedure used to define ET units and in the energy-budget methods (primarily Bowen ratio) used to compute ET rates (Laczniak and others, 1999, p. 21-22). Other factors potentially affecting the accuracy of the ground-water discharge estimates include (1) the assumption that all springflow ulti-mately is evaporated or transpired from within the bounds of defined discharge areas; (2) the assumption that no external surface inflow contributes water to the local ET process; (3) the short-term nature of the data used to compute mean annual ET rates; (4) the limited number of sites used to estimate mean annual ET rates; (5) uncertainty in estimates of ET rates based on com-puted relative density differences; and (6) the uncer-tainty in the adjustment applied to remove precipitation from ET estimates. Uncertainty associated with ground-water discharge estimates is determined using a Monte Carlo analysis. Results of the analysis are dis-cussed in the appendix.
ESTIMATION OF ANNU
With one exception, ET units and their associated acreage were determined from TM imagery acquired on a single date (June 13, 1992). Cloud cover over Sar-cobatus Flat on that date necessitated the use of TM imagery acquired on June 21, 1989, for that area. June represents a period of the year when vegetation is rela-tively robust, and 1992 was a year of slightly above nor-mal precipitation. Vegetation on this date is assumed to be healthy and vigorous, and thus should be easily clas-sified through spectral methods. Although this date is assumed to be a reasonable representation of average vegetation and soil conditions throughout the DVRFS, conditions are known to change from one year to the next (Laczniak and others, 1999, p. 31-33). Most of these changes are a consequence of changes in precip-itation, which affects local vegetation, soil-moisture conditions, and the depth to the water table—all of which affect ET rates. Thus, a classification technique based on multiple years of TM imagery or some other type of spectral data would provide more confidence in the classification of ET units and acreage calculations in terms of long-term averages.
Estimates of the ET rate for each ET unit were determined using rates computed from micrometeoro-logical data collected at 15 sites instrumented through-out Ash Meadows and Oasis Valley, and from ET rates given in other selected studies of the general area. Together these rates established a range of values that generally define the ET rate for each ET unit. In some
Table 6. Mean modified soil-adjusted vegetation index (MSAVI) value by evapotranspiration (ET) unit for major dischargeareas in the Death Valley regional flow system, Nevada and California
[Mean MSAVI value derived from TM imagery acquired June 13, 1992, except in Sarcobatus Flat which was derived from TM imagery acquired June 21, 1989; MSAVI values range from 0 to 1, where 1 indicates the densest vegetation. —, not present or not applicable]
ET Unit 1
1 Discharge areas are shown in figure 1.
Discharge area 2
2 ET unit is described in table 1 and mapped in figures 7–15.
1 2 3 4 5 6 7 8 9 10
Ash Meadows — 0.065 0.195 0.290 0.180 0.125 0.105 — — 0.065
Chicago Valley — — .260 — .165 — .145 — 0.140 .065
Franklin Lake — — — — .095 .080 .085 0.075 — .070
Franklin Well area — — — .285 .170 — .160 — .180 —
Oasis Valley — .075 .305 .240 .140 .110 .120 .120 — .075
Sarcobatus Flat — — — — — .070 .075 .075 — .060
Shoshone area — .045 .395 .315 .080 .080 .080 .105 .175 —
Stewart Valley — — — .250 .135 .110 .070 .120 .150 .060
Tecopa/California Valley area — .060 .185 .275 .100 .075 .065 .115 .155 .070
AL EVAPOTRANSPIRATION AND GROUND-WATER DISCHARGE 31
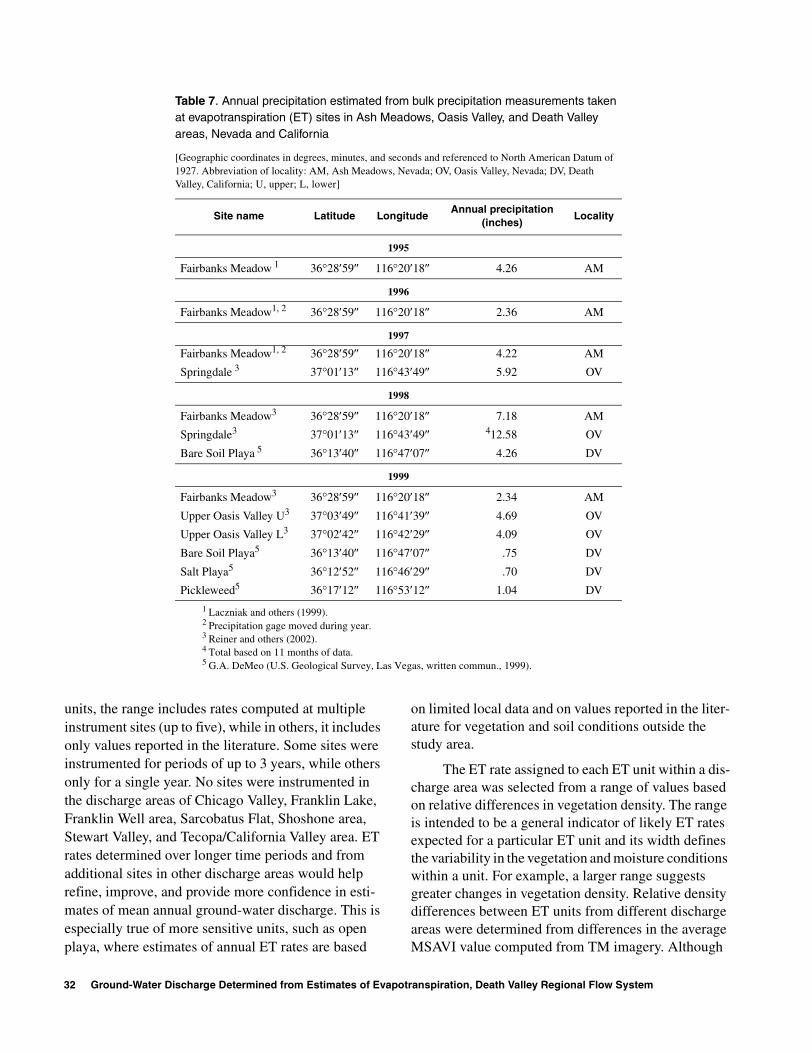
Table 7. Annual precipitation estimated from bulk precipitation measurements taken at evapotranspiration (ET) sites in Ash Meadows, Oasis Valley, and Death Valley areas, Nevada and California
[Geographic coordinates in degrees, minutes, and seconds and referenced to North American Datum of 1927. Abbreviation of locality: AM, Ash Meadows, Nevada; OV, Oasis Valley, Nevada; DV, Death Valley, California; U, upper; L, lower]
Site name Latitude LongitudeAnnual precipitation
(inches)Locality
1995
Fairbanks Meadow 1 36�28�59� 116�20�18� 4.26 AM
1996
Fairbanks Meadow1, 2 36�28�59� 116�20�18� 2.36 AM
1997
Fairbanks Meadow1, 2 36�28�59� 116�20�18� 4.22 AM
Springdale 3 37�01�13� 116�43�49� 5.92 OV
1998
Fairbanks Meadow3 36�28�59� 116�20�18� 7.18 AM
Springdale3 37�01�13� 116�43�49� 412.58 OV
Bare Soil Playa 5 36�13�40� 116�47�07� 4.26 DV
1999
Fairbanks Meadow3 36�28�59� 116�20�18� 2.34 AM
Upper Oasis Valley U3 37�03�49� 116�41�39� 4.69 OV
Upper Oasis Valley L3 37�02�42� 116�42�29� 4.09 OV
Bare Soil Playa5 36�13�40� 116�47�07� .75 DV
Salt Playa5 36�12�52� 116�46�29� .70 DV
Pickleweed5 36�17�12� 116�53�12� 1.04 DV
1 Laczniak and others (1999).2 Precipitation gage moved during year.3 Reiner and others (2002).4 Total based on 11 months of data.5 G.A. DeMeo (U.S. Geological Survey, Las Vegas, written commun., 1999).
units, the range includes rates computed at multiple instrument sites (up to five), while in others, it includes only values reported in the literature. Some sites were instrumented for periods of up to 3 years, while others only for a single year. No sites were instrumented in the discharge areas of Chicago Valley, Franklin Lake, Franklin Well area, Sarcobatus Flat, Shoshone area, Stewart Valley, and Tecopa/California Valley area. ET rates determined over longer time periods and from additional sites in other discharge areas would help refine, improve, and provide more confidence in esti-mates of mean annual ground-water discharge. This is especially true of more sensitive units, such as open playa, where estimates of annual ET rates are based
32 Ground-Water Discharge Determined from Estimates of Evapo
on limited local data and on values reported in the liter-ature for vegetation and soil conditions outside the study area.
The ET rate assigned to each ET unit within a dis-charge area was selected from a range of values based on relative differences in vegetation density. The range is intended to be a general indicator of likely ET rates expected for a particular ET unit and its width defines the variability in the vegetation and moisture conditions within a unit. For example, a larger range suggests greater changes in vegetation density. Relative density differences between ET units from different discharge areas were determined from differences in the average MSAVI value computed from TM imagery. Although
transpiration, Death Valley Regional Flow System

Table 8. Annual precipitation measurements from National Weather Service climate stations near the major discharge areas of Death Valley regional flow system,
(table 10). Symbol: —, missing data]
nagat Refuge880)
Penoyer(266130)
Death Valley
(042319)
— —
— —
— —
— —
— —
— —
— —
— —
— —
— —
— —
— —
— —
— a1.27
— .77
8 — 1.05
0 — 3.32
3 — .79
3 a4.86 1.39
0 a1.77 a1.62
5 7.62 3.42
1 5.77 2.29
3 a4.26 .96
6 a.00 2.25
4 a.00 a2.27
5 a.00 3.47
1 a.00 1.51
6 a.00 4.21
3 a.00 2.80
6 a.00 4.03
ES
TIM
AT
ION
OF
AN
NU
AL
EV
AP
OT
RA
NS
PIR
AT
ION
AN
D G
RO
UN
D-W
AT
ER
DIS
CH
AR
GE
33
Nevada and California
[All precipitation data are in inches. Data are available from the National Climatic Data Center. Number given in station name is National Weather Service identifier
Calendaryear
Precipitation station
Beatty(260714)
Beatty 8N(260718)
Sarcobatus(267319)
Goldfield(263285)
Amargosa Farms
(260150)
Desert Rock WSMO
(262251)
Pahrump(265890)
Indian Springs(263980)
Desert Game Range
(262243)
PahraWildlife
(265
1948 a0.44 — a1.06 a0.53 — — a0.45 a0.33 a0.70 —
1949 5.43 — 4.07 2.76 — — 5.73 7.04 a6.28 —
1950 2.05 — 1.30 a1.53 — — 1.88 .66 1.41 —
1951 2.60 — 3.57 a3.46 — — a1.28 1.84 4.21 —
1952 8.36 — 7.98 a7.27 — — a2.59 3.26 6.54 —
1953 .69 — 2.52 a1.39 — — a.00 1.41 1.00 —
1954 a6.44 — 4.06 a4.20 — — a.00 2.92 3.05 —
1955 4.31 — 2.29 a.00 — — a.00 1.73 3.64 —
1956 1.67 — 1.51 a.00 — — a.00 1.86 .85 —
1957 5.91 — 4.77 a.00 — — a.00 4.70 5.87 —
1958 a4.23 — 3.39 a.07 — — a2.07 4.38 5.86 —
1959 3.39 — 4.41 2.87 — — 2.79 3.50 3.94 —
1960 5.12 — 2.09 6.55 — — 4.77 5.14 4.20 —
1961 3.29 — a.45 4.47 — — a2.30 2.75 5.76 —
1962 2.67 — — 6.23 — — a2.46 2.02 1.79 —
1964 2.11 — — a1.69 — — a1.21 a.00 1.11 a2.3
1965 7.33 — — a7.35 a1.93 — 9.12 — 7.41 7.8
1966 3.22 — — 4.71 1.28 — 1.58 — 2.34 3.9
1967 4.88 — — 10.88 a1.42 — a1.13 — 4.93 8.8
1968 4.45 — — 5.77 a3.00 — a.00 — 1.47 6.6
1969 a4.99 — — 7.43 6.95 — a5.41 — 7.53 8.3
1970 a3.00 — — 4.32 a2.65 — 2.93 — 2.60 4.4
1971 a1.98 — — 2.45 a.00 — 2.04 — 1.50 3.9
1972 a1.95 a0.00 — a3.36 a.00 — 3.99 — 6.57 5.3
1973 — 6.72 — a4.75 a.00 — 4.21 — 4.58 7.1
1974 — 5.80 — a4.87 a.00 — 3.35 — 4.77 5.4
1975 — 4.84 — 5.68 a.00 — 2.04 — a5.15 a5.0
1976 — 7.82 — 12.00 a.00 — 6.73 — 6.35 8.1
1977 — 6.44 — 7.33 a.00 — 4.10 — 3.03 a4.0
1978 — 10.80 — 13.19 a1.90 — 8.78 — 6.88 a9.4

34 Table 8. Annual precipitation measurements from National Weather Service climate stations near the major discharge areas of Death Valley regional flow system,
hranagat life Refuge65880)
Penoyer(266130)
Death Valley
(042319)
0.00 a0.00 1.76
5.58 a.00 3.19
6.58 a.00 1.77
9.87 a.00 2.62
1.54 a.00 4.54
8.86 a.00 a2.17
4.84 a.00 .87
4.37 a1.28 1.00
7.71 a7.40 3.74
5.32 a4.36 3.84
2.23 a.00 .45
5.48 a3.14 1.28
5.52 a.83 a1.33
9.66 a.00 3.36
6.82 a1.74 2.58
4.36 a2.75 a.45
7.53 a5.91 3.27
3.33 8.00 1.15
5.55 3.53 2.81
7.71 a5.45 4.26
3.97 3.15 1.18
6.53 5.61 2.37
Gro
un
d-W
ater Disch
arge D
etermin
ed fro
m E
stimates o
f Evap
otran
spiratio
n, D
eath V
alley Reg
ion
al Flo
w S
ystem
Nevada and California— Continued
Calendaryear
Precipitation station
Beatty(260714)
Beatty 8N(260718)
Sarcobatus(267319)
Goldfield(263285)
Amargosa Farms
(260150)
Desert Rock WSMO
(262251)
Pahrump(265890)
Indian Springs(263980)
Desert Game Range
(262243)
PaWild
(2
1979 — 4.71 — 4.68 2.16 — 7.17 — a1.95 a
1980 — 6.01 — 6.84 6.24 — a7.83 — 4.54 a
1981 — 3.73 — a7.14 3.20 — a3.62 — 3.26
1982 — 6.07 — 7.75 4.30 — 5.11 — 4.87
1983 — 11.49 — a5.60 10.37 — 8.55 — 6.34 1
1984 — a5.45 — a.27 8.80 a10.76 8.41 — 10.38
1985 — 2.79 — a2.18 1.00 4.77 2.45 — 2.58
1986 — 5.22 — a4.11 3.75 6.92 3.23 — 4.66
1987 — 7.38 — 9.23 8.18 8.56 7.41 — 7.21
1988 — 6.21 — 8.17 5.59 5.84 a4.03 — 3.12
1989 — 2.43 — a5.00 .72 1.25 2.11 — 1.51
1990 — 4.92 — 5.07 2.58 4.88 5.75 — 2.82 a
1991 — 5.15 — 5.74 3.40 5.55 5.10 — 4.07
1992 — 7.37 — a6.66 6.09 6.35 8.34 — 8.85
1993 — 5.71 — a6.08 5.68 7.55 7.71 — 4.91
1994 — 3.44 — 5.86 2.27 3.28 3.18 — a3.38 a
1995 — 8.45 — 9.50 5.27 a7.90 a5.43 — 4.53
1996 — 5.60 — 5.16 2.83 a2.02 a1.90 — 2.74
1997 — 6.64 — 6.38 3.33 a.00 3.77 — 4.40
1998 — 12.62 — a10.88 8.71 a.00 8.49 — 9.23 a
1999 — a4.69 — a4.91 2.35 a4.44 3.64 — 3.66 a
a Value represents incomplete year.
Annual mean
4.03 6.33 3.50 6.50 4.57 5.49 4.94 3.07 4.41

this technique is likely to provide a reasonable estimate of the ET rate, more accuracy could be achieved either by classifying more ET units or by improving the rela-tion between density and ET rate. Either approach requires the installation of additional ET sites to mea-sure local ET rates.
ET estimates were adjusted to remove contribu-tions of local precipitation. Some uncertainty is inher-ent in the precipitation adjustment. This uncertainty is attributed to errors in estimating the average annual precipitation and to the uncertainty in the actual amount of local precipitation included in estimated ET rates. No adjustment was made to remove any surface-water inflow contribution from the estimate of the ET rate. The aridity of the area is likely to produce minimal sur-face-water inflows, but in discharge areas where pre-cipitation is relatively high and the surrounding drainage area is dominated by highlands, such as Oasis Valley and Sarcobatus Flat, surface-water inflow may be a more substantial component of the estimated ET rate. The decision not to adjust ET rates for local sur-face-water inflow was based on the scarcity of available data and may be partly responsible for the larger ground-water discharge estimates given for the north-ern discharge areas than reported in the literature. Addi-tional data defining the amount of water contributed by the many sources to local ET would greatly improve estimates of ground-water discharge.
ESTIMATION OF ANNUAL EVA
Unclassified areas are assumed to be zones of no substantial ground-water discharge. This assumption, although strongly supported by the lack of vegetation, dryness of soil, and greater depths to the water table (generally exceeding 50 ft), could result in some error when estimating ground-water discharge. Even over vast areas, volumetric losses of ground water are likely to be negligible considering the very low ET rates (less than 1.0x10⁻⁴ ft/yr) associated with these areas (Andraski, 1997, table 2).
Ground-water discharge estimates as reported include only water lost through evaporation and tran-spiration, and do not include any water that may be leaving discharge areas through subsurface flow. Until additional data become available from which to define water-level distributions and spatial variations in the hydraulic properties controlling ground-water move-ment throughout the shallow local and deeper regional flow systems, reliable estimates of subsurface outflow are not possible. Considering the high potential for sub-surface outflow from many of the major discharge areas in the DVRFS, the estimate of ground-water discharge presented should be considered a minimum value for the total amount of ground water exiting a discharge area.
Table 9. National Weather Service (NWS) climate stations near major discharge areas of Death Valley regional flow system, Nevada and California
[Geographic coordinates (latitude and longitude) are given in degrees and minutes and referenced to North American Datum of 1927]
Station nameNWS
numberLatitude Longitude
Altitude(feet above sea level)
Beatty 260714 36�55� 116�45� 3,300
Beatty 8N 260718 37�00� 116�43� 3,550
Sarcobatus 267319 37�16� 117�01� 4,020
Goldfield 263285 37�42� 117�14� 5,690
Amargosa Farms 260150 36�34� 116�28� 2,450
Desert Rock WSMO 262251 36�37� 116�01� 3,300
Pahrump 265890 36�12� 115�59� 2,670
Indian Springs 263980 36�35� 115�41� 3,120
Desert Game Range 262243 36�26� 115�22� 2,920
Pahranagat WL Refuge 265880 37�16� 115�07� 3,400
Penoyer 266130 37�37� 115�47� 4,800
Death Valley 042319 36�28� 116�52� -190
POTRANSPIRATION AND GROUND-WATER DISCHARGE 35

36 G
rou
nd
-Water D
ischarg
e Determ
ined
from
Estim
ates of E
vapo
transp
iration
, Death
Valley R
egio
nal F
low
System
Table 10. Mean annual ground-water discharge from major areas of ground-water discharge in Death Valley regional flow system, Nevada and California
[ET, evapotranspiration; ft/yr, feet per year; acre-ft, acre/feet; —, no data]
Discharge area
Precipitationadjustment
(ft/yr)ET component
ET-unit number1
1 2 3 4 5 6 7 8 9 10 Total
Ash Meadows 0.35 Area (acre) 158 81 385 490 1,499 7,059 554 0 0 2,241 12,467
Adjusted ET rate (ft/yr) 8.25 8.15 3.65 3.05 3.15 0.95 2.25 — — 0.15 21.4
Ground-water discharge (acre-ft)3 1,300 660 1,400 1,500 4,700 6,700 1,200 — — 340 18,000
Chicago Valley 0.35 Area (acre) 0 0 1 0 11 0 3 0 596 1 612
Adjusted ET rate (ft/yr) — — 3.75 — 2.95 — 2.45 — 0.65 0.15 20.70
Ground-water discharge (acre-ft)3 — — 4 — 32 — 7 — 390 0 430
Franklin Lake 0.33 Area (acre) 0 0 0 0 9 550 148 136 0 1,488 2,331
Adjusted ET rate (ft/yr) — — — — 2.57 0.67 2.07 0.67 — 0.17 20.43
Ground-water discharge (acre-ft)3 — — — — 23 370 310 91 — 250 1,000
Franklin Well area
0.35 Area (acre) 0 0 0 13 15 0 1 0 268 0 297
Adjusted ET rate (ft/yr) — — — 3.05 2.95 — 2.45 — 0.95 — 21.2
Ground-water discharge (acre-ft)3 — — — 40 44 — 2 — 260 — 350
Oasis Valley 0.50 Area (acre) 1 5 40 931 645 962 81 807 0 1 3,473
Adjusted ET rate (ft/yr) 8.10 8.00 3.70 2.60 2.60 0.70 2.20 1.40 — 0.01 21.8
Ground-water discharge (acre-ft)3 8 40 150 2,400 1,700 670 180 1,100 — 0 6,200
Sarcobatus Flat 0.50 Area (acre) 0 0 0 0 0 2,611 1,450 19,372 0 10,817 34,250
Adjusted ET rate (ft/yr) — — — — — 0.30 1.90 0.50 — 0.01 20.38
Ground-water discharge (acre-ft)3 — — — — — 780 2,800 9,700 — 110 13,000
Shoshone area 0.29 Area (acre) 0 1 12 62 344 659 152 22 136 0 1,388
Adjusted ET rate (ft/yr) — 8.11 4.01 3.31 2.51 0.71 2.11 1.21 1.01 — 21.5
Ground-water discharge (acre-ft)3 — 8 48 200 860 470 320 27 140 — 2,100
Stewart Valley 0.35 Area (acre) 0 1 0 22 18 49 87 9 382 2,443 3,011
Adjusted ET rate (ft/yr) — 8.05 — 2.75 2.75 0.85 2.05 1.55 0.75 0.15 20.33
Ground-water discharge (acre-ft)3 — 8 — 60 50 42 180 14 290 370 1,000
Tecopa/CaliforniaValley area
0.29 Area (acre) 2 12 16 655 379 396 894 45 1,106 8 3,513
Adjusted ET rate (ft/yr) 8.31 8.21 3.61 3.01 2.61 0.61 2.11 1.51 0.91 0.21 21.8
Ground-water discharge (acre-ft)3 17 99 58 2,000 990 240 1,900 68 1,000 2 6,400
1 ET unit is described in table 1 and shown in figures 7–15.2 This number is not a total ET rate but the area-weighted average of the adjusted ET rates for the ET units in the discharge area. 3 Ground-water discharge is rounded to two significant digits. Total is computed as the sum of the rounded values listed for each
ET unit and may not be consistent with that computed as the product of the area-weighted average and the total acreage.

SUMMARY
The Death Valley regional flow system (DVRFS) is one of the larger ground-water flow systems in the southwest United States and includes much of southern Nevada and the Death Valley region of eastern Califor-nia. Although situated in an arid region, large quantities of ground water discharge from a few localized areas where geologic and hydrologic conditions are such that ground water is pushed upward to the surface and is dis-charged from springs and seeps. The water emerging from these sources supports a great diversity of vegeta-tion and wildlife and provides habitat for a variety of endangered plant and animal species. Some water flow-ing from these sources evaporates shortly after emerg-ing, some water flows to pools and reservoirs where it too evaporates, and the remainder of the water infil-trates downward from drainage channels to recharge the underlying shallow flow system. Moisture held in the local soils and water contained in the shallow flow system sustains thriving populations of phreatophytes year round. Together these water sources and local plant communities create distinct oases within an expansive, generally barren desert region.
The Nevada Test Site (NTS), with an area of about 1,375 mi2, is centrally located within the DVRFS. Some of the ground water emerging from the major discharge areas of the DVRFS originates or flows beneath the NTS. The NTS historically has been used for testing nuclear devices and currently is a potential location for the permanent disposal of high-level nuclear waste in United States. The U.S. Department of Energy, as mandated by Federal and State regulators, is evaluating the risk associated with contaminants that have been or may be introduced into the subsurface as a consequence of any past or future activities at the NTS. To assess risk, the potential for contaminant transport away from the site must be determined. Because subsurface contaminants can be transported away from the NTS by ground water, components of the ground-water budget that provide information on the flow of ground water are of extreme interest. One such component influencing ground-water flow is regional ground-water discharge. Because some uncer-tainty exists as to the amount of ground water that discharges from the DVRFS, studies were initiated to re-evaluate and better quantify estimates of ground-water discharge. This report documents the result of a previous study that applies a technique to estimate ground-water discharge at Ash Meadows to other major
discharge areas of the DVRFS. The discharge areas evaluated as part of this effort include Chicago Valley, the Franklin Well area, Franklin Lake, Sarcobatus Flat, the Shoshone area, Stewart Valley, and the Tecopa/Cal-ifornia Valley area. Although Ash Meadows and Oasis Valley were studied as part of independent efforts, esti-mates for these two areas are included in this report for purposes of completeness. This effort does not include Death Valley, which currently is being evaluated as part of a separate study by the U.S. Geological Survey in cooperation with the National Park Service.
Ground-water discharge is estimated throughout much of the DVRFS from a rigorous quantification of evapotranspiration. This approach assumes that all ground-water discharge is evaporated or transpired from within the discharge area. Although the approach does not account for springflow directly, it assumes that all springflow is evaporated or recycled back into the shallow flow system where later it is transpired or evap-orated. Any recycled water not locally evaporated or transpired is not accounted for in the discharge esti-mate. Mean annual evapotranspiration (ET) from each discharge area is calculated as the sum of mean annual ET estimates determined for each of the ET units (an area of similar vegetation and moisture conditions) present within the discharge area. Mean annual ET from an ET unit is computed as the product of the unit’s acreage and its estimated annual ET rate.
ET units are defined on the basis of differences in spectral-reflectance characteristics. Spectral differ-ences are determined from thematic mapper (TM) imagery acquired June 21, 1989, and June 13, 1992. Except for Sarcobatus Flat, all discharge areas are clas-sified from the June 13, 1992, imagery. TM imagery acquired June 21, 1989, is used to classify ET units in Sarcobatus Flat because excessive cloud cover over this area diminished the overall quality of the 1992 imagery. Ten unique ET units are identified that include areas of open playa, sparse to dense vegetation, moist bare soil, and open water. Sarcobatus Flat has the largest ET unit acreage of any discharge area at 34,250 acres. Of this total, 19,372 acres are classified as sparse to moder-ately dense shrubs and 10,817 acres as open playa. The dominant phreatophyte found in Sarcobatus Flat is greasewood (Sarcobatus vermiculatus). The discharge area having the next largest acreage is Ash Meadows at 12,467 acres. The largest ET unit classified within Ash Meadows is sparse grassland vegetation at 7,059 acres
SUMMARY 37

and is dominated by expansive meadows of saltgrass (Distichlis spicata var. stricata). The smallest dis-charge area is the Franklin Well area with 297 acres.
Mean annual ET rates for seven ET units are estimated from daily ET rates computed primarily from micrometeorological data collected at 15 sites instru-mented in Ash Meadows and Oasis Valley. Sites were instrumented for periods of 1 to 3 years as part of separate studies of Ash Meadows and Oasis Valley and are located within 7 of the 10 ET units identified. In the three ET units not instrumented, annual ET rates were estimated from rates reported in the literature. Together, these values established a range of ET rates for each ET unit. Estimated mean annual ET rates range from 0.5 ft/yr for open playa to nearly 9 ft/yr for open water. Mean annual ET estimates for discharge areas range from 450 acre-ft in the Franklin Well area to 30,000 acre-ft in Sarcobatus Flat.
Ground-water discharge for each ET unit is estimated as the product of an adjusted ET rate and the ET unit acreage. The ET rate is adjusted to remove local precipitation components from the ET estimate. Precipitation ranges from 3.5 in. in the Shoshone and Tecopa discharge areas to 6 in. in the Sarcobatus Flat and Oasis Valley discharge areas. Estimates of mean annual ground-water discharge range from 350 acre-ft in the Franklin Well area to 18,000 acre-ft in Ash Meadows. Ground-water discharge estimates generally are greater for the northern discharge areas (Sarcobatus Flat and Oasis Valley) than previous estimates reported in the literature and less for the southern discharge areas (Franklin Lake, Shoshone, and Tecopa/California Valley).
The accuracy of ground-water discharge esti-mates is limited primarily by the assumptions inherent in the classification procedure and in the energy-budget methods (primarily Bowen ratio) used to compute daily ET. Other factors potentially affecting the accuracy of the ground-water discharge estimates include (1) the assumption that all springflow ultimately is evaporated or transpired from within the discharge area; (2) the assumption that no external surface-water inflow con-tributes to local ET measurements; (3) the short period of record used to compute mean annual ET rates; (4) the limited number of local sites used to estimate mean annual ET rates; (5) the uncertainty associated with computing local ET estimates on computed rela-tive density differences; and (6) the uncertainty in the adjustment applied to remove precipitation from ET estimates. Multi-year classifications, longer-term data
38 Ground-Water Discharge Determined from Estimates of Evapo
acquisition, and a greater number of local ET-site installations would help refine, improve, and provide more confidence in estimates of mean annual ground-water discharge. Additional measurements of ET rates in areas such as open playa where estimates of annual ET rates are based on values reported in the literature for vegetation and soil conditions outside the study area or on limited data, and a better understanding of the contribution of precipitation and surface-water inflow to measured ET rates are vital to establishing a higher degree of confidence in estimates of ET and ground-water discharge. The stated conjecture that these data would improve confidence is supported by results of the uncertainty analysis presented in the appendix. Results indicate that the largest uncertainties are most often coincident with discharge areas dominated by open playa and that the adjustment made to remove the nonground-water component (precipitation and sur-face-water inflow) from the measurements of ET rates is an extremely sensitive parameter.
The estimate of ground-water discharge presented in this report includes water lost through evaporation and transpiration but does not include water that may exit discharge areas as subsurface flow. Absent better estimates of subsurface flow, annual estimates of ground-water discharge presented here should be considered a minimum value of total outflow from a discharge area.
REFERENCES CITED
American Society of Photogrammetry, 1983, Manual of remote sensing: Falls Church, Va., The Sheridan Press, 2440 p.
Anderson, J.S., Hardy, E.E., Roach, J.T., and Witmer, R.E., 1976, A land use and land cover classification system for use with remote sensor data: U.S. Geological Survey Professional Paper 964, 28 p.
Andraski, B.J., 1997, Soil-water movement under natural-site and waste-site conditions: A multiple-year field study in the Mojave Desert, Nevada: Water Resources Research, v. 33, no. 8, p. 1901–1916.
Avery, T.E., and Berlin, G.L. 1992, Fundamentals of remote sensing and air photo interpretation, Upper Saddle River, New Jersey: Prentice Hall, 472 p.
Blankennagel, R.K., and Weir, J.E., Jr., 1973, Geohydrology of the eastern part of Pahute Mesa, Nevada Test Site, Nevada: U.S. Geological Survey Professional Paper 712-B, 35 p.
transpiration, Death Valley Regional Flow System

Bowen, I.S., 1926, The ratio of heat losses by conduction and by evaporation from any water surface: Physical Review, v. 27, p. 779–787.
Brutsaert, W.H., 1982, Evapotranspiration into the atmo-sphere—Theory, history, and applications: Boston, D. Reidel, 299 p.
Cardinalli, J.L., Roach, L.M., Rush, F.E., and Vasey, B.J., comps., 1968, State of Nevada hydrographic areas: Nevada Division of Water Resources map, 1:500,000 scale.
Chaplin, S.J, Gerrard, R.A., Watson, H.M., Master, L.L., and Flack, S.R., 2000, The geography of imperilment: Targeting conservation toward critical biodiversity areas, in Stein, B.A, Kutner, L.S., and Adams, J.S., eds., Precious heritage: The status of biodiversity on the United States: New York, Oxford Press, p. 159–200.
Crowley, J.K., 1986, Visible and near infrared spectra of car-bonate rocks—Reflectance variations related to petro-graphic textures and impurities: Journal of Geophysical Research, v. 91, no. B5, p. 5001–5012.
Czarnecki, J.B., 1997, Geohydrology and evapotranspiration at Franklin Lake playa, Inyo County, California, with a section on estimating evapotranspiration using the energy-budget eddy-correlation technique by Stannard, D.I.: U.S. Geological Survey Water-Supply Paper 2377, 75 p.
Czarnecki, J.B., and Waddell, R.K., 1984, Finite-element simulation of ground-water flow in the vicinity of Yucca Mountain, Nevada–California: U.S. Geological Survey Water-Resources Investigations Report 84-4349, 38 p.
D’Agnese, F.A., Faunt, C.C., Turner, A.K., and Hill, M.C., 1997, Hydrogeologic evaluation and numerical simula-tion of the Death Valley regional ground-water flow system, Nevada and California: U.S. Geological Survey Water-Resources Investigations Report 96-4300, 124 p.
Daly, C., Nielson, R.P., and Phillips, D.L., 1994, A statisti-cal-topographic model for mapping climatological pre-cipitation over mountainous terrain: Journal of Applied Meteorology, v. 33, p. 140–158.
DeMeo, G.A., Laczniak, R.J., and Nylund, W.E., 1999, Estimating evapotranspiration rates in Death Valley California [abs]: in Slate, J.L., ed., Proceedings of conference on status of geologic research and mapping in Death Valley National Park, Las Vegas, Nevada, April 9–11, 1999: U.S. Geological Survey Open-File Report 99-153, p. 68.
Dettinger, M.D., Harrill, J.R., Schmidt, D.L., and Hess, J.W., 1995, Distribution of carbonate-rock aquifers and the potential for their development, southern Nevada and parts of Arizona, California, and Utah: U.S. Geological Survey Water-Resources Investigations Report 91-4146, 100 p.
Dudley, W.W., Jr., and Larson, J.D., 1976, Effects of irriga-tion pumping on desert pupfish habitats in Ash Mead-ows, Nye County, Nevada: U.S. Geological Survey Professional Paper 927, 52 p.
Gatewood, J.S., Robinson, T.W., Colby, B.R., Hem, J.D., and Halpenny, L.C., 1950, Use of water by bottom-land vegetation in lower Safford Valley, Arizona: U.S. Geological Survey Water-Supply Paper 1103, 210 p.
Gay, L.W., and Fritschen, L.J., 1979, An energy budget anal-ysis of water use by saltcedar: Water Resources Research, v. 15, no. 6, p. 1589–1592.
Goetz, A.F.H., Rock, B.N., and Rowen, L.C., 1983, Remote sensing for exploration—An overview: Economic Geology, v. 78, no. 4, p. 573–590.
Hardman, George, 1965, Nevada precipitation map, adapted from map prepared by George Hardman, Victor Kral, and others, 1936: University of Nevada Reno, Nev., Agricultural Experimental Station Bulletin 185, 27 p.
Harrill, J.R., Gates, J.S., and Thomas, J.M., 1988, Major ground-water flow systems in the Great Basin region of Nevada, Utah, and adjacent states: U.S. Geological Survey Hydrologic Investigations Atlas HA-694-C, scale 1:1,000,000, 2 sheets.
Harrill, J.R., and Prudic, D.E., 1998, Aquifer systems in the Great Basin Region of Nevada, Utah, and adjacent states--Summary report: U.S. Geological Survey Pro-fessional Paper 1409-A, 66 p.
Hoffer, R.M., and Johannsen, C.J., 1969, Ecological poten-tials in spectra signatures and analysis, in Johnson, P.L., ed., Remote sensing in ecology: Athens, University of Georgia Press, p. 1–16.
Houghton, J.G., Sakamoto, C.M., and Gifford, R.O., 1975, Nevada’s weather and climate: Nevada Bureau of Mines and Geology Special Publication 2, 78 p.
Johnson, M.J., 1993, Micrometeorological measurements at Ash Meadows and Corn Creek Springs, Nye and Clark Counties, Nevada, 1986–87: U.S. Geological Survey Open-File Report 92-650, 41 p.
Laczniak, R.J., Cole, J.C., Sawyer, D.A., and Trudeau, D.A., 1996, Summary of hydrogeologic controls on ground-water flow at the Nevada Test Site, Nye County, Nevada: U.S. Geological Survey Water-Resources Investigations Report 96-4109, 59 p.
Laczniak, R.J., DeMeo, G.A., Reiner, S.R., Smith, J.L., and Nylund, W.E., 1999, Estimates of ground-water discharge as determined from measurements of evapo-transpiration, Ash Meadows area, Nye County, Nevada: U.S. Geological Survey Water-Resources Investiga-tions Report 99-4079, 70 p.
Lee, C.H., 1912, An intensive study of the water resources of a part of Owens Valley, California: U.S. Geological Survey Water-Supply Paper 294, 135 p.
Lillesand, T.M., and Kiefer, R.W., 1987, Remote sensing and image interpretation: New York, John Wiley, 721 p.
REFERENCES CITED 39

40
Malmberg, G.T., 1967, Hydrology of the valley-fill and carbonate-rock reservoirs, Pahrump Valley, Nevada–California: U.S. Geological Survey Water-Supply Paper 1832, 47 p.
Malmberg, G.T., and Eakin, T.E., 1962, Ground-water appraisal of Sarcobatus Flat and Oasis Valley, Nye and Esmeralda Counties, Nevada: Nevada Department of Conservation and Natural Resources, Ground-Water Resources—Reconnaissance Series Report 10, 39 p.
Milton, Nancy, 1978, Spectral reflectance measurements of plants in the East Tintic Mountains of Utah: U.S. Geological Survey Open-File Report 78-448, 123 p.
Nichols, W.D., 1993, Estimating discharge of shallow groundwater by transpiration from greasewood in the northern Great Basin: Water Resources Research, v. 29, no. 8, p. 2771–2778.
——— 2001, Regional ground-water evapotranspiration and ground-water budgets, Great Basin, Nevada: U.S. Geo-logical Survey Professional Paper 1628.
Pistrang, M.A., and Kunkel, Fred, 1964, A brief geologic and hydrologic reconnaissance of the Furnace Creek Wash Area, Death Valley National Monument, California: U.S. Geological Survey Water-Supply Paper 1779-Y, 35 p.
Podwysocki, M.H., and Segal, D.B., 1983, Use of multispec-tral scanner images for assessment of hydrothermal alterations in Marysvale, Utah, mining area: Economic Geology, v. 78, p. 675–687.
Qi, J., Chehbouni, A., Huerte, A.R., Kerr, Y.H., and Sorooshian, S., 1994, A modified soil adjusted vegetation index: Remote Sensing Environment, v. 48, p. 119–126.
Reiner, S.R., Laczniak, R.J., DeMeo, G.A., Smith, J.L., Elliott, P.E., Nylund, W.E., and Fridrich, C.J., 2002, Ground-water discharge determined from measure-ments of evapotranspiration, other available hydrologic components, and shallow water-level changes, Oasis Valley, Nye County, Nevada: U.S. Geological Survey Water-Resources Investigations Report 01-4239, 66 p.
Robinson, T.W., 1958, Phreatophytes: U.S. Geological Sur-vey Water-Supply Paper 1423, 84 p.
Rush, F.E., 1968, Water resources appraisal of Clayton Val-ley-Stonewall Flat area, Nevada and California: Nevada Department of Conservation and Natural Resources, Water Resources—Reconnaissance Series Report 45, 54 p.
Ground-Water Discharge Determined from Estimates of Evapotran
Stewart, J.H., 1980, Geology of Nevada: Nevada Bureau of Mines and Geology Special Publication 4, 136 p.
Ustin, S.L., 1992, Thematic mapper vegetation cover model, Chapter F, in Wilson, D.H., Reginato, R.J., and Hollett, K.J., eds., Evapotranspiration measurements of native vegetation, Owens Valley, California, June 1986: U.S. Geological Survey Water-Resources Investigations Report 91-4159, 83 p.
Waddell, R.K., Robison, J.H., and Blankennagel, R.K., 1984, Hydrology of Yucca Mountain and vicinity, Nevada-California—Investigative results through mid-1983: U.S. Geological Survey Water-Resources Investiga-tions Report 84-4267, 72 p.
Walker, G.E., and Eakin, T.E., 1963, Geology and ground water of Amargosa Desert, Nevada-California: Nevada Department of Conservation and Natural Resources, Ground Water Resources-Reconnaissance Report 14, 45 p.
Weeks, E.P., Weaver, H.L., Campbell, G.S., and Tanner, B.D., 1987, Water use by saltcedar and by replacement vegetation in the Pecos River flood plain between Acme and Artesia, New Mexico: U.S. Geologcal Survey Pro-fessional Paper 491-G, 33 p.
White, W.N., 1932, A method of estimating ground-water supplies based on discharge by plants and evaporation from soil, results of investigations in Escalante Valley, Utah: U.S. Geological Survey Water-Supply Paper 659-A, 165 p.
Winograd, I.J., and Pearson, F.J., Jr., 1976, Major carbon-14 anomaly in a regional carbonate aquifer—Possible evidence for megascale channeling, south-central Great Basin: Water Resources Research, v. 12, no. 6, p. 1125–1143.
Winograd, I.J., and Thordarson, William, 1975, Hydrogeo-logic and hydrochemical framework, south-central Great Basin, Nevada-California, with special reference to the Nevada Test Site: U.S. Geological Survey Profes-sional Paper 712-C, 126 p.
Young, A.A., and Blaney, H.F., 1942, Use of water by native vegetation: California Department of Public Works, Division of Water Resources Bulletin 50, 154 p.
spiration, Death Valley Regional Flow System

APPENDIX
APPENDIX
APPENDIX 41

42 Ground-Water Discharge Determined from Estimates of Evapotranspiration, Death Valley Regional Flow System

The objective of this analysis is to quantify the uncertainty associated with estimates of annual ground-water discharge from the nine discharge areas addressed in the main body of this report (table 2). Because discharge estimates are expected to be used as targets for calibrating ground-water flow models, it was considered beneficial to quantify, at least in a general sense, the uncertainty associated with these estimates. The results of this evaluation can be used to better understand the uncertainty associated with each dis-charge estimate and to appropriately weight estimates to best constrain model results. For this effort, uncer-tainty is evaluated through Monte Carlo simulations performed using Crystal Ball (Decisioneering, 1996, Crystal Ball Version 4.0), a Microsoft Excel add-in. The input parameters required for Monte Carlo analysis include an estimate of the annual precipitation rate for each discharge area, and estimates of the acreage and ET rate for each of the ET units within a discharge area. Although 10 ET units are identified throughout the study area (table 1), not all are present within each discharge area. In this analysis, a total of 141 input parameters were used to evaluate the uncertainty in estimates of discharge: 61 acreages, 61 ET rates, and 9 precipitation rates (tables 5 and 7).
For this basic analysis, each input parameter is assumed to be characterized by a normal distribution centered about a mean value. The mean of each input parameter is the value of the parameter as estimated in tables 5 and 7. The spread about the mean is described by the coefficient of variability (CV), which is defined as the standard deviation divided by the mean. The CV used for the acreage of each ET unit listed in table 7 is assumed to be 10 percent. A CV value of 10 percent is considered reasonable based on accuracy assess-ments of about 90 percent for ET-unit classifications of the Ash Meadows and Oasis Valley dischare areas (Laczniak and others, 1998; and Reiner and others, 2002, respectively). The CV for each ET rate was deter-mined from ranges listed in table 4, and for each precip-itation rate from measurements given in tables 8 and 9.
CV values for the ET rate and precipitation parameters are computed on the assumption that ranges represent ±2 standard deviations of a normal population (95 per-cent of the measurements are contained in the range; table 11).
The general procedure used to quantify the uncer-tainty in estimates of ground-water discharge consists of four basic steps:
1. Randomly selecting a value from the normal distribution of each input parameter. For exam-ple, 17 random values were selected for the 8 ET units in Ash Meadows discharge area (tables 5 and 7): 8 for acreage, 8 for ET rate, and 1 for the precipitation rate;
2. Adjusting the selected ET rate of each ET unit by subtracting the selected precipitation rate;
3. Multiplying the adjusted ET rate by its selected acreage to calculate the annual rate of ground-water discharge from each ET unit; and
4. Summing ET-unit discharges and acreages within each discharge area to compute totals.
This process of randomly selecting values for each input parameter and calculating the annual dis-charge from each discharge area is termed a realization. A test performed to determine the number of realiza-tions needed to produce stable estimates of the standard deviation generated frequency distributions and statis-tics of annual discharge from sample sizes of 500; 1,000; 2,000; and 3,000 realizations. Test results indi-cated that a sample size of 1,000 realizations was suffi-cient.
To exemplify this general procedure, Monte Carlo results of the Ash Meadows discharge area (table 12, figs. 17 and 18A) are discussed in some detail. Table 12 gives the mean acreage, ET rate and precipitation rate calculated from 1,000 realizations. The table also gives the adjusted ET rate (calculated by subtracting the mean precipitation rate from the mean ET rate), annual ET,
Uncertainty and Sensitivity Analysis of Annual Estimates of Ground-Water Discharge for Death Valley Regional Flow System
By Gaius J. Roemer, GeoTrans
APPENDIX 43
and annual ground-water discharge computed for each ET unit and the totals. Summary tables for the eight other discharge areas are given in tables 13–20.
The eight input parameters to which annual ground-water discharge in Ash Meadows is most sensi-tive are shown in figure 17. The sensitivity of each parameter is measured by rank correlation (correlation based on ranks rather than on values). Because ET units 6 and 5, respectively, are the largest contributors to ground-water discharge at Ash Meadows, their param-eters have the greatest effect on the estimate. The sen-sitivity of the precipitation rate always is negative because it is subtracted from the ET rate to calculate ground-water discharge.
The five input parameters from each of the nine discharge areas having the greatest effect on annual ground-water discharge are shown in figure 17. Because the precipitation rate is an essential compo-nent in calculating ground-water discharge from every ET unit, it always is one of the more sensitive input parameters. Typically the precipitation rate and the ET rate associated with the largest ET unit are the two most sensitive parameters. The lone exception is Oasis Val-ley, where ET units 4 and 6 have the largest acreage but the ET rate associated with ET unit 8 is the most sensi-tive parameter. This anomaly can be explained in part by (1) the low CV of the ET rate for ET unit 4 (0.07) relative to that of ET units 6 and 8 (0.29 and 0.28, respectively; table 11), and (2) the high ET rate of ET unit 8 relative to ET unit 6 (1.92 and 1.19 ft/yr, respec-tively, table 16).
Descriptive statistics and a frequency chart gener-ated from 1,000 realizations of annual ground-water discharge for Ash Meadows are listed in table 21 and shown in figure 18A. The mean, standard deviation, and the coefficient of variability (CV) of the simulated ground-water discharge for all nine discharge areas are compared in table 22. Assuming that CV is a reason-able estimator of the relative uncertainty (larger values represent a greater uncertainty), the discharge esti-mates for Oasis Valley and the Tecopa/California Val-ley area are most certain (0.12 and 0.11, respectively) and those for Stewart Valley and Sarcobatus Flat are least certain (0.42 and 0.48, respectively). The largest CV values (those greater than 0.20) are associated with discharge areas made up of five or fewer ET units and/or with discharge areas dominated by open playa (ET unit 10). Sarcobatus Flat, which has only four ET units and 10,771 acres of open playa, has a CV of 0.48.
44 Ground-Water Discharge Determined from Estimates of Evapo
Whereas, Oasis Valley, which has nine ET units and only one acre of open playa, has a CV of 0.12. In gen-eral, the smaller the number of ET units the greater the uncertainty. Where fewer units are present, the greater uncertainty can be explained by the fact that deviations from the mean are less likely to compensate each other. In discharge areas dominated by open playa, the CV of the discharge estimate is high (table 22) because (1) the CV of the unit itself is high (0.38, table 11), and (2) the ET rate is low and usually not much greater than the estimated precipitation rate. Because ET and precipita-tion rates are similar in magnitude, the CV of their dif-ference is larger than the CV of either parameter. Figure 18 (B–I) presents descriptive statistics and fre-quency charts generated from 1,000 realizations of ground-water discharge in the eight other discharge areas.
An analysis of the Ash Meadows discharge area was used to examine the uncertainty associated with the classification procedure. In this analysis, classified ET units similar in terms of their spectral response (fig. 6) were correlated using a correlation coefficient of -1.0. Differences in the standard deviations generated from correlating different combinations of three similar ET units in Ash Meadows are listed in table 22. The three correlated ET units are ET unit 3 (dense wetland vegetation), ET unit 4 (dense meadow and forested vegetation), and ET unit 5 (dense to moderately dense grassland vegetation). The small differences (less than 2 percent, table 22) in the standard deviation of the first three combinations are attributed to (1) the decreased likelihood that the sampled area will be much greater than or less than their respective means, and (2) simi-larities in their ET rates. The program does not allow correlation of ET units 3, 4, and 5 by a coefficient of -1.0. Instead, the program determines the maximum allowable correlation coefficient at -0.5. Because effects of correlation are shown by this example to be minimal, any further efforts to correlate ET units were considered unnecessary.
An additional analysis was performed to evaluate uncertainty related to the assumption of a 10 percent CV for ET-unit acreage. Five Monte Carlo simulations of 1,000 realizations using CV values for acreage of 10, 20, 30, 40, and 50 percent resulted in similar mean val-ues having standard deviations that varied nearly pro-portionally with changes in the input CV. These results indicate that the predicted uncertainty in the estimate is nearly proportional to the CV of the acreage.
transpiration, Death Valley Regional Flow System

The accuracy of the uncertainty and sensitivity analyses can be improved by better quantifying the errors associated with the parameters used to compute ground-water discharge. The errors most significant to the procedure used are those errors inherent in the methods used to measure ET-unit acreage and to calcu-late ET rates. Of particular significance are errors asso-ciated with using spectral data from Thematic Mapper imagery to classify ET units and the Bowen ratio solu-
tion to compute ET rates. Having a more thorough and rigorous analysis of these errors would result in more realistic formulations of the distributions describing the acreage and ET rate of the individual ET units. Although these more accurate error estimates would improve estimates of uncertainty, they probably would not have a substantial effect on estimates of annual ground-water discharge.
Table 11. Values of coefficient of variability (CV) used in Monte Carlo analysis to simulate ground-water discharge: (A) evapotranspiration (ET) rate; and (B) precipitation rate
[Min., minimum; Max., maximum; R. Width, range width; SD, standard deviation; and CV, coefficient of variability]
A.
ET Unit Evapotranspiration rate (feet per year)
Min. Max. R. Width SD 1
1 Standard deviation assumes that the range represents 95 percent of the sample population.
Mean 2
2 Mean used in analysis is the value given for input parameter in tables 5 and 7.
CV
1 8.4 8.8 0.4 0.1 8.6 0.01
2 8.1 8.5 .4 .1 8.3 .01
3 3.7 4.3 .6 .15 4.0 .04
4 3.0 4.0 1.0 .25 3.5 .07
5 2.5 3.7 1.2 .3 3.1 .10
6 .6 2.3 1.7 .425 1.45 .29
7 2.2 3.0 .8 .2 2.6 .08
8 .7 2.5 1.8 .45 1.6 .28
9 .7 1.8 1.1 .275 1.25 .22
10 .1 .7 .6 .15 .4 .38
B.
Discharge area Precipitation rate (feet per year)
Mean Min. Max. R. Width SD1 CV
Ash Meadows 0.35 0.29 0.41 0.12 0.03 0.09
Chicago Valley .35 .27 .43 .16 .04 .11
Franklin Wells area .35 .29 .41 .12 .03 .09
Franklin Lake .33 .26 .41 .16 .04 .11
Oasis Valley .5 .42 .58 .16 .04 .08
Sarcobatus Flat .5 .33 .67 .34 .085 .17
Shoshone area .29 .21 .37 .16 .04 .14
Stewart Valley .35 .27 .43 .16 .04 .11
Tecopa/California Valley area
.29 .21 .37 .16 .04 .14
APPENDIX 45

46 Ground-Water Discharge Determined from Estimates of Evapotranspiration, Death Valley Regional Flow System
Table 12. Simulated mean annual evapotranspiration (ET) and ground-water discharge from Ash Meadows
[Data are simulated means of 1,000 realizations. Mean annual precipitation is 0.35 foot; —, no data or not applicable]
Evapotranspiration unit
1 2 3 4 5 6 7 8 9 10 Total
Area (acres) 159.2 81.0 385.2 486.2 1,497.8 7,075.3 553.1 0.0 0.0 2,238.2 12,477
ET rate (feet per year) 8.60 8.50 4.00 3.41 3.49 1.29 2.59 — — .50 —
Annual ET (acre-feet) 1,369.1 688.0 1,540.8 1,657.9 5,227.3 9,127.1 1,432.5 — — 1,119.1 22,162
Adjusted ET rate (feet per year) 8.25 8.15 3.64 3.06 3.14 0.93 2.24 — — 0.15 —
Annual ground-water discharge (acre-feet)
1,313.4 660.1 1,402.1 1,487.8 4,703.1 6,580.0 1,238.9 — — 335.7 17,721
Table 13. Simulated mean annual evapotranspiration (ET) and ground-water discharge from Chicago Valley
[Data are simulated means of 1,000 realizations. Mean annual precipitation is 0.35 foot; —, no data or not applicable]
Evapotranspiration unit
1 2 3 4 5 6 7 8 9 10 Total
Area (acres) 0.0 0.0 1.4 0.0 11.3 0.0 2.7 0.0 595.1 1.0 611
ET rate (feet per year) — — 4.10 — 3.30 — 2.79 — 1.00 .50 —
Annual ET (acre-feet) — — 5.7 — 37.3 — 7.5 — 595.1 .5 646
Adjusted ET rate (feet per year) — — 3.75 — 2.95 — 2.44 — 0.66 0.16 —
Annual ground-water discharge (acre-feet)
— — 5.2 — 33.4 — 6.6 — 390.1 .2 435
Table 14. Simulated mean annual evapotranspiration (ET) and ground-water discharge from Franklin Lake
[Data are simulated means of 1,000 realizations. Mean annual precipitation is 0.35 foot; —, no data or not applicable]
Evapotranspiration unit
1 2 3 4 5 6 7 8 9 10 Total
Area (acres) 0.0 0.0 0.0 0.0 9.0 548.3 147.6 135.7 0.0 1,494.0 2,335
ET rate (feet per year) — — — — 2.89 1.00 2.39 1.01 — .50 —
Annual ET (acre-feet) — — — — 26.0 548.3 352.8 137.1 — 747.0 1,811
Adjusted ET rate (feet per year) — — — — 2.56 0.67 2.06 0.68 — 0.18 —
Annual ground-water discharge (acre-feet)
— — — — 23.0 367.4 304.1 92.3 — 269.0 1,056
Table 15. Simulated mean annual evapotranspiration (ET) and ground-water discharge from Franklin Well area
[Data are simulated means of 1,000 realizations. Mean annual precipitation is 0.35 foot; —, no data or not applicable]
Evapotranspiration unit
1 2 3 4 5 6 7 8 9 10 Total
Area (acres) 0.0 0.0 0.0 12.9 15.2 0.0 0.5 0.0 268.0 0.0 297
ET rate (feet per year) — — — 3.40 3.29 — 2.80 — 1.32 — —
Annual ET (acre-feet) — — — 43.9 50.0 — 1.4 — 353.8 — 449
Adjusted ET rate (feet per year) — — — 3.05 2.94 — 2.45 — 0.97 — —
Annual ground-water discharge (acre-feet)
— — — 39.3 44.7 — 1.2 — 260.0 — 345

APPENDIX 47
Table 16. Simulated mean annual evapotranspiration (ET) and ground-water discharge from Oasis Valley
[Data are simulated means of 1,000 realizations. Mean annual precipitation is 0.35 foot; —, no data or not applicable]
Evapotranspiration unit
1 2 3 4 5 6 7 8 9 10 Total
Area (acres) 1.0 5.0 39.7 928.6 647.2 961.8 80.6 808.4 0.0 1.0 3,473
ET rate (feet per year) 8.60 8.50 4.20 3.10 3.09 1.19 2.69 1.92 — .50
Annual ET (acre-feet) 8.6 42.5 166.7 2,878.7 1,999.8 1,144.5 216.8 1,552.1 — .50 8,010
Adjusted ET rate (feet per year) 8.10 8.00 3.71 2.60 2.59 0.69 2.20 1.42 — 0.00
Annual ground-water discharge (acre-feet)
8.1 40.0 147.3 2,414.4 1,676.2 663.6 177.3 1,147.9 — .00 6,275
Table 17. Simulated mean annual evapotranspiration (ET) and ground-water discharge from Sarcobatus Flat
[Data are simulated means of 1,000 realizations. Mean annual precipitation is 0.35 foot; —, no data or not applicable]
Evapotranspiration unit
1 2 3 4 5 6 7 8 9 10 Total
Area (acres) 0.0 0.0 0.0 0.0 0.0 2,603.7 1,446.3 19,368.4 0.0 10,771.7 34,190
ET rate (feet per year) — — — — — .80 2.39 1.02 — .50 —
Annual ET (acre-feet) — — — — — 2,083.0 3,456.7 19,755.8 — 5,385.8 30,681
Adjusted ET rate (feet per year) — — — — — 0.30 1.90 0.52 — 0.00 —
Annual ground-water discharge (acre-feet)
— — — — — 781.1 2,748.0 10,071.6 — 0.00 13,601
Table 18. Simulated mean annual evapotranspiration (ET) and ground-water discharge from Shoshone area
[Data are simulated means of 1,000 realizations. Mean annual precipitation is 0.35 foot; —, no data or not applicable]
Evapotranspiration unit
1 2 3 4 5 6 7 8 9 10 Total
Area (acres) 0.0 1.0 12.0 62.0 341.7 658.5 152.4 21.9 135.9 0.0 1,385
ET rate (feet per year) — 8.40 4.30 3.60 2.81 .99 2.39 1.49 1.31 — —
Annual ET (acre-feet) — 8.4 51.6 223.2 960.2 651.9 364.2 32.6 178.0 — 2,470
Adjusted ET rate (feet per year) — 8.11 4.01 3.31 2.53 0.70 2.10 1.21 1.02 — —
Annual ground-water discharge (acre-feet)
— 8.1 48.1 205.2 864.5 461.0 320.0 26.5 138.6 — 2,072
Table 19. Simulated mean annual evapotranspiration (ET) and ground-water discharge from Stewart Valley
[Data are simulated means of 1,000 realizations. Mean annual precipitation is 0.35 foot; —, no data or not applicable]
Evapotranspiration unit
1 2 3 4 5 6 7 8 9 10 Total
Area (acres) 0.0 1.0 0.0 21.9 18.0 48.7 86.9 9.0 381.7 2,448.8 3,016
ET rate (feet per year) — 8.40 — 3.10 3.09 1.22 2.39 1.89 1.11 .49 —
Annual ET (acre-feet) — 8.4 — 67.9 55.6 59.4 207.7 17.0 423.7 1,199.9 2,040
Adjusted ET rate (feet per year) — 8.05 — 2.75 2.75 0.87 2.05 1.54 0.76 0.14 —
Annual ground-water discharge (acre-feet)
— 8.0 — 60.2 49.5 42.4 178.1 13.9 290.0 342.8 985

Table 20. Simulated mean annual evapotranspiration (ET) and ground-water discharge from Tecopa/California Valley area
[Data are simulated means of 1,000 realizations. Mean annual precipitation is 0.35 foot; —, no data or not applicable]
Evapotranspiration unit
1 2 3 4 5 6 7 8 9 10 Total
Area (acres) 2.0 11.9 16.0 656.1 379.3 394.5 896.3 45.2 1,105.4 8.0 3,515
ET rate (feet per year) 8.60 8.50 3.90 3.30 2.89 .89 2.39 1.81 1.20 .49 —
Annual ET (acre-feet) 17.2 101.2 62.4 2,165.1 1,096.2 351.1 2,142.2 81.8 1,326.5 3.9 7,348
Adjusted ET rate (feet per year) 8.31 8.21 3.60 3.01 2.60 0.60 2.10 1.52 0.91 0.20 —
Annual ground-water discharge (acre-feet)
16.6 97.7 57.6 1,974.9 986.2 236.7 1,882.2 68.7 1,005.9 1.6 6,328
Table 21. Summary statistics data and simulated means of 1,000 realizations by discharge area for the Monte Carlo analysis used to simulate annual ground-water discharge
Discharge Area
Simulated annual ground-water discharge (acre-feet)
Mean MedianRange width Standard
deviationCV a
a Coefficient of variability (CV) is standard deviation divided by mean.
Minimum Maximum
Ash Meadows 17,811 17,761 9,908 28,267 3,091 0.17
Chicago Valley 436 433 40 959 159 .36
Franklin Lake 1,096 1,057 237 2,372 352 .32
Franklin Well area 345 346 70 646 88 .26
Oasis Valley 6,287 6,290 4,169 8,922 773 .12
Sarcobatus Flat 15,005 14,655 2,014 37,791 7,187 .48
Shoshone area 2,075 2,071 1,167 2,639 316 .15
Stewart Valley 1,080 990 357 2,990 457 .42
Tecopa/California Valley area 6,319 6,313 4,448 8,342 673 .11
48 Ground-Water Discharge De
Table 22. Differences in the standard deviation of ground-water discharge estimates resulting from correlating similar ET units in Ash Meadows
[Abbreviation and symbol: ET, evapotranspiration; —, not applicable or no data]
Unit correlation Standard deviation Percent difference
None 3,091 —
ET units 3 and 4 3,139 1.55
ET units 4 and 5 3,095 .13
ET units 3 and 5 3,092 .03
ET units 3, 4, and 5 3,026 -2.10
termined from Estimates of Evapotranspiration, Death Valley Regional Flow System

Sarcobatus Flat
ET Unit 8 annual ET rate 0.71
Annual precipitation -.64
ET Unit 8 acreage .15
ET Unit 10 annual ET rate .11
ET Unit 7 annual ET rate .06
-1 -0.5 0 0.5 1Rank Correlation
Shoshone area
ET Unit 6 annual ET rate 0.61
Annual precipitation -.61
ET Unit 5 acreage .29
ET Unit 5 annual ET rate .28
ET Unit 6 acreage .19
Stewart Valley
ET Unit 10 annual ET rate 0.70
Annual precipitation -.56
ET Unit 9 annual ET rate .15
ET Unit 7 acreage .11
ET Unit 2 acreage -.08
Tecopa/California Valley area
Annual precipitation -0.67
ET Unit 9 annual ET rate .32
ET Unit 4 acreage .28
ET Unit 7 annual ET rate .24
ET Unit 7 acreage .20
-1 -0.5 0 0.5 1Rank Correlation
-1 -0.5 0 0.5 1Rank Correlation
-1 -0.5 0 0.5 1Rank Correlation
Ash Meadows
ET Unit 6 annual ET rate 0.86
Annual precipitation -.39
ET Unit 5 acreage .19
ET Unit 6 acreage .17
ET Unit 5 annual ET rate .15
ET Unit 4 annual ET rate .08
ET Unit 3 acreage .07
ET Unit 10 annual ET rate .05
-1 -0.5 0 0.5 1Rank Correlation
Chicago Valley
ET Unit 9 annual ET rate 0.87
Annual precipitation -.43
ET Unit 9 acreage .25
ET Unit 5 acreage .05
ET Unit 5 annual ET Rate -.04
-1 -0.5 0 0.5 1Rank Correlation
Franklin Lake
ET Unit 10 annual ET rate 0.58
Annual precipitation -.57
ET Unit 6 annual ET rate .36
ET Unit 6 acreage .14
ET Unit 8 annual ET rate .13
-1 -0.5 0 0.5 1Rank Correlation
Oasis Valley
ET Unit 8 annual ET rate 0.56
ET Unit 6 annual ET rate .43
Annual precipitation -.35
ET Unit 4 acreage .35
ET Unit 5 annual ET rate .29
-1 -0.5 0 0.5 1
Franklin Well area
ET Unit 9 annual ET rate 0.89
ET Unit 9 acreage .30
Annual precipitation -.30
ET Unit 5 annual ET rate .09
ET Unit 4 acreage .05
-1 -0.5 0 0.5 1Rank Correlation
Rank Correlation
Figure 17. Parameters having the greatest effect on simulated annual ground-water discharge measured by Rank Correlation.
APPENDIX 49

50 Ground-Water Discharge D
ACRE-FEET PER YEAR
0
0.008
0.016
0.023
0.031
0
7.75
15.5
23.25
31
7,500 12,500 17,500 22,500 27,500
A. Ash Meadows
PR
OB
AB
ILIT
Y FRE
QU
EN
CY
Assumed mean (18,000) 2 outliers
0.000
0.007
0.015
0.022
0.029
0
7.25
14.5
21.75
29
0 225 450 675 900
B. Chicago Valley P
RO
BA
BIL
ITY FR
EQ
UE
NC
Y
Assumed mean (430) 2 outliers
ACRE-FEET PER YEAR
ACRE-FEET PER YEAR
0
0.009
0.017
0.026
0.034
0
8.5
17
25.5
34
0 563 1,125 1,688 2,250
C. Franklin Lake
PR
OB
AB
ILIT
Y FRE
QU
EN
CY
Assumed mean (1,000) 1 outlier
ACRE-FEET PER YEAR
0
0.008
0.017
0.025
0.033
0
8.25
16.5
24.75
33
4,000 5,125 6,250 7,375 8,500
E. Oasis Valley
PR
OB
AB
ILIT
Y FRE
QU
EN
CY
Assumed mean (6,200) 5 outliers
0
0.007
0.015
0.022
0.029
0
7.25
14.5
21.75
29
100 225 350 475 600
D. Franklin Well area
PR
OB
AB
ILIT
Y FRE
QU
EN
CY
Assumed mean (350) 7 outliers
ACRE-FEET PER YEAR
Figure 18. Frequency charts generated from 1,000 realizations of simulated annual ground-water discharge from major discharge areas.
etermined from Estimates of Evapotranspiration, Death Valley Regional Flow System

Figure 18. Frequency charts generated from 1,000 realizations of simulated annual ground-water discharge from major discharge areas — Continued.
ACRE-FEET PER YEAR
0.000
0.006
0.013
0.019
0.025
0
6.25
12.5
18.75
25
0 8,750 17,500 26,250 35,000
F. Sarcobatus Flat
PR
OB
AB
ILIT
Y FRE
QU
EN
CY
Assumed mean (13,000) 5 outliers
ACRE-FEET PER YEAR
0.000
0.008
0.015
0.023
0.030
0
7.5
15
22.5
30
1,250 1,688 2,125 2,563 3,000
G. Shoshone area P
RO
BA
BIL
ITY FR
EQ
UE
NC
Y
Assumed mean (2,100) 7 outliers
ACRE-FEET PER YEAR
0.000
0.010
0.020
0.029
0.039
0
9.75
19.5
29.25
39
250 813 1,375 1,938 2,500
H. Stewart Valley
PR
OB
AB
ILIT
Y FRE
QU
EN
CY
Assumed mean (1,000) 2 outliers
ACRE-FEET PER YEAR
0.000
0.007
0.014
0.021
0.028
0
7
14
21
28
4,500 5,500 6,500 7,500 8,500
I. Tecopa/California Valley area
PR
OB
AB
ILIT
Y FRE
QU
EN
CY
Assumed mean (6,400)4 outliers
APPENDIX 51