Embed Size (px)
Citation preview

Ground Water in the Vicinity of American Falls Reservoir, Idaho
M. J. MUNDORFF
GEOLOGICAL SURVEY WATER-SUPPLY PAPER 1846
Prepared in cooperation with the U.S. Bureau of Reclamation
UNITED STATES GOVERNMENT PRINTING OFFICE, WASHINGTON : 1967

UNITED STATES DEPARTMENT OF THE INTERIOR
STEWART L. UDALL, Secretary
GEOLOGICAL SURVEY
William T. Pecora, Director
Library of Congress catalog-card No. OS 67-257
For sale by the Superintendent of Documents, U.S. Government Printing Office Washington, D.G. 20402

CONTENTS
PageAbstract.________________________________________________________ 1Introduction.__-_-_-------_-___-___-______________________________ 2
Purpose and scope of investigation.____________________________ 3Previous studies.______________________________________________ 4Acknowledgments-____________________________________________ 5Well-numbering system._______________________________________ 5
Geologic setting as related to the water regimen.______________________ 6General physical setting-_______________________________________ 6Geologic units and their water-bearing character._________________ 8Structural control of ground water.__________________-__---_--___ 10
Water regimen in the American Falls Reservoir area___._____-_------__ 12Development of diversions for irrigation._________________________ 13Fluctuations of the water table___-_-_____-___________-_--_-__--_ 14Water budget, American Falls Reservoir reach-________---_____--_ 22Water budget, Neeiey to Minidoka reach.___._--______--___---_ 36Spring discharge below American Falls Dam________:_____________ 38Seepage loss from American Falls Reservoir.________.__-__-__-__ 41Effect on the water regimen of raising the reservoir level.__________ 41
Increased seepage loss_---_----___-__-_---_-------_-_-----_- 42Decreased ground-water inflow._________________-__-_-_---__ 44Drainage problems.___-__________-_-__-__-_-___-_--------- 44
Conclusions.___ _ ________________________________________________ 45References. _______________________________________________________ 46Basic Data-----__--------------------------_-----------_--------- 49
Records of selected wells near American Falls Reservoir.___________ 50Analysis of ground-water inflow to American Falls Reservoir____--__ 56
ILLUSTRATIONS
[Plates are In pocket]
PLATE 1. Map showing physical and hydrologic features of tl <j Snake River Plain east of Bliss, Idaho.
2. Map showing selected hydrologic and geologic featur?s in American Falls Reservoir area, Idaho.
3. Fence diagram showing the subsurface geology in the vicinity of the southwest end of American Falls Reservoir, Idaho.
4. Water-table profiles and geologic section in American Falls Reservoir area, Idaho.
5. Water-table contour map showing location of wells and springs in the American Falls Reservoir area, Idaho.
in

IV CONTENTS
Page FIGURE 1. Map showing location of area described in this report-___ 2
2. Sketch showing well-numbering system.________________ 63. Map showing geology in the vicinity of American Falls
Dam_-----___-------__-------_-------------_---_ 94-8. Hydrographs:
4. Wells 4S-32E-9dcl, 4S-33E-15bb2, and 4S-34E-5ccl_ __ _ -- ___- 16
5. Wells 5S-3lE-27abl and 5S-32E-6dd !__.____ .___ 176. Wells 6S-31E-7bal, 6S-3lE-llbcl, and 6S-31E-
30dal_----------------_---------_--------_ 187. Wells 7S-30E-13dcl, 7S-30E-15aal, 7S-30E-
15aa2, 7S-30E-24ddl, 7S-30E-26ddl, 7S-30E- 28bbl, 7S-3lE-22cbl, 7S-3lE-30cbl, and Amer ican Falls Reservoir.__-_____----_.______-___ 19
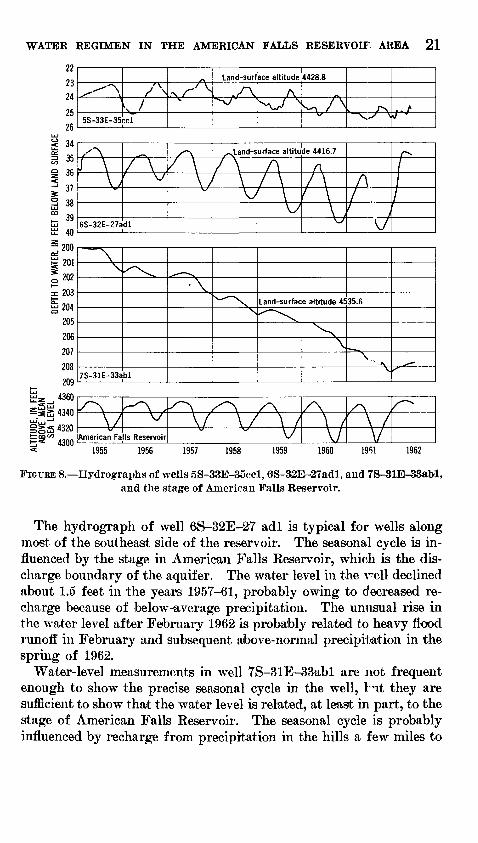
8. Wells 5S-33E-35ccl, 6S-32E-27adl, and 7S-31E- 33abl, and the stage of American Falls Res ervoir. ____________________________________ 21
9-12. Graphs showing 9. Irrigated area and irrigation diversionr to Snake
River Plain upstream from American Falls Dam and ground-water inflow in American Falls Res ervoir reach, 1900-60___---_-----____________ 25
10. Relation between 5-year progressive average of irrigation diversions to the area above American Falls Dam and inflow to the Amen can Falls Reservoir reach___-__---__----__-__-________ 29
11. Ground-water inflow to American Falls Reservoirand the hydrograph of well 5S-31E-27abl_ _ _ _ _ 33
12. Ground-water inflow to American Falls Reservoir plotted against midmonth water levels in well 5S-31E-27abl-___ _______ 34
13. Hydrographs of discharge from Rueger Spring and thestage in American Falls Reservoir.__________________ 39
14. Hydrographs of wells 7S-30E-12cal and 7S-30E-14dcl(perched water table) and of American Falls Reservoir. 43
TABLES
Page TABLE 1. Character and water-bearing properties of geologic units
in the American Falls Reservoir area_______________ 112. American Falls Reservoir inflow analysis _______ _______ 263. Deviation of inflow from straightline relations of inflow and
water level; and the stage in American Falls Peservoir._ 35
GROUND WATER IN THE VICINITY OF AMERICAN FALLS RESERVOIR, IDAHO
By M. J. MUNDORFF
ABSTRACT
Analysis of ground- and surface-water relationships suggests1 that increas ing the capacity of the American Falls Reservoir by raising the height of the dam 15 feet would increase leakage from the reservoir by less tl in 0.2 percent of the average inflow to the reservoir, or less than 10,000 acre feet per year. This amount is less than one-tenth of the evaporation rate from tl 3 reservoir.
The American Falls Reservoir lies near the south margin of the Snake River Plain in southeastern Idaho. The Snake River Plain is about 200 miles long and averages nearly 60 miles in width. It is underlain by a thick sequence of basaltic lava flows, interbedded pyroclasties, and sedimentary deposits. The uppermost few thousand feet of this sequence is the Snake Plain aquifer, one of the great aquifers of the United States.
Recharge to the aquifer is chiefly by water percolating from the T^ake River, its tributaries, and irrigated tracts, and by underflow from surrounding areas. Ground water moves generally southwestward and discharges to t^re Snake River through springs in the American Falls Reservoir reach and in the Hagerman Valley reach (between Twin Falls and Bliss).- Total discharge from the aquifer is about 9,000 cfs (cubic feet per second).
The occurrence and movement of ground water in the vieinit^ of American Falls Reservoir are controlled by the local geology. Silt and tuff in the Neeley Formation and the Walcott Tuff and silt and fine sand in the FT ft Formation and American Falls Lake Beds have a low permeability. These rocks transmit little ground water compared with the basalt and intercalated pyroclasties and gravels of the Snake Plain aquifer. The less permeable deposits underlie the reservoir area and act as a barrier to the movement of ground witer.
Under present conditions the water table on the periphery of the reservoir slopes toward the reservoir, except within 3 or 4 miles of the dam, where the water table slopes away from the reservoir. Most of the springs discharge at altitudes above 4,370 feet, some 15 feet above the maximum r-^servoir stage. Thus, reservoir stage has little effect on ground-water inflow to the reservoir.
A fairly close relationship exists between the annual amount of surface water diverted for irrigation of lands up the Snake River from the reservoir and the annual ground-water discharge through springs for the period 1911-60. After about 1952, greatly increased ground-water withdrawals from wells, which in creased consumptive use, virtually balanced increased diversions from the sur face-water^ system for irrigation, so that ground-water inflow to the reservoir remained about constant.

2 GROUND WATER, AMERICAN FALLS RESERVOIR, IDAHO
All or nearly all the seepage loss from the reservoir reappear* at the surface as seeps or springs along the reach between American Falls Dam and Minidoka Dam. Rough estimates of seepage loss were made from water-budget calcula tions below the reservoir and by extrapolating spring-flow data below the reser voir. Although both estimates are in close agreement, neither is probably reli able except as an order of magnitude. The best estimates are as follows:
Existing seepage loss: average, 60 cf s; maximum, 80 cf s.Seepage loss if dam is raised 15 feet: average, 70 cfs; maximum, <100 cfs.
The net effect of raising the maximum reservoir stage by 15 feet would betwofold: seepage loss would be increased by about 10 cfs, and some areas in thevicinity of Sterling and Springfield would become waterlogged. The decrease inannual inflow to the reservoir would probably be negligible.
INTRODUCTION
American Falls Reservoir (fig. 1) is on the Snake Eiver in south eastern Idaho. It is the largest reservoir for storage of irrigation water in Idaho (1.7 million acre-ft. capacity at an altitude of 4,354.50 ft. above sea level). American Falls Dam is not only downstream
117- 116°
117° 116° 115- 114= 113- 112° 111°
FIGURE 1. Location of area described in this report (shaded).
INTRODUCTION 6
from all major tributaries in eastern Idaho (except Big Wood Kiver), it also receives ground-water inflow averaging about 2,500 cfs (cubic feet per second) in the reservoir reach and in the river reach several miles upstream from the reservoir. Irrigation agriculture is the dom inant factor in the economy of southern Idaho, and American Falls Reservoir is an integral part of the Bureau of Reclamation's plans for the development of the water resources of the area for irrigation.
PURPOSE AND SCOPE OF INVESTIGATION
The investigation was undertaken in cooperation with the U.S. Bu reau of Reclamation. The Bureau was investigating th-*, practicality of substantially increasing the capacity of the American Falls Res ervoir by raising the height of the dam. Raising the dam 10 feet would provide an additional capacity of 600,000 acre-fe^t; a dam 15 feet higher would increase the capacity by about 900,000 acre-feet. The Bureau asked the Geological Survey to supply inf conation con cerning the effects on the hydrologic regimen that would be caused by raising the dam.
This report presents a semiquarititative appraisal of the effects of the proposed changes on the hydrologic regimen and g^ves estimates of the quantities of water involved. Water budgets are prepared for the reservoir reach and for the reach of the Snake River immediately downstream between Neeley and Minidoka, using all available data.
The report discusses the extent of the ground-water inflow to the reservoir and the effect of change in reservoir stage on amount and location of ground-water inflow. The amount and location of the present seepage losses from the reservoir are also discus^d. The re port includes information on the relationship between reservoir stage and the amount of seepage loss and comments upon tl ^ amount of seepage losses to be expected with an increase in stage. Finally, the report discusses what effect the raising of the reservoir stage will have on drainage of adjacent irrigated lands and ground-water inflow to the reservoir.
The following methods of investigation were used in carrying out the investigation: The surficial geology was compiled in part from a manuscript geologic map prepared by Trimble and Carr c^ the Geolog ical Survey, supplemented by geologic mapping on aerial photographs and by the use of miscellaneous geologic data in the files o* the Geologi cal Survey. All available well logs were collected, studied, and correlated. Graphic sections were prepared to show the geologic controls on the movement o'f ground water. Water levels were measured periodically in about 45 wells; several continuous water-level recorders were maintained to provide information on tH relation of
4 GROUND WATER, AMERICAN FALLS RESERVOIR, IDAHO
irrigation to water level and the relation of reservoir stage to water level. Periodic discharge measurements were made at several places to find the seasonal variations of inflow and outflow.
Field work included geologic mapping, well canvass; ng, measuring of water levels in a large number of wells (once in tl °, autumn and again in the spring), periodic measuring of water levels in selected ob servation wells, and measuring discharge at selected spring outlets. The U.S. Bureau of Reclamation determined the altitudes of the measuring points of about 190 wells in the area.
PREVIOUS STUDIES
The investigation was greatly facilitated by informs tion contained in reports of previous investigations. These reports are listed in "References."
The earliest known geologic map of any part of the area was made by Mansfield (1920), who mapped the northeast end of the reservoir area. Piper (1924) mapped the surficial geology of the southwestern part of the area in connection with a two-county study of petroleum possibilities, and his geologic findings have been drawn upon in this report. Hydrologic and geologic studies to evaluate reservoir-site conditions were made by personnel of the U.S. Bureau c f Reclamation prior to construction of the American Falls Dam from 1922-26 (writ ten commun., D. L. Crandall, January 18, 1961). In 1927 and 1928, T. R. Newell (1928, 1929) made a detailed hydrologic study of the reservoir area and compiled a water budget for the area. He de veloped a formula for computing ungaged ground-water inflow to the reservoir basin that is still being used. During the period 1928- 30, Stearns, Crandall, and Steward (1938) studied the ground-water resources of the entire eastern Snake River Plain and mapped the geology of the plain, including the American Falls Reservoir area.
In September 1934, C. P. Berkey (1934) made a bref reconnais sance of the geology of the reservoir area to appraise potential res ervoir leakage if the dam were raised. A report by Debler and Riter (1935) evaluated inflow, outflow, bank storage, and seepage losses. Both of these appraisals are of interest because they are based on pro cedures that are similar to the ones used in the present analysis. In 1950-51, the U.S. Bureau of Reclamation drilled a number of core holes immediately downstream from American Falls Dam to deter mine the subsurface geologic conditions, and the geolog" of the reach below the dam was mapped in detail (Jarrard and Mead, 1951,1952). The logs of these test holes were used in this report to prepare the

INTRODUCTION 5
fence diagram showing the subsurface geology near the southwest end of American Falls Eeservoir.
In 1952 the U.S. Geological Survey, in cooperation with Water Dis trict 36 and the Idaho Department of Eeclamation, began a continuing program for measuring water levels in observation well? near the res ervoir (Shuter, 1953; Sisco and Luscombe, 1961). During 1956-59 the Geological Survey, in cooperation with the U.S. Bureau of Eec lamation, made a quantitative appraisal of the ground-water resources of the Snake Eiver Plain (Mundorff and others, 1960). That report was regional in scope and covered all the area covered by this report as well as contiguous areas.
In 1957, members of the Geological Survey began mapping the geology of several quadrangles in the area, including the American Falls, Eockland, Yale, and Michaud 15-minute quadrangles. Map ping in some of the quadrangles was in progress in 19f 2. Can* and Trimble's (1963) geologic map of the American Falls quadrangle helped in delineating the geology both in the vicinity of the dam and in the strip along the west side of the reservoir.
ACKNOWLEDGMENTS
The study was financed by the U.S. Bureau of Keclamation. The friendly cooperation of well drillers and well owners in this area is gratefully acknowledged. The Falls Irrigation District, the Aber deen-Springfield Canal Co., the Idaho Department of Keclamation, and the U.S. Bureau of Eeclamation furnished informat'on from their files and cooperated in other ways.
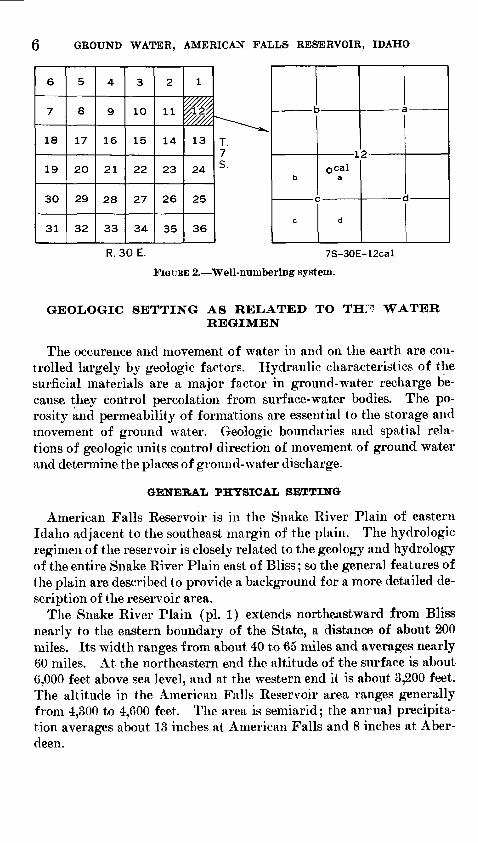
WELL-NUMBERING SYSTEM
The well-numbering system used in Idaho by the Geological Survey indicates the location of wells within the official rectangular subdivi sions of the public lands with reference to the Boise base line and meridian. The first two segments of a number designate the town ship and range. The third segment gives the section number fol lowed by two letters and a numeral which indicate the quarter sec tion, the quarter-quarter section or 40-acre tract, and the serial number of the well within the tract, Quarter sections are lettered a, b, c, and d in counterclockwise order from the northeast quarter of each section (fig. 2). Within the quarter sections, 40-acre tracts are let tered in the same manner. Well TS-30E-12cal is in th«, sec. 12, T. 7 S., R. 30 E. and is the first visited well in that tract.
6 GROUND WATER, AMERICAN FALLS RESERVOIR, IDAHO
6
7
18
19
30
31
5
8
17
20
29
32
4
9
16
21
28
33
3
10
15
22
27
34
2
11
14
23
26
35
1
m13
24
25
36
R. 30 E.
-12-ocal
7S-30E-12cal
FIGURE 2. Well-numbering system.
GEOLOGIC SETTING AS RELATED TO THE WATERREGIMEN
The occurence and movement of water in and on the earth are con trolled largely by geologic factors. Hydraulic characteristics of the surficial materials are a major factor in ground-water recharge be cause they control percolation from surface-water bodies. The po rosity and permeability of formations are essential to the storage and movement of ground water. Geologic boundaries and spatial rela tions of geologic units control direction of movement of ground water and determine the places of ground-water discharge.
GENERAL PHYSICAL SETTING
American Falls Reservoir is in the Snake River Plain of eastern Idaho adjacent to the southeast margin of the plain. The hydrologic regimen of the reservoir is closely related to the geology and hydrology of the entire Snake River Plain east of Bliss; so the general features of the plain are described to provide a background for a more detailed de scription of the reservoir area.
The Snake River Plain (pi. 1) extends northeastward from Bliss nearly to the eastern boundary of the State, a distance of about 200 miles. Its width ranges from about 40 to 65 miles and averages nearly 60 miles. At the northeastern end the altitude of the surface is about 6,000 feet above sea level, and at the western end it is about 3,200 feet. The altitude in the American Falls Reservoir area ranges generally from 4,300 to 4,600 feet. The area is semiarid; the anrual precipita tion averages about 13 inches at American Falls and 8 inches at Aber deen.
GEOLOGIC SETTING AS RELATED TO THE WATER RE^tMEN 7
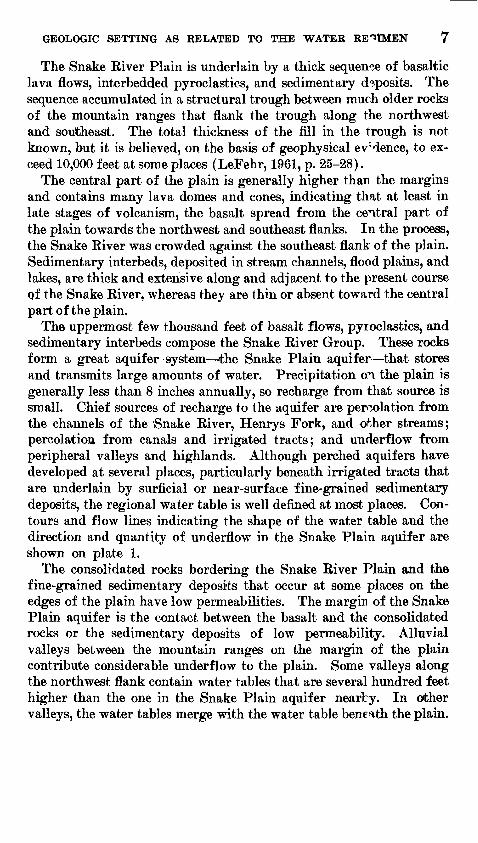
The Snake River Plain is underlain by a thick sequence of basaltic lava flows, interbedded pyroclastics, and sedimentary deposits. The sequence accumulated in a structural trough between much older rocks of the mountain ranges that flank the trough along the northwest and southeast. The total thickness of the fill in the trough is not known, but it is believed, on the basis of geophysical evMence, to ex ceed 10,000 feet at some places (LeFehr, 1961, p. 25-28).
The central part of the plain is generally higher than the margins and contains many lava domes and cones, indicating that at least in late stages of volcanism, the basalt spread from the central part of the plain towards the northwest and southeast flanks. In the process, the Snake River was crowded against the southeast flank of the plain. Sedimentary interbeds, deposited in stream channels, flood plains, and lakes, are thick and extensive along and adjacent to the present course qf the Snake River, whereas they are thin or absent toward the central part of the plain.
The uppermost few thousand feet of basalt flows, pyroclastics, and sedimentary interbeds compose the Snake River Group. These rocks form a great aquifer system the Snake Plain aquifer that stores and transmits large amounts of water. Precipitation on the plain is generally less than 8 inches annually, so recharge from that source is small. Chief sources of recharge to the aquifer are percolation from the channels of the Snake River, Henrys Fork, and other streams; percolation from canals and irrigated tracts; and underflow from peripheral valleys and highlands. Although perched aquifers have developed at several places, particularly beneath irrigated tracts that are underlain by surficial or near-surface fine-grained sedimentary deposits, the regional water table is well defined at most places. Con tours and flow lines indicating the shape of the water table and the direction and quantity of underflow in the Snake Plain aquifer are shown on plate 1.
The consolidated rocks bordering the Snake River Plain and the fine-grained sedimentary deposits that occur at some places on the edges of the plain have low permeabilities. The margir of the Snake Plain aquifer is the contact between the basalt and the consolidated rocks or the sedimentary deposits of low permeability. Alluvial valleys between the mountain ranges on the margin of the plain contribute considerable underflow to the plain. Some valleys along the northwest flank contain water tables that are several hundred feet higher than the one in the Snake Plain aquifer nearby. In other valleys, the water tables merge with the water table beneath the plain.
8 GROUND WATER, AMERICAN FALLS RESERVOIR, IDAHO
The aquifer discharges to the Snake River chiefly in two reaches: between the mouth of the Blackfoot River and American Falls (American Falls Reservoir reach), and between Milder Dam and Bliss (Hagerman Valley reach). Discharge in these two reaches is caused by the specific spatial relationships of the aquifer to aquitards (geologic units of low permeability) in the reach. In the Hagerman Valley reach, the contact between the aquifer and underlying aquitard intersects the canyon of the Snake River at an altitude generally 100- 200 feet above river level, and springs issue at or above that contact. In the American Falls Reservoir reach the contact is generally 20-45 feet above maximum reservoir level.
Discharge from the aquifer during the past decade has averaged about 6,500 cfs in the Hagerman Valley reach and abont 2,500 cfs in the American Falls reach.
GEOLOGIC UNITS AND THEIR WATER-BEARING CHARACTER
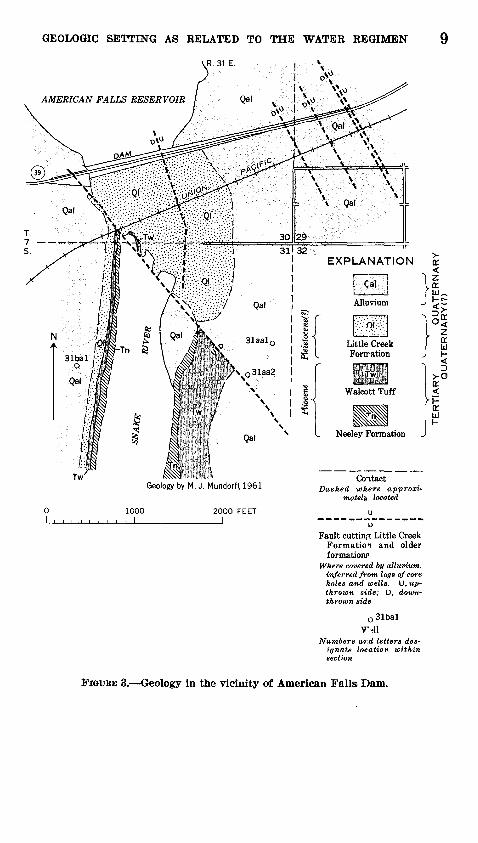
Areal distribution of geologic units is shown on t^o maps (fig. 3; pi. 2). The subsurface geology in the vicinity of American Falls Dam and at the southwest end of the reservoir is shown by a fence diagram (pi. 3) and a geologic section (pi. 4).
The limited time available for the investigation dH not permit detailed geologic mapping of extensive areas. The mp,p by Stearns, Crandall, and Steward (1938, pi. 6) and the maps by Jar~ard and Mead (1951, pis. 1 and 2; 1952, pi. 1) were modified by the author to make the map of the geology in the vicinity of the American Falls Dam (fig. 3). The geologic map of the American Falls quadrangle (Carr and Trimble, 1963) helped in delineating the geology ir the reservoir. The geology northeast of the American Falls quadrangle shown in figure 3 is based entirely on the author's observations.
A brief reconnaissance of the shoreline was made by the author at low reservoir stages. Large-scale aerial photographs of the west shoreline and the north end of the reservoir were supplied by the Bureau of Reclamation. The aerial photographs were taken at a low reservoir stage on October 1, 1959, when the water surface was at an altitude of 4,307.5 f eeet, about 47 feet below the maximum level. Map ping at a low reservoir stage permitted delineation of geologic units not visible when the reservoir is full.
The geology of the strip along the west shore and the north end of the reservoir (pi. 2) was mapped because of its influence on the ground water of the area. Three thick units crop out along the shore: the Raft Formation, the Big Hole Basalt of the Snake River Group, and the American Falls Lake Beds. Surficial deposits, including ter race sand and gravel, and windblown deposits, blanket much of the area. Generally, these deposits are less than 10 feet thick and were omitted from the map so that the distribution of the thicker, underly-
O
F O O
l-» O I
TERTIARY
QUATERNARY
QUATERNARY(?)

10 GROUND WATER, AMERICAN FALLS RESERVOIR, IDAHO
ing units could be shown. Along the west shore of the reservoir are one or more terraces, which range in altitude from abort 4,390 feet at the southwest end to about 4,370 feet at the north end of the reser voir. Wave action has cut back along the reservoir shoreline so that a nearly vertical bluff extends from the terrace down to maximum pool altitude at about 4,355 feet.
The Snake River Plain is underlain by a thick sequence of basalt lava flows and interbedded pyroclastics and sedimentary deposits. According to Kirkham (1931), the basin in which they accumulated was formed by downwarping. More recently, geologists have sug gested that faulting has been a major process in forming the structural trough (LeFehr, 1961). The geologic units and their water-bearing characteristics are shown in table 1.
STRUCTURAL CONTROL OF GROUND WATER
Most of the sedimentary units were deposited in nearly horizontal layers. Some of the older formations, including the ] Teeley Forma tion, the Walcptt Tuff, and the Little Creek Formation, have subse quently been faulted, tilted, and locally, slightly folded. The Walcott Tuff dips about 3 degrees northwestward down Ferry Hollow. Well logs from the vicinity of American Falls Dam also suggest a north westerly dip of this formation. The Neeley Formation and Walcott Tuff crop out in the low rolling hills southeast of American Falls at altitudes as high as 4,600 feet, which is more than 300 feet higher than their outcrop along the Snake River 2 miles to the northwest. It is not known how much of this difference in altitude i? due to tilting and how much is due to displacement by faulting.
A series of high-angle normal faults trending nortl westward has offset the geologic units older than the Raft Formation. The faults are clearly visible in the canyon of the Snake River below American Falls Dam, but they are covered elsewhere by younger formations (Raft Formation, Big Hole Basalt of the Snake River Group, Amer ican Falls Lake Beds, and alluvial and windblown deposits) which were not faulted. Away from the canyon and upstream from the dam, the fault traces can be inferred only from well logs and water-level data.
Stearns, Crandall, and Steward (1938, pi. 6) showed eight faults crossing the Snake River Canyon in a 3.5 mile reach Hlow the dam. The trend of all the faults ranges from slightly north of west to north west. Several faults are shown cutting the section beneath the dam in the fence diagram (pi. 3). Displacement ranges from a few feet to about 50 feet, and the strike is northwest. These faults are inferred from core holes drilled by the Bureau of Reclamation in 1926. The approximate location and trend of the faults are also shown in figure 3.

GEOLOGIC SETTING AS RELATED TO THE WATER REGIMEN 11
TABLE 1. Character and water-bearing properties of geologic units in the AmericanFalls Reservoir area
[Geologic units after Carr and Trimble (1963)]
System
Quaternary
Quater nary^)
Tertiary
Series
Recent and
upper Pleisto
cene
Upper Pleisto
cene
Upper or
Pleisto cene
Pleisto- cene(?)
MiddlePliocene
Stratigraphic unit
Dune sand, al luvium, ter race deposits, and thin loessial de posits
American Falls Lake Beds
Basalt of the Snake River Group (in cludes Big Hole Basalt)
Raft Forma tion
Little Creek Formation
Walcott Tuft
Neeley Forma tion
Thick ness (feet)
0-50
0-80
1,000+
75-200+
15-100
15-50
30-150
Character and distribution
Unconsolidated wind blown sand and silt, and fluviatile clay, silt, sand, and gravel discontin- uously overlying older formations around the reservoir. Not shown in fig. 4.
Partly consolidated me dium- to thin-bedded clay, silt, and fine sand with a persistant but discontinuous thin layer of gravel at the base. . Crops out on both sides of the reservoir for many miles above American Falls and along the river below American Falls.
Medium- to dark-gray, fine- to medium-grained, com monly vesicular basalt flows, locally separated by basaltic pyroclastic rocks. Lake, playa, and stream deposits interbedded with the flows at some places. Intertongue with and overlie the Raft Forma tion on the west side of the reservoir.
Light-colored poorly bedded silt and fine sand with a few clay beds, a few local beds of basaltic and rhyo- litic tuffs, and some gravel in the lower part. Un derlies most of the Ameri can Falls Reservoir and extends an undetermined distance west and south west of the reservoir.
Medium- to dark-gray dense to fine-grained, somewhat vesicular ba salt, and white, buff, red, and brown basaltic and rhyolitic tuff with some conglomerate lenses. Underlies the south western part of the area.
White bedded rhyolitic tuff, black obsidian welded tuff, and red welded tnff . Central part perlitic and spheru- litic. Exposed in the canyon of the river be low American Falls and south of American Falls.
Tan to brown fine- to coarse-grained rhyolitic tuff with lenses of gravel and a few beds of white marl. Exposed in the canyon of the river, but subsurface extent not known.
Water supply
Upstream from the re? srvoir the coarse de*x>sits yield moder ate to large supplies to wells where they ocrnir below the water table. Along the we«t and southeast si<?es of the reservoir tho deposits are above tin? water table.
Yielis small supplies to domestic and stock wells. Discharges a significant amount of wrter to reservoir from gravel at base of formation.
Basalt flows and pyro- clsstic rocks (Snake Pliin aquifer) yield lar^e quantities of wrter to wells. The principal source of ground water for irri gation west, north, ani northeast of the reservoir.
San<?y and gravelly beos yield small airounts of water to wells. Not a prin- cipal aquifer in the American Falls area.
Appears to be moder ate ly permeable. Probably a major sorrce of irrigation water hi the Michaud Flats Project and we1**, of American Fa"s.
Yields moderate amounts of water to we'ls and is the chief aquifer for some wells in the Michaud Flats Project.
Sandy and gravelly beds probably yield some water to wells in the Michaud Flats Project.

12 GROUND WATER, AMERICAN FALLS RESERVOIR, IDAHO
The hills southeast of American Falls receive more precipitation than the plain, and outcrops of the tuff units in these hills are conducive to recharge. The transmissibility of most aquifers is much greater parallel to the bedding than across the bedding, so that the dip of the aquifers from the area of recharge toward the area of discharge (American Falls Reservoir and the Snake River) materially aids the movement of ground water. Under this condition one might expect the water table to be near river level at the edge of the upland bench near the Snake River. However, it is generally considerably above river level. The considerable differences in altitude of the water table in some wells that are close together could be due to the fact that the wells are on opposite sides of a fault.
WATER REGIMEN IN THE AMERICAN FALLS RESERVOIR AREA
Undoubtedly there was a large spring inflow to the American Falls Reservoir reach when the first settlers arrived in the area; certainly irrigation has greatly increased the inflow volume. An understanding of the effects of irrigation and of ground-water withdrawals on spring inflow in the reach is essential to an appraisal of the current water regimen.
A large tract of land (the Aberdeen-Springfield trac4-) adjacent to the American Falls Reservoir at the north end and along the west and northwest sides of the Snake River is irrigated with surface water diverted from the Snake River upstream from Blackfoot. The tract includes about 63,000 acres extending in a strip about £-6 miles wide adjacent to the entire length of the reservoir and for sbout 20 miles upstream from the northeast end of the reservoir. The higher lands west and northwest of the Aberdeen-Springfield tract have been ir rigated with ground water since the late forties. Larjre amounts of ground water were withdrawn in the fifties, and in 1961 the pumpage was about 400,000 acre-feet for the irrigation of about 125,000 acres.
The Fort Hall tract includes about 35,000 acres on the east side of the Snake River upstream from the head of the reservoir, between Blackfoot and Pocatello, and is irrigated with the surface water diverted from the Blackfoot and Snake Rivers. The Michaud Flats Project of the U.S. Bureau of Reclamation (which contains the Falls Irrigation District) includes a strip of land 1-3 miles wide extending about 8 miles northeast and an equal distance southwest of American Falls. Part of the area is irrigated with surface water from the reservoir, and part is irrigated with water from well?.
The Raft Formation and American Falls Lake Bee's intertongue with the Snake Plain aquifer upstream from American Falls and

WATER REGIMEN IN THE AMERICAN FALLS RESERVOIR AREA 13
have only a small fraction of the transmissibility of the Snake Plain aquifer. Consequently, the large amount of underflow moving south- westward in the Snake Plain aquifer in the vicinity of I lackfoot and Moreland discharges into the American Falls Reservoir reach because the Snake Plain aquifer pinches out between the Raft Formation and American Falls Lake Beds near the reservoir. Part of the ground water bypasses to the north of the reservoir. The altitude of the reservoir area is low compared with the altitude of the water table to the north and east, and a large part of the underflow comes to the surface in the reservoir area.
Some of the largest springs discharge from stream gr*avels at the base of a terrace adjacent to the southwest side of Feny Butte, 9 miles northeast of American Falls Reservoir (pi. 2), at an altitude of about 4,410 feet. Because well logs for the area are lacking, details of the relation of the gravels to basalt are not known.
Many other springs discharge from gravel, particularly in the river reach between Ferry Butte and the head of the reservoir. Spring out lets in this reach are at altitudes of 4,365-4,410 feet. At the north end and along the west side of the reservoir, most of the discharge is from basalt above the contact with underlying clayey or rUty deposits. Most spring outlets in that area are at altitudes of 4,370-4,390 feet.
In the vicinity of Springfield and Sterling, aquifers of sand and gravel, chiefly at depths of 225-250 feet, pinch out into fine-grained deposits. The water in the sand and gravel aquifers is ur der sufficient pressure to cause it to rise a few feet above the land surface in many cased wells. Wherever overlying confining beds are thin or absent, water from these aquifers leaks upward to add to the discharge from the springs. The location of selected wells and of most large springs is shown on plate 5.
DEVELOPMENT OF DIVERSIONS FOR IRRIGATION
Irrigation diversions to the Snake River Plain upstream from the American Falls Reservoir reach began about 1880. According to Simons (1953, p. 60-65) and to Ross (1901, p. 13, 61), the sudden increase in the use of irrigation in eastern Idaho occurred between 1895 and 1900. The data from Simons (1953, p. 65) sv ow that the area irrigated in Idaho upstream from the American Falls Reservoir reach (by diversions upstream from Blackfoot), exclusive of head waters areas, was about 1,000 acres in 1880, 47,000 acres in 1890, 225,- 000 acres in 1900, 310,000 acres in 1905, and 530,000 acres in 1945. According to the report by Ross, 41,000 acres was irrigated in the area (Bingham County) in 1889, 65,000 acres (upstream from Amer ican Falls but excluding Ross Fork and Portneuf River drainages) in
255-4995 O 67 2
14 GROUND WATER, AMERICAN FALLS RESERVOIR, IDAHO
1896, and 211,000 acres in 1900. Thus, it appears that prior to 1896, diversion of water for irrigation was not a major factor in recharge of the aquifer, 'but that by 1900 it had become important. The irri gated area and the diversions to the area from 1910 to 1960 are given in table 2.
FLUCTUATIONS OF THE WATER TABLE
Information regarding the depth to water or the shape of the water table prior to irrigation of the Aberdeen-Springfield tract in 1910 is practically nonexistent. Stearns, Crandall, and Steward (1938, p. 117) reported one observation of the water level made at ar early date as follows: "During the construction of the Aberdeen-Springfield canal, in 1907, a well was dug by Mr. Shaw in sec. 7, T. 4 S., R. 32 E., in which water was first encountered at 20 feet and a permanent supply was found at 25 feet." The exact location and topographic situation of the well are not known, although during recent years water levels ranging from about 20 to 50 feet below the land surface have been measured in wells in the general area. This range is due in part to seasonal changes in water level and in part to topographic location. Thus, the meager available information suggests that there has not been a great change in the water table since construction of the canal and th?, beginning of irrigation on the tract at the location of the described well.
Since about 1919, the U.S. Bureau of Reclamation, the Aberdeen- Springfield Canal Company, Water District 36, and the U.S. Geologi cal Survey have made periodic measurements of water levels in obser vation wells. The Geological Survey has maintained a network of 20-25 observation wells in the report area since 1952 ancf has measured water levels one or more times in several hundred additional wells. A few of these wells were ones in which the water level had been measured from 20 to 40 years earlier. Comparison of current (1961) water levels with water-level measurements published by Steams, Crandall, and Steward (1936, p. 103-4,108-9,114-15,118-20) for several periods between 1919 and 1928, before and during the construction of the dam, indicates that the change in water levels has not been more than a few feet since the first measurements were made.
The position of the water table in the spring of 1919 is shown on plate 5 from a map made by the U.S. Reclamation Service (now U.S. Bureau of Reclamation), Burley, Idaho, May 1919. The contours were modified in and adjacent to section 12, T. 7 S., R 30 E., where the original map showed a very pronounced mound on the water table on the basis of water-level measurements in two wells Current in formation indicates that the two wells were completed in a perched aquifer; consequently, the measurements were disregarded in recon-
WATER REGIMEN IN THE AMERICAN FALLS RESERVOIR AREA 15
structing the position of the water table as of 1919. Th?- position of the water table in October 1961 is also shown on plate 5. Most of the measurements on the west side of the reservoir were made during the period October 15-19,1961, when the altitude of the v^ater surface in the reservoir ranged from 4,314 to 4,317 feet. Measurements made in some wells on the west side of the reservoir and in most of the wells on the east side at various times prior to October If 31 were also used in drawing the water-level contours. However, the measure ments made at other times were adjusted by comparison with the records from, nearby observation wells to reflect the position of the water table during the period of October 15-19, 1961. Caution must be used in comparing the two sets of contours because the 1919 measure ments were made in the spring, when water levels are low, and the 1961 measurements were made in the autumn, when water levels are high. The map shows that ground-water movement on the west side of the reservoir is generally southwestward, but that within a few miles of the reservoir, ground water moves toward and discharges into the reservoir.
A ground-water ridge is shown approximately paralleling the Aber deen-Springfield High Line Canal. Water to the east of the ridge moves toward the reservoir; water to the west moves westward with the main underflow in the aquifer. The contours show tl at the water table beneath lands near the west margin of the reservoir, except near the dam, ranged from altitudes of 4,340 to 4,370 feet wtnn the water surface in the reservoir was at a level of about 4,316 feet (pi. 5). This indicates a steep slope in the water table near the reservoir. As most of the sediments of the reservoir bed and in the area adjacent to the reservoir are fine grained (Raft Formation and American Falls Lake Beds), a steep gradient would be expected. Almost ?,11 the large springs issue from basalt at altitudes of 4,370 feet or above and at some distance from the reservoir. Thus, fluctuations of the reservoir be tween 4,296 feet (minimum) and 4,355 feet (maximum) has no effect on discharge of major springs and only a minor effect on the ground water in the sediments.
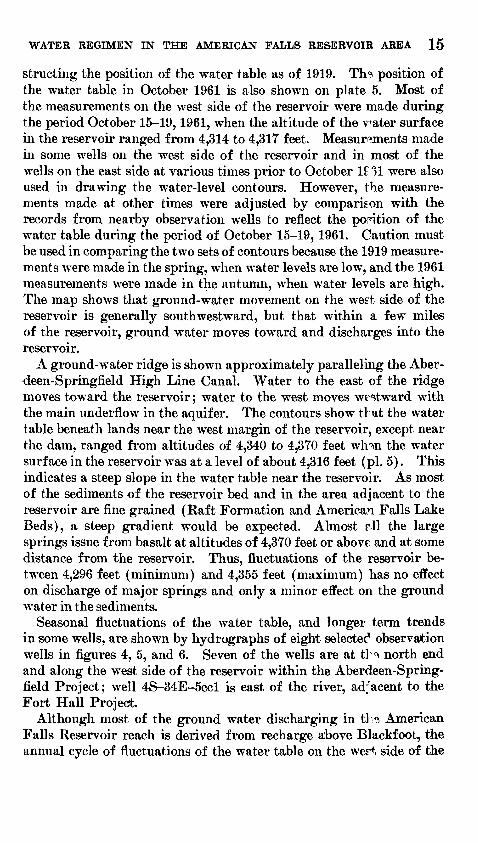
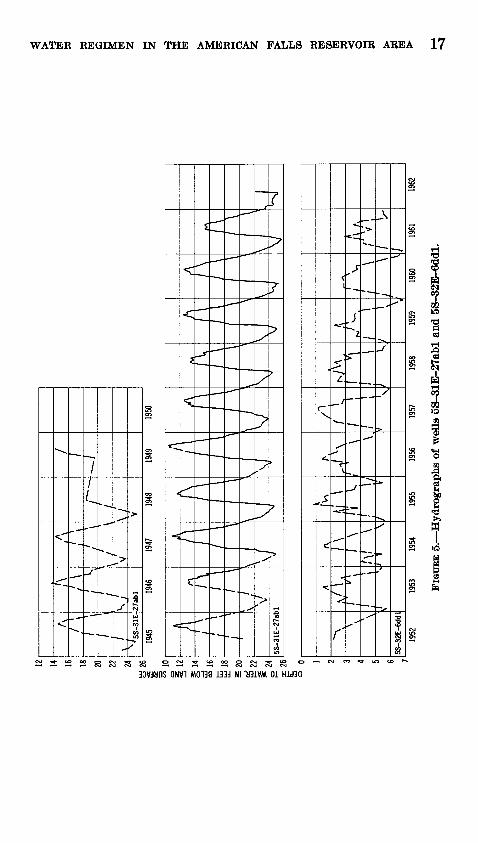
Seasonal fluctuations of the water table, and longer term trends in some wells, are shown by hydrographs of eight selectee1 observation wells in figures 4, 5, and 6. Seven of the wells are at tl^ north end and along the west side of the reservoir within the Aberdeen-Spring field Project; well 4S-34E-5ccl is east of the river, adjacent to the Fort Hall Project.
Although most of the ground water discharging in tH American Falls Reservoir reach is derived from recharge above Blackfoot, the annual cycle of fluctuations of the water table on the wert side of the

01 en .^ co
DEPTH TO WATER, IN FEET BELOW LAND SURFACEco co co ro ro co co co co co ro co co co co co po -^ ro o oo <7> oo 01 -^ ro o oo oo cr> .^ ro o oo
t** ?!
t^1
H
CO
m
if
<
vvVi>
<T
<;j"
Z=
^̂~> (.^
<H
»7
4 -^
c> wdo ro m<£>a.. n
Jc-~~
^--
i
/
X
/
\\
/\
>T
/
~~
~.
"T \ s
^^*r'/ \
\
^k
)
-,
^\
*>
? -
x..
i
>
-».
OHVQI 'JSEVDIHSHV 'axaoHO 91
DEPTH TO WATER, IN FEET BELOW LAND SURFACEo 0^-fr.roooocnSrxso en
ro ro is? £» ro o
* &
r
'-\
,r
vanv HiOAHasanNvomanv aai
S
3 S
DEPTH TO WATER, IN FEET BELOW LAND SURFACE
g 8S 8S £ 8 3
/
<"
'moAHasaH s^iv* JsrvoiHanv 'Ha^vAi. ajsrnoHO 81
WATER REGIMEN IN THE AMERICAN FALLS RESERVOIR AREA 19
reservoir is obviously related to irrigation on the Aberdeen-Spring field tract west of the reservoir. Water levels begin rising in April or May shortly after irrigation starts, rise rapidly during the first part of the irrigation season, hold fairly steady during tH latter part of the irrigation season, and decline steadily after irrigation ceases.
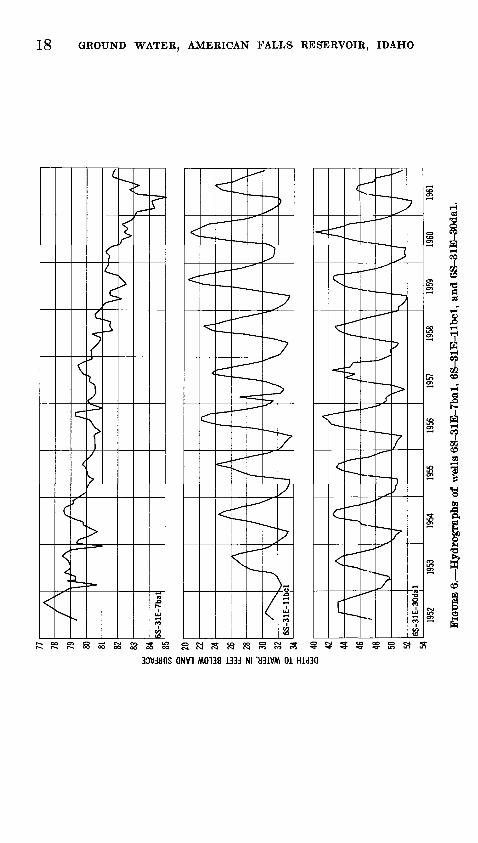
Water-level fluctuations in wells near the southwest end of the reservoir show the effects of different influences (fig. 7). Water levels in all these wells rise and fall with the stage of the reservoir. At high reservoir stages the water in the reservoir is higHr than the water level in the wells, but at low stages the water level in the wells is higher than that in the reservoir. The water levels in wells near the reservoir, and particularly in those very near the south end (wells 7S-30E-24ddl and 7S-31E-30cbl), show the greatest fluctuations and are lower than the reservoir for longer periods than yells farther north. Wells farther west show less fluctuation.
4360
4350
4340 -
2j 4330 -
E 4320 -
4310 -
4300 -
4290MAY JUNE JULY AUG SEPT OCT NOV
1961DEC JAN FEB MAR APR MAY JUNE
1962
FIGURE 7. Hydrographs of wells 7S-30E-13dcl, 7S-30E-15aal, 7S-30E-15aa2, 7S-30E-24ddl, TS-30E-26ddl, 7S-30E-28bbl, 7S-31E-22cbl, 7S-31E-30cbl and American Falls Reservoir.

20 GROUND WATER, AMERICAN FALLS RESERVOIR, IDAHO
Profiles of the relative position of the water table, th°> land surface, and the water level in the reservoir area are shown on plate 4. The profiles for October show the position of the water table beneath the Aberdeen-Springfield tract a month or two after the table had started to decline. All five profiles show the water table sloping toward the reservoir, which had been drawn down to supply water for irriga tion downstream. However, profiles D-D' and E-E*', which are farthest southwest (pi. 2), show a ground-water divide; the water table beyond a certain point on the profile slopes away from the reservoir.
The profiles for April 1962 show the position of the water table at a time when the water table in much of the area, raised by percola tion of irrigation water during the preceding season, had receded to a low position immediately prior to the beginning of the 1962 irriga tion season. The reservoir was full at the time. Profiles A-A', B-B', and C-C' show the water table sloping toward the reservoir at about the same slope as it did the previous October. Profile D-D' shows a shift in the ground-water divide to a point farther from the reservoir. This shift is undoubtedly due to cessation of local recharge from irrigation in the vicinity of well 6S-31E-30dal. Profile E-E' shows a westward component of slope on the water table, away from the reservoir, and indicates that there is some seepage loss from the reservoir at high stage.
The water-table map for the southeast side of the reservoir is based on measurements made over a period of several years. All these measurements were corrected to reflect the water level in the aquifer at a low reservoir stage to correspond to the water level during the period October 15-19, 1961. The water table slopes northwest ward toward the reservoir from the hills and mountains flanking the Snake River Plain. The slope of the water table is fairly uniform with an average gradient of about 25 feet per mile. The only large springs discharging into American Falls Reservoir along the south east side are near the Portneuf River. However, many small seeps are seen along extensive reaches of the shore at low reservoir stages.
Hydrographs of wells 5S-33E-35ccl, 6S-32E-27adl, and 7S-31E- 33abl (fig. 8) show both seasonal and long-term trends. The seasonal cycle in well 5S-33E-35ccl, at the northeast end of the reservoir, is closely related to recharge from runoff in the spring cf the year and to irrigation. The water level begins rising in April c^ May, reaches a peak in September or October, and declines the re^t of the year. This cycle is similar to the seasonal cycle shown by most wells along the north end and the west side of the reservoir. A longer term trend a decline of about 1.5 feet in the past 4 years ir also shown by this hydrograph.
WATER REGIMEN IN THE AMERICAN FALLS RESERVOIF. AREA 21
222324
2526
LUO ,.<c 34
I 35
§ 36<cX 37
§ 38O3
£ 40 -.200 | 201
= 203 | 204
205206207208209
tJL_, 4360
^la 4340
Hi 4320I 1" 4300
^ N
5S-33E-35
/\
lv /
:cl
Land-surf
y\^xA
ace altitude
/\
4428.8
S^\ /*^ P.^^
A
6S-32E-27adl
.Land-surface altitude 4416.7
7 A
A
7S-31E-33abl
XLand-surface altitude 4535.6
American Falls Reservoir V/\
1955 1956 1957 1958 1959 1960 19<?1 1962
FIGURE 8. Hydrographs of wells 5S-33E-35ccl, GS-32E-27adl, and 7S-31E-33abl, and the stage of American Falls Reservoir.
The hydrograph of well 6S-32E-27 adl is typical for wells along most of the southeast side of the reservoir. The seasonal cycle is in fluenced by the stage in American Falls Reservoir, which is the dis charge boundary of the aquifer. The water level in the A^ell declined about 1.5 feet in the years 1957-61, probably owing to decreased re charge because of below-average precipitation. The unusual rise in the Avater level after February 1962 is probably related to heavy flood runoff in February and subsequent above-normal precipitation in the spring of 1962.
Water-level measurements in well 7S-31E-33abl are not frequent enough to show the precise seasonal cycle in the well, bit they are sufficient to show that the water level is related, at least in part, to the stage of American Falls Reservoir. The seasonal cycle is probably influenced by recharge from precipitation in the hills a few miles to

22 GROUND WATER, AMERICAN FALLS RESERVOIR, IDAHO
the south. Also, since 1957 when pumping on the Midi" ud Flats Proj - ect began, the seasonal cycle apparently has 'been modified by pumping. The longer term trend shown by the well a decline of more than 5 feet in 4 years (1957-61) may be related in part to withdrawals for irrigation on the project.
In summary, the seasonal fluctuations of the water table at the north end and along most of the west side of the reservoir are related to diver sion of water to the adjacent irrigated tracts. Fluctuations along most of the east side of the reservoir south of the Portneuf River are related to recharge in the hills to the south. Fluctuations at the southwest end of the reservoir are related to the stage of water in the reservoir.
WATER BUDGET, AMERICAN FALLS RESERVOIR REACH
Ground-water inflow to the American Falls Reservoir reach can be estimated as a residual of the water budget for the reach. About half of the ground-water inflow can be accounted for by measurement of spring discharge in the reach during the irrigation season. The com bined surface and ground water inflow in the reach corsists of the fol lowing items:
1. Flow in the Snake River (measured at the Blackfoot gage).2. Portneuf River discharge (measured at the Pocatello gage).3. Discharge of Bannock Creek, Ross Fork, and other small sur
face streams.4. Precipitation on the reservoir and sheet runoff from peripheral
area.5. Surface waste from irrigated tracts.6. Bank storage (returned during declining reservoir stages).7. Ground-water inflow.
Outflow includes:1. Flow in the Snake River (measured at the Neeley gage).2. Evaporation from the reservoir.3. Evapotranspiration from the exposed parts of the reservoir.4. Canal diversions (Midland Canal).5. Seepage losses.6. Bank storage (during rising reservoir stages).
The budget must also be corrected for change in storage in the reservoir.
Snake River inflow to the reach is measured at the gaging station about one-quarter mile downstream from the mouth of the Blackfoot River. Not all ground-water inflow occurs below this station. According to Stearns, Crandall, and Steward (1938, p. 187), spring inflow begins in the Snake River a short distance upstream from the
WATER REGIMEN IN THE AMERICAN FALLS RESERVOIR AREA 23
mouth of the Blackfoot Eiver and spring inflow above the gaging station totals about 120-150 cfs. Above this reach, for many miles, the Snake Riv.er is an influent stream.
In the water budget, spring inflow in the short reach upstream from the gaging station is disregarded. To obtain total spring inflow for the entire American Falls Reservoir reach, 120-150 cfs would have
4 '
to be added to the amounts given. Discharge of the Portn^uf River is measured at the gaging station a few miles upstream from the mouth at the west edge of Pocatello. Snake River outflow is measured at the gaging station at Neeley, 0.9 mile downstream from American Falls Dam. Surface water is diverted for the Michaud Project r,t American Falls Dam. Discharges of Bannock Creek and Ross Forv have been measured for short periods only; the estimate of the inflow from these sources was derived from the scanty records available and was adjusted on the basis of variations in flow of the Portneuf River.
Precipitation on the reservoir is a variable component of inflow that must be accounted for in the budget. The annual precipitation was averaged for Weather Bureau stations at American Falh, Aberdeen Experiment Station, and Blackfoot. Records at Pocatello airport were used to help complete the record. The average annual precipita tion was multiplied by the maximum reservoir area (56,000 acres) to obtain the total contribution from precipitation. This was done to equate the precipitation gain in the prereservoir period tc that of the postreservoir period.
The total precipitation is not a net gain; evaporation frcm the reser voir surface and evapotranspiration from the uninundatec1 part of the reservoir area deduct from the total precipitation. Before the reser voir was constructed, there was considerable water loss from the bot tom lands, large parts of which were covered by lush grasses and phreatophytes, in addition to the normal loss from dry-land vegetation on somewhat higher lands. In computing the total evapotranspira tion losses for the prereservoir period, it was assumed that evapotrans piration from the higher land consumed 9-10 inches of precipitation (about 45,000 acre-ft annually), and that grasses and phreatophytes on the bottom lands (25 percent of the area) consumed an additional 2.5 feet (35,000 acre-ft annually). These computations do not include the years of far below average precipitation.
In computing annual evaporation from the reservoir, the monthly loss, based on pan evaporation, was multiplied by the average reservoir area for each month. Pan evaporation at the Aberdeen Experiment Station was used for the period of record 1935-60. Evaporation at Milner Dam was used for the period 1927-34. Pan evaporation was corrected to lake evaporation by using a coefficient of 72 percent (Kohler and others, 1959, pi. 3).

24 GROUND WATER, AMERICAN FALLS RESERVOIR, IDAHO
When the reservoir surface is lowered, large flat areas at the head of the reservoir are uncovered. These areas support a lush grassland which is dotted with ponds and sloughs, and evaporation and tran spiration losses from these areas are large. It was assumed that total losses from the uncovered area of the reservoir were one-half the losses that would have occurred from the same part, had the reservoir re mained full; that is, evapotranspiration from 1 acre of uncovered area would be one-half the evaporation from 1 acre of water area.
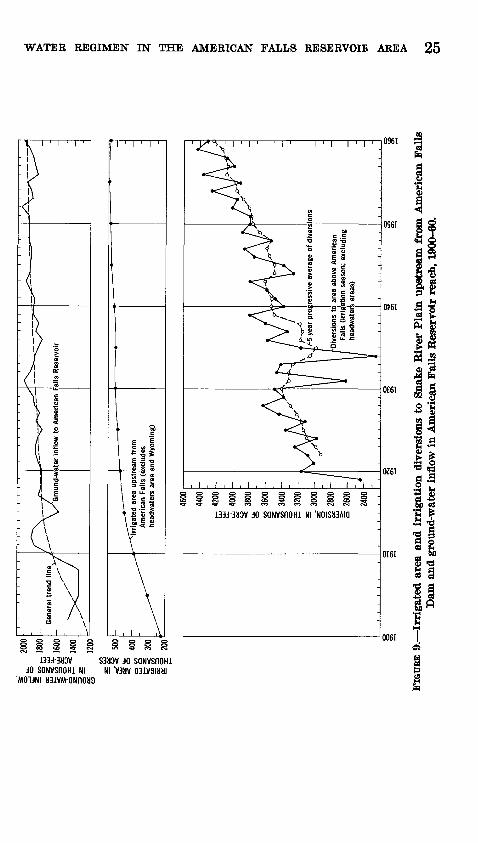
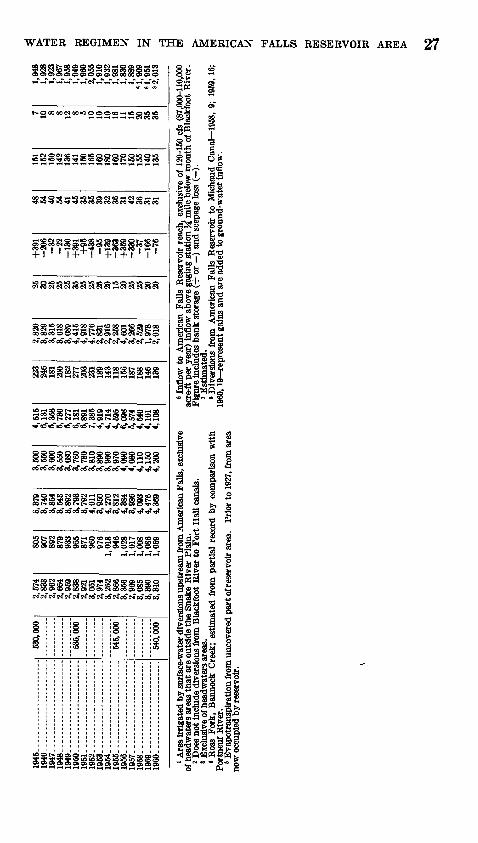
The computations for the water budget are given in table 2, in the columns under "Annual runoff" and "American Falls Reservoir." Continuous records of flow in the Snake River at the two gaging stations used in the analysis are available only since 1911. Spring inflow at earlier dates can be obtained only by analysis of earlier mis cellaneous records. Discharge measurements were mr.de at different places along the Snake River in the vicinity of the American Falls Reservoir reach between 1902 and 1910. By estimating inflow from some tributaries, gains and losses in several reaches, and evapotran spiration losses from the reservoir reach, rough estimates of spring dis charge were made for a period in August in three different years. These estimates are 2,000 cfs (1,450,000 acre-ft per year) in 1902; 1,840 cfs (1,330,000 acre-ft per year) in 1905, and 1,830 cfs (1,325,000 acre-ft per year) in 1908. Although the records are incomplete and the quantities determined may be considerably in error, the records do indicate that spring inflow in the reach was considerably less before 1908 than in the years since 1911. Data from table 2, under "irrigated area," "total," "5-year progressive average," and "ground-water in flow" are plotted for the period 1900-60 in figure 9.
Irrigation diversions range greatly in length. The. distance from where the water is first diverted to the places where i4: is discharged to the inflow reach ranges from a few miles to 100 iriles. For this reason and because the storage capacity of the aquifer is large, it seemed advisable to use some kind of averaging method that takes into account the diversions in previous years as well as the diversions during the current year. A 5-year progressive average was used which, considering the limitations of the data, showed a good cor relation with ground-water inflow. The trends of the two curves in figure 9 show a good correlation until about 1952, after which time ground-water inflow was significantly less, although the average amount of water diverted increased. The break in the trends, in about 1952, coincides with the time that ground-water pumprge began to be large. This suggests that if it were not for large ground-water with drawals on the Snake River Plain, the inflow to the £ merican Falls Reservoir reach would continue to increase as long as average surface- water diversions upstream from the reservoir continue to increase.
DIVERSION, IN THOUSANDS OF ACRE-FEET

TAB
LE 2
. A
mer
ican
Fal
ls R
eser
voir
inf
low
ana
lysi
sto O
5
[Wat
er q
uant
itie
s in
thou
sand
s of
acr
e-ft
. (+
) In
dica
tes
surf
ace-
wat
er o
utfl
ow,
or th
e am
ount
of w
ater
that
lea
ves
the
rese
rvoi
r ar
ea,
or a
n in
crea
se i
n th
e co
nten
ts o
f the
res
ervo
ir
duri
ng th
e w
ater
yea
r.
( )
indi
cate
s th
e am
ount
of w
ater
that
mus
t be
sub
trac
ted
from
the
sur
face
-wat
er o
utfl
ow to
obt
ain
the
grou
nd-w
ater
incr
emen
t.]
Wat
er y
ear
1910
19
11
1912
1913.-
-
19
14
1915. -
1916
.. . - - -
19
17
19
18
19
19
1920 .
1921
1922 .
1923 .. -
19
24
1925
1926--.
19
27
..
1928
. .
1929.-
-.. -
1930... ...
. ..
.. ..
1931--
1932
.-
\933
19
34
...
...
....
....
.. .
193
5-.
- .................
1936--- -
19
37
--.
19
38
--_
19
39
.- ..
1940... ..
. ..
. ...
....
...
1941
. ................. .....
1942--. ..
1943--
. ..-.
1944.. .....
Irri
gate
d ar
ea1
(acr
es)
390,
000
450,
000
475,
000
490,
000
505,
000
505,
000
515,
000
Irri
gati
on s
easo
n di
vers
ions
Hei
se to
B
lack
- fo
ot 2
1,79
1 2,
326
2,18
8 2,
275
2,39
7 2,
233
2,53
2 2,
336
2,57
0 2,
742
2,51
4 2,
671
2,03
3 2,
592
2,57
0 1,
792
2,39
3 2,
725
2,53
1 2,
721
2,85
3 2,
523
2,63
6 2,
697
2,88
8 2,
437
Hen
rys
Fork
and
tr
ibu
ta
ries
3
657
848
819
820
847
737
826
776
863
896
859
820
589
869
839
458
775
857
796
883
950
862
850
892
900
812
To
tal
2,44
8 3,
174
3,00
7 3,
095
3,24
4 2,
970
3,35
8 3,
112
3,43
3 3,
638
3,37
3 3,
491
2,62
2 3,
461
3,40
9 2,
250
3,16
8 3,
582
3,32
7 3,
604
3,80
3 3,
385
3,48
6 3,
589
3,78
8 3.
249
5-ye
ar
prog
res
si
ve
aver
age
2,99
0 3,
100
3,13
0 3,
160
3,22
0 3,
300
3,38
0 3,
410
3,31
0 3,
320
3,27
0 3,
050
2,98
0 3,
170
3,15
0 3,
190
3,50
0 3,
540
3,52
0 3,
570
3,61
0 3.
500
Ann
ual r
unof
f
Snak
e K
iver
at
Nee
ley
(+)
7,07
7 8,
042
8,60
1 7,
549
4,95
3 6,
824
8,11
9 7,
590
4,60
6 5,
326
6,77
3 6,
017
5,62
8 3,
902
6,28
7 4,
785
5,07
7 7,
170
4,98
6 4,
442
3,81
1 3,
874
4,00
6 2,
777
3,27
7 4,
163
3,87
7 4,
819
4,65
0 3,
540
3,50
4 4,
161
6,19
4 5.
134
Por
tneu
f K
iver
at
Poca
tello
(-
) '270
25
9 20
8 27
8 17
2 19
2 22
1 21
1 18
9 20
1 29
9 26
7 22
4 17
7 19
9 16
5 20
0 19
6 17
3 13
8 12
2 15
4 15
3 85
110
158
150
172
156
118
142
171
215
182
Snak
e R
iver
at
Bla
ckfo
ot(-
)
4,90
6 5,
839
6,49
5 5,
467
3,21
1 4,
966
6,06
8 5,
584
2,63
5 3,
342
4,63
7 3,
882
3,53
4 1,
902
4,29
8 2.
772
4,53
7 4,
769
2,79
2 2,
220
1,26
3 2,
059
2,06
6 71
2 1,
449
2,88
1 1,
748
3,17
4 2,
269
1,60
9 1,
588
2,21
8 4,
563
2,71
8
Oth
er
smal
l dr
ain
ag
es4 (
) 30
30
25
30
20
25
25
20
20
20
35
30
25
20
25
20
25
25
20
15
15
20
20
10
15
20
20 20
20
15
20
20
25
25
Am
eric
an F
alls
Res
ervo
ir
Cha
nge
in
stor
age
(+ o
r -) +4
+
1,3
85
-42
1
-222
-19
4
-51
3
+19
3 +
12
-2
12
+1
3
+56
1 -1
94
+
273
-433
+1
2
+5
6
+9
0
+48
7 -3
63
Prec
ipi
ta
tion
on
rese
r
voir
(-) 66
82
61
62
50
62
52
52
38
50
48
49
53
29
58
39
58
43
45
60
40
46
39
39
36
47
52
66
30
69
65
58
45
51
Eva
po
rati
on
(+)
0 16
3 16
5 14
0 13
0 12
0 11
5 13
1 11
0 11
9 15
6 15
2 15
5 14
5 13
7 12
6 15
0 15
8 14
4
Eva
po-
tran
s-
pira
tion
* (+
) 75
75
75
75
75
75
75
75
73
75
75
75
75
64
75
74
10 8 12
18
35
27
22
45
40
15
15 9 16
22
15
13 9 10
Gro
und-
w
ater
in
flow
6
1,88
0 1,
907
1,88
7 1,
787
1,57
5 1,
654
1,82
8 1,
798
1,79
7 1,
788
1,82
9 1,
864
1,86
7 1,
838
1,78
2 1,
867
1,81
5 1,
889
1,88
6 1,
963
2,01
3 1,
930
1,89
3 1,
874
1,83
8 1,
788
1,88
0 1,
824
1,90
3 1,
900
1,88
6 1,
947
2,00
0 1,
949
1945--
.-. .
19
46..... ......
1947--..
1948---
19
49
-..
1950--. .
1951.
19
52
.- .
19
53
--. -
19
64
...
1966-..- .
1966... . .
1957
-- .
1958--. .
196
9- .
I9
60
... .
530,
000
535,
000
'
545,
000
540,
000
2,57
42,
833
2,96
22,
664
2,95
92,
838
2,92
13,
051
2,97
43,
252
2,86
63,
356
2,96
93,
085
3,39
03,
310
805
907
892
879
933
955
871
«60
976
1,01
894
61,
028
1,01
71,
008
1,08
61,
059
3,37
93,
740
3,85
43,
543
3,89
23.
793
3,79
24,
011
3,95
04,
270
3,81
24,
384
3,98
64,
093
4,47
64,
369
3,50
03,
550
3,60
03,
550
3,68
03,
760
3,78
03,
810
3,89
03,
960
3,97
04,
090
4,08
04,
110
4,15
04,
260
4,51
56,
131
5,35
85,
736
5,27
76,
181
6,89
17,
385
4,91
94,
714
4,59
56,
098
5,57
44,
540
4,10
14,
108
223
246
181
200
182
277
203
231
189
143
118
156
187
188
146
139
2,82
03,
829
3,31
53,
618
3,08
94,
415
4,91
84,
776
2,83
12,
916
2,25
84,
601
3,26
62,
529
1,97
82,
018
25 30 25 25 25 35 25 25 25 20 15 20 25 25 20 20
+391
-20
6-3
2-2
2-1
30
+39
1+
95-4
38
-95
+13
9-3
63
+35
9-3
30
-37
-16
6-7
6
48 54 40 54 41 45 35 35 39 32 36 31 42 36 31 31
151
152
150
142
136
141
150
165
160
180
160
170
150
155
140
135
7 10 8 8 12 8 5 10 10 10 16 11 15 20 35 35
1,94
81,
928
1,92
31,
967
1,95
81,
949
1,96
02,
055
1,91
01,
932
1,98
11,
830
1,88
9'1
,909
«1,9
518 2
. 013
1 Are
a ir
riga
ted
by s
urfa
ce-w
ater
div
ersi
ons u
pstr
eam
from
Am
eric
an F
alls
, exc
lusi
ve
of h
eadw
ater
s ar
eas
that
are
out
side
the
Snak
e R
iver
Pla
in.
2 Doe
s no
t in
clud
e di
vers
ions
from
Bla
ckfo
ot R
iver
to F
ort
Hal
l can
als.
3 Exc
lusi
ve o
f hea
dwat
ers
area
s.4
Ros
s Fo
rk,
Ban
nock
Cre
ek;
estim
ated
fro
m p
artia
l re
cord
by
com
paris
on w
ith
Port
neuf
Riv
er.
8 Eva
potr
ansp
irat
ion
from
unc
over
ed p
art o
f res
ervo
ir a
rea.
Pr
ior
to 1
927,
from
are
a no
w o
ccup
ied
by re
serv
oir.
6 Inf
low
to
Am
eric
an F
alls
Res
ervo
ir re
ach,
exc
lusi
ve o
f 12
0-15
0 cf
s (8
7,00
0-11
0,00
0 ac
re-f
t per
yea
r) i
nflo
w a
bove
gag
ing
stat
ion
% m
ile b
elow
mou
th o
f Bla
ckfo
ot R
iver
. Fi
gure
incl
udes
ban
k st
orag
e (+
or )
and
see
page
loss
( )
.7 E
stim
ated
.8 D
iver
sion
s fr
om A
mer
ican
Fal
ls R
eser
voir
to
Mic
haud
Can
al 1
958,
9;
1959
,16;
19
60,1
9 re
pres
ent g
ains
and
are
add
ed to
gro
und-
wat
er in
flow
.
to
28 GROUND WATER, AMERICAN FALLS RESERVOIF, IDAHO
Since 1957, however, when water in Palisades Keservoir, about 110 miles upstream from American Falls Reservoir, became available, many canals have tended to divert more water at the head and spill a larger part back to the river than formerly. The magnitude of the spills is not known. Because the area irrigated by surface-water di version has not increased significantly since 1957, it might reasonably be assumed that the actual amount of water applied to the land has become somewhat stabilized.
The average ground-water inflow to the reservoir was about 1.96 million acre-feet for the period 1943-52 before ground-water pump ing became significant. The average for the last 5 years, as shown in table 1, was about 1.92 million acre-feet. The apparent decline is so small that the only significant conclusion to be made, is that ground- water inflow is not increasing.
By using a one-year lag between the 5-year progressive average of diversions and ground-water inflow, points from the two curves were plotted in figure 10. Although widely scattered, the points show a definite relationship. If the points for the period 1953-60 are dis regarded, a line through the remaining points indicates that the aver age increase of inflow is about 2.5 acre-feet for every 10-acre-feet increase in water diverted. The points for 1953-60 may show the influence of ground-water pumping in the vicinity of and upstream from the reservoir reach. In 1961 the pumpage was about 400,000 acre-feet for irrigation of an estimated 125,000 acres; depletion of ground water by evapotranspiration exceeded 250,00') acre-feet.
Although the data in table 2, and figure 9 show long-term trends of inflow and cyclic trends causecl by periods of drought, they give no indication of seasonal trends. To obtain some indication of seasonal trends, a water budget was computed on a monthly basis for the period beginning with water year 1951 (beginning October 1950) and con tinuing through calendar year 1960. (See "Basic D?.ta," p. 56-58.) The same elements of inflow, outflow, change in storage, evaporation, evapotranspiration, and precipitation were considerei, as they were in developing the annual water budget. The figures for ground-wa ter inflow include bank storage (+ or ) and seepage loss ( ).
The surface inflow of small streams tributary to the American Falls Reservoir and surface waste from irrigated tracts are a small part of the water budget. The annual reports of Water District 36 give the discharges of Ross Fork and Bannock Creek for the period May-Sep tember of each year. Study of the data indicates that the flow of Ross Fork, as given in the reports, includes 50-90 percent ground-water discharge from adjacent irrigated lands. Surface waste is also given in Water District 36 reports for the period May-September. How-

2.1
B
2,0
1.9
1.8
1.7
1
I \
I II
I f
31
.30
.39
.23
56
.25
2.9
3.1
3.3
3.5
3.7
3.9
5-YE
AR
PRO
GR
ESSI
VE A
VER
AGE
OF
DIV
ERSI
ON
S, I
N
MIL
LIO
NS
OF
ACR
E-FE
ET4.
1
FIGU
EE 1
0. R
elat
ion
betw
een
5-ye
ar p
rogr
essi
ve a
vera
ge o
f ir
riga
tion
div
ersi
ons
to t
he a
rea
abov
e A
mer
ican
Fal
ls D
am a
ndin
flow
to
the
Am
eric
an F
alls
Res
ervo
ir r
each
.
30 GROUND WATER, AMERICAN FALLS RESERVOIR, IDAHO
ever, study of these data also suggests that a significant part of the water measured in the wasteways was ground-water inflow. No data are available for wasteway inflow during the period October-April of each year, and few data are available on the flow of Koss Fork and Bannock Creek for the same period. Therefore, there two items of surface inflow are disregarded in the table, and the figure for ground- water inflow is too large by the amount of such surface inflow. The amount of this surface inflow is small, generally not more than a few thousand acre-feet a month. Stream inflow is greatest during winter and early spring, whereas inflow from surface waste is greatest during the summer; thus, there would be a tendency toward a uniform gain from these unmeasured sources of inflow. Because the unmeasured surface inflow is small and it tends to be uniformly distributed throughout the year, the unmeasured inflow in most months probably does not appreciably affect ithe cyclic pattern shown by monthly figures for ground-water inflow.
The monthly ground-water inflows to the reservoir are plotted in figure 11 along with the water level of well 5S-31E-27'a)bl for compari son. This well was selected 'because it is fairly centrally located, about 1 mile northeast of Aberdeen, and because the available record is relatively complete. Obviously, it would be extreme! 1^ fortuitous if any one well were to show an exact quantitative relatior to the ground- water inflow to the reservoir that occurs over a wide area. However, it is apparent that the variations in ground-water inflow are closely related to the water level in the aquifer. This, of course, is what should be expected.
The plot of the inflow data is somewhat erratic, but this is an in evitable result of inaccuracies in discharge measurements and an in ability to account for all the variations in precipitation, snowmelt, waste water, and evapotranspi ration, as mentioned previously. If a smooth line is drawn through the j)lotted points, the deviations of points from the line are generally small and represent only a few per cent of the total quantity of water involved in each monthly budget. Comparison of the curves of water level and of ground-water inflow shows that at times the ground-water inflow cycle apparently leads the water-level cycle. On the hypothesis that changes in water level cause the changes in inflow, this is an impossible situation. A partial explanation may be that the water level in well 5S-31E-27abl fails to accurately reflect the gross effect of the water-table r; se in the entire area. In part the situation may also be caused by unmeasured surface waste at the beginning of the irrigation season, or by unmeasured run off from snowmelt in Ross Fork, Bannock Creek, and other tributaries.

WATER REGIMEN IN THE AMERICAN FALLS RESERVOIR AREA 31
The possibility that the discrepancies are due to variations in seepage loss from the reservoir or in loss or gain from bank storage must also be considered.
To facilitate comparison of the two graphs shown in figure 11, mid- month water levels and end-of-month inflows are tabulated and plotted in figure 12. Except for a few points, correlation between the two is fairly good. In 1959 and 1960, inflow apparently was slightly out of phase with the water level in well 5S-31E-27abl. A better correlation would have been obtained for 1959 and 1960 by plot ting end-of-month water levels against inflow for the month.
32 GROUND WATER, AMERICAN FALLS RESERVOIR, IDAHO
£ g Ssovrans QNVI woi3a
133J Nl 'a3iVM Oi Hid3Q
S tr> a r-> tR
CSJ --I i t
133J-3aOV JO SQNVSnOHi Nl 'M01JNI

WATER REGIMEN IN THE AMERICAN FALLS RESERVOIR AREA 33
3DVJanS QNVl M0138 133:1 Nl 'H31VM 01 Hid3Q
133J-3HOV JO SONVSnOHiNI 'MOUNI

34 GROUND WATER, AMERICAN FALLS RESERVOIR, IDAHO
120 130 140 150 160 170 180 190 200 MONTHLY GROSS GROUND-WATER INFLOW, IN THOUSANDS OF ACRE-FEET
210
FIGURE 12. Ground-water inflow to American Falls Reservoi" plotted against midmonth water levels in well 5S-31E-27abl.
A straight line is drawn through the points, and deviations from the line are tabulated (table 3) in terms of an excess or a deficiency of inflow with reference to the inflow that would have occurred ac cording to the straightline plot. Several noteworthy items are shown by the tabulation:
1. Inflow was deficient during all 1956 (the grr.phs of water- table fluctuation and inflow (fig. 11) suggest that the water level in the well was abnormally high, perhaps because of local application of water or leakage from a canal).
2. September, October, and November generally show a deficiency of inflow.
3. May, June, July, and August generally show an excess ofinflow.
Possible explanations for the deviations, other than inaccuracies in the budget, and the postulated relation between water level and in flow are considered next.
WATER REGIMEN IN THE AMERICAN FALLS RESERVOIR AREA 35
TABLE 3. Deviation of inflow from straightline relations of inflow and water level, and the stage in American Falls Reservoir
1952
Devia tion of in flow i
Stagein
Ameri can
Falls Reser voir 2
1953
Devia tion of in flow
inAmeri
can Falls Reser voir
1954
Devia tion of in flow
Stagein
Ameri can
Falls Reser voir
1955
Devia tion of in flow
in Ameri-
car Fals Reser- voi-
1956
Devia tion of in flow
Stage in
Ameri can
FallsReser voir
Jan.. Feb.. Mar- Apr.. May. June- July.. Aug.. Sept.. Oct.. Nov.. Dec-.
-10 +1
+23+22+8+4-2
48.7251.0054.6854.8446.9336.4828.9532.5539.7546.07
-3-4
-10-13+1 +6 +8 +9 +4-2 +3 +3
5L76 53.49 53.75 54.51 52.03 54.59 45.87 34.45 25.68 30.47 39.60 44.83
0 +1
0 +3-3-3 +1 +3-5-6 _4-5
48.9352.1154.4254.4954.4353.7748.2737.6330.3335.2540.0344.06
+4+4+3+6
+12+10+12
0-6-4-3 +3
47.5751.5954.6054.6552.2449.6540.5528.0016.6122.6333.0442.82
-5-5--9-11
-16-26-9
-12-20-19--8-5
47.7548.6749.9952.8854.8454.3646.9737.0830.2034.5740.5145.32
1957
Devia tion of
inflow'
Jan.. Feb.. Mar.. Apr.. May- June. July.. Aug.. Sept.. Oct.. Nov.. Dec..
-2-2-3-6
+10 +24 +15+2-5
-11-2-1
Stage in Ameri
can Falls Reser voir*
47.0451.1753.9854.7054.7951.8841.0827.8817.9426.1536.2143.11
1958
Devia tion of inflow
0-2-3+1+6
+10+6+6+6+2
00
Stage in Ameri
can Falls Reser voir
47.1351.5054.3554.8054.3249.5337.2822.4616.2720.3728.6037.29
1959
Devia tion of inflow
+2__O-o
+1+33 +36 +21 +4-8
-15-8-1 +3
Stage in Ameri
can Falls Reser voir
43.8248.8252.7852.8247.0738.6525.6208.3507.0119.0829.3637.69
1960
Devia tion of inflow
+4+5+7
+28+43+35+12
-8-5
0+4
Stage in Ameri
can Falls Reser voir
43.1848.0553.0154.0046.8538.5622.0608.7499.2009.6422.5232.12
1 Deviation of inflow for all years in thousands of acre-ft.2 Stage in American Falls Reservoir minus 4,300 ft for all months except September 1960, minus 4,200 ft.
Seepage loss from the reservoir might explain deficiencies of in flow. Seepage loss is greatest when the reservoir is full. Maximum, pool altitude is about 4,355 feet; in most years the reservoir is nearly full for several months. For the period 1952-60 shown in table 3, there were 22 months in which the reservoir stage at the end of month was 4,353 feet or higher. The average monthly deficiency of inflow for the 22 months was about 2,000 acre-feet. This suggests some seepage loss occurs at high reservoir stages.
The effect of bank storage is to add to the inflow during declining reservoir stages, and to decrease inflow during rising stages. Table 3 shows 39 months, of a total 105 months, in which the reservoir stage declined. The average monthly excess of inflcw for these months was 5,500 acre-feet.

36 GROUND WATER, AMERICAN FALLS RESERVOIR, IDAHO
The total decline of reservoir stage in the 39 months was about 320 feet, or an average of 8 feet per month. The average- return to the reservoir, per foot of decline, was about 700 acre-feet. Newell (1929, p. 120) stated that "The mean rate of return for 192P is more than 1,500 acre-feet per foot of drawdown." However, as he pointed out, the reservoir was drawn down in 1928, from 4,354.5 to 4,338.2 feet. Study of the data in table 3 indicates that the return from bank storage, per foot of decline in reservoir level, is considerably greater during declines at a high reservoir stage than it is at r. low reservoir stage. If only the data in table 3 are used for declines between 4,355 and about 4,338 feet, an average gain of 1,800 acre-fe^t per foot of decline is given, which is close to the figure given by Newell.
Table 3 shows 60 months in which the water level in the reservoir rose (excluding those months in which the rise was slight). Average monthly deficiency of inflow for those months was 1,500 acre- feet.
Average loss, per foot of reservoir rise, was 300 acre-feet. Newell (1929, p. 123) stated that "The average rate of seepage per foot of fill experienced in 1927 and 1928 is 2,000 to 2,400 acre-feet or about 50% greater than the corresponding rate of bank return * * *. This is a small loss for the initial years of reservoir operation when some percolation is expected to go into dead storage." Here again it should be mentioned that the reservoir-stage fluctuation for the water budget presented in this report was from less than 4,300 feet to 4,355 feet; whereas in 1927 and 1928 the stage was entirely above 4,338 feet, a level where losses, whether to seepage or to bank storag?., undoubtedly are greater than at low stages. Neither the excess of 5,500 acre-feet mentioned previously nor the deficiency of 1,500 acr-vfeet is large enough to be significant to the analysis. Errors and discrepancies in the data, and in the correlation, probably are too great to give much credence to these figures. However, it is noteworthy that falling stages consistently showed an excess of inflow, and rising stages showed a deficiency of inflow. It is also noteworthy that the average monthly quantities indicated are on the order of 1,000-5,000 acre-feet.
WATER BUDGET, NEELEY TO MINIDOKA REACH
The water-table maps (pis. 1 and 5) show that ground water per colating from the American Falls Reservoir returns to the Snake River in the reach between American Falls Dam and Minidoka Dam.
WATER REGIMEN IN THE AMERICAN FALLS RESERVOTR AREA 37
An accurate water budget would define the gain in the r^ach and per mit compuations of the seepage loss from the reservoir. Because of several unknown factors, an accurate budget cannot be m^de; however, comparison of partial water budgets before and after operation of American Falls Reservoir gives an indication of the change in the budget due to construction of the reservoir, and of the magnitude of seepage losses.
Inflow in the reach consists of the discharge of the Snake River, Rock Creek, the Raft River, and small tributaries, and ground-water inflow. The Snake River discharge is measured at the gaging sta tion at Neeley, 0.9 mile downstream from American Falls Dam. Dis charge measurements of the Raft River and Rock Creek are not avail able near the mouths of these streams. No measurements are avail able for other tributaries.
Outflow from the reach occurs in the Snake River and in the North and South Side Minidoka Canals. All three of these are measured. Another item of outflow is seepage loss from Lake Walcott, behind Minidoka Dam.
The major unknown items of inflow are discharge of the Raft River, Rock Creek, and other tributaries, and ground-water inflow. Assumedly these items of inflow averaged about the same over a period of several years, both before and after the operation of American Falls Reservoir began, except for a gain from seepage loss from the reservoir. The major unknown item of outflow, seep^e loss from Lake Walcott, was minimized by selecting periods "when the lake level was relatively constant, both before and after operatior of American Falls Reservoir began.
The interval 1916-26 (water years) was used for the period prior to operation of American Falls Reservoir, and the intervals 1928-32 and 1944r-49 were used for the period after operation of American Falls Reservoir began. The interval 1933-43 was not used because it included a number of unusually dry years, and because operation of Lake Walcott was more erratic. Only December, Janur.ry, February, and March were used in the analysis because the river discharge and the level in Lake Walcott are more stable and evaporation from the lake surface is small during that interval of each y?&r. Even if variations occur from year to year, they would be small.
The following table compares the measured gain or lo^s in the reach between the gaging station at Neeley and the gaging station below the Minidoka Dam:

38 GROUND WATER, AMERICAN FALLS RESERVOIR, IDAHO
Average measured gain or loss in the reach between the gaging stations at Neeley and near Minidoka (in cubic feet per second)
Period
1916-26 (pre-reservoir) __ . _1928-32 and 1944-49 (post-
reservoir). ____
Difference __
Dec.
125
165
+ 40
Jan.
175
205
+ 30
Feb.
235
200
-35
Mar.
-30
140
+ 170
Average of 4
months
125
175
+ 50
If the above analysis is valid, seepage loss from American Falls Reservoir contributes an inflow of about 50 cubic feet per second (36,000 acre-ft annually) within the reach. This quantity of water is small and rather insignificant when compared with tin total amount of streamflow passing the gages at Neeley and Minidoka. The data suggest, however, that ground-water inflow has increased since the construction of American Falls Dam and Reservoir.
SPRING DISCHARGE BELOW AMERICAN FALLS DAM
Several springs of moderate size discharge water into the'Snake River between American Falls Dam and Minidoka Dam. Many small seeps discharge additional water. The observed springs and seeps are shown on the maps on plates 1 and 5. Named springs include Rueger, Davis, Mary Franklin Mine, Mower, and Gifford Springs. A good description of the springs was given by Stearns, Crandall, and Ste ward (1938, p. 151-154). Rueger Spring, about 0.75 mile downstream from American Falls Reservoir is the nearest spring to the reservoir dam. Discharge measurements of Rueger Spring between 1925 and 1928 were listed by Stearns, Crandall, and Steward (1938, p. 151), and additional measurements were listed by Newell (1928, 1929). Measurements have been made regularly in summer months since 1927 and are given in reports of the Watermaster, Water District 36. As a part of this investigation, monthly measurements we^e made during the winter of 1961-62; these are the only measurements available for the winter season. Selected discharge measurements are shown graphically in figure 13. The only measurements available for years prior to filling of the reservoir are the four made during the summer months both in 1925 and 1926. Average prereservoir discharge was about 16 cfs. Average summertime discharge increased to about 24 cfs, a 50 percent increase, in 1927, the first year the reservoir was filled.
The discharge of the springs has not increased since 1927. In fact, the discharge during the summer of 1961 was less tl an that in the
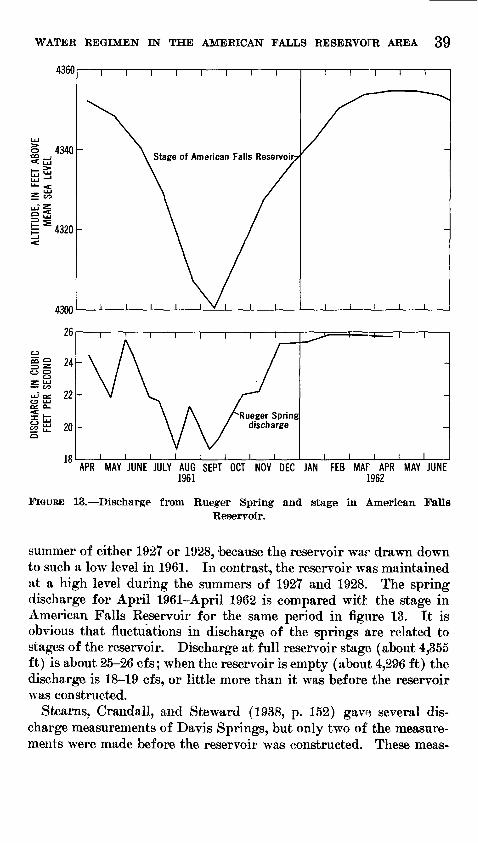
WATER REGIMEN IN THE AMERICAN FALLS RESERVOIR AREA 39
4360
o 4340
LU
= 1
E 4320
4300
r I i i i
Stage of American Falls Reservoir
r i i i i
i i i i i
APR MAY JUNE JULY AUG SEPT OCT NOV DEC JAN FEB MAP APR MAY JUNE 1961 1962
FIGURE 13. Discharge from Rueger Spring and stage in. American FallsReservoir.
summer of either 1927 or 1928, because the reservoir war drawn down to such a low level in 1961. In contrast, the reservoir was maintained at a high level during the summers of 1927 and 1928. The spring discharge for April 1961-April 1962 is compared witt the stage in American Falls Reservoir for the same period in figure 13. It is obvious that fluctuations in discharge of the springs are related to stages of the reservoir. Discharge at full reservoir stage (about 4,355 ft) is about 25-26 cfs; when the reservoir is empty (about 4,296 ft) the discharge is 18-19 cfs, or little more than it was before the reservoir was constructed.
Stearns, Crandall, and Steward (1938, p. 152) gave several dis charge measurements of Davis Springs, but only two of the measure ments were made before the reservoir was constructed. These meas-

40 GROUND WATER, AMERICAN FALLS RESERVOIR, IDAHO
urements suggest that the average discharge increased from about 2 to 3.5 cfs because of the reservoir. The same report (p. 153) lists many measurements of Mary Franklin Mine Springs, including 25 measure ments made in 1925 and 1926, prior to filling the reservoir. Average prereservoir discharge, including that from nearby seeps, was about 8 cfs. Average postreservoir discharge (1927-28) was about 10.5 cfs, or an increase of slightly more than 30 percent. As would be expected, the percentage of increase is less at Mary Franklin Min°, Springs than at Rueger Springs because the former are 2 miles downstream from the dam as compared with 0.75 mile downstream for Kueger Springs. Thus, the change in gradient caused by the filling of the reservoir is much less for Mary Franklin Mine Springs than for Eueger Springs.
The report by Stearns, Crandall, and Steward (1928, p. 152-153) gives considerable information on Gifford Springs and concludes that the discharge of the spring group now known as Gifford Springs probably was 25-35 cfs prior to irrigation of the Aberdeen-Spring field tract. Presumably, the discharge of these springs increased after irrigation on the tract began. No information could be obtained to substantiate this because construction of Minidoka Dam in 1907 and impoundment of water in Lake Walcott behind the dam resulted in drowning of some spring outlets.
The data cited on previous pages show that prior to filling Ameri can Falls Keservoir, total spring inflow into the Snake Eiver between American Falls Dam and Minidoka Dam was probably at least 60 cfs; because many seeps are unmeasured, the total inflow may have been 80-100 cfs. If an inflow of 100 cfs prior to construction of the reser voir is assumed, the total spring inflow because of reservoir losses after construction of American Falls Reservoir has probably increased as much as 25 percent, or about 25 cfs, because of reservoir losses after construction of the reservoir. This maximum increase would be at high reservoir stages; the average inflow probably increased only 15-20 cfs.
Some water discharges from the basalt beneath the dam. Accord ing to Glen Simmons, U.S. Bureau of Reclamation, BurlQ.y, Idaho (oral commun., May 1962), 10-15 cfs discharges into the Idaho Power Co. forebay in the left penstock section. This discharge is visible when the forebay is emptied at low reservoir stages. Presumably the dis charge would be more, perhaps two or three times as much, at high reservoir stages. The average discharge may be about 25-30 cfs, and thus the total gain between American Falls Dam and I *inidoka Dam that originates as seepage from American Falls Reservoir would be about 50 cfs. Maximum discharge at high reservoir stages probably would be about 70 cfs.
WATER REGIMEN IN THE AMERICAN FALLS RESERVOIR AREA 41
SEEPAGE LOSS FROM! AMERICAN FALLS RESEEVOIR
The water budget in the Neeley to Minidoka reach suggests an aver age seepage loss of 50 cfs. If the seepage loss through the basalt beneath the dam is added, then the total seepage loss determined by the water-budget method is about 60-80 cfs. Analysis of spring discharge indicates a seepage loss of 40-50 cfs. Because the data are inaccurate, the estimates have been averaged, and a value of 60 cfs is assumed to be the average seepage loss from the reservoir. Seepage loss at maximum stage is assumed to be 80 cfs. These estimates are probably reliable only as an order of magnitude.
Most of this seepage loss is through the fine-grained sediments in an area extending from the American Falls Dam to about f miles north of the dam. In this area and from there northward at least 8 more miles the materials from land surface, or from near th«, surface, to depths of 50-100 feet below the bottom of the reservoir are. fine grained (pi. 4) and transmit little water. Accordingly, the Snake Plain aqui fer is considerably below the bottom of the reservoir.
The water-table maps (pis. 2, 5) show that from about 6 miles north of the dam northward the water table is above high stages of the reservoir. What effect filling of the reservoir has on the segment ex tending from 6 to 14 miles north of the dam is not known, but water- level measurements and a comparison of the water-level contours shown on plate 2 with those shown on plate 5 suggest that in April 1962 the water table stood at an altitude about 2 feet higher than it would if the reservoir had not been filled. It is not known if rise in water level is caused by leakage from the fine-grained deposits into the basalt aquifers beneath or if the rise is a pressure effect from loading. However, the result is to increase the ground-water gradient west of the south end of the reservoir and, thus, to increase underflow in the aquifer.
EFFECT ON THE WATER REGIMEN OF RAISING THE RESERVOIR LEVEL
Raising the reservoir level might cause several changes in the hydro- logic regimen of the area. The changes probably include:
1. Increased seepage loss.2. Diversion of, or reduction of, ground-water inflow.3. Increased drainage problems.
A quantitative evaluation of these effects is helpful in considering the feasibility of raising the maximum stage of the reservoir.

42 GROUND WATER, AMERICAN FALLS RESERVOIR, IDAHO
INCREASED SEEPAGE LOSS
Present seepage loss from the reservoir averages atnut 60 cfs; the maximum rate is probably not more than 80 cfs (5,000 acre-ft a month), and this occurs when the reservoir is full.
Spring outlets to the Snake River below American Falls Dam are between altitudes of 4,196 and 4,280 feet. Thus, at present maximum pool stage in American Falls Reservoir there is a head difference of 75-160 feet between the reservoir level and the spring outlets. Rais ing the maximum pool stage in the reservoir 15 feet would increase the hydraulic head by an average of perhaps 15 percent and would increase the maximum seepage.
The increase in seepage loss can not be estimated on any sound basis, but one might speculate whether the amount is likely to be significant to the waiter regimen. The following assumptions were made:
1. Seepage loss from the American Falls Reservoir is propor tional to the head in the reservoir.
2. The maximum head in the reservoir is about 100 feet above the average altitude of the springs.
3. The seepage loss at maximum head is about f0 cfs, and theaverage loss is about 60 cfs.
Under these assumptions, seepage loss increases about 0.8 cfs per foot of head in the reservoir. Thus, increasing the head in the reservoir 15 feet would increase seepage loss about 12 cfs. If one assumes the loss is double this amount, or 24 cfs, it would seem to be a more than ample allowance. As a reasonable guess, raising th°- dam 15 feet might increase the maximum seepage rate by about 20 cfs to a total of 100 cfs, and the average rate 'by 10 cfs to a total of 70 cfs.
The calculated rates of increased seepage loss seem snail when com pared with either the capacity of the reservoir or the average inflow to it. An increase of 10 cfs amounts to about 7,000 acr>feet per year, and one of 20 cfs, about 14,000 acre-feet per year. Bo6h amounts are small when compared with the present reservoir capacity of 1.7 mil lion acre-feet or the proposed increase in capacity of 0.9 million acre- feet. The same seepage rates contrast with inflow to the reservoir of 4-6 million acre-feet per year. An estimate 'greater by an order of magnitude would be only about 3 percent of the inflow.
An area of concern with respect to a possible increased seepage loss with an increased maximum reservoir stage begins 3 miles north of the west end of American Falls Dam. From the north edge of section 13, T. 7 S., R. 30 E., basalt crops out intermittently in the reservoir bank for about 2 miles (pi. 2). The actual length of outcrop along the shore line is about 1.5 miles. The basalt overlies the Raft Formation, and the contact 'between the two units is -at an altitude of 4,335-4,340

WATER REGIMEN IN THE AMERICAN PALLS RESERVOIR AREA 43
feet. Thus, at present maximum reservoir stages the basalt is submerged 15-20 feet, and with an increased stage it would be submerged 30-35 feet. The basalt is porous and permeable and can transmit large quan tities of water. The water-table map showing the water tr.ble at a full- reservoir stage in April 1962 (pi. 2) shows the water table sloping westward from this area. However, this is the water table in the Snake Plain aquifer, tapped by wells ending below the Raft Formation. The water table in the basalt overlying the Raft Formation is perched and slopes toward the reservoir. Figure 14 shows the relative position of the perched water table in wells 7S-30E-12cal and -14dcl and the stage of the reservoir for the period May 1961-July 1962. A small, probably insignificant amount of water percolates downward to the Snake Plain aquifer through the fine-grained sediment? of the Raft Formation. An increased head caused by higher reservoir stages
4370
4290MAY JUNE JULY AUG SEPT OCT NOV DEC JAN FEB MAR APR MAY JUNE
1961 196,?
FIGUBE 14. Hydrographs of wells 7S-30E-12cal, 7S-30E-14dcl (perched water table) and of American Falls Reservoir.

44 GROUND WATER, AMERICAN FALLS RESERVOIR, IDAHO
probably would not greatly increase percolation through the Raft Formation from the perched water table.
An increased reservoir stage would raise the perched water table and might slightly reduce inflow from the perched aquifer to the reservoirs but it probably would not result in any direct seepage loss along this segment of shoreline.
The water-table map (pi. 5) also suggests that there is some seepage loss from a short segment of the reservoir at the east end of American Falls Dam. However, the materials exposed along the shoreline and those penetrated by wells are generally fine grained and have low permeabilities. Supply wells in the area are drilled far Hlow reservoir level to obtain an adequate water supply. The seepage loss from that segment of the reservoir is undoubtedly small.
DECREASED GROUND-WATER INFLOW
Field examination and the topographic quadrangle maps show that nearly all major spring-outlet areas are at altitudes above 4,370 feet, and most are above 4,375 feet. The profiles and water-table map (pis. 4, 5) show that the water table drops steeply near the reservoir; thus, raising the reservoir level will affect the water table fcr only a short distance away from the reservoir.
Most of the springs whose outlets are below 4,375 feet are along the Snake River at the northwest end of the reservoir. Temporary sub mergence of these outlets would delay inflow to some extent, but the ground-water divide is sufficiently distant that it would not shift greatly in the few months during which the reservoir was at the higher level. Later, as the reservoir is drawn down, the inflow to the reservoir would increase, roughly by an amount equivalent to the decrease in inflow at high stages.
DRAINAGE PROBLEMS
A number of areas in the vicinity of American Falls Reservoir were waterlogged in 1961. The largest area extended from about 3 miles northeast of Aberdeen, through Sterling, to nerr Springfield. Study of aerial photographs and topographic maps shoVs that most of these areas are at altitudes that preclude waterlogging as a result of high reservoir stage; heavy applications of irrigation water are prob ably the cause. Waterlogged areas are shown on the Springfield 7%- minute quadrangle map. One group of ground-water ponds and swamps is on the lowest terrace, about 0.75-1 mile from the reservoir edge, at the foot of the next higher terrace 20-30 feet higher than maximum pool stage. Another band of waterlogged land is on the second terrace near the foot of the third terrace; this arra is 40-60 feet
CONCLUSIONS 45
above present maximum pool stage. Examination of the hydrographs in figures 4 and 5, shows that the water table in this area is highest in the late summer, when the reservoir is low, and lowest in the spring, when the J*eservoir is full. Obviously, most of the waterlogged areas were not caused by the reservoir.
Kaising the maximum reservoir level to 4,370 feet would affect an area near Sterling and one between Sterling and Strang. An area of 7 or 8 square miles near Sterling is below an altitude of 4,380 feet; raising the maximum reservoir level to 4,370 feet would probably cause waterlogging in some parts that are not already waterlogged. One or two square miles of land between Springfield and Sterling would be similarly affected.
East of Aberdeen, between Big Hole and Little Hole, the land-sur face altitude is irregular. Some areas would be inundated at a reser voir stage of 4,370 feet, and additional areas would be only a few feet above .maximum reservoir stage and would probably be waterlogged at times.
Southwest of Little Hole most of the lowest terrace is above 4,390 feet, and little or no land would be waterlogged at an increased reser voir stage.
Along the southeast side of American Falls Keservoir tin lowest ter race is mostly above 4,400 feet, and the area below 4,390 feet is only a few hundred acres. It is unlikely that any extensive areas on the south east side of the reservoir will become waterlogged at r,n increased maximum stage of 4,370 feet.
CONCLUSIONS
Ground-water inflow in the American Falls Reservoi" reach was probably about 1.2-1.4 million acre-feet a year (1,700-1,900 cfs) before irrigation began in eastern Idaho. Inflow increased with the increas ing diversions of surface water to lands adjoining the Snal~e Kiver and in the late forties and early fifties averaged about 1.95 million acre- feet annually (2,600 cfs). About 1952 increased withdrawals of ground water apparently became large enough to prevent further in creases of ground-water inflow. Between 1922 and 1952 the ground- water inflow increased roughly 2.5 acre-feet for every 10 acre-feet of surface water diverted to lands on the Snake Kiver Plain upstream from American Falls Dam.
The waiter budget for the period 1950-60 shows that r- reasonably good correlation exists between fluctuations of the water table and cyclic fluctuations in ground-water inflow. No correlation can be made between the water table in the area of spring inf ow and the stage of the reservoir. However, near the dam the water-table fluc-
255-995 O 67 4
46 GROUND WATE.R, AMERICAN FALLS RESERVOIF, IDAHO
tuations coincide with the reservoir stage, and at high stages the water level in the reservoir is higher than the water table; thus, there is some seepage loss from the reservoir. The fine-grainei deposits crop ping out along the shore extend to depths of 50-100 feet below the bottom of the reservoir. Because they have a low transmissibility and because of northwest trending impermeable faults that cut the underlying permeable units, seepage loss from the reservoir is rela tively small. Water-table contours and flow lines indicate that this seepage returns to the Snake River between American Falls Dam and Minidoka Dam.
Extrapolation of spring-flow data and computations of a partial water budget for the reach of river between American Falls Dam and Minidoka Dam provide a rough estimate of seepage loss from Ameri can Falls reservoir. Under existing conditions the average loss is estimated to be 60 cfs, and at maximum stage, 80 cff, The increase in loss, if the dam were raised 15 feet, might be 10 cfr on the average and 20 cfs at maximum. Even if the values are low by an order of magnitude, the increased loss at maximum stage would be less than 3 percent of the average rate of inflow to the reservoir.
Raising the maximum reservoir level 15 feet, to an altitude of 4,370 feet, probably will not decrease ground-water inflow greatly because most spring outlets are above 4,370 feet.
Areas currently waterlogged are well above maximum reservoir stage and are not related to reservoir stage. However, several square miles of terrace is at altitudes only slightly above 4,370 feet, and some parts of this terrace are already waterlogged. Raising the maximum reservoir stage to 4,370 feet will undoubtedly waterlog additional acre age. To determine the extent of this acreage will require detailed mapping of the areas.
REFERENCES
Berkey, C. P., 1934, Memorandum no. 1 on the geologic implications of raising the dam at American Falls: .U.S. Bur. Reclamation, 6 p.
Carr, W. J., and Trimble, D. E., 1963, Geology of the American Falls quad rangle, Idaho: U.S. Geol. Survey Bull. 1121-G, 44 p.
Dealer, E. B., and Biter, J. R., 1935, Report on 'upper Snake River storage investigations, American Falls enlargement: U.S. Bur. E'^clamation, 236 p.
Isaak, Jake, 1960, Annual Report, Aberdeen-Springfield Canal Co.: Aberdeen, Idaho, 12 p.
Jarrard, L. D., and Mead, W. E., 1951, Preliminary geologic report, American Falls power sites, Minidoka Project, Idaho: U.S. Bur. Reclamation, Boise, Idaho, 28 p. (July).
1952, Appendix to preliminary geologic report, American Falls pow^r site, Minidoka Project, Idaho: U.S. Bur. Reclamation, B<nse, Idaho, 5 p.
Kirkham, V. R. D., 1931, Snake River downwarp: Jour. Geology, vol. 39, no. 5, p. 456-482.
REFERENCES 47
Kohler, M. A., Nordenson, T. J., and Baker, D. B., 1959, Evaporation maps forthe United States: U.S. Weather Bureau, Tech. Paper 37, 13 p.
LeFehr, T. R., 1961, Gravity survey in the eastern Snake River Plain, Idaho a progress report: U.S. Geol. Survey open-file report, 30 p.
Mansfield, G. R., 1920, Geography, geology, and mineral resources of the FortHall Indian Reservation^ Idaho: U.S. Geol. Survey Bull. 7:3, 152 p.
Mundorff, M. J., Crosthwaite,*E. G., and Kilburn, Chabot, 1964, Ground waterfor irrigation in the Snake River basin in Idaho, U.S. Geol. Survey Water-Supply Paper 1654,224 p.
Newell, T. B., 1928, Segregation of water resources, American F/'lls basin andAmerican Falls Reservoir, April 15 to October 15, 1927: Y^ater District36, (Idaho Falls), Idaho, 127 p.
1929, Segregation of water resources, American Falls basin and AmericanFalls Reservoir, May 21 to October 17, 1928: Water District 36, (IdahoFalls), Idaho, 144 p.
Piper, A. M., 1924, Possibilities of petroleum in Power and Oneida Counties,Idaho: Idaho Bur. Mines and Geology Pamph. 12, 24 p.
Ross, D. W., 1901, Biennial report of the State Engineer, Idaho 1899-1900;State of Idaho, Capitol Printing OflSce, 101 p.
Shuter, Eugene, 1953, Records of wells and water-level fluctuations in westernBingham County, Idaho: U.S. Geol. Survey open-file report, 97 p.
Simons, W. D., 1953, Irrigation and streamflow depletion in the Columbia BiverBasin above The Dalles, Oregon: U.S. Geol. Survey Water-Supply Paper 1220,126 p.
Sisco, H. G., and Luscombe, R. W., 1961, Records of wells ard water-levelfluctuations in the Aberdeen-Springfield area, Bingham and Power Counties,Idaho, in 1960: U.S. Geol. Survey open-file report, 35 p.
Stearns, H. T., Crandall, Lynn, and Steward, W. G., 1936, Records of wells on theSnake River Plain, southeastern Idaho: U.S. Geol. Survey Water-SupplyPaper 775,139 p.
1938, Geology and ground-water resources of the Snake Biver Plain in southeastern Idaho: U.S. Geol. Survey Water-Supply Paper 774, 268 p.
Stearns, H. T., and Isotoff, Andrei, 1956, Stratigraphic sequence in the Eagle Rock volcanic area near American Falls, Idaho: Geol. Soc. America Bull., v. 67, no. 1, p. 19-34.
Trimble, D. E., and Carr, W. J., 1961, The Michaud Delta and Bonneville River near Pocatello, Idaho, in Short papers in the geologic and hydrologic sciences : U.S. Geol. Survey Prof. Paper 424-B, p. B164-B166.
1961, Late Quaternary history of the Snake River in the American Falls region, Idaho: Geol. Soc. America Bull., v. 72, no. 12, Dec. 1961, p. 1739-1748.
U.S. Beclamation Service, 1919, secondary projects Idaho, American Falls Beservoir, ground-water conditions [map]: Burley, Idaho, Mar 17,1919.


BASIC DATA
Rec
ords
of
sele
cted
wel
ls n
ear
Am
eric
an F
alls
Res
ervo
ir
[Loc
atio
ns o
f wel
ls sh
own
on p
late
2)
Alt
itud
e: l
and-
surf
ace
datu
m a
t w
ell,
t, a
ltit
ude
estim
ated
fro
m t
opog
raph
ic m
ap.
Dep
th t
o w
ater
: in
fee
t be
low
lan
d su
rfac
e da
tum
, e,
est
imat
ed f
rom
mea
sure
men
ts m
ade
at o
ther
tim
es.
Cn
O CO H
CO
H
Wel
l
38-3
1 E-35cdl
33E
-31d
cl ------ -
36ddl_
... ..
..4S
-30E
-34c
al...
-
'31E
-2bcl.
..
9dbl_
-
llcbl.
-.-
1
4d
cl.
..
.
Ifid
cl-
..
20bb
l_ ..
..24bcl-
--
28
bcl
...-
-
29
aal.
.
29dal.
-- ..
31C
C1-
. ...
... ..
..33ddl.
.. .
.. -
36abl.
....
32E
-ldal
..-.
..
...
6dcl.
... .
8cd
l...
... .
....
..9d
cl_.
.......
-9ddl
llab
l. ........ -
13cbl_
.
13cd
l ..
. ...
. ..
13da3
.....
13dcl
.
14
ad
l_--
..
14da
2.. ...
..
-IS
cdl.
...... -
16ddl.
.. -
17da
l. ....
17dd
l.. ..
... .
21bb
l. ..
....
....
Ow
ner
Her
bert
Hall
...-
- - ----
Dee
Wim
nll
l--
Clif
f ord
Wri
de. -
--- .... ..
Her
bert
Hall
E.
P. H
eaney.. .
Milt
on L
ine
Phi
llip
Ch
an
dle
r --
-..-
__
. ......
Sant
o D
eOui
lio _
____ - _
____
Ric
hard
D.
Mic
hael
son.
. . .
_ _
__
Dep
th
(fee
t)
148 60
240
113
160
133 85
20
1 15
0
162 17
74
60 207
105
111
112 60
55
79
37 226
220
255
171 47
Dia
met
er
(inc
hes) 16 14
16
8 16
16 16
12 16 6 IK
16
6
12-3
6 6 7 6 6 10
10 6 10 8 6 8 8 5 6
Cha
ract
er o
f aqu
ifer
--.-
.do
....
... ..
.. ..
....
....
Basalt.
_
Alt
itud
e
4, 51
0. 9
4,
462.
2
4,43
8t
4, 5
95. 7
4,
508.
0
4, 5
17. 6
4, 4
71. 9
4,
456
. 5
4, 4
64. 8
4,
523.
3
4, 45
2. 5
4,
462.
6
4, 46
7. 8
4,
453.
4
4, 5
36. 2
4,
433.
5
4, 40
1. 8
4,
443.
1 4,
437.
3
4,46
3.1
4,45
7.3
4,43
8.9
4,44
0t
4, 14
1 1
4, 41
0. 9
4,
413.
0
4,42
3.2
4, 39
3. 6
4,
408.
0 4,
410.
6
4, 39
0. 9
4,
415
t 4,
414
. 1
4, 41
1. 9
4.
406.
8
Dep
th t
o w
ater
Dep
th
95 e
45
.8
197.
5 e
95
.0
67. 7
e
47.7
56
.7
115.
1 45
.0
60 e
65
e
50 e
13
4.5
27.8
2.
3 43
.4
19.7
35.0
32
.7
15.6
20
.2
27.0
1.
1 12
.9
1.1
+18
.4
Flo
ws
5.8
6.2
6.0
Dat
e
10-
-61
7-15
-53
10-
-61
7- 9
-53
10-
-61
10-1
6-61
10
-16-
61
10-
2-53
10
-16-
61
10-
-61
10-
-61
10-
-61
8-25
-53
8-27
-49
10-1
5-61
10
-17-
61
11-
7-46
10-1
6-61
10
-16-
61
10-1
7-61
10
-17-
61
10-1
7-61
10
-17-
61
10-1
7-61
10
-17-
61
10-1
7-61
10-1
6-61
10
-16-
61
10-1
6-61
Dep
th
98.7
52
.1
199.
57
95.3
11
1.0
68.7
48
.7
57.6
11
9.2
46.7
61
.3
66.5
52
.7
138.
2 29
.9
5.8
46.4
21
.4
51.8
52
.4
37.0
17.5
21
.9
29.0
3.
2 14
.8
+18
.0
10.4
10
.0
8.0
Dat
e
4-14
-62
4-16
-62
4-14
-62
4-14
-62
4-14
-62
4-14
-62
4-16
-62
4-16
-62
4-14
-62
4-16
-62
4-12
-62
4-12
-62
4-12
-62
4-12
-62
3- 5
-48
4-15
-62
4-16
-62
3- 6
-47
4-16
-62
4-15
-62
4-15
-62
4-15
-62
4-15
-62
4-15
-62
4-15
-62
4-15
-62
4-12
-62
4-15
-62
4-15
-62
4-15
-62
21dbl-
.
22adl-
..-
-
23ccl
24cb
l28bal
--_. -
28
bcl
---.
-
28cc
2 _.
.
29
abl-
-.-
-
29ddl-
_ -
31ab
l. --
---~
31bal-
-.-
-
31
dal-
....
33bc
l~
33
E-l
bcl
.
3cb
2.
_
5bbl
-..
8b
bl.
-- ..
.lO
dal..
. ...
-- .
15bb2.-
.. -
17cb
l ..
... -
18
cbl
..
..20bbl-
.-- ..
.2
0cd
l .
20dbl.
-
22
bal
.... ..
.22cb
l -
29ac
l. .
... -
29bcl
...... .
29bdl-
-.-.
34
E-5
ccl_
. ~
5S-3
0E-2
acl -
lOcb
l
lOd
bl.
- -
12
bb
l.._
-
12
cdl
. -
13bcl
13cc
l
14
cal
. ..
...
16
ad
l.-.
-
24
abl-
_-.
.
36
db
l...
...
..31
E-2
cdl
-
4dal-
__ .
-
6dcl
....
7aal
5S-3
1E-8
adl -
llcal
12
bcl-
. ..
... .
14ba
l... .-
14cd
l. -
Bill
Webb
.-
Mild
red
Rei
d..-
. . ~
U.S
. G
ov
t.. ..
.....................
Clif
ford
Wri
de...
....
... .
....
....
....
..
... .
.do - .. ..
....
-.-
..-
T.
S. V
ande
rfor
d _______ . .
....
...
Lesl
ie P
ratt
. __
. __
. ________
-...
.do
-.
Abe
rdee
n-Sp
ringf
ield
Can
al C
o..
. __
W.D
.Tho
mps
on. _
__
...........
Mrs
. Luc
ile C
omer
__________
238
152 29 9
236
103 9 70 192 65 21? 71 243 48 53 76 100 40 48 85 77 56 34 133 38 18 37 169
240
200
200
126
120
195.
519
427
8 74 100 81
.317
8.5
165 86 111 73 35 60
6 6 6 6 8 4 6 6 8 12 8 8 6 6 6 16 16 12 16 816
-18 16 22 16 14 16 20 10 6 18 24 24 12 12 18 16 16 24 8 18 8 18 4 8 4 4
Bas
alt
Cin
ders
__
__
__
__
__
__
Bas
alt _
. _________ .
- d
o
-...
.do
. .
Gra
vel _
__
__
__
__
__
__
.....d
o ..
Bas
alt _
. .d
o... .. ... . .
4,37
7.6
4,37
5.8
4,37
1.6
4,38
3.5
4,38
0t4,
370.
84,
376.
34,
388.
24,
368.
94,
401.
14,
401t
4,38
6.7
4,37
4t4,
434.
34,
447.
94,
444.
94,
459.
84,
405t
4,41
3.0
4,42
6.6
4,42
2.6
4,41
1.8
4,42
0.1
4,41
4.3
4,40
5.0
4,38
6.5
4,41
7.3
4,39
1.3
4,39
5t4,
405.
24,
553.
64,
582.
14,
554.
84,
501.
54,
481.
54,
467.
44,
458.
94,
515
. 74,
609.
34,
446.
94,
464.
34,
410t
4,44
8.8
4,51
8.3
4,50
3.9
4,46
2.2
4,41
0.0
4,39
8.9
4,40
7.5
4,40
4.2
Flow
s+
7.6
2.4
5.3
Flow
s3.
03.
96.
7Fl
ows
10.0
Flow
s6.
0Fl
ows
26.8
36.3
41.9
48 e
29.0
21 e
26.9
17 e
38 e
30 e
29.5
24.8
45 e
19 e
15 e 3.8
157
192
e16
5 e
109.
088
.278
e71
. 8 e
130.
322
3 e
59. 3
e
49.4
123
e10
9 e
65.4
14.5
12.4
15.4
19.2
10-1
7-61
10-1
7-61
10-1
7-61
10-1
6-61
9-22
-61
10-1
6-61
10-1
7-61
10-1
7-61
6-13
-61
10-1
8-61
7-15
-61
10-
-61
10-1
7-61
10-
-61
10-1
7-61
10-
-61
10-
-61
10-
-61
12-1
1-57
10-1
7-61
10-
-61
10-
-61
10-
-61
10-1
8-61
1953
10-
-61
10-
-61
10-1
5-61
8-29
-51
10-
-61
10-
-56
7-21
-53
10-
-61
10-
-61
10-1
5-61
10-
-61
10-
-61
10-1
5-61
10-1
6-61
10-1
5-61
10-1
5-61
10-1
5-61
+9.
52.
15.
7
2.7
7.3
11.3 6.1
29.0
39.0
45.9
53.6
31.3
29.3
28.9
23.1
42.2
35.6
30.6
25.4
46.3
20.2
15.6 4.5
193.
516
6.0
109.
292
.279
.772
.612
9.2
223.
260
.785
.7
53.4
123.
310
9.9
66.0
17.4
14.0
19.1
26.9
4-12
-62
4-15
-62
4-15
-62
4-15
-62
4-15
-62
4-15
-62
4-15
-62
4-16
-62
4-18
-62
4-16
-62
4-16
-62
4-15
-62
4-16
-62
4-15
-62
4-12
-62
4-16
-62
4-16
-62
4-15
-62
4-15
-62
4-16
-«2
4-16
-62
4-16
-«2
4-13
-62
4-11
-62
4-11
-62
4-12
-62
4-12
-62
4-11
-62
4-11
-62
4-11
-62
4-11
-62
4-11
-62
4-11
-62
4-14
-62
4-12
-62
4-12
-62
4-12
-62
4-15
-62
4-15
-62
4-15
-62
4-15
-62

Rec
ords
of
sele
cted
if e
lls n
ear
Am
eric
an F
alls
Rese
rvoir
Con
tinu
edto
Wel
l
5S-3
1E-1
5abl
. - -
19ddl
-..--
22ad
l
23abl
--
23ad
l -- -
25
bb
l.._
-
25
bcl
_
-2
7ab
l---
-
27da
l-_ -
27
dcl
29ad
l._
29ccl_
-_
33ad
2--
-_
33
bd
l.
33ccl
. -
34aa
2-_
- ..
35aal
- -
36aal
-
32E
-6ddl_
-
7cc
2__. ..
....
.IS
cdl-
.
ISdcl.
.
33E
-25bbl~
34adl-
..-
...
34cbl-
..
36ccl
36
88
1
34E
-30881-
30
dal_
6S-3
0E-1
3acl
13bc
l - .
ISca
l...
... .
... .
.2
2aal.
24ac
l.._
...
.. .
24
bb
l...
24cal
..
. -25bbl-
_ . -
26
88
1.
34
aal.
34cal
.... ..
.. .
35cc
2 .
....
. ...
86ac
l
Ow
ner
- do
Marl
lBeck
..d
o.... .
.do
.... . d
o-.
.. ....... .
....... .
.........
Will
iam
Fu
nk
Ann
in S
chro
eder
..- _
__
. __
_ ..
.
Dep
th
(fee
t)
325 61
.3
70=F
58
.4
273
108 33
46
106 70
116 85
327 35
.8
85
36.9
61
.2
200 21
15.4
24
0 22
0 16
5 15
3.5
123 60
90
70
89.6
12
0 23
6 17
0 27
0±
145±
16
5±
165
175
205
235
206.
8 21
8 15
4
Dia
met
er
(Inc
hes)
10-1
8 6 6 8 6 16 6
12-1
6 12 4 18 4 6 16 8 6 8 6 1M 16 6 6 6 6 6
14-1
6 16
14-1
6 10
12
14
16
16
20
16
16-2
1 16
16
Cha
ract
er o
f aqu
ifer
Bas
alt.
- --
-
- -.
do
. .-
-----
. .-
.S
and
- d
o..
d
o..
....
.do
-.
-
-do..
- d
o..
.d
o
Cin
ders
. .. _
__ -
___ ..
...
Alt
itud
e
4,42
8.7
4,42
7.0
4,40
1.0
4,39
6.5
4,39
6.3
4,39
5.0
4,39
4.0
4,39
9.8
4,40
3.1
4,40
2.6
4,40
6.3
4,43
2.0
4,4
04t
4,39
9.4
4,40
3.0
4,39
6.5
4,39
1.7
4,3
55
t 4,
370.
8 4,
374.
7 4,
373.
8 4,3
75t
4,45
7.4
4,4
18t
4,4
31t
4,42
8.8
4,4
60t
4,4
60t
4,4
70t
4, 4
71. 9
4,4
80t
4,46
8.2
4,54
6.2
4,45
4.3
4,45
8.0
4,46
7.6
4,46
8.8
4,4
80t
4,51
4.8
4,52
3.8
4, 5
18. 2
4.
427.
1
Dep
th t
o w
ater
Dep
th
37.3
43
.3
16.8
11
.4
8.0
24
.5
24.9
18
.4
25.1
21
.1
18.6
45
.1
16.0
19
.9
20.5
22
.0
Flo
ws
5.8
2.7
+9
.9
58.5
13
e
30.9
2
46
54
e
35
61.6
96
.6
107 98
.0
85.4
89
.4
100.
5 10
2.9
170.
2 17
7.3
173.
0 62
.2
Dat
e
10-1
5-61
10
-15-
61
10-1
5-61
10
-15-
61
10-1
5-61
10
-15-
61
10-1
5-61
10
-15-
61
10-1
6-61
8-
1-52
10
-16-
61
10-2
4^45
10-1
5-61
10
-16-
61
10-1
5-61
10
-15-
61
IiMin
ii10
-15-
61
10-1
5-61
10-1
4-27
10
- -6
1 8-
29-5
2 10
-16-
61
10-
-61
1955
8-
15-5
2 10
-19-
61
1953
10
-19-
61
IJM
SH
ii
10-1
9-61
10
-19-
61
10-1
9-61
10-1
6-61
10
-19-
61
10-1
9-61
10
-19-
61
Dep
th
38.8
44
.4
24.4
20
.0
7.6
26.7
26
.5
24.8
31
.0
26. 6
e
20.5
19.2
e
21.7
24
.8
23.8
2.5
2.9
+1
5.7
61.2
12
.8
33.6
25
.0
54.1
83.7
97.0
18
6.0
82.5
88
.4
99.1
10
1.5
169.
8 17
4.7
170.
2 60
.4
Dat
e
4-15
-62
4-11
-62
4-15
-62
4-15
-62
4-15
-62
4-11
-62
4-11
-62
4-11
-62
4-11
-62
4-
-62
4-11
-62
4-
-62
4-11
-62
4-11
-62
4-11
-62
4-15
-62
4-15
-62
4-12
-62
6-6
-28
4-26
-59
4-26
-59
4-11
-62
4-27
-55
4^13
^62
tiiw
i24-
13-6
2 4-
13-6
2 4-
12-6
2 4-
12-6
2 4-
13-6
2
4-13
-62
4-12
-62
4-13
-62
4-43
-62
O » o
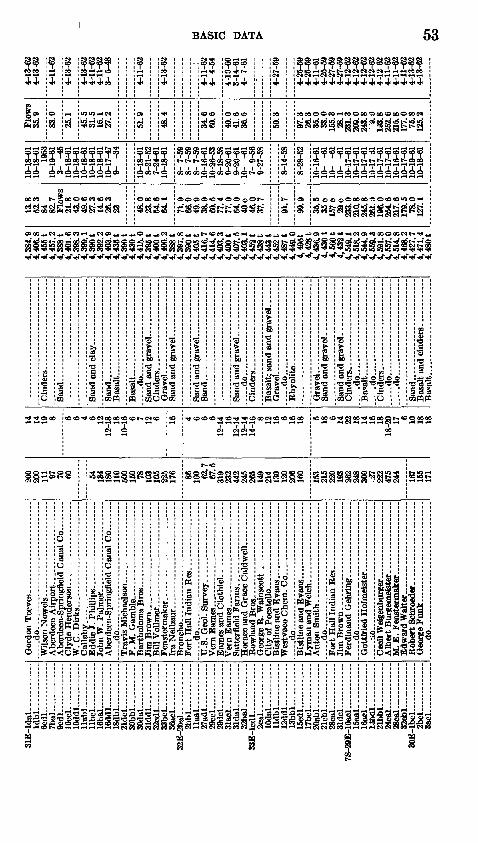
31E
-lda
l-- ..
. .
Idb
l -
6cdl.
... ..
....
Tb
al .
9cd
l .
lOccl
.
lO
ddl.
...
llabl.
... ..
..li
bel
16bal.
16
dd
l -
18dbl
21
dcl
...
. ...
..S
Obbl.
..
30
dal
Sld
dl
32
cdl
33bcl
36ac
l ..
. .
32E-
2baJ
- -------
2b
bl
- ..
.ll
aft
l
27
ad
l .
..
29
ccl.
.. ..
.28dcl.
.
31ac
l
31dal
-
32ba
l. ..
... ..
.3
3E
-lcd
l
9nn
1
lOdal
-
lld
bl.
1
2d
dl.
_ ..
..13
bbl..
. ...
iBcdl.
...
ITbcl
. ..
.20abl.
.. _
21
cbl.
. ..
.. .
28
cal
31
dcl
... .
.. ..
7S
-29E
-10ac
l..
ISaa
l-
Iftn
nl
latx
ii - -
21
bb
l
24cal
28ca
l3
2cb
l...
_
_3
0E
-lb
cl
2b
cl
3acl
d
o..
. ..
W. C
. D
irk
s
Edd
ie J
. P
hillips
F. M
. G
ambl
e
Bill
Vol
lmer
. --
Fens
term
aker
d
o..
..
. d
o .
do
...
d
o.... ..
.
JO
....
...
-.d
o..
..
..
. ...
... .
....
....
200
200
111 97 70 60 54 134
180
110
500
160 78 103
105
225
176 86 100 62
.767
.531
923
244
224
526
514
921
413
012
020
616
0
153
215
220
193
262
248
300
27
222
475
244
167
166
171
14 14 19 8 6 6 4 6 1212
-18 18
10-1
6 6 7 12 6 16 4 6 6 612
-14 16
12-1
412
-14
14-1
6 12 16 6 16 18 5 18 6 14 22 18 14 16 1818
-20 17 6 10 18 18
do.
d
o
Kh
yo
lite
.do
....
. do..
...
..... d
o..
.do .
Ba«
alt
4,38
4.9
4,40
6.8
4,45
5t4,
467.
24,
388t
4,40
1.6
4,39
8.3
C39
9.1
4,39
0t4,
392
24,
403.
94,
436t
4,39
0t4,
430t
4,41
5.0
4,40
0t4,
400.
2,3
88
t,3
97.8
,39
0t
,40
5t
,416
.7,4
14.6
4,40
3.3
,40
0t
,407
.5,4
03.1
,45
2t
,438t
,44
3t
,45
2t
4,48
7tA
AAn
n4,
495t
4,42
8t4
43A
04
,43
0t
4,56
0t4
,43
2t
A
IdQ
1
4,51
8.2
A
KA
A
O
4,55
9.3
4,59
1.8
4,55
7.0
4,51
4.8
4,46
8.2
4,42
7.7
4,47
1.4
4.48
0t
13.8
52.3
84 82.7
21.8
43.0
0.6
27.3
14.6
26.3
23 48.0
23.8
54.6
64.1
71
0
66.9
4Q
O
38.9
60.5
77.4
77.0
fu n
40 e
46.0
37.7
91.7
99.9
35.5
35 e
157
e29
e23
3.0
210.
824
5.8
261.
i)19
6.0
254.
621
7.6
179.
578
n12
7.1
10-1
8-61
10-1
8-61
1953
10-1
9-61
3-
-45
10-1
8^61
10-1
8-61
10-1
8-61
10-1
8-61
10-1
8-61
10-1
7-47
9-
-34
10-1
8-61
8-21
-52
7-24
-61
10-1
8-«1
8- 7
-59
8- 7
-59
8-7
-59
10-1
6-61
10-2
6-53
8-18
-58
9-20
-61
9-20
-61
10-
-61
7-9
-56
9-27
-58
8-14
-58
8-28
-52
10-1
6-61
10-
-61
10-
-61
10-
-61
10-1
7-61
10-1
7-61
10-1
7-61
li)-1
7 31
10-1
7-61
10-1
7-61
10-1
6-61
10-1
7-61
10-1
9-61
10-1
8-61
Flo
ws
35.9
83.0
25.1
45.5
31.5
16.1
27.2
51.9
48.4
34.6
60.6
40.0
41.6
36.5
50.3
97.3
26.3
35.0
33.0
155.
328
.123
1.3
209.
024
3.8
i. 0
133.
826
2.6
215.
817
7.0
75.8
125.
2
4-13
-62
4-13
-62
4-11
-62
4-13
-62
4-13
-62
4-11
-62
4-11
-62
3- 5
-48
4-11
-62
4-13
-62 i
4-11
-62
4- 4
-54
4-10
-60
3-14
-61
4- 7
-61
4-27
-59
4-25
-59
4-25
-59
4-11
-61
4-25
-59
4-27
-59
4-27
-59
4-12
-62
4-12
-62
4-12
-62
4-12
-62
4-12
62
4-11
-62
4-11
-62
4-11
-62
4-13
-62
4-13
-62
I a s CO
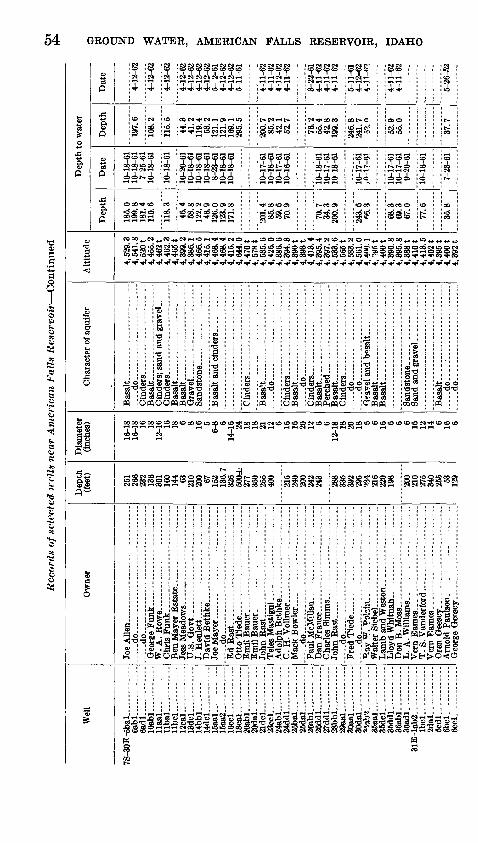
Rec
ords
of
sele
cted
icc
lls n
ear
Am
eric
an F
alls
Rese
rvoir
Con
tinu
ed
Wel
l
7S
-30E
-5bal
tob
l
ted
l....
lOabl
. ..
llaal
. -
llbal
lib
el
12ca
l -
-IS
dcl
14
bb
l.
Md
cl
15aa
l15
aa2
Ifip
p!1
8ca
l
20abl.
. -
2
0d
al --
---
21
dcl
.
23cel.
.- .
.. -
24abl
24
dd
l. . -
25bal
- -
25dal
.
26
ab
l
26dd
l... .
27ddl.
-
28bb
l... -
29
aal.
-
Ste
al
SOda
l... .
'Hab
'J..
35
aal
-
35dcl-
.-
35
dd
l- .
-
36abl.
_ .
.
36ad
l--~
-
3lE
-lab
2.-
Ibcl.
.. -
.
2d
al.
. -- -
5cdl.
-.
---
6bcl.
.-
eeci
Ow
ner
-.d
o
..
..
_
do
W. A
. R
ow
e -
U.S
. G
ov
t..
_-__
J. H
eu
lett
-d
o - --
Paul
McM
illan
.-- _
__ - _
__
..-.
.
-d
o..
..
do
Ray
W. '
'ols
inW
aite
r S
ieb
el
- --- -
Llo
yd W
hitn
ah. .-
L. A
. Wil
liam
s.
T.
S.V
ande
rfor
d . - --
Qeo
ree
Gee
sey .-
_- _
-- . _
_
Dep
th
(feet
)
251
266
232
136
301
160
144 63
210
200 67
152
136.
7 32
6 50
0±
277
350
255
400
215
240
200
242
243
288
336
392
295
?34
216
220
198
200
210
275
340
255 53
129
Dia
met
er
(inch
es)
16-1
8 16
-18 16
18
12
-16 16
18
6 8 16 5
6-8 6
14-1
6 24
18
18
21
12 6 16
16
20
12 6 6
12-1
8 18
20
18 6 6 16 6 6 6 16
12
14 6 16 6
Cha
ract
er o
f aqu
ifer
Bas
alt
d
o
Bas
alt
Bas
alt
Bas
alt
"RnoQ
lfr
.d
o -
d
o
Bas
alt
Cin
ders
d
o...
.....d
o .
Bas
alt
Bas
alt
-.
do ..d
o..
Alti
tude
4, 5
29. 3
4,
541
. 8
4, 5
20 1
4,
455
. 2
4,46
2t
4, 4
62. 3
4,
465t
4,
399.
2 4,
386.
1 4,
466
. 5
4, 4
15. 1
4,
468
. 4
4,46
8.4
4,41
5.2
4,64
4.0
4, 4
70 t
4, 5
78 t
4, 5
35. 6
4,
426
. 0
4, 3
86. 6
4,
394.
3 4,
390t
4,39
3t
4, 4
13. 4
4,
395.
4 4.
397.
2 4,
533.
6 4,
566t
4,58
3.2
4, 5
61. 0
4,
4"0
. 1
4, "4
)5 t
4,40
0t
4,39
0.8
4, 3
95. 8
4,
388t
4,
410
t
4,41
3.5
4, 4
02 t
4,39
5t
4,40
0t
4.39
2t
Dep
th to
wat
er
Dep
th
185.
0 19
9.8
181.
4 11
0.6
118.
3
46.4
58
.8
122.
2 46
.9
126.
0 12
3.9
171.
8
201.
4 85
.8
59.6
70
.9
70.7
34
.3
200.
9
243.
6 «6
.3
68.3
69
.3
67.0
77.6
35.8
Dat
e
10-1
8-61
10
-18-
61
7-25
-61
10-1
8-61
10-1
8-61
10-2
0-61
10
-18-
61
10-1
8-61
10
-18-
61
8-23
-61
10-1
8-61
10
-18-
61
10-1
7-61
10
-18-
61
10-1
7-61
10
-16-
61
10-1
8-61
10
-17-
61
10-1
8-61
10-1
7-61
^n
-17-
61
10-1
7-61
10
-17-
61
9-20
-61
10-1
6-61
7-23
-61
Dep
th
197.
6
108.
2
115.
5
44.3
41
.2
119.
4 53
.2
121.
1 12
1.9
169.
1 29
5.5
200.
7 85
.2
42.1
52
.7
76.~
2 55
.4
42.8
19
9.3
246.
8 24
1.7
59. n
52.9
55
.0
37.7
Dat
e
4-12
-62
4-12
-62
4-12
-62
4-12
-62
4-12
-62
4-12
-62
4-12
-62
5- 2
-61
4-12
-62
4-12
-62
5-11
-61
4-11
-62
4-11
-62
4-12
-62
4-11
-62
3-22
-61
4-11
-62
4-11
-62
4-11
-62
5-11
-61
4-12
-62
4-U
-«3
4-11
-62
4-11
-62
5-26
-52

llbdl.
....
...
12bal.
- ..
... .
13dcl.
.- -
.
14
adl_
_
IMcl.
-. ..
19
ccl
21C
C1 ...
...
22cbl
23cb
l... .......
..25dbl.
.
27cb
l ---
29
aal
-
29db
l-..
30
cb
l .
Sla
al.
. ..
....
.31
aa2
32
bd
2..-
- ...
-32
bd3.
--- ..
..32
dcl..
. . -.
33ab
l ..
.. ---
33bbl.
- -
32
E-6
bb
l..-
.....
6ccl.
.. - ..
7da2
__._
-
8bdl
_
18
dal
.
22ab
l.--
24dbl.
....
29
bb
l. -
----
-33E
-20bbl-
-. -
--
32ad
l._ ..
....
...
8S-2
9E-9
cal._
_. _
_ .
...
13ccl
15abl-
--. ..
..28
bal.
.. .. ..
....
30E
-2dbl
-
15dbl
...
. -1
8cc
l..~
---
21
cd
l
22aa
l.._.
. ---
----
24ab
l.-.
.
31E
-4cb
l ..
...
5bcl
..
. ..
6cd
l_ .
- ..
.7a
c2...
-..
...
.9
dal
-_._
.-.
..
Paul
Spa
uldi
ug .
___ _
_ ..
....
do
City
of A
m. F
all
s.
- d
o
E.
G. L
ish
.
Unit
edO
ilC
o--
..
J. P
. Meh
lhaf
f ..
.
Del
ia M
. C
urri
er. _
_ _
__ ..
..-
Hug
hes.
. _ .- . -
.- .
Bil
lSm
ith.-
. -
-do ~
~-
-do
H.
H. Z
imm
erli
.
Will
iam
Nac
htig
al ... .. ..
....
.
do
.d
o
- ..
.. ..
..
.d
o .. ..
..
E.
C. W
in
ter
300
375 79
.774 135 86 on 156
280
240
135
352
165
600
200
103
340
412
232
234
320
298
250
(to
234
215
132
445+
165
209
500
154
210
230 42 350
126
248
277
217
297
315
250
14 14 6 6 6 4 4 6 8 106-
14 13 20 8 20 20 14 6 20 10
12-1
4 6 16 14 6 6 6 68-
20 8 6 16 6 6 6 8 16 16 6 10 18 12 4
.d
o
d
o .
Bas
alt
....
.do
4,42
2.9
4,41
1.3
4,4
30t
4, 4
19. 0
4.41
5.2
4,3
90t
4,4
00t
4,41
3.7
4,42
3.8
4,51
5.4
4,5
60t
4,4
05t
4,3
90t
4,39
5.3
4,35
0.1
4,35
0.6
4,41
8.7
4,4
20t
4,5
25t
4, 5
35. 6
4, 5
24. 1
4,40
7.5
4,41
4.0
4,4
05t
4,40
6.4
4,46
7.9
4, 5
75 1
4, C
OO
t4,
514
. 04,
MO
t4,5
80t
4,45
4.4
4,4
30t
4,40
7.5
4,4
46t
4,38
8.4
4,26
6.0
4,39
7.3
4,23
9.4
4, 3
52. 1
4,51
3.6
4,56
8.4
4,46
6.7
4,4
47
t4,4
70t
4, 8
00
t
68.3
59.5
61.7
55.5
56.1
62.4
64.5
71.5
236.
9
85.0
81.4
73.1
75.0
93.3
207.
718
6.9
56.7
46.2
31.2
23.3
68.8
157.
916
8.0
118.
5
13.9
201.
3
138.
218
6.2
110
e32
.712
9.2
43.3
114.
514
7.4
243.
217
2.4
145.
0
230.
6
10-2
5-57
10-
1-57
10-2
3-57
9-20
-50
8-16
-50
10-2
2-5*
10-1
6-61
8-10
-59
8-10
-59
9-20
-61
10-1
8-61
10-1
8-61
12-1
4-61
9-
2-58
10-1
6-61
9-20
-50
10-
1-57
10-2
1-51
9-29
-58
8-10
-49
8-10
-59
8-8
-59
8-
8-59
9-19
-50
8-16
-52
10-1
7-61
10-
3-56
10-1
8-61
10-
-61
9-18
-50
10-1
6-61
10-1
2-51
8-
1-58
9-22
-60
10-1
6-61
10-2
7-51
11-4
-60
9-21
-50
61.7
50.5
61.5
55.1
51.4
S9. 9
59.6
122.
7
58.6
52.5
194.
769
.693
.6
135.
620
8.0
42.6
44.1
28.0
199.
5
185.
799
.3
129.
6
114.
1
243.
0
141.
020
6.6
4-23
-58
4-22
-58
4-23
-58
6-22
-50
5-10
-61
4-22
-59
4-11
-62
4-27
-51
fr47
-52
4-11
-62
4-11
-62
4-11
-62
3-31
-59
3-29
-57
4-10
-62
3-
1-57
2-27
-52
3-30
-59
4-11
-62
4-11
-62
5-10
-61
4-11
-62
4-2
-58
4-10
-62
5-
1-61
4-26
-51
a I
1 Pum
ping
.C
n C
n
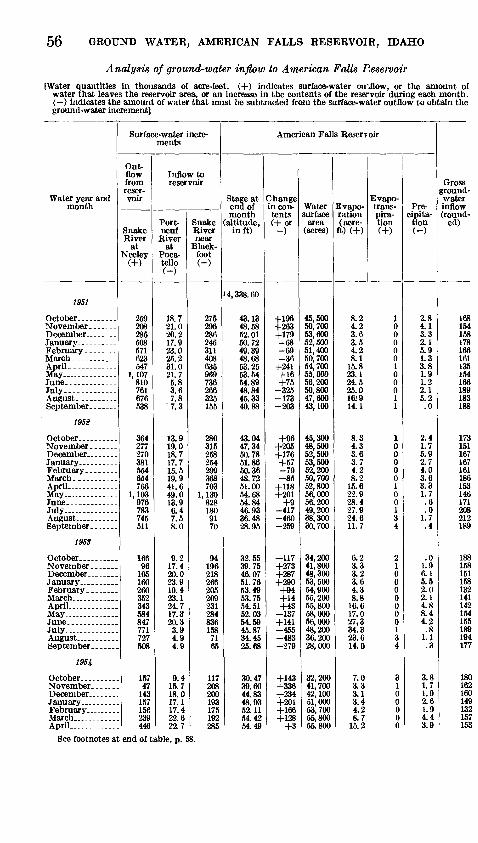
56 GROUND WATER, AMERICAN FALLS RESERVOIR, IDAHO
Analysis of ground-water inflow to American Falls Reservoir
[Water quantities in thousands of acre-feet. (+) indicates surface-water outflow, or the amount of water that leaves the reservoir area, or an increase in the contents of the reservoir during each month. ( ) indicates the amount of water that must be subtracted from the surface-water outflow to obtain the ground-water increment]
Water year and month
1951
April-.- -
July----------A Hfriict
1952
April .- May- ... .... -
July -
1953
April-
July .
1954
ADril ... _
Surface-water incre ments
Out flow from reser voir
Snake River
at Meeley
(+)
259 208 285 508 571 623 547
1,107 810 761 676 538
364277 270 381 554 654 766
1,103 976 783 745 511
166 96
105 160 260 352 343 584 847 771 727 508
157 47
143 157 156 239 446
Inflow to reservoir
Port- neuf
River at
Poca- tello (-)
18.7 21.0 20.2 17.9 23.0 25.2 31.0 21.7 5.8 3.6 7.8 "7.3
13.9 19.0 18.7 17.7 15.5 19.9 41.6 49.0 13.9 6.4 7.5 8.0
9.2 17.4 20.0 23.9 19.4 23.1 24.7 17.3 20.3 3.9 4.9 4.9
9.4 15.7 18.0 17.1 17.4 22.6 22.7
Snake River near
Black- foot (-)
275 296 286 246 311 408 635 969 736 266 325 155
280 315 258 254 299 368 703
1,130 828 180 91 70
94 196 218 266 205 209 231 284 836 158
71 65
117 208 200 193 175 192 285
American Falls Reservoir
Stage at end of month
altitude, in ft)
4,338.60
43.1348.58 52.01 50.72 49.39 48.68 53.25 53.54 54.89 48.84 45.33 40.88
43.04 47.34 50.78 51.86 50.36 48.72 51.00 54.68 54.84 46.93 36.48 28.95
32.55 39.75 46.07 51.76 53.49 53.75 54.51 52.03 5459 45.87 34.45 25.68
30.47 39.60 44.83 48.93 52.11 54.42 54.49
Change in con tents (+or
+196 +263 +179 -68 -69 -36
+241 +16 +75
-325 -173 -203
+96 +205 +176 +57 -79 -85
+118 +201
+9 -417 -460 -259
+117 +273 +287 +290 +94 +14 +43
-137 +141 -455 -483 -279
+143 +336+234 +201 +166 +128
-1-3
Water surface
area (acres)
45,500 50,700 53,600 52,500 51,400 50,700 54,700 55,000 56,200 50,800 47,600 43,100
45,300 48,500 52,500 53,500 52.200 50,700 52,800 56,000 56,200 49,200 38,300 30,700
34,200 41,800 48,300 53,500 54,900 55,200 55,800 58,000 56,000 48,200 36,200 28,000
32,200 41,700 42,100 51,000 53,700 55,800 55.800
Evapo ration (acre-
ft) (+)
8.2 4.2 3.6 3.5 4.2 8.1
15.8 23.1 24.5 25.0 16J9 14.1
8.3 4.3 3.6 3.7 4.2 8.2
15.6 22.9 28.4 27.9 24.6 11.7
6.2 3.3 3.2 3.6 4.3 8.8
16.6 17.0 27,3 34.3 23.6 14.0
7.0 3.3 3.1 3.4 4.2 8.7
15.2
Evapo- trans- pira- tion (+)
10 0 0 0 010 0 01 1
10 0 0 0 010 013 4
2 1 0 0 0 0 0 0 0 1 3 4
3 1 0 0 0 0 0
Pre cipita tion(-)
2.8 4.1 3.3 2.1 5.9 1.3 3.8 1.9 1.2 2.1 5.2 .0
2.4 1.7 5.9 2.7 4.0 3.6 3.3 1.7 .6 .0
1.7 .4
.0 1.9 6.1 5.5 2.0 2.1 4.8 8.4 4.2 .8
1.1 .3
3.8 1.7 1.9 2.6 1.9 4.4 3.9
Gross ground- water inflow (round
ed)
168 154 158 178 166 161 135 154 166 189 183 188
173 151 167 167 161 186 153 140 171 208 212 189
188 158 151 158 132 141 142 154 155 189 194 177
180 162 160 149 132 157 153
See footnotes at end of table, p. 58.

BASIC DATA 57
Analysis of ground-water inflow to American Falls Reservoir Continued
Water year and month
1954 Con.
May.. .
July.... . ...
1955
April.... .....May.... ..
July.-.... ... .
1956
December.. . .....
April.. ..........
July... ..
1S57
October...--...-.November--...-,
January
March..... __ ..April .__.-_.. ..May........
July.... ..,August _ . _ ....September. ......
1958
October.. ........November, ......
March _ .. .....
Surface-water incre ments
Out flow from reser voir
Snake River
at Neeley
(+)
813 584 743 726 503
165 192 166 150 74
188 409 636 683 735 696 501
136 64 54
205 256 415 737
1,061 1,257
752 685 476
199 156 144 221 138 329 478
1,168 722 783 731 507
119 60
118 182 142 218
Inflow to reservoir
Port- neuf
River at
Poca- tello (-)
7.3 3.82.8 2.8 3.6
6.0 10.2 14.3 13.8 12.8 16.5 18.4 10.3 5.6 2.4 3.7 4.1
6.1 13.8 16.5 19.0 15.0 23.4 31.7 17.8 4.3 1.7 3.0 3.7
6.3 13.7 15.5 14.0 22.8 24.0 20.2 40.2 17.9 3.1 3.9 5.3
8.8 15.6 17.9 17.2 23.6 26.6
Snake River near
Black- foot (-)
666 419 294
81 86
162 212 176 152 132 180 240 339 400 132
75 57
105 202 273 257 153 306 749
1,044 1,130
208 93 83
172 220 196 138 184 318 375 998 400 89 86 89
143 219 230 203 204 208
American Falls Reservoir
Stage at end of month
(altitude, in ft)
4,354.43 53.77 48.27 37.63 30.33
35.25 40.03 44.06 47.57 51.59 54.60 54.65 52.24 49.65 40.55 28.00 16.61
22.63 33.04 42.82 47.75 48.67 49.99 52.88 54.84 54.36 46.97 37.08 30.20
34.57 40.51 45.32 47.04 51.17 53.98 54.70 54.79 51.88 41.08 27.88 17.94
26.15 36.21 43.11 47.13 51.50 54.35
Change in con tents (+or
-3 -37
-290 -482 -260
+169 +189 +179 +170 +207 +165
+2 -133 -136 -432 -452 -291
+143 +310 +390 +236 +46 +67
+154 +109 -27
-388 -439 -242
+148 +234 +219 +83
+211 +153 +40 +5
-160 -526 -479 -258
+208 +331 +289 +191+224 4-156
Water surface
area .(acres)
55,800 55,200 50,300 39,500 32,000
37,000 42, 200 46,400 49,700 53,300 55,900 55,900 53,900 51,600 42,700 29,900 21,700
25,700 34,700 45,100 49,900 50,700 51,900 54,500 56,200 55,800 48,200 39,000 32,000
36,200 42,600 47,500 49,200 52,700 55,400 56,000 56,200 54,000 43,200 29,800 22,600
28,200 38,000 45,300 49,300 53,200 55.700
Evapo ration (acre-
ft) (+)
28.4 27.2 37.2 27.1 18.0
7.6 3.6ai3.4 4.1 8.8
16.8 26.4 28.4 27.5 20.2 9.2
4.5 2.7 2.8 3.3 4.0 8.2
15.9 24.3 34.2 32.0 23.1 16.1
6.5 3.6 3.1 3.4 4.1 8.7
16.7 15.7 27.4 28.2 20.6 9.5
4.6 3.0 2.9 3.3 4.1 8.9
Evapo- trans- pira- tion (+)
0 0 0 3 3
2 1 0 0 0 0 0 0 0 2 5 6
3 1
0 0 0 0 0 0 1 3 3
2 1 0 0 0 0 0 0 0 2 5 5
3 1 0 0 0 0
Pre cipita tion (-)
2.7 6.9 .4
1.2 .7
2.6 1.4 1.5 1.7 1.8 2.7 6.3 3.5 5.8 1.4 .9 .4
.4
.7 4.9 9.1 1.0 .8
1.7 5.3 .3 .4 .1 .7
6.5 .9
1.8 2.2 2.9 4.4 6.5
14.9 1.4 1.2 1.6 .0
1.1 1.6 2.2 3.9 3.4 3.0
Gross ground- water inflow (round
ed)
162 144 193 189 174
173 162 156 156 138 163 163 177 164 197 190 164
175 161 152 159 137 160 124 127 130 187 176 166
171 160 153 153 143 144 133 136 170 194 186 169
182 169 160 152 139 145
See footnotes at end of table, p. 58.
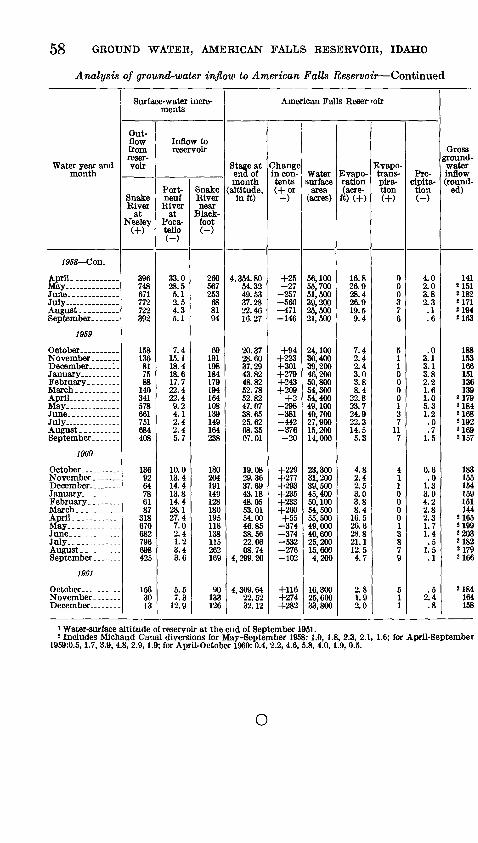
58 GROUND WATER, AMERICAN FALLS RESERVOIR, IDAHO
Analysis of ground-water inflow to American Falls Reservoir Continued
Water year and month
1958 Con.
April-
July
1969
April .-
July
1960
April..
July-..
1961
Surface-water incre ments
Out flow from reser voir
Snake River
at Neeley
(+)
396748 671 772 722 392
158 136 81 75 88
140 341 578 661 751 684 408
136 92 64 78 61 87
318 670 682 796 698 425
156 30 13
Inflow to reservoir
Port- neuf
River at
Poca- tello (-)
33.0 28.5 5.1 2.5 4.3 5.1
7.4 15.1 18.4 18.6 17.7 22.4 22.4 9.2 4.1 2.4 2.4 5.7
10.0 13.4 14.4 13.8 14.4 28.1 27.4 7.0 2.4 1.2 3.4 3.6
5.5 7.3
12.9
Snake River near
Black- foot (-)
260 567 253
68 81 94
69 191 198 184 179 194 164 108 139 149 164 238
180 204 191 149 128 180 195 118 138 115 262 169
90 133 126
American Falls Reservoir
Stage at end of month
(altitude, in ft)
4,354.80 54.32 49.53 37.28 22.46 16.27
20.37 28.60 37.29 43.82 48.82 52.78 52.82 47.07 38.65 25.62 08.35 07.01
19.08 29.36 37.69 43.18 48.05 53.01 54.00 46.85 38.56 22.06 08.74
4, 299. 20
4, 309. 64 22.52 32.12
Change in con tents (-for
+25 -27
-257 -560 -471 -146
+94 +223 +301 +279 +243 +209
+2 -298 -381 -442 -376 -20
+229 +277 +293 +235 +233 +260 +55
-374 -374 -532 -276 -102
+116+274 +282
Water surface
area (acres)
56,100 55,700 51,500 39,200 25,500 21,500
24,100 30,400 39,200 46,200 50,800 54,300 54,400 49,100 40,700 27,900 15,200 14,000
23,300 31,200 39,500 45,400 50,100 54,^00 55,500 49,000 40,600 25,200 15,600 4,200
16,300 25,600 33,800
Evapo ration (acre-
ft) (+)
16.8 26.9 28.4 26.9 19.5 9.4
7.4 2.4 2.4 3.0 3.8 8.4
22.8 23.7 24.9 22.3 14.5 5.3
4.8 2.4 2.5 3.0 3.8 8.4
16.5 26.6 28.8 21.1 12.5 4.7
2.8 1.9 2.0
Evapo- trans- pira- tion (+)
0 0 0 3 7 6
5 1 10 0 0 0137
117
4 11 0 0 0 0138 7 9
5 1 1
Pre cipita tion (-)
4.0 2.0 3.8 2.3 .1 .6
.0 3.1 3.1 3.8 2.2 1.6 1.0 5.3 1.2 .0 .7
1.5
0.6 .0
1.3 3.0 4.2 2.8 2.3 1.7 1.4 .5
1.5 .1
.5 2.4 .8
Gross ground- water inflow (round
ed)
141 2151 U82 U71 U94 2163
188 153 166 151 136 139
»179 2184 2 168 « 192 2169 2 157
183 155 154 159 151 144
2165 2199 «203 «182 «179 2 166
8184 164 158
1 Water-surface altitude of reservoir at the end of September 1951.2 Includes Michaud Canal diversions for May-September 1958:1.0, 1.8, 2.3, 2.1, 1.6; for April-September
1959:0.5,1.7, 3.9, 4.8, 2.9,1.9; for April-October 1960: 0.4, 2.2, 4.6, 5.8, 4.0,1.9, 0.5.
o


![ROAD DATA - [ ], [ ], [ ], [ ] & VICINITY](https://img.pdfslide.net/doc/110x75/61a4edb5a83d6b4d7a703c9f/road-data-amp-vicinity.jpg)
