Embed Size (px)
Citation preview

OPEN-FILE REPORT
GROUND WATER MANAGEMENT AREAS IN IDAHO:OVERVIEW AS OF 1998
ByHelen HarringtonShane Bendixsen
Idaho Department of Water ResourcesBoise, Idaho
December 1999

i
Table of Contents
INTRODUCTION.........................................................................................................................................................................1
INTRODUCTION...................................................................................................................................................................... 1STATUTORY AUTHORITY.................................................................................................................................................. 1
Table 1: List of Critical and Ground Water Management Areas............................................................................3
BANBURY HOT SPRINGS GROUND WATER MANAGEMENT AREA.................................................................5
OVERVIEW OF CURRENT MANAGEMENT STATUS................................................................................................ 5HYDROGEOLOGY................................................................................................................................................................... 5CURRENT GROUND WATER CONDITIONS.................................................................................................................. 5
REFERENCES.......................................................................................................................................................................6
BANCROFT-LUND GROUND WATER MANAGEMENT AREA...............................................................................9
OVERVIEW OF CURRENT MANAGEMENT STATUS................................................................................................ 9HYDROGEOLOGY................................................................................................................................................................... 9CURRENT GROUND WATER CONDITIONS................................................................................................................ 10
REFERENCES.....................................................................................................................................................................10
BIG WOOD RIVER GROUND WATER MANAGEMENT AREA.............................................................................13
OVERVIEW OF CURRENT MANAGEMENT STATUS.............................................................................................. 13HYDROGEOLOGY................................................................................................................................................................. 13CURRENT GROUND WATER CONDITIONS................................................................................................................ 14
REFERENCES.....................................................................................................................................................................14
BLUE GULCH CRITICAL GROUND WATER AREA..................................................................................................17
OVERVIEW OF CURRENT MANAGEMENT STATUS.............................................................................................. 17HYDROGEOLOGY................................................................................................................................................................. 17CURRENT GROUND WATER CONDITIONS................................................................................................................ 17
REFERENCES.....................................................................................................................................................................18
BOISE FRONT LOW TEMPERATURE GEOTHERMAL RESOURCE GROUND WATERMANAGEMENT AREA............................................................................................................................................................21
OVERVIEW OF CURRENT MANAGEMENT STATUS.............................................................................................. 21HYDROGEOLOGY................................................................................................................................................................. 21CURRENT GROUND WATER CONDITIONS................................................................................................................ 21
REFERENCES.....................................................................................................................................................................22
CURLEW VALLEY CRITICAL GROUND WATER AREA........................................................................................25
OVERVIEW OF CURRENT MANAGEMENT STATUS.............................................................................................. 25HYDROGEOLOGY................................................................................................................................................................. 25CURRENT GROUND WATER CONDITIONS................................................................................................................ 25
REFERENCES.....................................................................................................................................................................26
GRANDVIEW-BRUNEAU GROUND WATER MANAGEMENT AREA................................................................29
OVERVIEW OF CURRENT MANAGEMENT STATUS.............................................................................................. 29HYDROGEOLOGY................................................................................................................................................................. 29CURRENT GROUND WATER CONDITIONS................................................................................................................ 29
REFERENCES.....................................................................................................................................................................30

ii
LINDSAY CREEK GROUND WATER MANAGEMENT AREA...............................................................................34
OVERVIEW OF CURRENT MANAGEMENT STATUS.............................................................................................. 34HYDROGEOLOGY................................................................................................................................................................. 34CURRENT GROUND WATER STATUS.......................................................................................................................... 35
REFERENCES.....................................................................................................................................................................35
MOUNTAIN HOME GROUND WATER MANAGEMENT AREA AND CINDER CONE BUTTECRITICAL GROUND WATER AREA ................................................................................................................................38
OVERVIEW OF CURRENT MANAGEMENT STATUS.............................................................................................. 38HYDROGEOLOGY................................................................................................................................................................. 38CURRENT CONDITIONS..................................................................................................................................................... 39
REFERENCES.....................................................................................................................................................................39
OAKLEY FAN CRITICAL GROUND WATER AREAS ...............................................................................................44
OVERVIEW OF CURRENT MANAGEMENT STATUS.............................................................................................. 44HYDROGEOLOGY................................................................................................................................................................. 44CURRENT GROUND WATER CONDITIONS................................................................................................................ 45
REFERENCES.....................................................................................................................................................................45
RAFT RIVER CRITICAL GROUND WATER AREA....................................................................................................51
OVERVIEW OF CURRENT MANAGEMENT STATUS.............................................................................................. 51HYDROGEOLOGY................................................................................................................................................................. 51CURRENT GROUND WATER CONDITIONS................................................................................................................ 51
REFERENCES.....................................................................................................................................................................51
SOUTHEAST BOISE GROUND WATER MANAGEMENT AREA..........................................................................55
OVERVIEW OF CURRENT MANAGEMENT STATUS.............................................................................................. 55HYDROGEOLOGY................................................................................................................................................................. 55CURRENT GROUND WATER CONDITIONS................................................................................................................ 56
REFERENCES.....................................................................................................................................................................56
TWIN FALLS GROUND WATER MANAGEMENT AREA ........................................................................................59
OVERVIEW OF CURRENT MANAGEMENT STATUS.............................................................................................. 59HYDROGEOLOGY................................................................................................................................................................. 59CURRENT GROUND WATER CONDITIONS................................................................................................................ 59
REFERENCES.....................................................................................................................................................................60

iii
Table of Figures
Figure 1: Well Numbering System.................................................................................................. 2Figure 2: State Map Showing CGWAs and GWMAS.................................................................... 4Figure 3: Banbury Hot Springs Location Map............................................................................... 7Figure 4: Banbury Hot Springs GWMA Hydrographs ................................................................... 8Figure 5: Bancroft Lund GWMA Location Map .......................................................................... 11Figure 6: Bancroft Lund GWMA Hydrographs ........................................................................... 12Figure 7: Big Wood River GWMA Location Map ....................................................................... 15Figure 8: Big Wood River GWMA Hydrographs ......................................................................... 16Figure 9: Blue Gulch CGWA Location Map ................................................................................ 19Figure 10: Blue Gulch CGWA Hydrographs ................................................................................ 20Figure 11: Boise Front Geothermal GWMA Location Map......................................................... 23Figure 12: Boise Front Geothermal GWMA Hydrographs........................................................... 24Figure 13: Curlew Valley CGWA Location Map ......................................................................... 27Figure 14: Curlew Valley CGWA Hydrographs........................................................................... 28Figure 15: Grandview-Bruneau GWMA Location Map............................................................... 31Figure 16: Grandview-Bruneau GWMA Hydrographs (East) ...................................................... 32Figure 17: Grandview-Bruneau GWMA Hydrographs (West)..................................................... 33Figure 18: Lindsay Creek GWMA Location Map ........................................................................ 36Figure 19: Lindsay Creek GWMA Hydrographs .......................................................................... 37Figure 20: Mountain Home GWMA & Cinder Cone Butte CGMA Location Map ..................... 41Figure 21: Mountain Home GWMA & Cinder Cone Butte CGMA Hydrographs (North) .......... 42Figure 22: Mountain Home GWMA & Cinder Cone Butte CGMA Hydrographs (South) .......... 43Figure 23: Oakley Fan CGWAs Location Map ............................................................................ 46Figure 24: Artesian City CGWA Hydrographs............................................................................. 47Figure 25: Cottonwood CGWA Hydrographs .............................................................................. 48Figure 26: West Oakley CGWA Hydrographs ............................................................................. 49Figure 27: Oakley Kenyon CGWA Hydrographs......................................................................... 50Figure 28: Raft River CGWA Location Map................................................................................ 53Figure 29: Raft River CGWA Hydrographs ................................................................................. 54Figure 30: Southeast Boise GWMA Location Map...................................................................... 57Figure 31: Southeast Boise GWMA Hydrographs........................................................................ 58Figure 32: Twin Falls GWMA Location Map .............................................................................. 61Figure 33: Twin Falls GWMA Hydrographs ................................................................................ 62

1
INTRODUCTION
Introduction
The purpose of this report is to provide a summary of the current areas designated asGround Water Management Areas (GWMA) and Critical Ground Water Management areas(CGWA). At present, there are 17 areas: eight CGWA and nine GWMA (Table 1 and Figure 2).This report is intended to provide a compilation of the current status of administrative actionsand ground water level trends. Additionally, each section summarizes the general hydrogeology,current ground water level monitoring frequency, and a list of the primary reports and documentsrelated to the area whether or not they are cited in the text.
This report is the first phase of a project to review, update and analyze data and developrecommendations for administration options for each management area. As you will note in thesummaries, each area has unique characteristics, history, and impacts. Because of thisuniqueness, data collection and management of each area must consider the localized aspects anddevelop individualized plans tailored to address the problems and issues of the area. Thesesummaries will provide a foundation from which to build these plans.
The next phase will evaluate the technical aspects and activities within each area todetermine the needs for additional data and follow up with updating or acquiring data. Waterrights, land use changes, and other impacts will be analyzed. Water budgets and conceptualmodels will be developed for the most critical areas. The final phase of the project will developrecommendations for administrative and technical actions to alleviate ground water declines.
Statutory Authority
The authority for designating areas for regulating ground water withdrawals fromaquifers subject to insufficient supplies was first granted in 1953 through amendments to Idaho’sGround Water Act. However, it was not until 1962 that the first CGWAs were designated in theOakley Fan area. Amendments to the Act in 1982 granted authority for designating groundwater management areas. The Grandview-Bruneau area, designated in 1982, was the firstGWMA.
The Director of Idaho Department of Water Resources (IDWR) is granted the authority todesignate “critical ground water areas” and “ground water management areas” under Idaho CodeTitle 42, Chapter 233a and 233b, respectively. These sections codify the definitions and basesfor designating these special management areas.
A CGMA is all or part of a ground water basin that does not have sufficient ground waterto provide a reasonably safe supply for irrigation or other uses at the current or projected rates ofwithdrawal. The Director of IDWR can deny an application for a proposed use if the point ofdiversion lies within the designated area and may require water users to report diversions orother information.
A GWMA is all or part of a ground water basin that may be approaching the conditionsof a CGMA. Applications for new water appropriations may be approved only after it is

2
determined that sufficient supply is available and other prior water rights will not be injured.The director may require reporting of water use by water users within the area.
The Order designating the Southeast Boise GWMA in 1994 was the first time an advisorycommittee was required as a part of the initial formation of a GWMA. Since that time, ordersrequiring the formation of advisory committees have been issued subsequent to the initialformation of the management areas. These committees are to assist in the management ofground water resources through development of management plans, establishing processes fordispute resolution and acting as a forum for discussion and communication.
Figure 1: Well Numbering System
IDWR uses this well numbering system to indicate the location of wells within the Public LandSurvey, as shown in the example above. The first two segments designate the township andrange, the third section indicates the section. Quarter sections are designated by letters A,B,C,and D in counterclockwise order from the northeast quarter. Forty-acre and 10-acre tracts withineach quarter section are lettered in the same manner. Well 5S-31E-27ABA1, for example, is inthe NE1/4NW1/4NE1/4, section 27, Township 5 South, Range 31 East.

3
Management Area Date Designated
CRITICAL GROUND WATER AREAS (CGWA)
Blue Gulch 12/9/1970
Cinder Cone Butte 5/7/1981
Curlew Valley 3/15/1976
Oakley Fan
Artesian City 1/16/1962
Cottonwood 1/16/1962
Oakley-Kenyon 1/16/1962
West Oakley Fan 1/19/1982
Raft River 7/23/1963
GROUND WATER MANAGEMENT AREAS (GWMA)
Banbury Hot Springs 4/12/1983
Bancroft Lund 10/21/1991
Big Wood River 6/28/1991
Boise Front 6/15/1987
Grandview-Bruneau 10/29/1982
Lindsay Creek 3/5/1992
Mountain Home 11/9/1982
Southeast Boise 10/14/1994
Twin Falls 7/24/1987
Table 1: List of Critical and Ground Water Management Areas

�
�
�
�
�
�
�
��
��
��
��
��
��
��
��
��
��
��
��
�
��
��
��
����
��
�
�
��
��
�
��
��
��
�
��
��
��
�
��
��
��
��
��
��
��
�
�
��
��
��
��
��
�
��
�
��
��
��
�
������������
������������ ������������
��� �����������������������
������������� ���������������� �������
�� � �� �� �����
������������ �
������
�����
������
��� ������
�����������
������������
�� ������� �
����������
��������
��� �����
�
�� ��������� �� ��
��� ������ ��
������� �
!�� ��� ������"
�������������
������� �� ��������#
��������������������� �!""�� �����
�
�� �����
�
$�#��% ��
�
�������
�
����� ����
�
&����� ������
$�#�����
�
������ #"$%�%$&""

5
BANBURY HOT SPRINGS GROUND WATER MANAGEMENTAREA
Overview of Current Management Status
The Banbury Hot Springs Ground Water Management Area (GWMA) is locatedin Twin Falls County in southern Idaho (Figure 3). The GWMA was established on April12, 1983. The resource was declared a GWMA because of declining artesian pressuresand concern that over-utilization was being approached.
On December 4, 1985, an order was issued staying the approval of pending waterright applications and suspending further development under existing permits. Thisaction essentially established a moratorium on further development. New waterappropriations are allowed for domestic uses only.
In April, 1998, a public meeting was held to discuss the status of the GWMA,ground water conditions, and the possible creation of an advisory committee. InNovember 1998, an advisory committee was formally established with the appointmentof 11 people. The objectives of the Advisory Committee are (1) to serve as a forum forcollecting and reviewing data; (2) serve as a forum for mediating water related issueswithin the GWMA; and, (3) develop a ground water management plan for the GWMA.
Hydrogeology
The geothermal aquifer occurs in the Idavada Volcanics and Banbury Basalt. It isa confined system with shut-in pressures ranging from 14 to 250 pounds per square inchor equivalent to 32 to 575 feet above land surface (Street and DeTar, 1987). Therecharge area is probably the Cassia Mountains southeast of the area (Street and DeTar,1987).
A conceptual model developed by Street and DeTar (1987) concluded that theBanbury geothermal system and the Twin Falls geothermal system to the east werehydrologically connected. This opinion was based on well test and monitoring data,water chemistry, and lack of barriers to thermal ground water flow. However, thisconceptual model has not been confirmed through data collection or additional modeling.Further analysis of hydrographs is needed to confirm similarity of trends and degree ofconnection. Barriers to ground water flow occur as northwest-trending faults in thesouthwest part of the area (Lewis and Young, 1980).
Current Ground Water Conditions
Hydrographs of ground water levels in wells in the Banbury GWMA are shown inFigure 4. Although similar long-term trends are not apparent among all wells, somegeneral observations can be made. From the late 1970s to mid-1980s, declines in waterlevels were significant (greater than or equal to 10 feet per year). From mid-1980 to mid-1990, most wells indicated stable water level trends, except for well 09S14E-14BDB1,showed a significant decline during this period (approximately 10 feet per year). From

6
mid-1990s to current, wells in the northwest portion depict declining trends while wellsin the southeast portions appear to be relatively stable.
Six wells are monitored within the GWMA. IDWR monitors three wells on aquarterly basis. USGS monitors two wells bi-monthly and one well on a monthly basis.The oldest monitoring data is from about 1980. An additional well outside of theGWMA, known as the Filer Test well (09S16E-20ADD1), is also monitored as anindicator of the geothermal trends in the Banbury and Twin Falls areas.
REFERENCES
Lewis, R. E., and H. W. Young, 1980, Geothermal Resources in the Banbury Hot SpringsArea, Twin Falls County, Idaho, USGS Water-Resources Investigations Open FileReport 80-563, 35 pages.
Street, Leah V., and Robert E. DeTar, 1987, Geothermal Resource Analysis in Twin FallsCounty, Idaho, IDWR Water Information Bulletin No. 30, Part 15, 46 pages.

��
�� ��
�� �� ��
��
��
� ��
��
��
��
��
�� ��
��
� ��
��
� � � �����
� ������������������������ ����� � ��!������
"
����
������������
����������
��� ���
�
���
����
������
�����
�
����������
�����
�����
������
���
���
������
��
�
������
�
��
�# ����$���%��
� �����& ���'���(�'���)��

BANBURY HOT SPRINGS GROUND WATER MANAGEMENT AREAGround Water Hydrographs
TD: TOTAL DEPTHOP: INTERVAL AT WHICH THE WELL IS PERFORATED OR OPEN TO THE AQUIFERWATER BEARING FORMATIONNA: NOT AVAILABLE- - -: MORE THAN 1 YEAR BETWEEN DATA POINTS LEFT SIDE: DEPTH TO WATERRIGHT SIDE: WATER ELEVATIONBASE: YEARALL MEASUREMENTS IN FEET
Prepared by Idaho Department of Water Resources 6/99 HH
RING WELL
COLLINS BROS. WELL
KASTER WELL
ARCHIBALD WELL
LUNTEY WELL
LANGDON WELL
Note Expanded Scale
TD: 760OP: 301-760BANBURY BASALTMonitoring: IDWR, quarterly
Monitoring: IDWR, quarterly
Monitoring: USGS bi-monthly
Monitoring: USGS bi-monthly
Monitoring: IDWR, quarterly
Monitoring Discontinued 1994
TD: 800OP: 470-800IDAVADA VOLCANICS
TD: 700OP: 215-700BANBURY BASALT
TD: 850OP: 380-850IDAVADA VOLCANICS
TD: 906OP: 346-906BANBURY BASALT
RING WELL
Monitoring: USGS bi-monthly
Pump Lifts
TD: 480OP: 204-480NA
TD: 900OP: 31-65, 425-900NA
Box Canyon
Blind Canyon
BanburySprings Clear
Lakes30
Snake
Buhl
T8S
T9S
R14E
Legend
0 1 2 3Miles
FIGURE 4

9
BANCROFT-LUND GROUND WATER MANAGEMENT AREA
Overview of Current Management Status
The Bancroft-Lund Ground Water Management Area is located in southeasternIdaho in Caribou County (see Figure 5). The area was declared a GWMA on October 21,1991. The basis for the declaration was the interrelationship between ground water andspring flow into the Bear River at Black Canyon (Bendixsen, 1994) and concern thatproposed ground water development would deplete spring flows. There were also publicconcerns of well interference problems.
Several applications for permit to appropriate additional ground water werepending at the time the area was declared a GWMA. There were not enough dataavailable to determine if ground water supply was adequate to fill the proposed uses. Theorder stated that proposals for new consumptive uses required the applicant todemonstrate that there would be no injury or depletions would be mitigated.
On October 17, 1995, an order was issued by IDWR creating Water District 13Tin the Bancroft-Lund GWMA. The water district includes all water uses for irrigationfrom ground water within the boundaries of the Bancroft-Lund GWMA. Creation of thedistrict allows for regulation of ground water rights. A management plan has not beenadopted; however, an advisory committee has been established through Water District13T.
Hydrogeology
Geology in the Gem Valley consists of lake sediments, stream deposits, andbasalts from cones and fissures. Basalt flows in the basin caused damming of historicLake Thatcher and changes in surface drainages during the last 30,000 years. Sand andgravel deposits occur along basin margins and mouths of streams (Bright, 1963 andNorton, 1981).
Ground water flow in the Bancroft-Lund area are unconfined except wheresaturated porous basalts are encountered beneath clay layers of lake bed deposits (Norton,1981). A ground water divide occurs near the center of the area. Ground water north ofthe divide flows toward the Portneuf River to the northwest; ground water south of thedivide flows south into the Bear River drainage. Springs in Black Canyon on the BearRiver discharge as much as 22 cubic feet per second (cfs). The most productive wells inthe area are completed in basalts while wells completed in the lake bed sediments arepoorer producers (Norton, 1981).
Recharge occurs from precipitation on the valley floor and surface runoff from thesurrounding mountains. Ground water flow through Ten Mile Pass and through the gapat Soda Point also provides recharge. Further recharge occurs from irrigation canals andinfiltration from excess irrigation (Norton, 1981). There is limited natural surface flowacross the valley floor.

10
Current Ground Water Conditions
Hydrographs (Figure 6) for the area indicate a generally stable ground water tablewith fluctuations attributed mainly to climatic wet and dry cycles. Above normalprecipitation in the mid 1980s and mid 1990s and the declines in wells during the late1970s and early 1980s and drought of 1987 to 1992 are depicted with corresponding risesand declines on hydrographs. No overall downward trends are apparent.
Current ground water level monitoring is conducted by the USGS at five wells ona quarterly basis. Data dates back to the 1960’s with the exception of one well which hasdata dating back to 1928. Beginning in 1996, two wells have been measured by theIDWR Water Distribution Section on a yearly basis.
REFERENCES
Baker, S. J., 1990, Memo to Dave Shaw, Adjudication Bureau Chief, IDWR, Long TermGround Water Trends in Gem Valley, 3 pages.
Baker, S. J., 1989, Memo to Dave Shaw, Adjudication Bureau Chief, IDWR, Analyses ofFactors Effecting spring flow along the north side of Black Canyon, 6 pages.
Bendixsen, Shane, 1994, Summary of Ground Water Conditions in the Bancroft-LundGround Water Management Area, 13 pages.
Bright, Robert C., 1963, Pleistocene Lakes Thatcher and Bonneville, Southeastern Idaho,A Thesis submitted to the faculty of the Graduate School of the University ofMinnesota, 292 pages.
Dion, N. P., 1981, Investigation of the Ground Water Flow System in Gem Valley,IDWR, Open File Report, 66 pages.
Norton, M. A., 1981, Investigation of the Ground Water Flow System in Gem Valley,IDWR, Open File Report, 29 pages.
Norvitch, R. F., and Larson, A. L., 1970, A reconnaissance of the Water Resources in thePortneuf River Basin, Idaho Water Information Bulletin No. 16, 58 pages.
Young, H. W., 1984, Water-Table Contours, Directions of Ground-Water Movement andGround-Water Divide, October 1983, in Gem Valley, Southeastern Idaho, USGSWater Resources Investigations, Report 84-4036.

Bancroft Lund Critical Ground Water Area
Scale 1 :314,643
1 O 1 2 3 4 5 Miles ~
T6S TIS T6
• Bancr ft
TlOS TllS TllS

BANCROFT
GRACE
ALEXANDERRESERVOIR
TD: 525OP: 140-150, 200-235, 415-521QUATERNARY BASALT
TD:303OP: NAQUATERNARY BASALT
TD: 370OP: 20-370QUATERNARY BASALT
TD: 208OP: 90-184QUATERNARY BASALT
TD: 300OP: 70-83, 270-280QUATERNARY BASALT
TD: 90OP: NAQUATERNARY BASALT
SCALE
LEGEND
BANCROFT-LUND GROUND WATER MANAGEMENT AREA
PREPARED BY THE IDAHO DEPARTMENT OF WATER RESOURCES 11/98 HH
NOTE EXPANDED TIME PERIOD
39E
40E
41E
08S
09S
10S
Monitoring: USGS, quarterlyMonitoring: USGS, quarterly
Monitoring: USGS, quarterly
Monitoring: USGS, quarterly
Monitoring: USGS, quarterlyMonitoring: USGS, quarterly
Ground Water Hydrographs
TD: TOTAL DEPTHOP: INTERVAL AT WHICH THE WELL IS PERFORATED OR OPEN TO THE AQUIFERWATER BEARING FORMATIONNA: NOT AVAILABLE----: MORE THAN 1 YEAR BETWEEN DATA POINTS LEFT SIDE: DEPTH TO WATERRIGHT SIDE: WATER ELEVATIONBASE: YEARALL MEASUREMENTS IN FEET
FIGURE 6

13
BIG WOOD RIVER GROUND WATER MANAGEMENT AREA
Overview of Current Management Status
The Big Wood River GWMA is located in southcentral Idaho in Blaine, Camas,Elmore, and Gooding counties (Figure 7). The Big Wood River GWMA was designatedby Order of the Director on June 28, 1991. The area was designated to address theconnection between ground and surface water within the Camas Creek, Silver Creek, andUpper Big Wood River drainages above Magic Reservoir. IDWR determined that juniorground water diversions were depleting senior surface water flows in the Big Wood Riverand Silver Creek.
The Silver Creek and Big Wood River drainages had previously been designatedas a CGWA on June 21, 1961; however, the designation was rescinded on January 26,1966, at the request of local water users.
The management policy associated with the current designation allows for theconsideration of new ground water diversions; however, applicants are required todemonstrate there will be no injury or can provide acceptable mitigation to prior rights.An advisory committee has not been established.
Currently, a ground water model is being developed by the University of Idaho,Agricultural Research Service, and The Nature Conservancy. The model will encompassthe basin from Hailey to Stanton Crossing, east to the area around Picabo. The finalreport is expected by September, 1999.
Hydrogeology
The aquifers of the Upper Big Wood River, Silver Creek, and Camas Creek areaconsist of valley and lake sediments underlain by basalts and bedrock. Sediments weredeposited within the valley when the Big Wood River and Camas Creek were blocked bylava flows which occurred intermittently near Picabo in the southeast corner of the basinand near Stanton Crossing in the center portion of the basin. Lake deposits consist ofdiscontinuous layers of fine-grained sediments intermixed with coarse sands and gravels.The fine-grained layers become more continuous in the southern part of the basin(Moreland, 1977).
Water occurs unconfined in the northern portion of the basin where only oneaquifer is identifiable. In the southern part of the basin, there are extensive silt and claylayers forming confining layers and producing artesian conditions. Springs and seepswhich discharge to Silver Creek and other tributaries occur where shallow ground wateroverrides discontinuous fine-grained layers (Moreland, 1977). The direction of groundwater flow is from north to south.
Ground water in the Camas Creek basin mainly occurs under confined conditions.However, water table conditions occur in some of the shallow alluvial deposits. Manywells flow at the land surface, but the flow is usually less than 1 gallon per minute.

14
Ground water flow direction is generally eastward with discharge occurring into CamasCreek and Magic Reservoir (Walton, 1962).
Current Ground Water Conditions
Figure 8 shows ground water hydrographs. Seasonal fluctuations can vary from afew feet to as much as 40 feet per year. Long-term fluctuations appear to mirror wet anddry climatic cycles, as evidenced by rise in water levels in mid 1980s and mid 1990s.Declines during the 1987-1992 drought are apparent in the hydrographs. No overalldownward trend is apparent.
Ten wells are currently monitored by the USGS: two on a bi-monthly basis; fouron a quarterly basis; and four on a semi-annual basis. The data in the Bellevue-Haileyarea date back to the 1950’s. Data in the Camas Creek-Fairfield area date back to the1970’s, with the exception of one well where the data date back to 1944.
REFERENCES
Castelin, Paul M., and Sherl Chapman, 1972, Water Resources of the Big Wood River-Silver Creek Area, Blaine County, Idaho, IDWR Water Information Bulletin No.28, 44 pages.
Moreland, Joe A., 1977, Ground Water-Surface Water Relations in the Silver CreekArea, Blaine County, Idaho, IDWR Water Information Bulletin No. 45, 42 pages.
Walton, W. C., 1962, Ground-water resources of Camas Prairie, Camas and ElmoreCounties, Idaho, USGS Water-Supply Paper 1609, 57 pages.

��������������� ��������������������
�
� � � �� ����
���
���
������
����
���
���
��������� ��!�"�#�!��$%%
�����
�����
�����
�����
� �
���
������&��'��(����&��
)���
��&��
&���
��&��
�������
�&��
�
�
�
�
*�(+ �
,���-
���
.���/���
"(����0�112�1�
�����
��
����
�
����
�� ����
�����
�����������
�������
���
���
����
�����
���
�����
������
�� ��������
������ ����
���������
��������� ��
��� !��� ��
���" ���� #����
��������������
�����
����$���������
������
����
�����
������
�
�� ���

TD: 13OP: 10.5-13QUATERNARY SEDIMENTS
TD: 188OP: NAQUATERNARY SEDIMENTS
TD: 85OP: 78-84QUATERNARY SAND AND GRAVEL
TD: 51OP: 25-35QUATERNARY SAND AND GRAVEL
TD: 209OP: 185-194, 197-206SNAKE RIVER GROUP
TD: 120 ARTESIANOP: NQQUATERNARY GRAVEL
TD: 154OP: 28-154BRUNEAU FORMATION
TD: 12OP: 9-12QUATERNARY SEDIMENTS
TD: 212 ARTESIANOP: 20-212BRUNEAU FORMATION
TD: 435 ARTESIANOP: 135-435QUATERNARY SAND
Ketchum
Hailey
Bellevue
PicaboFairfield
Camas
Silver
Creek
LEGEND
Prepared by the Idaho Department of Water Resources, 11/98 HH
R15E R17E
R19E
R11E
R13E
T1S
T2N
T4N
Ground Water Hydrographs
Magic Reservoir
MormonReservoir
BIG WOOD RIVER GROUND WATER MANAGEMENT AREA
Monitoring: USGS semi-annual
Monitoring: USGS bi-monthly
Monitoring: USGS bi-monthly
Monitoring: USGS semi-annual
Monitoring: USGS semi-annual
Monitoring: USGS quarterlyMonitoring: USGS quarterly
Monitoring: USGS quarterly
Monitoring: USGS quarterly
Monitoring: USGS quarterly
TD: TOTAL DEPTHOP: INTERVAL AT WHICH THE WELL IS PERFORATED OR OPEN TO THE AQUIFERWATER BEARING FORMATIONNA: NOT AVAILABLE- - -: MORE THAN 1 YEAR BETWEEN DATA POINTS LEFT SIDE: DEPTH TO WATERRIGHT SIDE: WATER ELEVATIONBASE: YEARALL MEASUREMENTS IN FEET
0 1 2 3 4 5 6
Miles
FIGURE 8

17
BLUE GULCH CRITICAL GROUND WATER AREA
Overview of Current Management Status
The Blue Gulch area, located in eastern Owyhee and western Twin Falls counties,was declared a CGWA on December 9, 1970 (Figure 9). This declaration was based on areport by Chapman and Ralston (1970) which stated that discharge was exceedingrecharge.
At the time, the area was being considered for increased agricultural developmentthrough the federal Desert Land Entry program. This would have increased ground waterdiversions for irrigation. Outstanding water appropriation permits at the time wereanticipated to divert over four times the usage. Designation as a CGWA stopped theprocessing of new applications while allowing the development of existing permits. Amanagement plan has not been developed nor has an advisory committee been formed.
Hydrogeology
Two aquifers provide ground water in the Blue Gulch area. The IdavadaVolcanics form the primary aquifer. The Idavada Volcanics composed mainly of silicic,welded ash flows and predominates the surface geology in the southern half of the area.The Banbury Basalt, consisting of three members, occurs in the area. The middle andupper members are important sources of ground water (Chapman and Ralston, 1970).
Depth to ground water varies from approximately 50 to 450 feet. Ground waterflows from southeast to northwest with a gradient of approximately 11 feet per mile(Bendixsen, 1993). Ground water discharge occurs to the Salmon Falls Creek and SnakeRiver. Recharge is from precipitation on uplands and the Jarbidge Mountains to thesouth.
Current Ground Water Conditions
Hydrographs of most wells in the area (Figure 10) depict the effects ofagricultural development that began in 1960s. Ground water levels declined in the BlueGulch area as agricultural development continued through the 1970’s. Governmentprograms in the early 1980’s encouraged land to be taken out of production. Theseprograms resulted in a decrease of more than 80% of previously irrigated acreage.Ground water levels began recovering in 1986 with the implementation of theConservation Recovery Program (CRP). These lands were contracted to be out ofproduction for 10 years. Lands are now being put back into production; it is unknownhow much land will be returned to production and if current changes will impact groundwater levels.
Water levels in the northwest portion of the area remained unchanged. Shallowwells near Magic Water Canal (08S13E-23CCD1) appear stable. Probably due to itsshallow depth, it receives recharge directly from the canal.

18
Ground water levels are monitored in ten wells. USGS monitors six wells: twoon a bi-monthly basis, and four on a semi-annual basis. Prior to 1998, IDWR monitoredwells on a semi-annual basis. Beginning in 1998, IDWR began monitoring on a quarterlybasis. Data for most wells date back to the late 1960’s.
REFERENCES
Bendixsen, Shane, 1993, Summary of Ground-Water Conditions in the Blue GulchCritical Ground Water Area Eastern Owyhee and Western Twin Falls Counties,Idaho, Idaho Department of Water Resources Open File Report, 22 pages.
Chapman, S. L., and Ralston, D. R., 1970, Ground Water Resources of the Blue GulchArea in eastern Owyhee and western Twin Falls Counties, Idaho: WaterInformation Bulletin No. 20, Idaho Department of Water Administration, 36pages.
Shaff, D., 1979, Memorandum to Norm Young, re: Blue Gulch C.G.A. Irrigation Data,Idaho Department of Water Resources, 3 pages.

�
�
����
�������
�
�
����������������������
���������
���
��� �������
��������
�������
����
������
���
����
���
� � � ����
�
����������������������� ���������
����� !"#$%&��
���
������
����� � ������������
��������������
������
�����
�����
�����
����
�����
��
�����
�����
��� ���
���'������(��)�����)� �*$$

LEGEND
TD: 290OP: 250-285IDAHO GROUP
TD: 426OP: 32-426NA
TD: 500OP: 46-500BANBURY FORMATION
TD: 100OP: 50-100BANBURY FORMATION
TD: 920OP: 165-920IDAVADA VOLCANICS
TD: 800OP: 625-800NA
TD: 7000P: 100-700NA
TD: 688OP: 6-688IDAVADA VOLCANICS
TD: 700OP: NANA
TD: 530OP: 10-355, 445-530NA
TD: 1350?, 1500?NANA
MAGIC
WATER
CANAL
SALMON
FALLS
CREEK
T8S
T9S
T10S
R11E R12E
PREPARED BY THE IDAHO DEPARTMENT OF WATER RESOURCES 10/98 HH
Monitoring: IDWR, semi-annual
Monitoring: IDWR, semi-annual
Monitoring: IDWR, semi-annualMonitoring: IDWR, semi-annual
Monitoring: USGS, semi-annual Monitoring: USGS, semi-annual
Monitoring: USGS, semi-annual
Monitoring: USGS, bi-monthly
Monitoring: USGS, bi-monthly
Monitoring: USGS, bi-monthly
Monitoring: Discontinued 1982
Ground Water HydrographsBLUE GULCH CRITICAL GROUND WATER AREAS
TD: TOTAL DEPTHOP: INTERVAL AT WHICH THE WELL IS PERFORATED OR OPEN TO THE AQUIFERWATER BEARING FORMATIONNA: NOT AVAILABLE----: MORE THAN 1 YEAR BETWEEN DATA POINTS LEFT SIDE: DEPTH TO WATERRIGHT SIDE: WATER ELEVATIONBASE: YEARALL MEASUREMENTS IN FEET
FIGURE 10

21
BOISE FRONT LOW TEMPERATURE GEOTHERMAL RESOURCEGROUND WATER MANAGEMENT AREA
Overview of Current Management Status
The Boise Front Low Temperature Geothermal Resource (BF GWMA) is locatedin Boise City and Ada County in southwestern Idaho (see Figure 11). The area wasdesignated on June 15, 1987. The order identified the resource of concern to be groundwater from a depth greater than 300 feet and/or a temperature greater than 85° fahrenheit(F).
The geothermal resource has been used for heating for over 100 years. However,increased development during the mid-1980’s more than doubled the diversion volumefrom pre-1983 levels (Neely, 1998). Water level declines of up to 30 feet from 1983 to1987 have been documented in some of the geothermal wells.
The Director signed a Management Policy for the Boise Front Ground WaterManagement Area on June 3, 1988. The policy identified specific goals and actions. Thegoals are (1) Protect the existing users; (2) Allow full use of the geothermal resource; (3)Provide clear management policies; and, (4) Stabilize depletions. An advisory committeehas not been formed. IDWR works closely with the major geothermal users within thearea and regularly reviewed ground water data.
An order establishing a five-year moratorium, an action identified in theManagement Policy, was issued on June 11, 1988 preventing new development orincreased use of the resource. The moratorium was extended in 1993 and 1998; it iscurrently in place until September 1, 2003.
Hydrogeology
The Boise area is underlain by three aquifer systems: a shallow cold water system,an intermediate cold water artesian system, and a deep low temperature geothermalartesian system. Not all aquifers exist in all areas. (Higginson, 1988). The BF GWMAapplies only to the deep geothermal aquifer.
It is generally believed that the Boise Front Fault zone brings the thermal water toshallow depth, where it is confined in the horizontally layered volcanic rocks andsediments hydraulically connected to the fault zone (Castelin, 1987). It is also believedthat the system is “compartmented by cross-cutting faults, creating a highly complex flowsystem” (Castelin, 1987).
Current Ground Water Conditions
Ground water hydrographs are shown in Figure 12. Ground water levels in thenorthern portion of the area show significant recovery as depicted in 04N02E-29ACDB1.A review of the geothermal ground water conditions was recently conducted by Neely(1998), to determine if the moratorium should be extended, modified or cancelled. The

22
report determined that the system appears to have reached equilibrium, although thereasons are not fully understood (Neely, 1998).
Production, wellhead pressures and temperatures are monitored by the majorproducers and data are submitted to IDWR regularly. These users are: Idaho Departmentof Administration, Division of Public Works; Boise Warm Springs Water District; Cityof Boise; and Veterans Administration Medical Center.
The City of Boise drilled an injection well in Spring, 1998, for use as the primarydisposal site for spent geothermal water from its heating system. The injection well wentinto service in February 1999 (Kent Johnson, City of Boise, personal communication).
REFERENCES
Castelin, Paul, 1987, IDWR Memorandum to John Beal and Norm Young, subject:Response to Work Request Dated March 19, 1987, dated April 8, 1987, 3 pages.
Neely, Kenneth W., 1998, Production, Temperature, and Water Level Data for the FourHeating System in the Boise Front Low Temperature Geothermal Resource Area,1977-1997, Idaho Department of Water Resources Open-File Report, 31 pages.
Higginson, R. Keith, June 3, 1988, “Management Policy for the Boise Front GroundWater Management Area, 12 pages and attachments.

Boise Front Ground Water Management Area
and Southeast Boise Ground Water Management Area
Scale 1 :270, 150 I 2 O 2 Miles
5
..
Ruer!llor
\ Re,el'VOlr
i

BOISE FRONT GROUND WATER MANAGEMENT AREA
LEGENDTD: TOTAL DEPTHOP: INTERVAL AT WHICH THE WELL IS PERFORATED OR OPEN TO THE AQUIFERNA: NOT AVAILABLELEFT SIDE: DEPTH TO WATERRIGHT SIDE: WATER ELEVATIONBASE: YEARALL MEASUREMENTS IN FEET
Ground Water Hydrographs
JekerEdwards Greenhouse
VA #1
Boise WarmSprings #3
BLM
Gulch
Eagle
Meridian
LuckyPeakReservoir
Boise Front GWMA
SoutheastBoiseGWMA
HubbardReservoir
Boise
T4N
T3N
T2N
R1E R2E R3E
0 1 2 3 4 5 6
Miles
FIGURE 12
PREPARED BY THE IDAHO DEPARTMENT OF WATER RESOURCES 10/98 HH

25
CURLEW VALLEY CRITICAL GROUND WATER AREA
Overview of Current Management Status
Curlew Valley is located in southeastern Idaho in Oneida and Power counties andextends south into Utah (Figure 13). The Curlew Valley CGWA was designated onMarch 15, 1976. Designation was based on concern that there was not sufficient groundwater supply for existing irrigation uses or to fulfill pending applications and permits.
The geographic and hydrogeologic boundaries extend into Utah. In the southernpart of the basin, Locomotive Springs is an area of discharge for the aquifer and a Utahstate wildlife management area. The State of Utah expressed concern that increasedground water withdrawals in Idaho were impacting the spring flows.
No further studies have been conducted since designation of the CGWA todetermine adequacy of supply or impacts on spring flows. A management plan has notbeen developed for the area nor has an advisory committee been formed.
Hydrogeology
Aquifers in the Curlew Valley area consist primarily of unconsolidated sedimentsof alluvium and lakeshore deposits that may be as much as 5,000 feet thick. Minoramounts of ground water are found in consolidated Paleozoic rocks that form thesurrounding hills and mountains (Chapman and Young, 1972). Ground water dischargefrom basalt flows in the basin which have been suggested as the source for HolbrookSprings, a large spring which contributes to the base flow of Deep Creek (Baker, 1974).
Ground water flow is primarily from north to south with unconfined conditions inthe northern part and semi-confined conditions toward the south (Baker, 1974). Rechargeis from precipitation in the valley and surrounding mountains (Chapman and Young,1972).
Current Ground Water Conditions
Hydrographs (Figure 14) of the three monitoring wells appear to reflect climaticwet and dry cycles. During the drought periods of the late 1970s-early 1980s and late1980s, a water level declines. During the above normal precipitation periods in the mid-1980s, water levels rose. However, since the early 1990s, precipitation has been at orabove normal, but the water levels indicate stable or declining trends.
Three wells are currently monitored by the USGS, Utah Office on a semi-annualbasis. Data dates back to 1970. Two additional wells within the hydrogeologic basin arelocated in Utah and are monitored on an annual basis by the USGS. Data from thesewells are useful in evaluating basin-wide trends.

26
REFERENCES
Baker, C. H., Jr., 1974, Water Resources of the Curlew Valley Drainage Basin, Utah andIdaho, State of Utah Department of Natural Resources Technical Publication No.45, 91 pages.
Bendixsen, Shane, 1994, Summary of Ground-Water Conditions in the Curlew ValleyCritical Ground Water Area in Oneida and Power County, Idaho, IDWR OpenFile Report, 12 pages.
Chapman, Sherl L. and Norman C. Young, 1972, Water Resources of Western Oneidaand Southern Power Counties, Idaho, IDWR Water Information Bulletin No. 25,69 pages.
Idaho Department of Water Resources, February 1976, Curlew Valley, Idaho, Open-FileReport, 35 pages.
Nace, R. L., 1952, Records of Wells and Springs in Western Oneida County, Idaho,USGS Open File Report, 50 pages.

����������������������� ������
�
�
�
���
�������������
����
� �
�
�����������
����
�
����
��������
�����
�� ��
����
�� �
�
�������� ����
���
�������
�������
�������
����
����
���
��������
����
����
����
�����
�����
����
� �������
���������������
� � � ����������� �!"��
# ��
�������$��%��&'�%�(�)

HOLBROOK
STONERESERVOIR
T11S
T13S
T15S
R32E
IDAHOUTAH
LEGEND
SCALE
TD: 146OP: 122-146SALT LAKE FORMATION
TD: 270 ?OP: NAQUATERNARY SEDIMENTS
TD: 230OP: 30-230CENOZOIC VALLEY FILL
PREPARED BY THE IDAHO DEPARTMENT OF WATER RESOURCES, HH 11/98
Monitoring: USGS, semi-annual
Monitoring: USGS, semi-annual
Monitoring: USGS, semi-annual
CURLEW VALLEY CRITICAL GROUND WATER AREA Ground Water Hydrographs
TD: TOTAL DEPTHOP: INTERVAL AT WHICH THE WELL IS PERFORATED OR OPEN TO THE AQUIFERWATER BEARING FORMATIONNA: NOT AVAILABLE- - -: MORE THAN 1 YEAR BETWEEN DATA POINTS LEFT SIDE: DEPTH TO WATERRIGHT SIDE: WATER ELEVATIONBASE: YEARALL MEASUREMENTS IN FEET
FIGURE 14

29
GRANDVIEW-BRUNEAU GROUND WATER MANAGEMENT AREA
Overview of Current Management Status
The Grandview-Bruneau GWMA is located in north-central Owyhee County,south of the Snake River (see Figure 15). The management area was designated onOctober 29, 1982, due to increased and projected increases in ground water withdrawaland declines in spring flows from the geothermal aquifer system.
Since designation, the only new ground water diversions have been for domesticuse and a Desert Land Entry development that had been pending. The Department hasalso worked with well owners to eliminate leakage or unrestricted flow (State of Idaho,1998). A management plan has not been developed nor has an advisory committee beenformed.
The impact of ground water development on spring flows has been studied byvarious researchers as a result of the listing of the Bruneau Hot Springs snail as anEndangered Species in 1993. The snail’s dependency on hot springs for its habitat hasresulted in studies to evaluate the impact of ground water pumping on spring discharges.
Hydrogeology
Several aquifers are found in the area. The major aquifers are found in theTertiary silicic volcanics, Poison Creek Formation, Banbury Basalt, and the sedimentaryGlenns Ferry Formation. The Banbury Basalt is the most productive aquifer with yieldsof greater than 2,000 gpm (Ralston and Chapman, 1969). These aquifers are warm tohot, ranging from 80 to 176 degrees F. Shallow cold water alluvial aquifers are foundalong streams. These aquifers have limited areal extent (Berenbrock, 1993). Aquiferproperties vary considerably because of the heterogeneous nature of the rocks andsediments.
Recharge is from precipitation on the Owyhee Mountains (Ralston and Chapman,1969). The deep volcanics are believed to recharge the shallower geothermal aquifers(Banbury Basalt and Glenns Ferry Formation) through upward ground water movement.Ground water flow is generally south to north. The direction of water movement hasbeen modified, however, by ground water pumping (Berenbrock, 1993).
Current Ground Water Conditions
Figures 16 and 17 show hydrographs of ground water levels in the Grandview-Bruneau GWMA. Figure 16 shows ground water levels in the eastern portion of themanagement area around Hot Creek. These data reflect recent trends with most of thehistoric data dating back only to the late 1980’s. Water levels appear to be stable.
Figure 17 shows hydrographs for the western portion and also include wells withlong term data in the eastern portion. Well 06S03E-14BCB1 in the northwest area showssignificant declines of almost 40 feet since the 1950s but appears to be relatively stable

30
since the 1970s. Declines ranging from a few feet to as much as 30 feet have alsooccurred. Currently, the overall system appears relatively stable.
Currently, USGS monitors 20 wells within the GWMA. Four are through theIDWR-USGS Cooperative Program. The remainder is funded through the US Fish andWildlife Service. Six wells have continuous recorders, ten wells are monitored monthly,three wells are monitored bi-monthly, and one well is monitored semi-annually. Datadates as far back as early 1950s for some wells. Nine new wells were drilled in 1990 bythe USGS as a part of the Bruneau Hot Springs Snail studies. Continuous recorders wereinstalled in six wells and three are measured on a monthly basis.
REFERENCES
Berenbrock, Charles, 1993, Effects of Well Discharges on Hydraulic Heads in and SpringDischarges from the Geothermal Aquifer System in the Bruneau Area, OwyheeCounty, Southwestern Idaho, USGS Water-Resources investigations Report 93-4001, 58 pages.
Gimperle, Richard J., 1988, Analysis of Ground Water Resource Conditions andManagement Alternatives for the Bruneau-Grandview Area, Southwestern Idaho,120 pages.
Moffatt, R. L. and M. L. Jones, 1984, Availability and Chemistry of Ground Water on theBruneau Plateau and Adjacent Eastern Plain in Twin Falls County, South-CentralIdaho, USGS Water-Resources Investigations Report 84-4065, 43 pages.
Ralston, Dale R. and Sherl L. Chapman, 1969, Ground-Water Resource of NorthernOwyhee County, Idaho, IDWR Water Information Bulletin No. 14, 85 pages.
State Of Idaho, 1998, Conservation Plan for the Endangered Bruneau Hot Springsnail(Pyrgulopsis bruneauensis) Along the Bruneau River, Southwestern Idaho, 15pages.
Young, H. W. and R. E. Lewis, 1982, Hydrology and Geochemistry of Thermal GroundWater in Southwestern Idaho and North-Central Nevada, USGS ProfessionalPaper 1044-J, 20 pages.

���������
� ������
������
������
����������
����
����������
����
������
��
���
��
���
��
� � � �����
�������������������������������������������
����
���
�����
��
����������������
������
��
�����
�������
�����
����
�����
��
��!
�����
��!��
��
��� ��"�
������ �� !"##
$
������%�&�����'���"(

SNAKE
RIVER
C.J.
STRIKE
BRUNEAU
RIVER
BRUNEAU
HO
TC
RE
EK
SH
OO
FLY
CREEK
GRANDVIEW5S
6S
7S
8S
2E 3E 4E 5E 6E
HY-78
HY-
51
TD: 760OP: 415-760BANBURY BASALT
TD: 681OP: 322-681BANBURY BASALT
TD: 323OP: 302-322BANBURY BASALT
TD: 679OP: 659-679BANBURY BASALT
TD: NAOP: NABANBURY BASALT
TD: 480OP: 194-480BANBURY BASALT
TD: 90OP: 80-90BANBURY BASALT
TD: 140OP: 120-140BANBURY BASALT
TD: 600OP: 170-600BANBURY BASALT
TD: 300OP: 46-300BANBURY BASALT
LEGEND
PREPARED BY THE IDAHO DEPARTMENT OF WATER RESOURCES HH 11/98
Monitoring: USGS, continuous recorder Monitoring: USGS, continuous recorder
Monitoring: USGS, continuous recorderMonitoring: USGS, continuous recorderMonitoring: USGS, continuous recorderMonitoring: USGS, continuous recorder
Monitoring: USGS, monthly
Monitoring: USGS, monthly
Monitoring: USGS, monthly
Monitoring: USGS, monthly
Ground Water Hydrographs - East AreaGRANDVIEW-BRUNEAU GROUND WATER MANAGEMENT AREA
TD: TOTAL DEPTHOP: INTERVAL AT WHICH THE WELL IS PERFORATED OR OPEN TO THE AQUIFERWATER BEARING FORMATIONNA: NOT AVAILABLE----: MORE THAN 1 YEAR BETWEEN DATA POINTS LEFT SIDE: DEPTH TO WATERRIGHT SIDE: WATER ELEVATIONBASE: YEARALL MEASUREMENTS IN FEET
0 1 2 3 4 5 6
Miles
FIGURE 16

LEGEND
PREPARED BY THE IDAHO DEPARTMENT OF WATER RESOURCES HH 11/98
C.J.
STRIKE
BRUNEAU
HO
TC
RE
EK
SH
OO
FL
Y
CREEK
GRANDVIEW5S
6S
7S
8S
2E 3E 4E 5E 6E
HY-
51
TD: 1,342 ?OP: 373-1,342IDAHO GROUP
TD: 1,905 ?OP: 1,600 1,905IDAHO GROUP
TD: 142OP: NANA
TD: 476OP: 230-476IDAHO GROUP
TD: 960 ?OP: 80- 960BANBURY BASALTS
TD: 1,954OP: 180-710; 1,020-1,080; 1,560-1,680BANBURY BASALTS
TD: 1,135OP: 406-1,135IDAVADA VOLCANICS
TD: 410 ?OP: NABANBURY BASALTS
TD: 1,390OP: 19-1,390IDAVADA VOLCANICS
TD: 517OP: 254-517BANBURY BASALTS
NOTE EXPANDED VERTICAL SCALE
PUMP LIFTS
NOTE EXPANDED VERTICAL SCALE
RECENTLY PUMPED, SPRING ’97
Monitoring: USGS semi-annual Monitoring: USGS bi-monthly Monitoring: USGS bi-monthly
Monitoring: USGS monthly
Monitoring: USGS monthly
Monitoring: USGS monthly Monitoring: USGS monthly Monitoring: USGS monthly
Monitoring: USGS annually
Monitoring: USGS quarterly
GRANDVIEW-BRUNEAU GROUND WATER MANAGEMENT AREAGround Water Hydrographs - West Area
TD: TOTAL DEPTHOP: INTERVAL AT WHICH THE WELL IS PERFORATED OR OPEN TO THE AQUIFERWATER BEARING FORMATIONNA: NOT AVAILABLE----: MORE THAN 1 YEAR BETWEEN DATA POINTS LEFT SIDE: DEPTH TO WATERRIGHT SIDE: WATER ELEVATIONBASE: YEARALL MEASUREMENTS IN FEET
0 1 2 3 4 5 6
Miles
FIGURE 17

34
LINDSAY CREEK GROUND WATER MANAGEMENT AREA
Overview of Current Management Status
The Lindsay Creek GWMA is located in Nez Perce County, south of theClearwater River and east of Lewiston, Idaho (see Figure 18). The Idaho Department ofWater Resources designated the Lindsay Creek GWMA on March 5, 1992. Thedesignation was made based on the limited recharge and potential increased use of aportion of the shallow upper aquifer. Most domestic wells are completed in the shallowportion of the upper aquifer.
The designation of the Lindsay Creek GWMA does not preclude the approval ofnew ground water diversions. However, new proposed uses are required to use thedeeper aquifer. If the shallow aquifer is desired, the applicant is required to demonstratethat other rights will not be injured or provide acceptable mitigation to prior rights. AManagement Policy was developed and issued with the Order designating the GWMA.The policy sets out the criteria for processing pending and future applications for permitfor water rights. A management plan has not been developed nor has an advisorycommittee been formed.
Hydrogeology
Multiple aquifers underlie the Lewiston Orchards area and occur within basaltflows of the Columbia River Group. Lacustrine and fluvial sediments of the LatahFormation are interbedded between the basalt flows. Ground water beneath the LindsayCreek GWMA occurs in three aquifers: Upper, Intermediate, and Lower (Ralston andBond, 1978).
The Upper Aquifer is associated with water bearing zones and sediments to adepth of approximately 700 feet below land surface. Primary source of recharge appearsto be underflow that enters from the east (Baker, 1991). The Intermediate Aquifer occursat a depth from 700 to 1100 feet below ground surface. Recharge is through outcrops ofthe basalt interflow zones in the channel and flood plain area of the Snake River,Clearwater River, Lapwai Creek, and through ancestral channels buried by UpperYakima Valley filling flows. The Lower Aquifer occurs below a depth of 1100 feet.Recharge occurs mostly from the Clearwater River, Snake River and Lapwai Creek(Ralston and Bond, 1978).
The top of the shallow aquifer occurs at approximately 120 to 150 feet below landsurface. The base of the shallow aquifer is encountered at approximately 250 feet. Basaltis the major rock type. Yields from wells are usually less than 25 gallons per minute.Aerial extent is limited (Baker, 1991). Ground water flow is mostly westward with aslight northwest component and follows the slope of the land.

35
Current Ground Water Status
Figure 19 shows two ground water hydrographs of water levels in wells locatedwithin the Lindsay Creek GWMA and one for a well located southwest of themanagement area. Historic ground water monitoring data within the area dates back onlyto 1992. Though no overall downward decline is indicated, seasonal fluctuations canexceed 20 feet.
Ground water monitoring is limited to two wells measured by USGS on amonthly basis since 1991. One additional well, located southwest of the GWMA, is alsomeasured on a monthly basis dating back to 1970.
REFERENCES
Baker, Steve, November 20, 1991, IDWR Interdepartment Memorandum to Glen Saxton,Subject: Ground-water conditions in the Lindsay Creek Area.
Ralston, Dale R., and Bond, John G., undated. “Lewiston Orchards GroundwaterPotential and Well-Site Location Study, unpublished report.

Lindsay Creek Ground Water Management Area N
Scale 1:190,180 1 0 1 Miles
T37N T36N
Hatw_ .
31
t""' 6 • ,%
---+-----+-----+----l---------+----------l Lapwai l

3632 31 36
24192420
Lapwai
Lewiston Orchards
Lewiston LINDSAYCREEKGWMA
Lindsay
MannLake
HY-95
SCALE
TD: 240OP: 180-223COLUMBIA RIVER BASALT
TD: 252OP: 190-230COLUMBIA RIVER BASALT
TD: 383OP: 136-383COLUMBIA RIVER GROUP
LEGEND
PREPARED BY THE IDAHO DEPARTMENT OF WATER RESOURCES, 12/98 HH
NOTE EXPANDED TIME PERIOD
Monitoring: USGS, monthlyMonitoring: USGS, monthly
Monitoring: USGS, monthly
LINDSAY CREEK GROUND WATER MANAGEMENT AREAGround Water Hydrographs
TD: TOTAL DEPTHOP: INTERVAL AT WHICH THE WELL IS PERFORATED OR OPEN TO THE AQUIFERWATER BEARING FORMATIONNA: NOT AVAILABLE----: MORE THAN 1 YEAR BETWEEN DATA POINTS LEFT SIDE: DEPTH TO WATERRIGHT SIDE: WATER ELEVATIONBASE: YEARALL MEASUREMENTS IN FEET
FIGURE 19

38
Mountain Home Ground Water Management Area and CinderCone Butte Critical Ground Water Area
Overview of Current Management Status
The Cinder Cone Butte area, located in Elmore County, was declared a CGWA onMay 7, 1981 (Figure 20). Following the declaration, a study was conducted to evaluatethe entire Mountain Home area. As a result of that study by Norton and others (1982),the Mountain Home GWMA, which surrounds the Cinder Cone Butte area, wasdesignated on November 9, 1982. The Mountain Home GWMA is located in Elmore andwestern Ada counties. The areas were designated due to declining ground water levels.
New ground water appropriations are not allowed in the Cinder Cone ButteCGWA. The order declaring the Mountain Home area a GWMA states that the area isapproaching critical, “although there appear to be subareas where new appropriationscould be authorized without injuring existing water rights.”
A management policy was not included in the designation of either area. On June6, 1996, the Director issued an order establishing an advisory committee. The Committeehas the following objectives:
a. Collect and review data;b. Mediate water related issues involving water users;c. Develop draft ground water management plan;d. Develop and propose implementation of a ground water recharge program;e. Serve as a forum for communication of water related issues.
The composition of the Committee is specified in the order. The Committee does nothave any formal enforcement authority.
Hydrogeology
The Mountain Home area contains a regional aquifer system that flows west-southwest. Depth to water in the regional system is usually in excess of 300 feet. Twoperched aquifer systems are found in the area: one system in the area in and around theCity of Mountain Home, and another system northwest of Mountain Home in Township 2South, Range 5 East (Young, 1977). Water in the perched areas range from a few feet toseveral hundred. Ground water flow direction is south to southwest.
Major geologic units in the area are, from youngest to oldest: 1) alluvium andterrace gravels; 2) Snake River Group; 3) Idaho Group; 4) Idavada Volcanics, and 5)Idaho Batholith. The regional aquifer is found primarily in the Bruneau Formation, a unitin the Idaho Group that consists of fluvial-lake deposits, layers of ash, and basaltic lavaflows (Ralston and Chapman, 1968). Two northwest trending faults pass through thenortheast part of the area (Bond, 1978). The perched aquifers occur primarily in thealluvium and terraces.

39
Recharge to the perched system in the Mountain Home area is from Rattlesnakeand Canyon creeks, local irrigation, and leakage from Mountain Home Reservoir.Recharge to the perched system northwest of Mountain Home is from percolation fromintermittent streams. Recharge to the regional system occurs mainly from downwardflow from the perched system, precipitation from the uplands and underflow from thenorth. It has been suggested that the regional system is quite old based on isotopecomposition (Young, 1977).
Current Conditions
Ground water levels in the regional system in the southern and eastern portions ofthe area near the Mountain Home Air Force Base show declines of more than 50 feetsince 1968 (Figures 21 and 22). Steep declines occurred during the late 1960s andearly1970s. Water levels appeared to stabilize in several wells during the mid-1970s andearly 1980s. However, declines began again in the mid to late 1980s and have continuedto present. In the northcentral part of the Cinder Cone Butte CGWA, water levels havedeclined as much as 60 feet since 1976. In the north and northwest parts of the area,ground water levels appear to be stable and have increased by as much as 3 to 4 feet since1966.
The perched system in and surrounding Mountain Home fluctuates in response toseasonal and climatic cycles. Fluctuations can be as much as 50 feet. Overall waterlevels appear to be relatively stable based on data collected since 1975.
The IDWR monitors 15 wells on a monthly basis. Prior to June 1998, these wellswere monitored on a semi-annual basis. USGS monitors 9 wells, two semi-annually andseven bi-monthly. In November 1997, IDWR contracted for seven additional wells to bemonitored on a monthly basis by a private consultant.
REFERENCES
Bendixsen, Shane, 1994, Summary of Hydrologic Conditions in the Mountain Home andCinder Cone Butte Areas, IDWR Open File Report, 30 pages.
Castelin, Paul M., 1988, Review of Factors Affecting Ground-Water Levels in theMountain Home Plateau Area Elmore and Ada Counties, Idaho, IDWR Open FileReport, 5 pages.
Norton, Marc A., Ondrechen, William and Baggs, James L., 1982, Groundwater WaterInvestigation of the Mountain Home Plateau, Idaho, IDWR Open File Report, 62pages.
Ralston, Dale R., and Chapman, Sherl L., 1968, Ground-Water Resource of the MountainHome Area, Elmore County, Idaho, IDWR Water Information Bulletin No. 4, 63pages.
Ralston, Dale R., and Chapman, Sherl L.,1970, Ground-Water Resource of Southern Adaand Western Elmore Counties, Idaho, IDWR Water Information Bulletin No. 15,52 pages.

40
Young, H. W., 1977, Reconnaissance of Ground-Water Resources in the Mountain HomePlateau Area, Southwest Idaho, USGS Water-Resources Investigations 77-108, 40pages.

Mountain Home Ground Water Management Area
and Cinder Cone Butte Critical Ground Water Area
4
' I
~; L.T~ --- Tis
Scale 1 :493, 190
O 4 Miles
..... I I
Llltl• .la. •utt- i
N
t
T6S -~-- -- ------~ ------,.,r·

TD: 750OP: 550-750BRUNEAU FORMATION
TD: 525OP: 485-525IDAHO GROUP
TD: 1620OP: 1040-1550NA
TD: 429OP: NAUNKNOWN
TD: 357OP: 50-357BRUNEAU FORMATION
TD: NAOP: NANATD: 497
OP: 240-497BRUNEAU FORMATION
TD: 1190OP: 149-1190NA
TD: NATD: NANA
TD: NAOP: NANA
TD: 600OP: 226-600NA
LEGEND
MOUNTAIN HOME GROUND WATER MANAGEMENT AREA AND THE CINDER CONE BUTTE CRITICAL GROUND WATER AREA
PREPARED BY THE IDAHO DEPARTMENT OF WATER RESOURCES 10/28/98 HH/MHN.SRF
LONG TOMRESERVOIR
MOUNTAIN HOMERESERVOIR
MOUNTAINHOME
FRASERRESERVOIR
AIRFORCEBASE
ADA COUNTYELMORE COUNTY
Ground Water Hydrographs - North Area
CINDER CONE BUTTECRITICAL GROUND WATER AREADESIGNATED MAY 7, 1981
TD: NAOP: NANA
Monitoring: USGS, bi-monthlyMonitoring: USGS, bi-monthly
Monitoring: USGS, bi-monthly
Monitoring: USGS, bi-monthly
Monitoring: USGS, bi-monthly
Monitoring: USGS, bi-monthlyMonitoring: USGS, bi-monthlyMonitoring: USGS, bi-monthly
Monitoring: IDWR, monthly
Monitoring: IDWR, monthly
Monitoring: IDWR, monthly
Monitoring: IDWR, monthly
TD: TOTAL DEPTHOP: INTERVAL AT WHICH THE WELL IS PERFORATED OR OPEN TO THE AQUIFERWATER BEARING FORMATIONNA: NOT AVAILABLE----: MORE THAN 1 YEAR BETWEEN DATA POINTS LEFT SIDE: DEPTH TO WATERRIGHT SIDE: WATER ELEVATIONBASE: YEARALL MEASUREMENTS IN FEET
FIGURE 21

CINDER CONE BUTTE CRITICAL GROUND WATER AREADESIGNATED MAY 7, 1981
LONG TOMRESERVOIR
MOUNTAIN HOME RESERVOIR
MOUNTAIN HOME
AIRFORCEBASE
SCALE
LEGEND
TD: 600OP: 66-600BRUNEAU FORMATION
REGIONAL
TD: 370OP: 162-319, 322-360GLENNS FERRY FORMATION
REGIONAL
TD: 530OP: NABRUNEAU FORMATION
REGIONAL
TD: 412OP: 158-409NA
REGIONAL TD: 578OP: 10-578NA
REGIONAL
TD: 700OP: 28-700NA
REGIONAL
TD: 857OP: 2-264, 598-857BRUNEAU FORMATION
REGIONAL
NOTE: TWO OF THE HYDROGRAPHS ARE FROM THE PERCHED SYSTEM SURROUNDING MOUNTAIN HOME. ALL OTHERS ARE FROM THE REGIONAL SYSTEM.
FRASERRESERVOIR
PREPARED BY THE IDAHO DEPARTMENT OF WATER RESOURCES 10/28/98 HH
ADA COUNTY
ELMORE COUNTY
TD: 490OP: 4-429NA
REGIONAL
TD: 604OP: 337-604NA
REGIONAL
TD: 150OP: NABRUNEAU FORMATION
PERCHED
TD: 250OP: 20-250NA
PERCHED
TD: 615OP: 347-547, 557-615NA
REGIONAL
Monitoring: IDWR, monthly
Monitoring: IDWR, monthlyMonitoring: USGS, bi-monthly
Monitoring: USGS, bi-monthly
Monitoring: USGS, bi-monthly
Monitoring: USGS, bi-monthly
Monitoring: USGS, bi-monthlyMonitoring: Kleinfelder, monthly
Monitoring: Kleinfelder, monthly
Monitoring: Kleinfelder, monthlyMonitoring: Kleinfelder, monthlyMonitoring: USGS, bi-monthly
TD: TOTAL DEPTHOP: INTERVAL AT WHICH THE WELL IS PERFORATED OR OPEN TO THE AQUIFERWATER BEARING FORMATIONNA: NOT AVAILABLE----: MORE THAN 1 YEAR BETWEEN DATA POINTS LEFT SIDE: DEPTH TO WATERRIGHT SIDE: WATER ELEVATIONBASE: YEARALL MEASUREMENTS IN FEET
Ground Water Hydrographs - South AreaMOUNTAIN HOME GROUND WATER MANAGEMENT AREA AND THE CINDER CONE BUTTE CRITICAL GROUND WATER AREA
FIGURE 22

44
OAKLEY FAN CRITICAL GROUND WATER AREAS
Overview of Current Management Status
The Oakley Fan is located in northeastern Twin Falls and western Cassia Counties(see Figure 23). Originally declared as the Goose Creek-Rock Creek CGWA on January16, 1962, the boundaries were modified on September 6, 1967, creating three separateCGWAs: Artesian City, Cottonwood, and Oakley-Kenyon. On January 19, 1982, theWest Oakley Fan CGWA was established. The four areas create a contiguous tract andhave been managed as a single unit.
The order modifying the boundaries and establishing the initial three areas stated“there does not appear to be available unappropriated ground water within the boundariesof the three designated areas. Therefore, new appropriations of water shall not beallowed.” The West Oakley Fan order did not specifically prohibit new diversions;however, the order stated that a study had indicated that the available ground water waslimited. A management plan has not been developed nor has an advisory committee beenformed.
A ground water recharge demonstration project has been ongoing in the regionsince the early 1990’s; however, only limited volumes have been recharged.
Hydrogeology
There are four main aquifers in the Oakley Fan area: limestone, rhyolite, basaltand alluvium (Bendixsen, 1994). The limestone aquifer is confined and yields largesupplies. The rhyolite aquifer is confined with yields of small to moderate amounts.Small to large quantities of ground water are supplied from the unconfined basalt aquifer.The unconfined alluvial aquifer yields small to moderate supplies of ground water(Crostwaite, 1969). There are several perched aquifers that are probably the result ofsurface runoff, storage facilities and surface irrigation.
Faults and surface water bodies affect the ground water flow direction. Groundwater flow direction between two northwest trending faults is north to northwest withprobable flow restrictions across the faults (Bendixsen, 1994). Murtaugh Lake gains orloses water apparently related to ground water pumpage. The area is bounded on thenorth by the Snake River. However, river elevations and ground water levels indicatethat flow passes under the Snake River to join the Eastern Snake Plain Aquifer at somepoint between Milner Dam and a point north of Murtaugh Lake (Bendixsen, 1994).
Recharge to the Oakley Fan comes from runoff from streams flowing from thesouth, surface irrigation, and the Snake River.

45
Current Ground Water Conditions
Figures 24 through 27 present ground water hydrographs for the four areas. Theoverall trend in ground water levels thoughout the Oakley Fan is downward. However,individual wells reflect different degrees of responsiveness to climatic fluctuationsrelating to dry and wet periods.
Water levels in most wells in the Oakley-Kenyon area reflect the wet period inearly-mid 1980s. Declines are evident during the drought of 1987-1992. Water levels inthis area have stabilized or slightly increased during the recent wet period from 1995 topresent.
Water levels in the Artesian City are less responsive to wet and dry periods thanwater levels in other areas. Most levels in the southern and eastern parts of the areareflect steep declines, while most levels in the north and west parts are more stable.
Water levels in the West Oakley are less sensitive to climatic changes, but are stillevident on a smaller scale.
Steep declines in water levels in the Cottonwood area during the 1960s stabilizedin the 1970s. However, declines began again in the 1980s and have continued at a lesssevere rate coinciding with the drought of the late 1980s and early 1990s.
While declines are not as significant as in other areas, water levels in the WestOakley area reflect wet (early-mid 1980s and 1995 to present) and dry cycles (1987-1992).
IDWR monitors 20 wells on a quarterly basis. USGS monitors 14 wells: twowells monthly, nine wells bi-monthly, and three wells semi-annually.
REFERENCES
Bendixsen, Shane, 1994, Summary of Ground Water Conditions in the Oakley Fan Area,IDWR Open File Report, 15 pages.
Crostwaite, E. G., 1969, Water Resources of the Goose Creek-Rock Creek area, Idaho,Utah, and Nevada: Idaho Department of Reclamation, Water Information Bulletin8, 73 pages.
Edwards, T. K., and Young, H. W., 1984, Ground Water Conditions in the Cottonwood-West Oakley Fan area, south central Idaho: USGS Water ResourcesInvestigations Report 84-4140, 32 pages.
Young, H. W., 1984, Potentiometric-surface Contours, Directions of Ground WaterMovement, and Perched Water Zones, Oakley Fan, southeastern Idaho, March-April 1984: USGS Water Resource Investigations Report 84-4231, 44 pages.
Young, H. W., and Newton, G. D., 1989, Hydrology of the Oakley Fan Area, South-Central Idaho, USGS Water-Resources Investigations Report 88-4065, 73 pages.
����������
��� �
��������
�����
��������������������
��
����
�
��
�� �� ������
�� ��������
��
��������������
�������
����
��
���
��
�����
��������
������� ����
����
�����������
�����
�������
��
����
� ��� �
� ��
� ��
� ��� ��
� ��
� ��
� ��� ��
��������
� ��� � ����
����
�������
���
���� �
����� �
� �
������ �
���������
��
� � � ��� �
���������������������������� ���� ���������
!��� �"#$��%�&'
�
�

T11S
T12S
T13S
T14S
R19E R20E R21E R22E R23E
OAKLEY FAN CRITICAL GROUND WATER AREASArtesian City Critical Ground Water AreaGround Water Hydrographs
Prepared by Idaho Department of Water Resources 11/98 HH
Oakley
Murtaugh 30
27
Twin Falls Co.
Cassia Co.
TD: 860OP: 16-860SNAKE RIVER GROUP
TD: 183OP: NASNAKE RIVER GROUP
TD: 680OP: 40-638SNAKE RIVER GROUP
TD: 325OP: 255-325SNAKE RIVER GROUP
TD: NAOP: NABANBURY FORMATION
TD: 215OP: NABANBURY FORMATION
TD: 565OP: 30-430, 500-565BANBURY FORMATION
TD: 1030OP: 4-1030NA
TD: 154OP: 20-117NA
TD: 542OP: 135-542NA
TD: 350OP: 140-350QUATERNARY SAND & GRAVEL
TD: 750OP: 735-750IDAVADA VOLCANICS
Monitoring: USGS bi-monthly
Monitoring: USGS bi-monthly
Monitoring: USGS monthly
Monitoring: USGS monthly
Monitoring: USGS monthly Monitoring: USGS continuous
Monitoring: USGS semi-annual
Monitoring: USGS quarterly Monitoring: USGS discontinued 1996Monitoring: USGS discontinued 1996
Monitoring: USGS discontinued 1995
Monitoring: USGS discontinued 1996
Artesian CityCGWA
TD: TOTAL DEPTHOP: INTERVAL AT WHICH THE WELL IS PERFORATED OR OPEN TO THE AQUIFERWATER BEARING FORMATIONNA: NOT AVAILABLE- - -: MORE THAN 1 YEAR BETWEEN DATA POINTS LEFT SIDE: DEPTH TO WATERRIGHT SIDE: WATER ELEVATIONBASE: YEARALL MEASUREMENTS IN FEET
LEGEND
0 1 2 3 4 5 6Miles
FIGURE 24

T11S
T12S
T13S
T14S
R19E R20E R21E R22E R23E
OAKLEY FAN CRITICAL GROUND WATER AREASCottonwood Critical Ground Water Area Ground Water Hydrographs
Prepared by Idaho Department of Water Resources 11/98 HH
Oakley
Murtaugh 30
27
Twin Falls Co.
Cassia Co.
Roc
k C
reek
Cre
ek
Birc
h
Goo
se
Creek
TD: 1185OP: 595-604, 795-1185PALEOZOIC LIMESTONE
TD: NAOP: NAPALEOZOIC LIMESTONE
TD: 1025OP: 718-1025PALEOZOIC LIMESTONE
TD: 850OP: 80-850PALEOZOIC LIMESTONE
Monitoring: IDWR discontinued 1984 Monitoring: USGS continuous
Monitoring: USGS continuous
Monitoring: USGS monthly
Cottonwood CGWA
TD: TOTAL DEPTHOP: INTERVAL AT WHICH THE WELL IS PERFORATED OR OPEN TO THE AQUIFERWATER BEARING FORMATIONNA: NOT AVAILABLE----: MORE THAN 1 YEAR BETWEEN DATA POINTS LEFT SIDE: DEPTH TO WATERRIGHT SIDE: WATER ELEVATIONBASE: YEARALL MEASUREMENTS IN FEET
LEGEND
0 1 2 3 4 5 6
Miles
FIGURE 25

OAKLEY FAN CRITICAL GROUND WATER AREASWest Oakley Critical Ground Water AreaGround Water Hydrographs
Prepared by Idaho Department of Water Resources 10/99 HH
Oakley
Murtaugh 30
27
Twin Falls Co.
Cassia Co.
T11S
T12S
T13S
T14S
R19E R20E R21E R22E R23E
TD: TOTAL DEPTHOP: INTERVAL AT WHICH THE WELL IS PERFORATED OR OPEN TO THE AQUIFERWATER BEARING FORMATIONNA: NOT AVAILABLE----: MORE THAN 1 YEAR BETWEEN DATA POINTS LEFT SIDE: DEPTH TO WATERRIGHT SIDE: WATER ELEVATIONBASE: YEARALL MEASUREMENTS IN FEET
Legend
TD: 475OP: 21-475
TD: 1200OP: 28-1200
TD: NAOP: NA
TD: 257OP: 233-257
TD: 1320OP: 260-1320
TD: 1202OP: 190-490, 507-1202
TD: 1110OP: NA
TD: NAOP: NA
TD: 936OP: 907-936
TD: NAOP: NA
TD: 537OP: 17-537
TD: 614OP: NA
Monitoring: USGS, bi-monthly
Monitoring: IDWR, discontinued
Monitoring: IDWR, bi-monthly
Monitoring: IDWR, bi-monthly Monitoring: IDWR, bi-monthly Monitoring: IDWR, bi-monthly Monitoring: USGS, semi-annual
Monitoring: USGS, continuous
Monitoring: IDWR, bi-monthly
Monitoring: IDWR, bi-monthlyMonitoring: USGS, quarterlyMonitoring: IDWR, bi-monthly
WestOakleyCGWA

Oakley
Murtaugh 30
27
Twin Falls Co.
Cassia Co.
T11S
T12S
T13S
T14S
R19E R20E R21E R22E R23E
OAKLEY FAN CRITICAL GROUND WATER AREASOakley-Kenyon Critical Ground Water AreaGround Water Hydrographs
Prepared by Idaho Department of Water Resources 11/98 HH
Note expanded scaleNote expanded scaleNote expanded scaleNote expanded scale
TD: 635OP: 605-635
TD: 630OP: 268-630
TD: 68OP: 60-64
TD: 412OP: 282-346
Monitoring: USGS bi-monthlyMonitoring: USGS bi-monthly Monitoring: USGS bi-monthly
Monitoring: USGS bi-monthly
Monitoring: IDWR bi-monthly
Monitoring: IDWR bi-monthly
Monitoring: IDWR bi-monthlyMonitoring: IDWR bi-monthlyMonitoring: USGS semi-annual
Monitoring: USGS semi-annual
Monitoring: USGS semi-annual
Monitoring: IDWR bi-monthly
TD: NAOP: NA
TD: 360OP: 92-165, 250-360
TD: 255OP: NA
TD: 1100OP: NATD: 997
OP: NA
TD: 942OP: 280-410, 630-942
TD: NAOP: NA
TD: 810OP: 400-810
Oakley-KenyonCGWA
TD: TOTAL DEPTHOP: INTERVAL AT WHICH THE WELL IS PERFORATED OR OPEN TO THE AQUIFERWATER BEARING FORMATIONNA: NOT AVAILABLE- - -: MORE THAN 1 YEAR BETWEEN DATA POINTS LEFT SIDE: DEPTH TO WATERRIGHT SIDE: WATER ELEVATIONBASE: YEARALL MEASUREMENTS IN FEET
LEGEND
0 1 2 3 4 5 6Miles
FIGURE 27

51
RAFT RIVER CRITICAL GROUND WATER AREA
Overview of Current Management Status
The Raft River Critical Ground Water Area (CGWA) is located in southern Idahoin Cassia County (Figure 28). The area was originally designated a CGWA on July 23,1963. Subsequent orders modified the boundaries, eliminating an area on the extremenorthern boundary (August 2, 1965), the Albion basin (September 19, 1966), and the areanorth of the Yale-Cotteral Road (November 3, 1970).
Large-scale ground water pumping in the Raft River valley began in 1950 andincreased through the 1950s. USGS documented declining water levels and decreasedstream flow in the Raft River from 1956 through 1960 (Mundorff and Sisco, 1963). By1963, concern over the potential effects of new and increased ground water use causedthe designation as a CGWA. Creation of the management area did not include formationof advisory committee or development of a management plan.
Hydrogeology
Aquifers in the Raft River Basin consist of lake and volcanic deposits, alluvialdeposits, and basalt. Ground water occurs in both water table and artesian conditions.Interbedded lenses and tongues of silt and clay support localized perched zones (Nace,1961).
Ground water flows south to north toward the Snake River, generally followingthe direction of surface water flow. Recharge occurs principally from precipitation,infiltration from streams, and irrigation water (Nace, 1961).
Current Ground Water Conditions
Figure 29 presents ground water hydrographs for the areas Most hydrographsreflect the following similar trends, although the trends are more subdued in the southernpart of the valley. Declining trends are evident during the period of development,beginning in the 1950s until the late 1970s. Water levels were stable or rising during thewet period of the early-mid 1980s. Declines have continued from the late 1980s topresent.
Currently, 23 wells are monitored within the Raft River basin. USGS monitorsfour wells: two wells are monitored bi-monthly and two wells are monitored quarterly.The remaining 19 wells are monitored by IDWR on a quarterly to semi-annual basis.Data dates back to the early 1950s.
REFERENCES
Bendixsen, Shane, 1994, Summary of Ground Water Conditions in the Raft River Area,IDWR Open File Report, 15 pages.

52
Mundorff, M. J., and Sisco, H. G., 1963, Ground water in the Raft River basin, Idaho,with special reference to irrigation use, 1956-1960, USGS Water-Supply Paper1619-CC, 23 pages.
Nace, R. L., and others, 1961, Water Resources of the Raft River Basin, Idaho-Utah:USGS Water-Supply Paper 1587, 138 pages.
Walker, E. H., L. C. Dutcher, SO. O. Decker, and K. L. Dyer, 1970, The Raft RiverBasin, Idaho-Utah, as of 1966: A Reappraisal of the Water Resources and Effectsof Ground-Water Development, IDWR Water Information Bulletin No. 19, 95pages.

�
�
������
����
���������
���
�� � �
���� ��
���������� ��
������� ��
����
������
� �
������
��
��������
��
����
�� ��
���������� ��
������ ��
���� ��
����
��
�����
����
��������
�������
��
���
������ � ����
�� �
����
����
�����
�����
�����
�����
���������
��
��
�
�
�
���
� � � � � �����
�
���������������������������������
������� !��" �
��������#�$��%��&'�%���())

TD: 256OP: 216-256NA
TD: 301OP: NASNAKE RIVER GROUP
TD: 250OP: 237-250RAFT FORMATION
TD: 348OP: 136-348NA
TD: 450OP: 115-435NA
TD: 270OP: 35-226NA
TD: 124OP: 70-120NA
TD: 250OP: 66-250QUATERNARY GRAVELS
TD: 440OP: 124-440NA
TD: 197OP: NANA
LEGEND
NOTE EXPANDED SCALE
Snake
30
84
77
81
Cassia
Malta
Bridge
T9S
T10S
T11S
T12S
T13S
T14S
T15S
T16S
R26E R27E R28E R29E
TD: TOTAL DEPTHOP: INTERVAL AT WHICH THE WELL IS PERFORATED OR OPEN TO THE AQUIFERWATER BEARING FORMATIONNA: NOT AVAILABLE- - -: MORE THAN 1 YEAR BETWEEN DATA POINTS LEFT SIDE: DEPTH TO WATERRIGHT SIDE: WATER ELEVATIONBASE: YEARALL MEASUREMENTS IN FEET
PREPARED BY THE IDAHO DEPARTMENT OF WATER RESOURCES 12/98 HH
Monitoring: USGS, bi-monthlyMonitoring: IDWR, quarterly
Monitoring: IDWR, quarterly
Monitoring: IDWR, quarterly
Monitoring: IDWR, quarterly Monitoring: IDWR, quarterly
Monitoring: IDWR, quarterly
Monitoring: IDWR, quarterly
Monitoring: IDWR, quarterly
Monitoring: IDWR, quarterly
Monitoring: USGS, quarterly Monitoring: USGS, quarterly
TD: 225OP: 45-50, 105-225QUATERNARY GRAVELS
TD: 900OP: NANA
RAFT RIVER CRITICAL GROUND WATER AREA
0 1 2 3 4 5 6Miles
FIGURE 29Ground Water Hydrographs

55
SOUTHEAST BOISE GROUND WATER MANAGEMENT AREA
Overview of Current Management Status
The Southeast Boise GWMA, located in Ada County, was established by theDirector, IDWR, on October 14, 1994 (Figure 30). The Order establishing themanagement area and included the requirement for the formation of an advisorycommittee. This precedent-setting requirement delineated the responsibilities andmembership for the advisory committee. The advisory committee is required to developa management policy and work toward informally resolving ground water disputes.
The Order also required that all ground water users diverting more than 0.20 cubicfeet per second (cfs) submit annual reports of water use to IDWR. A separate Orderrequiring measuring devices, signed on April 4, 1995, was issued to 17 ground waterusers holding a total of 28 water rights diverting more than 0.20 cfs.
The Southeast Boise GWMA is the second ground water management area in theTreasure Valley. The Boise Front Geothermal GWMA was designated in 1987. Theboundaries partially overlap, however, the Boise Front Geothermal GWMA is designatedfor ground water with temperatures greater than 85 degrees F. The Southeast BoiseGWMA designates a specific cold water aquifer unit, commonly described as the Boise-Fan aquifer (Squires, 1992).
IDWR Western Region has been working with the advisory committee since itsformation. The Committee has resolved a dispute within the management area, and hasdeveloped a dispute resolution process. The advisory committee is also directed todevelop a water budget and determine reasonable pumping lift.
Hydrogeology
Rocks underlying the Southeast Boise GWMA consist of Boise fan sediments(Squires, 1992). They are considered to represent a buried alluvial fan-fan delta system.The fan deposits are rarely exposed and overlain by Pleistocene gravels that haveinterfingering basalt flows (Dion, 1972). A deep geothermal system can be encounteredwith water temperatures above 85 degrees F at depths 900 to 1100 feet below landsurface (Squires, 1993).
Ground water flows to the south and southwest and depth to water ranges from afew feet in the northern part of the management area to over 400 feet in the southern part.Ground water is usually under water table conditions. South of the management area, nodata are available. To the east, the area is bounded by siliceous volcanics that extendsouthward beyond the management area boundary. To the north, the area is bounded bythe Boise River. Recharge is believed to be primarily from the Boise River and leakagefrom the New York Canal.
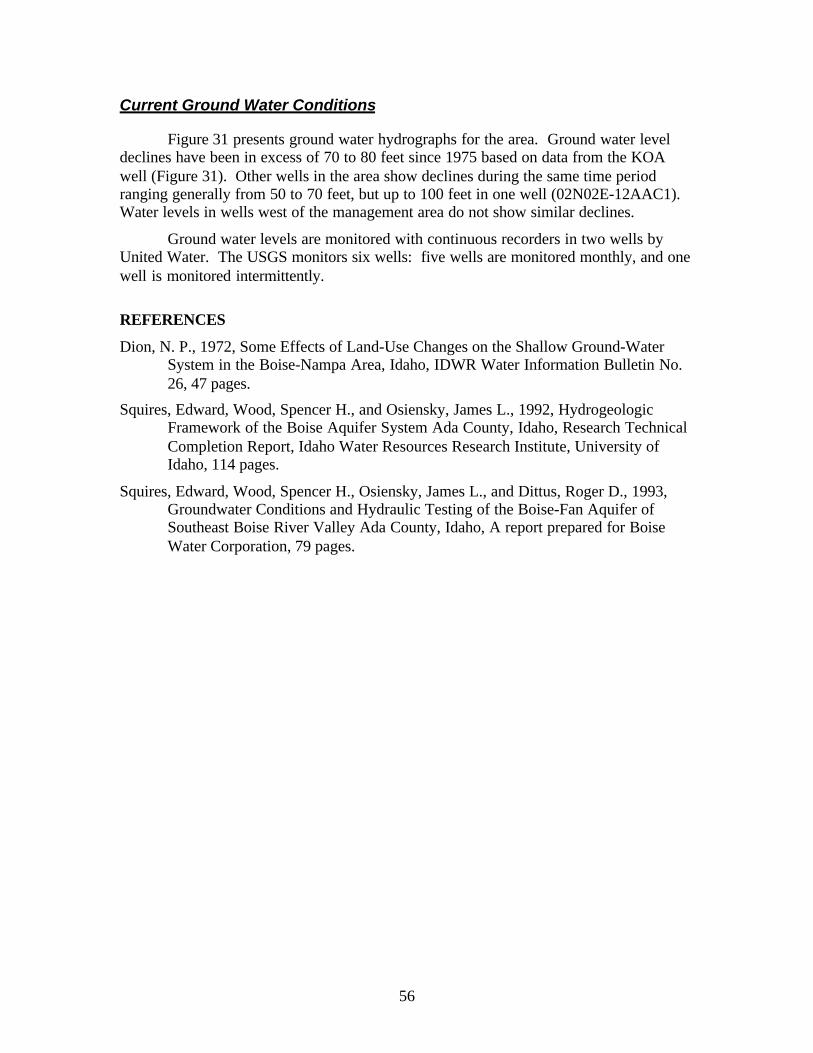
56
Current Ground Water Conditions
Figure 31 presents ground water hydrographs for the area. Ground water leveldeclines have been in excess of 70 to 80 feet since 1975 based on data from the KOAwell (Figure 31). Other wells in the area show declines during the same time periodranging generally from 50 to 70 feet, but up to 100 feet in one well (02N02E-12AAC1).Water levels in wells west of the management area do not show similar declines.
Ground water levels are monitored with continuous recorders in two wells byUnited Water. The USGS monitors six wells: five wells are monitored monthly, and onewell is monitored intermittently.
REFERENCES
Dion, N. P., 1972, Some Effects of Land-Use Changes on the Shallow Ground-WaterSystem in the Boise-Nampa Area, Idaho, IDWR Water Information Bulletin No.26, 47 pages.
Squires, Edward, Wood, Spencer H., and Osiensky, James L., 1992, HydrogeologicFramework of the Boise Aquifer System Ada County, Idaho, Research TechnicalCompletion Report, Idaho Water Resources Research Institute, University ofIdaho, 114 pages.
Squires, Edward, Wood, Spencer H., Osiensky, James L., and Dittus, Roger D., 1993,Groundwater Conditions and Hydraulic Testing of the Boise-Fan Aquifer ofSoutheast Boise River Valley Ada County, Idaho, A report prepared for BoiseWater Corporation, 79 pages.

� �� �
���
��
�
�
�
��
� �����
�����
���
���
������
������
��������
������
����� ����
������
�������
������
����������������� ������������������
���
� � � �� ��
!
��� ���"��#$%�&
�����'�(�)���*�)�%+&&

LEGEND
GROUND WATER HYDROGRAPHS
PREPARED BY THE IDAHO DEPARTMENT OF WATER RESOURCES 10/30/98 HH
I-84
2530
36 31 32
61
7 8
5 4
9
161718
12
13
R02E R03E
T03N
T02N
AMITY ROAD
MKRAIL
MICRON
SCALE
TD: 940OP: 246-940
EAST BOISE AVENUE TEST WELL
TD: 520OP: 420-520
KOA WELL
TD: 280OP: 232-242, 250-260
TD: 642OP: 605-615, 625-635
NOTE EXPANDED TIME SCALE
SOUTHEASTBOISEGROUND WATER MANAGEMENT AREA
TD: 522OP: 499-519
COLUMBIA TEST WELL
MICRON TEST WELLNOTE EXPANDED TIME SCALE
TD: 503OP: 417-496, 502-503
NOTE EXPANDED TIME SCALE
NOTE EXPANDED TIME SCALE
TD: 802OP: 560-575, 628-638, 711-731
TD: 855OP: 609-639, 770-775, 820-825, 830-845
Monitoring: USGS monthly Monitoring: USGS monthly
Monitoring: United Water continuous recorder
Monitoring: USGS monthly
Monitoring: USGS monthly
Monitoring: USGS monthlyMonitoring: USGS intermittently Monitoring: United Water continuous recorder
TD: TOTAL DEPTHOP: INTERVAL AT WHICH THE WELL IS PERFORMATED OR OPEN TO THE AQUIFERWATER BEARING FORMATIONNA: NOT AVAILABLE- - -: MORE THAN 1 YEAR BETWEEN DATA POINTS LEFT SIDE: DEPTH TO WATERRIGHT SIDE: WATER ELEVATIONBASE: YEARALL MEASUREMENTS IN FEET
FIGURE 31

59
TWIN FALLS GROUND WATER MANAGEMENT AREA
Overview of Current Management Status
The Twin Falls GWMA is located in Twin Falls County in southern Idaho (Figure32). The Twin Falls GWMA was established on January 11, 1984, based on concern thatthe thermal system was approaching a critical condition evident by declining pressuresand well interference may occur. The order specifically excluded the Banbury HotSprings GWMA.
A moratorium on new geothermal development was established on July 24, 1987,for a limited area within the GWMA. The moratorium was extended in 1992 and againin 1997 because equilibrium had not been established in the geothermal system. Amanagement plan has not been developed nor has an advisory committee been formed.
Hydrogeology
Both cold and geothermal aquifers occur in the area; however, the Twin FallsGWMA covers only the geothermal aquifer. The geothermal aquifer occurs in theIdavada Volcanics with upward ground water movement into the overlying BanburyBasalt. Water temperatures range from 68 to 111 F° (Lewis and Young, 1989).
Ground water flow direction is northwest (Lewis and Young 1989). Recharge isbelieved to come from the mountains to the south. A conceptual model of the geothermalaquifer developed by Street and DeTar (1987) described a hydrologic connection with theBanbury geothermal aquifer, although it appears to be poorly understood.
Current Ground Water Conditions
Figure33 presents ground water hydrographs for the areas. In 1990, Baker andCastelin concluded that an equilibrium has occurred between recharge and discharge inthe geothermal system. However, water level declines occurred in most wells in the early1990s, the result of increased pumpage. The USGS Filer Test well (09S16E-20ADD1) isused as an indicator of conditions in the Twin Falls and Banbury geothermal system.Major declines in shut-in pressures in the Filer Test well in the early 1990s have ceased(Neely, 1998). Annual production by geothermal users appears to have stabilized.However, it is not conclusive whether water conditions have stabilized.
A monitoring program was developed when the Twin Falls GWMA wasestablished. USGS, IDWR, and users have collected data since 1984. USGS monitoringwas discontinued in 1994. IDWR-Southern Region has been collecting monthly datasince 1994 at three wells. The College of Southern Idaho submits monthly monitoringdata to IDWR for its two geothermal production wells.

60
REFERENCES
Baker, Steven J., and Paul M. Castelin, 1990, Geothermal Resource Analysis in TwinFalls County, Idaho, Part 2, IDWR Water Information Bulletin No. 30, Part 16, 36pages.
Lewis R. E., and H. W. Young, 1989, The Hydrothermal System in Central Twin FallsCounty, Idaho, USGS Water-Resources Investigations Report 88-4152, 44 pages.
Neely, Ken, 1998, Memo to Tim Luke, Subject: Twin Falls Geothermal, dated May 22,1998, IDWR Internal Memo, 6 pages.
Street, Leah V., and Robert E. DeTar, 1987, Geothermal Resource Analysis in Twin FallsCounty, Idaho, IDWR Water Information Bulletin No. 30, Part 15, 46 pages.
�
� �
�
���������
���� �����������
����������� ���������
���
� � � � �����
���������������������
���� �������
���
� �
�!�
����
����
�����
�������
��������
������ �
������ �
�����
��������
"# ���$%���&'�(
������
��
���
����
���
����
��� ���� �����������
�����
��
�������������
� ������������
����������
���
����
�� !"�#$"�
�����
���� ����������) *���� � �����*�+��
��� �� ,��-�"��-�(.!!
/

Banbury Hot Springs GWMA boundary
8493
30
Jerome
Kimberly
Twin FallsFiler
Castleford
Buhl
R13E R14E R15E R16E R17E R18E
T8S
T9S
T10S
TWIN FALLS GROUND WATER MANAGEMENT AREAGround Water Hydrographs
TD: TOTAL DEPTH - - - : MORE THAN 1 YEAROP: INTERVAL AT WHICH THE WELL BETWEEN DATA POINTS IS PERFORATED OR OPEN TO LEFT SIDE: DEPTH TO WATER THE AQUIFER RIGHT SIDE: WATER ELEVATIONWATER BEARING FORMATION BASE: YEAR NA: NOT AVAILABLE ALL MEASUREMENTS IN FEET
Prepared by Idaho Department of Water Resources 1/99 HH
TD: 1423OP: 621-1420Monitoring discontinued 1989
CRYSTAL SPRINGS WELL
Note Expanded Scale
TD: 1247OP: 735-1247Monitoring: USGS monthly
FILER TEST WELLNote Expanded Scale
TD: 1450OP: 1200-1450Monitoring discontinued 1995
NAZARENE CHURCH WELL
TWIN FALLSHIGH SCHOOL WELL
TD: 1700OP: 900-1700
Monitoring: IDWR quarterly
LEGEND
COLLEGE OF SOUTHERN IDAHO (#2)
Monitoring: CSI ??
Data will be updatedthrough 1998 infinal version
0 1 2 3Miles
FIGURE 33