Embed Size (px)
Citation preview

Production WheelHow rhythm can harmonize production processes
Arthur Nazarian
21 February 2019
Why Production Wheels
– Terminology: “Production Wheel”, “Product Wheel” or ”Rhythm Wheel”– Comprehensive and easy-to-follow framework for production planning & scheduling– Addresses three major challenges of operations managers:
1. Follow demand vs level production2. How long to make a production cycle3. Production scheduling
2
3
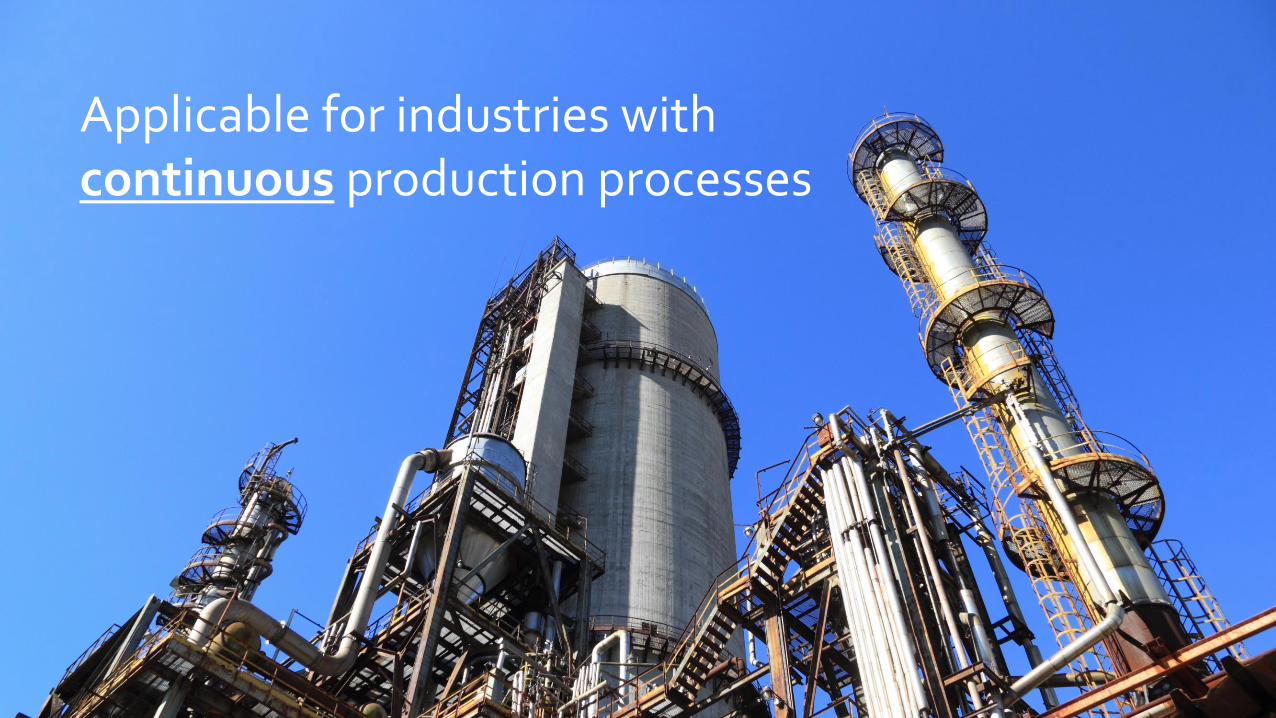
Applicable for industries with continuous production processes

Agenda
• The three challenges
• Methodology
• Conclusion
4
Follow Demand vs Level Productiona.k.a. “Takt vs Heijunka”
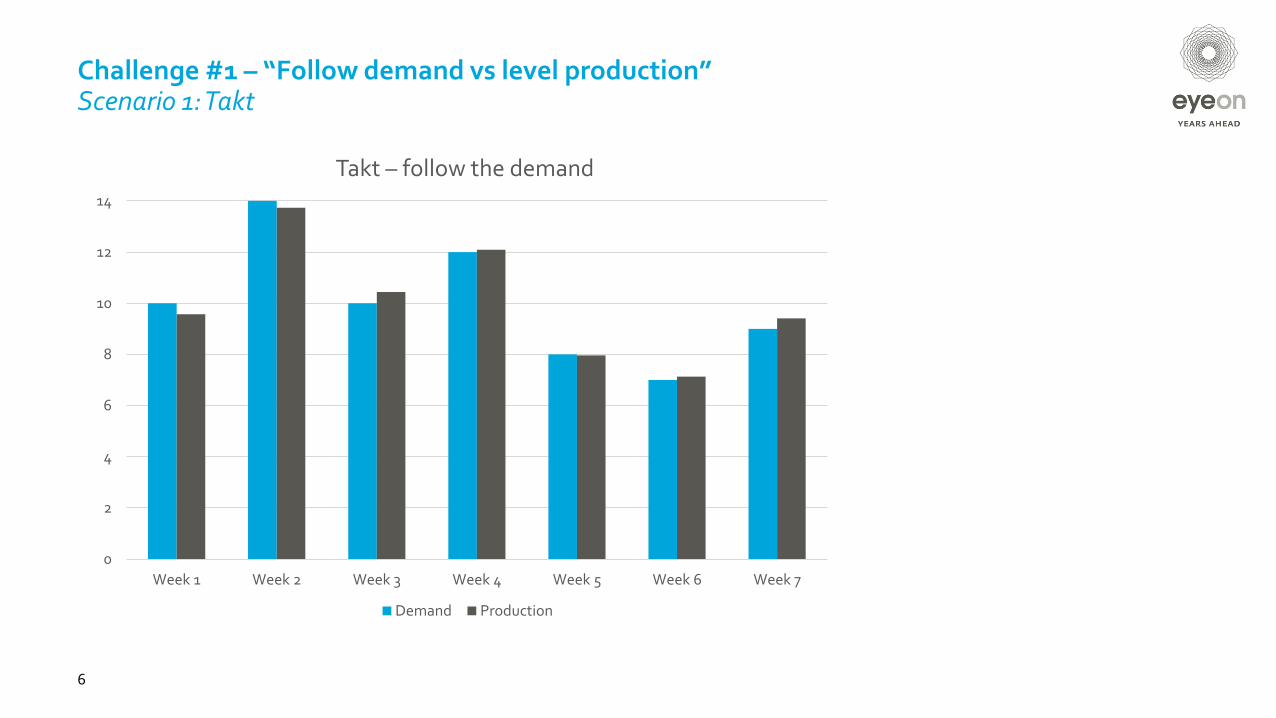
Challenge #1 – “Follow demand vs level production”Scenario 1: Takt
6
0
2
4
6
8
10
12
14
Week 1 Week 2 Week 3 Week 4 Week 5 Week 6 Week 7
Takt – follow the demand
Demand Production
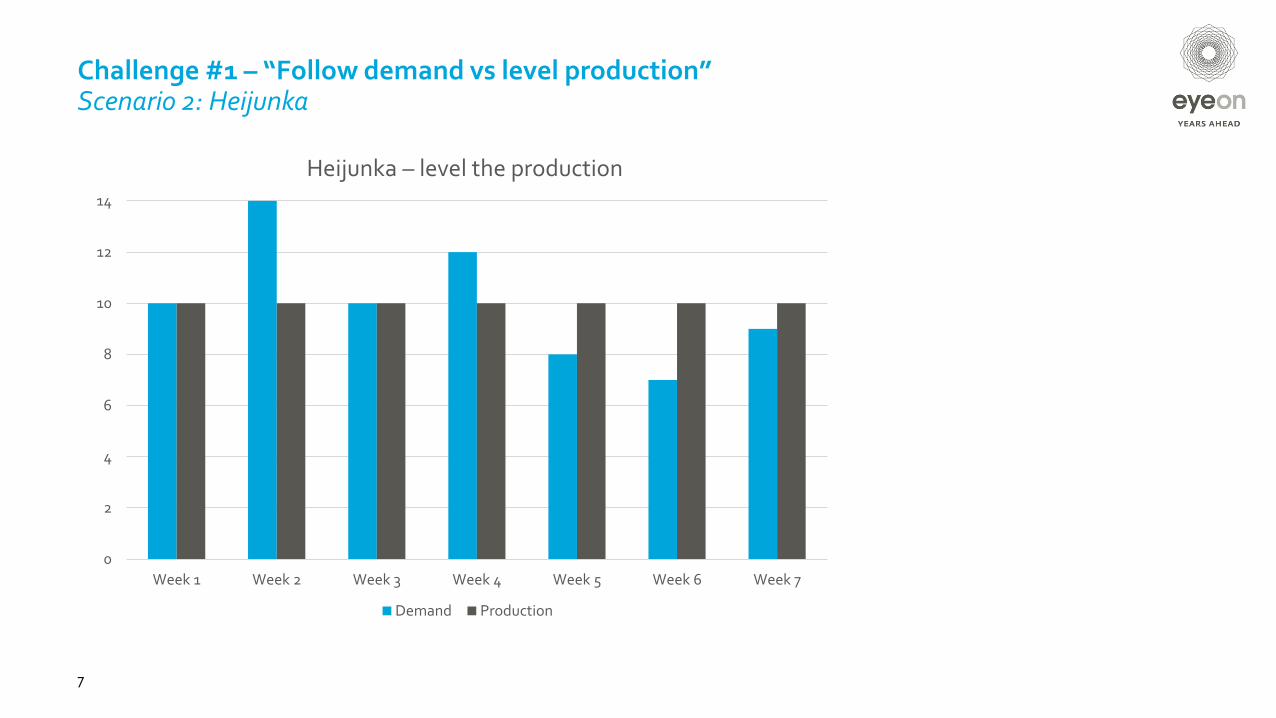
Challenge #1 – “Follow demand vs level production”Scenario 2: Heijunka
7
0
2
4
6
8
10
12
14
Week 1 Week 2 Week 3 Week 4 Week 5 Week 6 Week 7
Heijunka – level the production
Demand Production

Challenge #1 – “Follow demand vs level production”Scenario 1: Takt
8
0
2
4
6
8
10
12
14
Week 1 Week 2 Week 3 Week 4 Week 5 Week 6 Week 7
Takt – follow the demand
Demand Production
✓Minimal overproduction/excess in inventory
✗Resources need to match peak demand → resources wasted during “valleys”
✗Lot of effort on repetitive basis:
forecasts important
flexible production capabilities
continuous planning process
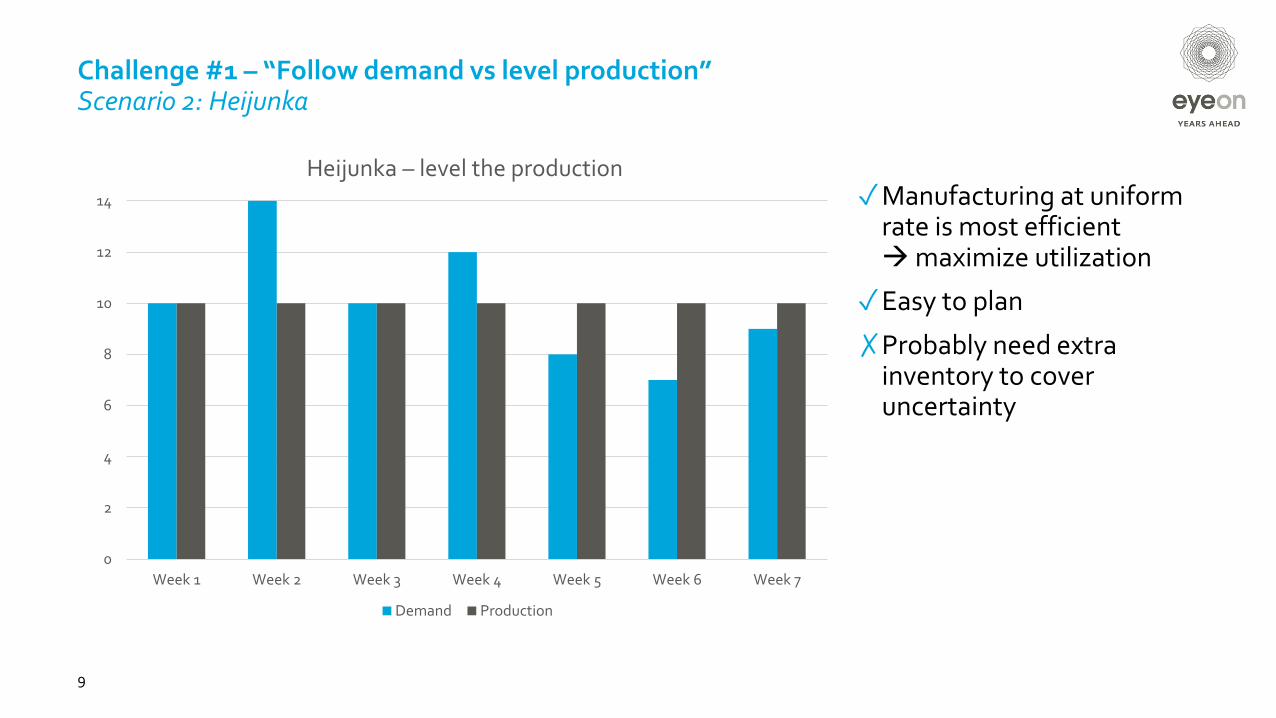
Challenge #1 – “Follow demand vs level production”Scenario 2: Heijunka
9
0
2
4
6
8
10
12
14
Week 1 Week 2 Week 3 Week 4 Week 5 Week 6 Week 7
Heijunka – level the production
Demand Production
✓Manufacturing at uniform rate is most efficient→maximize utilization
✓Easy to plan
✗Probably need extra inventory to cover uncertainty

10
Conflicting goals #1
Heijunka !Takt !
Determining the Wheel Timea.k.a. “How long to make a production cycle”
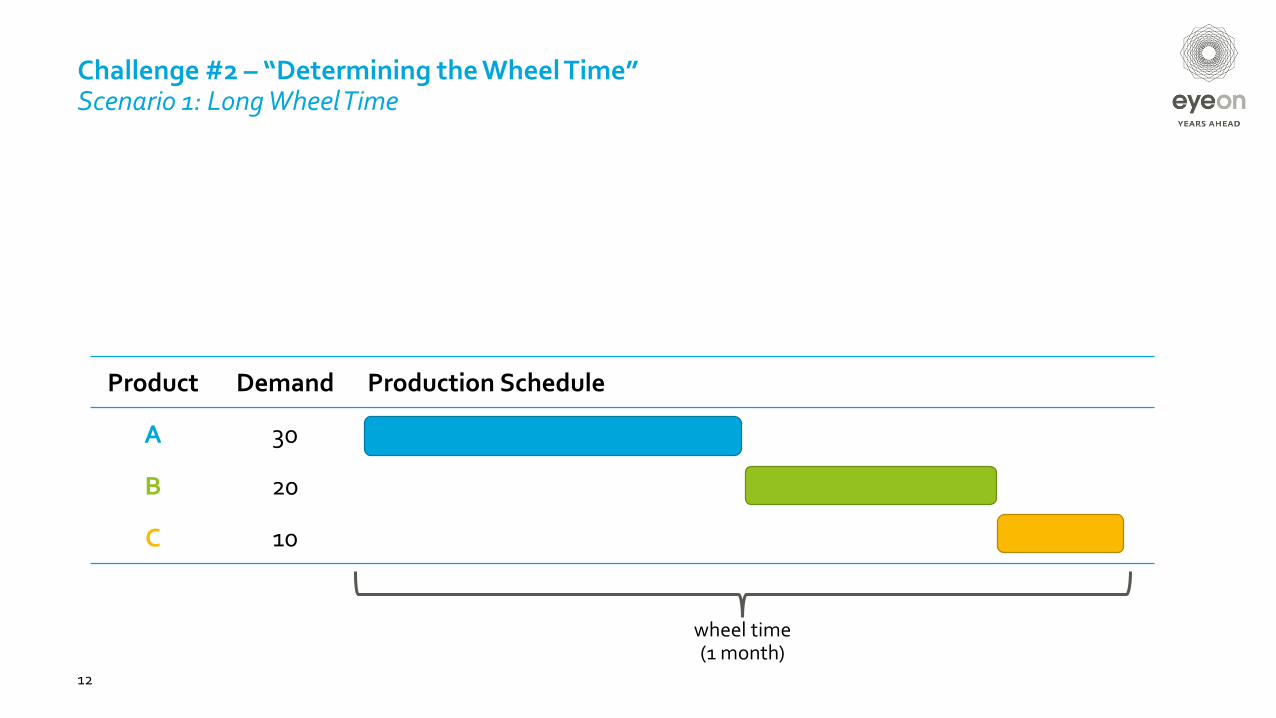
Challenge #2 – “Determining the Wheel Time”Scenario 1: Long Wheel Time
12
Product Demand Production Schedule
A 30
B 20
C 10
wheel time(1 month)
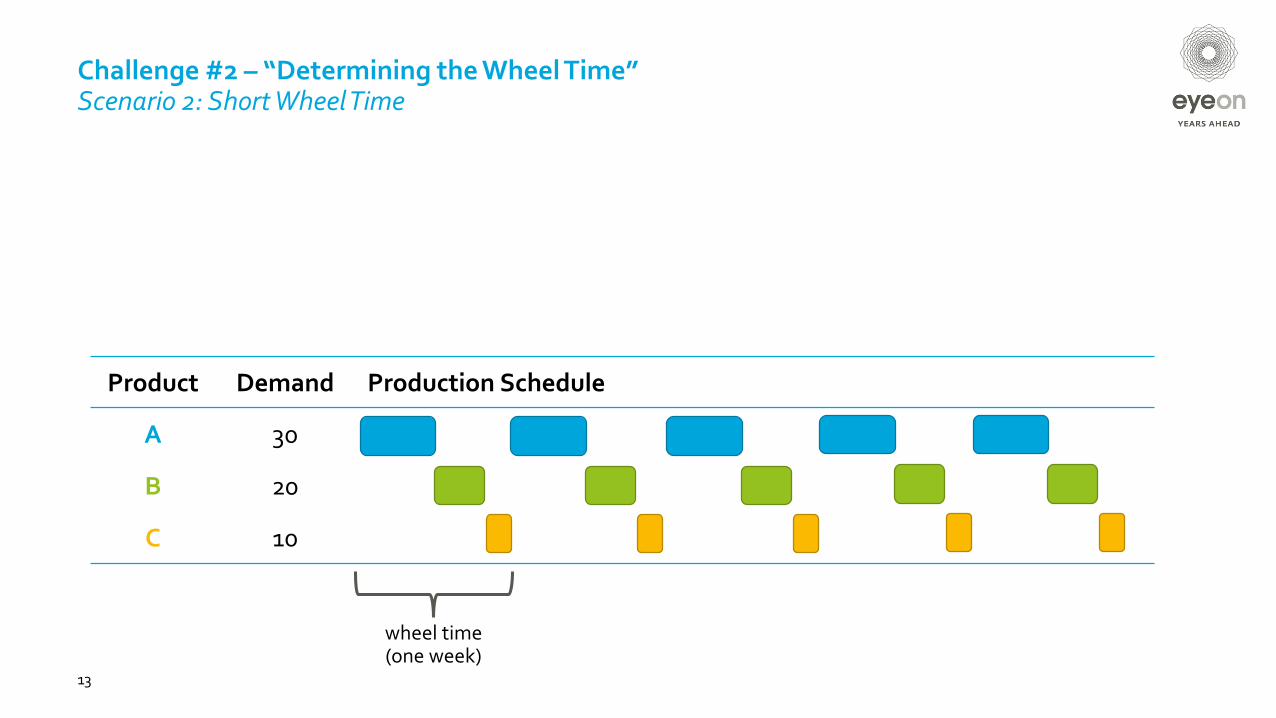
Product Demand Production Schedule
A 30
B 20
C 10
wheel time (one week)
13
Challenge #2 – “Determining the Wheel Time”Scenario 2: Short Wheel Time
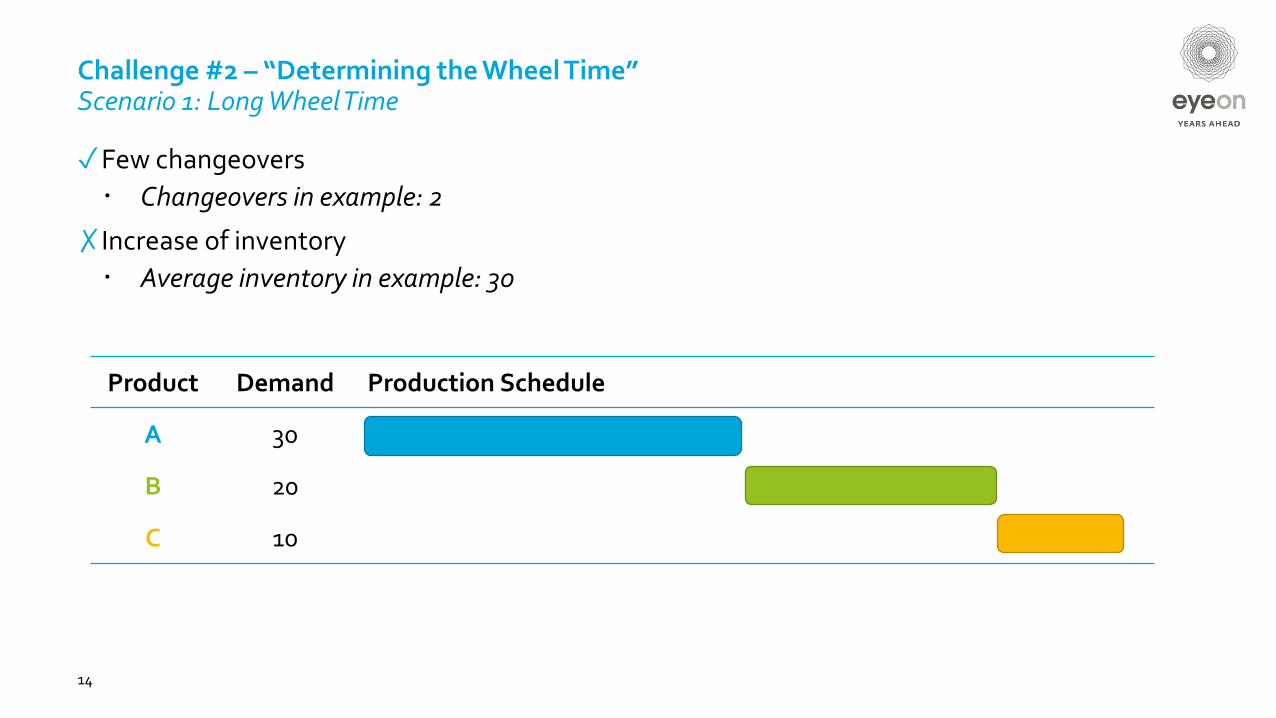
Challenge #2 – “Determining the Wheel Time”Scenario 1: Long Wheel Time
✓Few changeovers
Changeovers in example: 2
✗Increase of inventory
Average inventory in example: 30
14
Product Demand Production Schedule
A 30
B 20
C 10
Product Demand Production Schedule
A 30
B 20
C 10
15
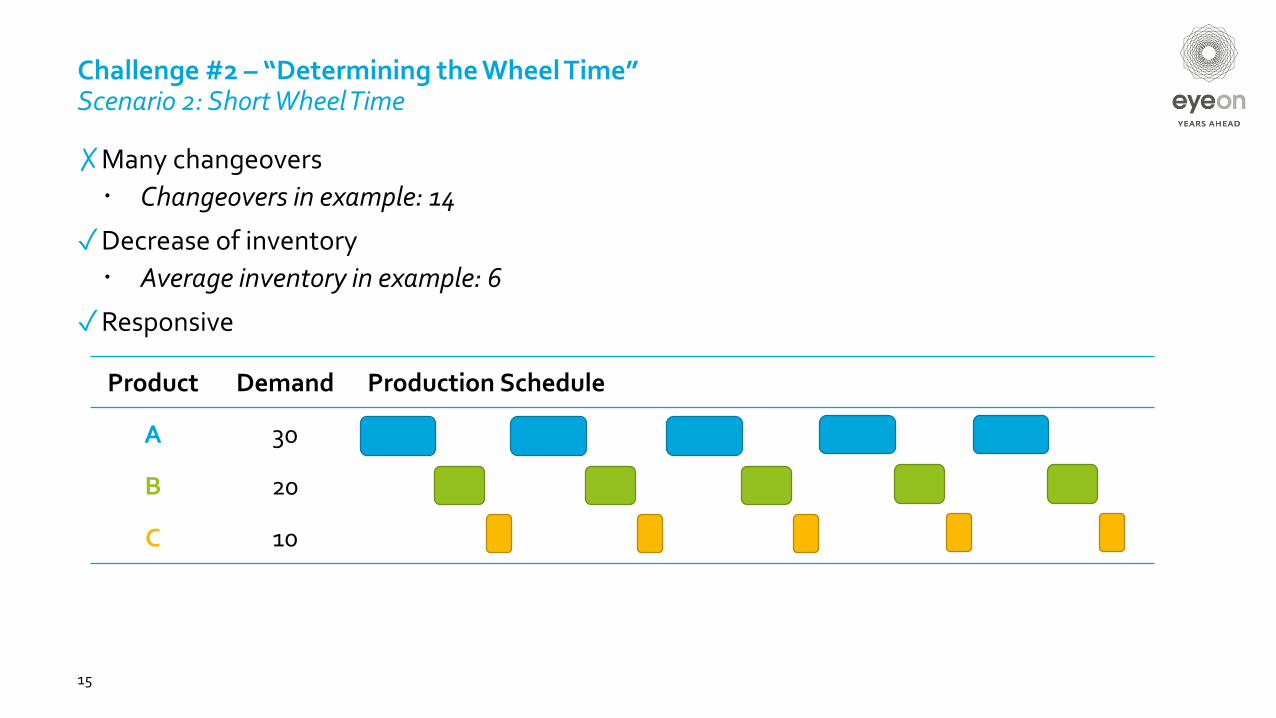
✗Many changeovers
Changeovers in example: 14
✓Decrease of inventory
Average inventory in example: 6
✓Responsive
Challenge #2 – “Determining the Wheel Time”Scenario 2: Short Wheel Time
16
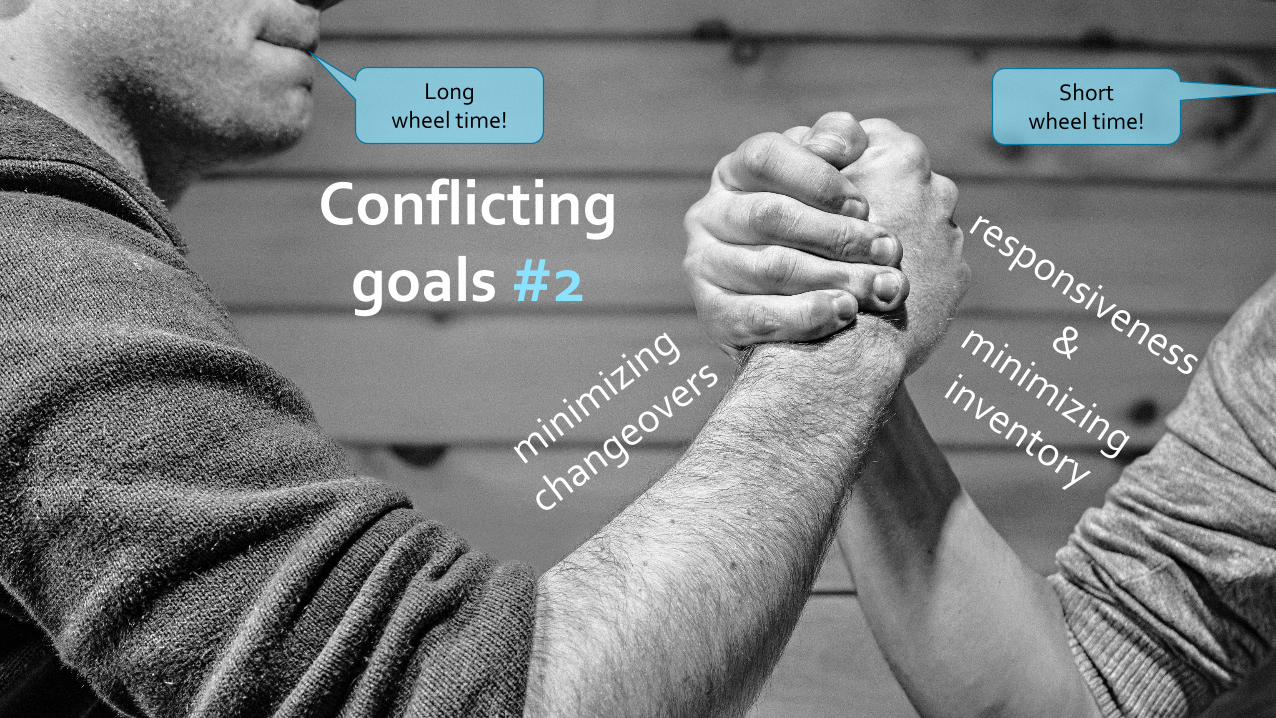
Shortwheel time!
Longwheel time!
Conflicting goals #2
Production Schedulinga.k.a. “In what order to produce the products”

produceWhite after Black?
Does the sequence of production impact
results?
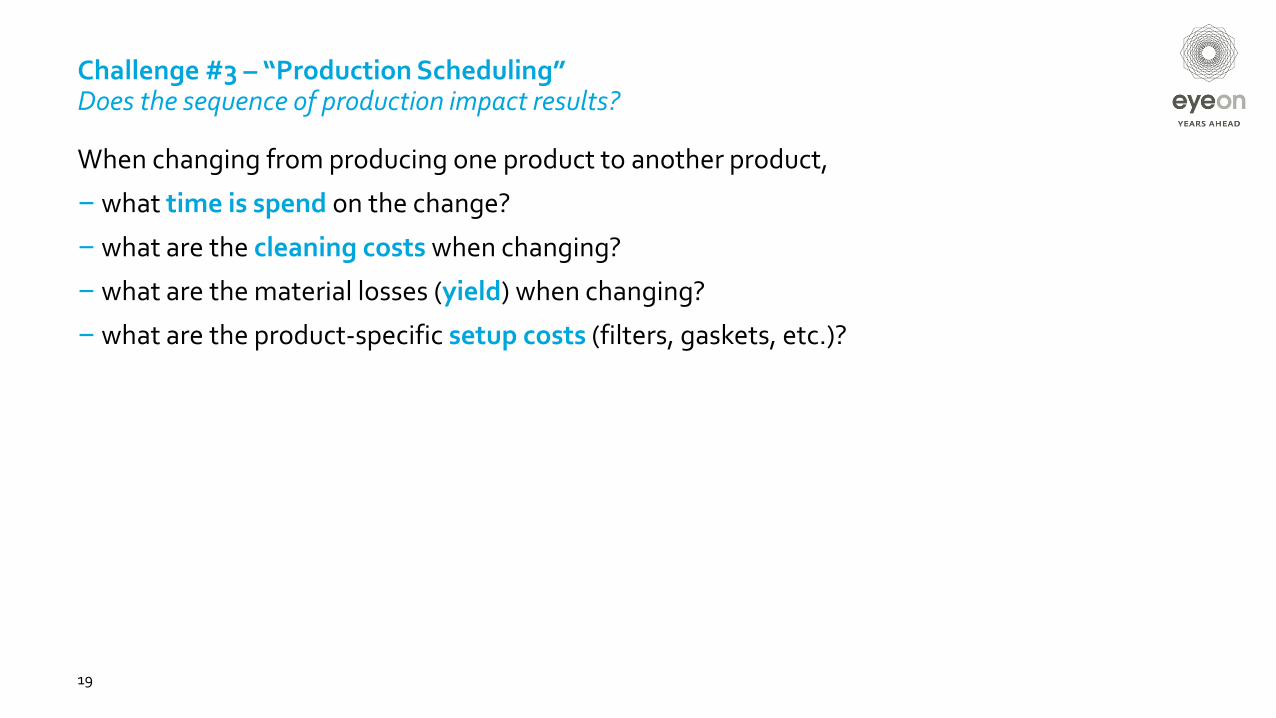
Challenge #3 – “Production Scheduling”Does the sequence of production impact results?
When changing from producing one product to another product,
–what time is spend on the change?
–what are the cleaning costs when changing?
–what are the material losses (yield) when changing?
–what are the product-specific setup costs (filters, gaskets, etc.)?
19
20
0
10
20
30
40
50
60
70
80
90
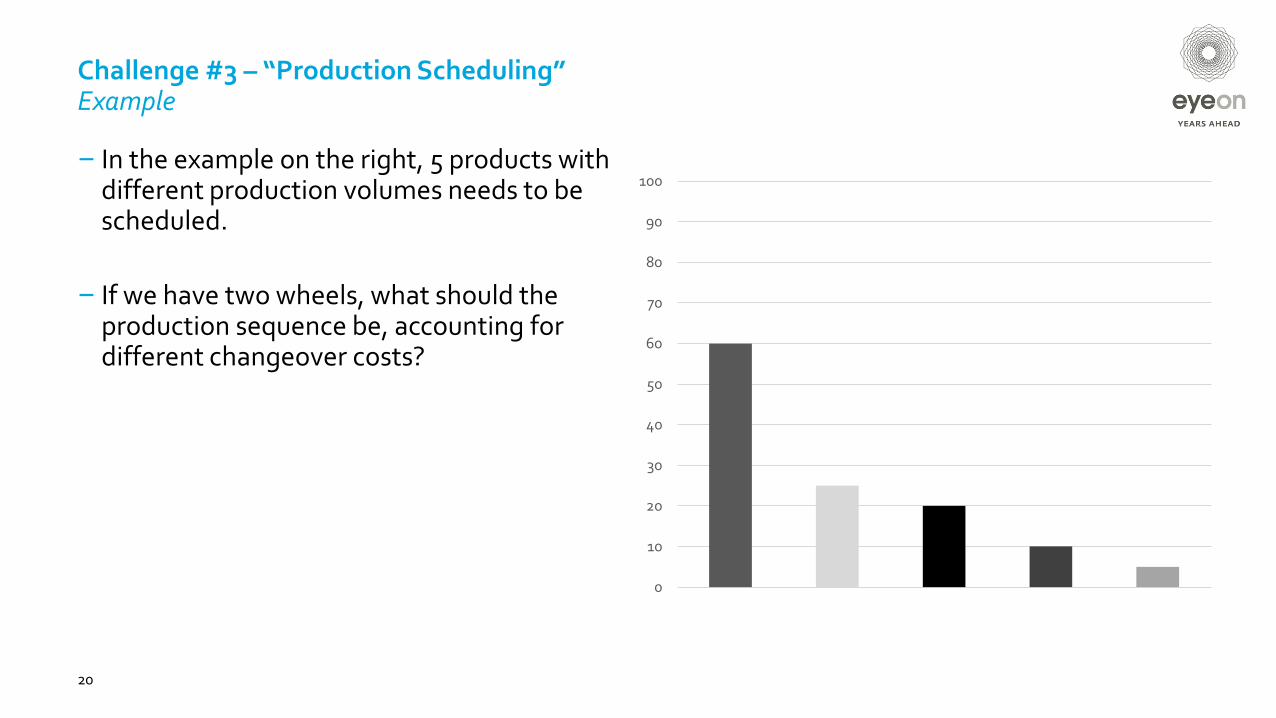
100– In the example on the right, 5 products with
different production volumes needs to be scheduled.
– If we have two wheels, what should the production sequence be, accounting for different changeover costs?
Challenge #3 – “Production Scheduling”Example
21
0
10
20
30
40
50
60
70
80
90
100
Wheel 1 Wheel 2
Product A Product B Product C Product D Product E
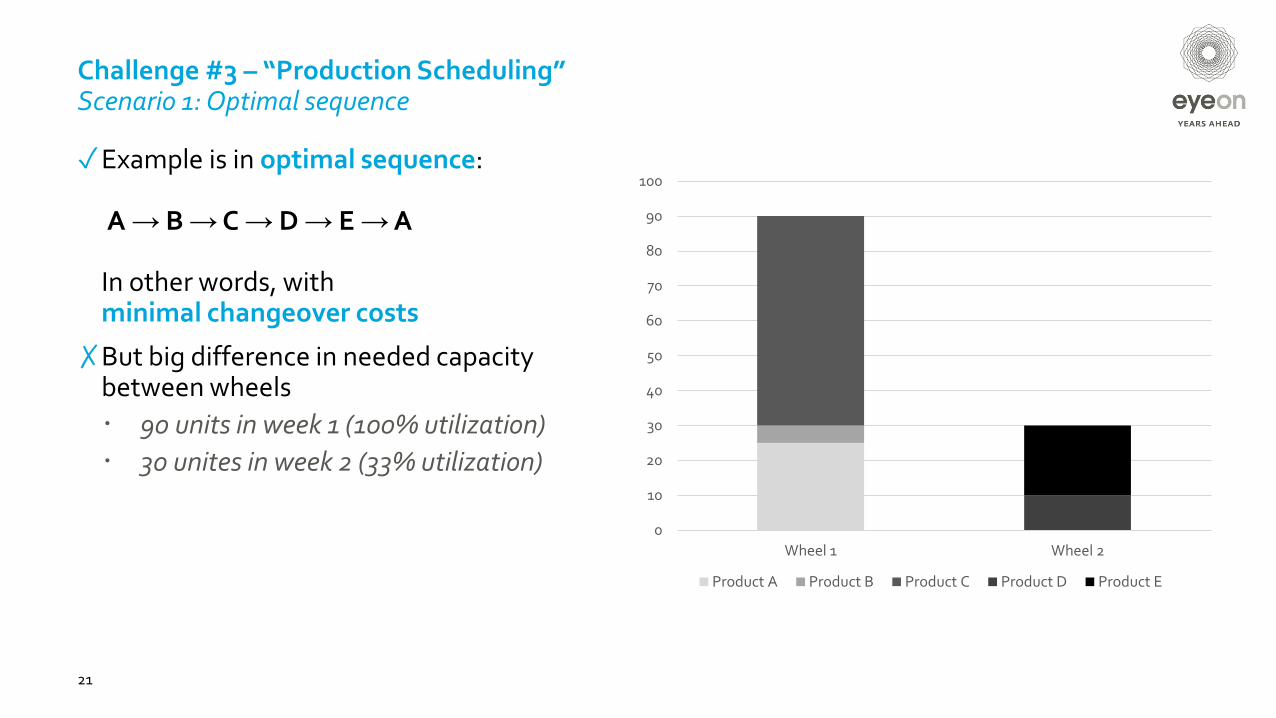
✓Example is in optimal sequence:
A → B →C → D → E →A
In other words, withminimal changeover costs
✗But big difference in needed capacity between wheels
90 units in week 1 (100% utilization)
30 unites in week 2 (33% utilization)
Challenge #3 – “Production Scheduling”Scenario 1: Optimal sequence
22
0
10
20
30
40
50
60
70
80
90
100
Wheel 1 Wheel 2
Product A Product B Product C Product D Product E
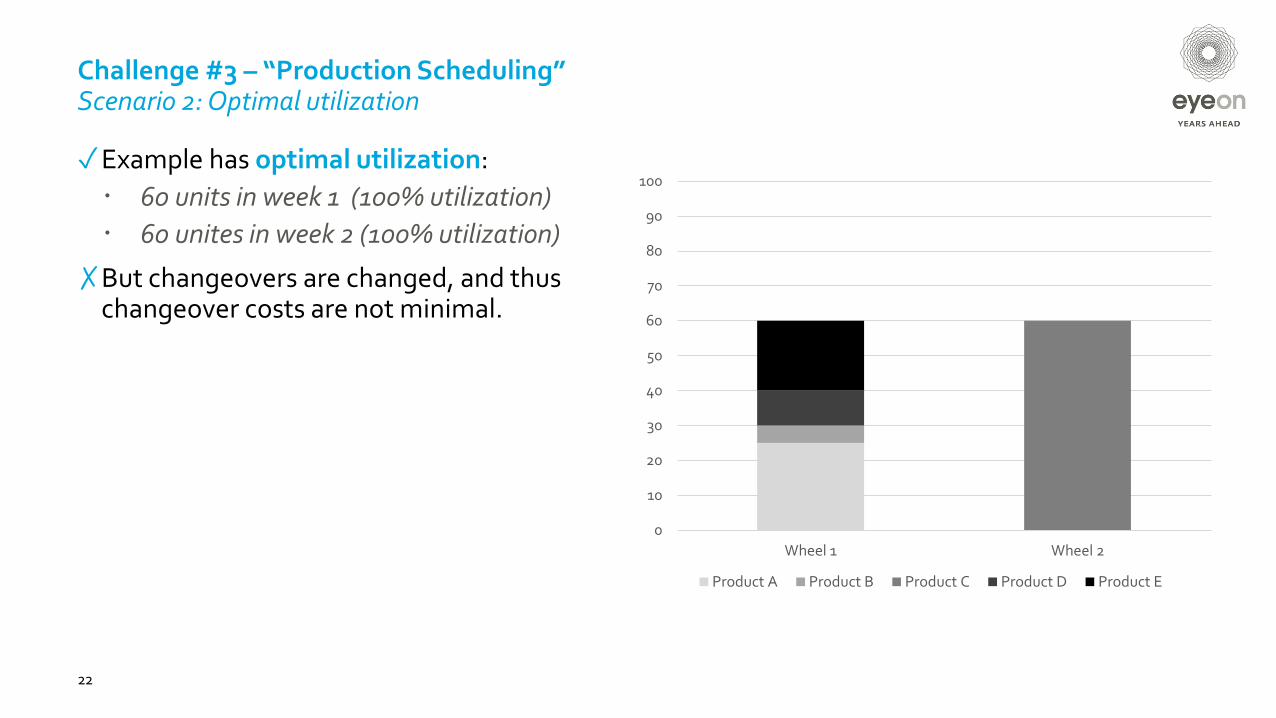
Challenge #3 – “Production Scheduling”Scenario 2: Optimal utilization
✓Example has optimal utilization:
60 units in week 1 (100% utilization)
60 unites in week 2 (100% utilization)
✗But changeovers are changed, and thus changeover costs are not minimal.
23
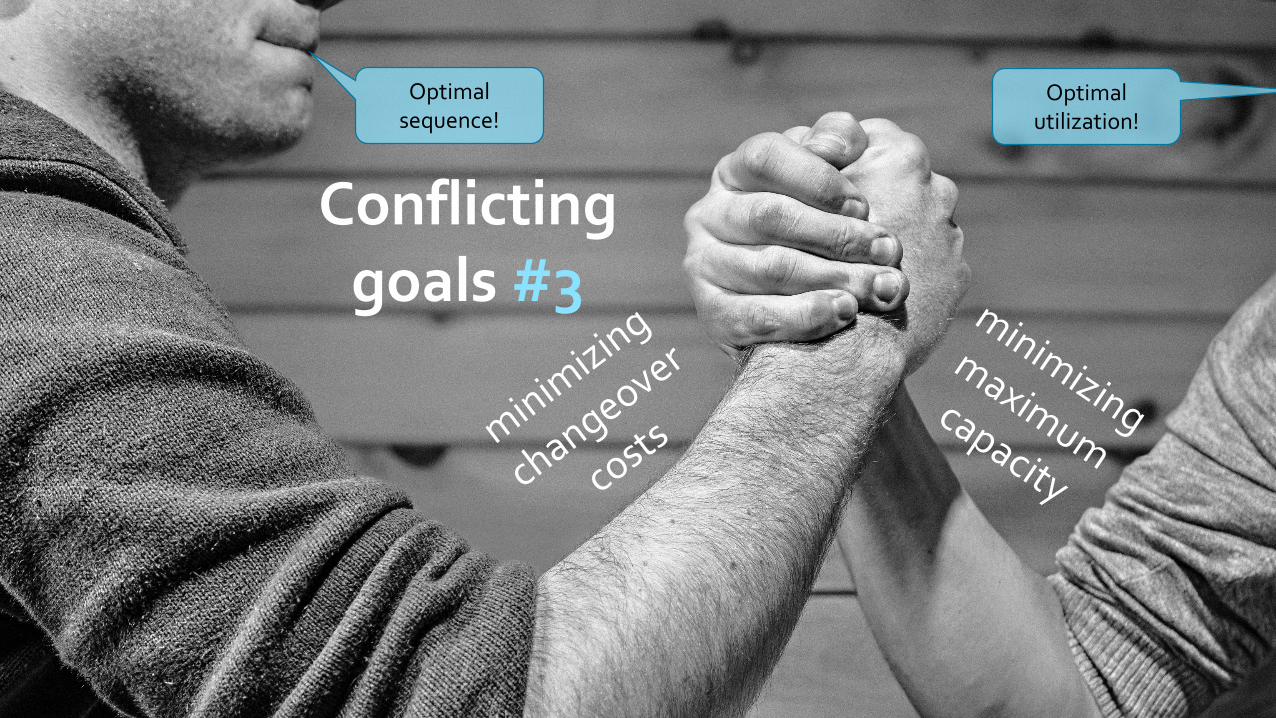
Optimalutilization!
Optimal sequence!
Conflicting goals #3

EyeOn’s Methodology
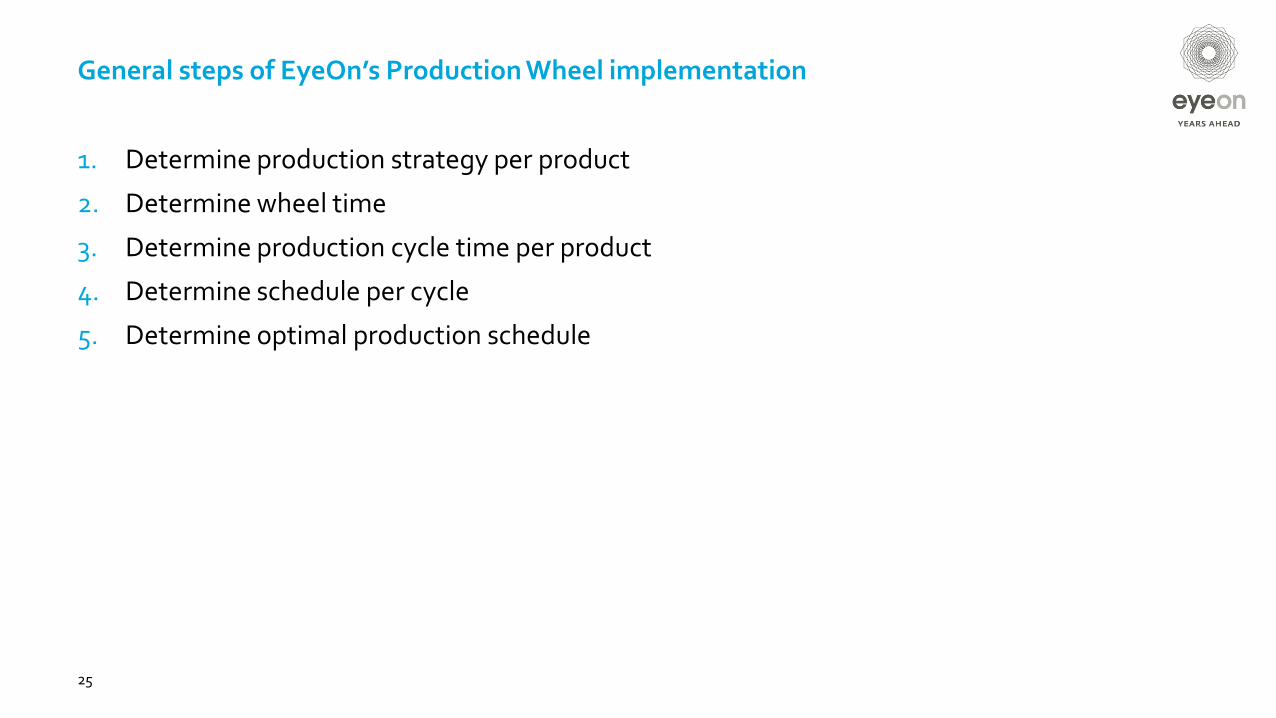
General steps of EyeOn’s Production Wheel implementation
1. Determine production strategy per product
2. Determine wheel time
3. Determine production cycle time per product
4. Determine schedule per cycle
5. Determine optimal production schedule
25
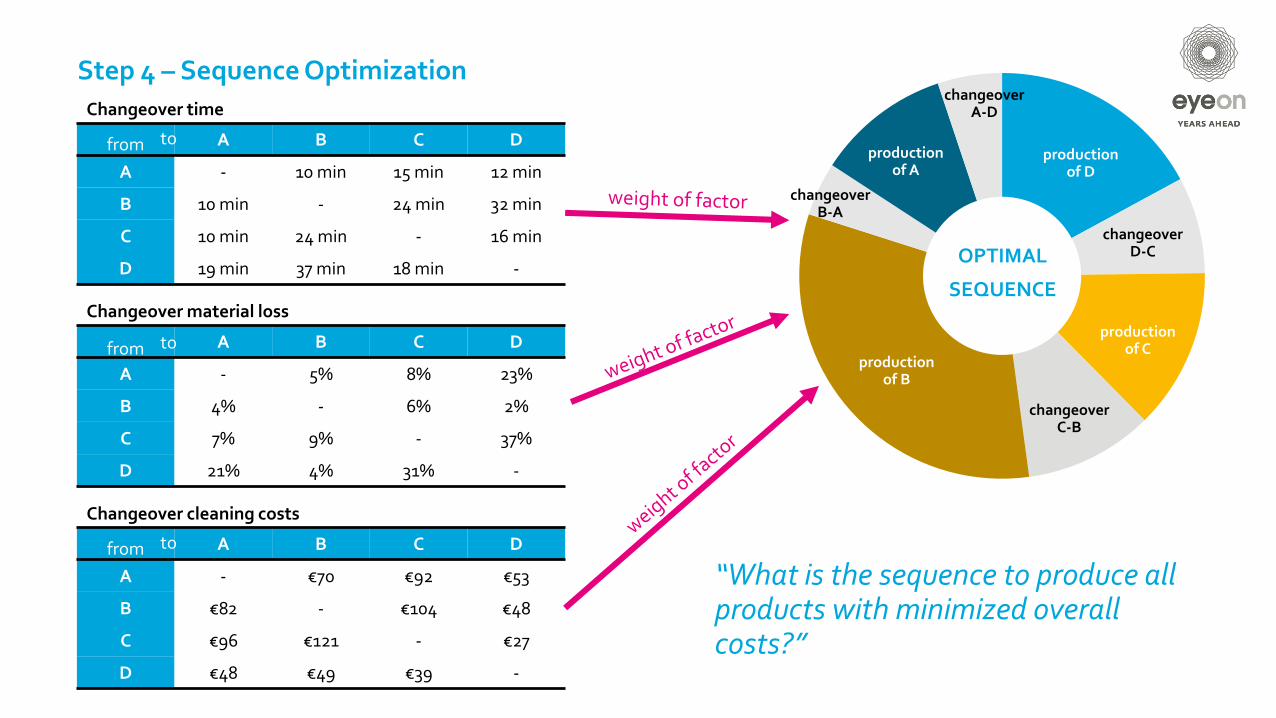
Step 4 – Sequence Optimization
A B C D
A - 10 min 15 min 12 min
B 10 min - 24 min 32 min
C 10 min 24 min - 16 min
D 19 min 37 min 18 min -
Changeover time
from to
A B C D
A - 5% 8% 23%
B 4% - 6% 2%
C 7% 9% - 37%
D 21% 4% 31% -
Changeover material loss
from to
A B C D
A - €70 €92 €53
B €82 - €104 €48
C €96 €121 - €27
D €48 €49 €39 -
Changeover cleaning costs
from to
productionof D
productionof C
productionof B
productionof A
changeoverD-C
changeoverC-B
changeoverB-A
changeoverA-D
“What is the sequence to produce all products with minimized overall costs?”
OPTIMAL
SEQUENCE
MTS1
MTO + MTSt
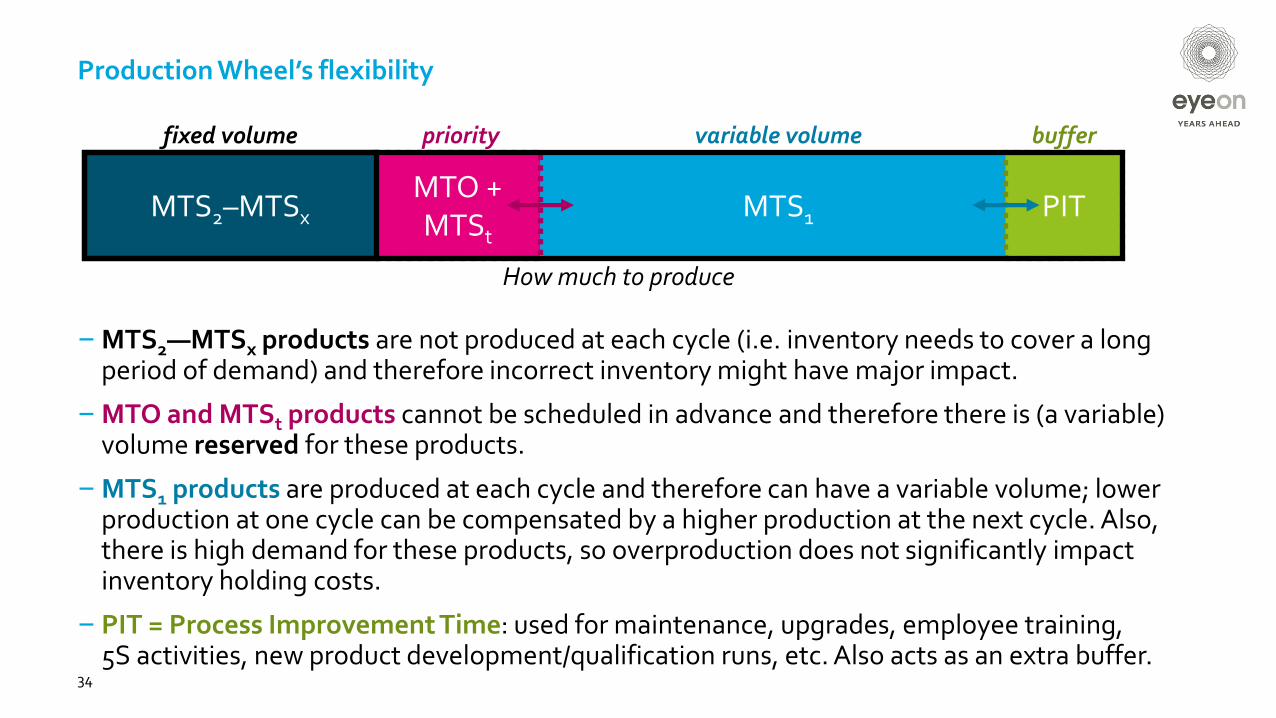
Production Wheel’s flexibility
34
MTS2–MTSx PIT
fixed volume priority variable volume buffer
–MTS2—MTSx products are not produced at each cycle (i.e. inventory needs to cover a long period of demand) and therefore incorrect inventory might have major impact.
–MTO and MTSt products cannot be scheduled in advance and therefore there is (a variable) volume reserved for these products.
–MTS1 products are produced at each cycle and therefore can have a variable volume; lower production at one cycle can be compensated by a higher production at the next cycle. Also, there is high demand for these products, so overproduction does not significantly impact inventory holding costs.
– PIT = Process Improvement Time: used for maintenance, upgrades, employee training,5S activities, new product development/qualification runs, etc. Also acts as an extra buffer.
How much to produce
MTS1
MTO + MTSt
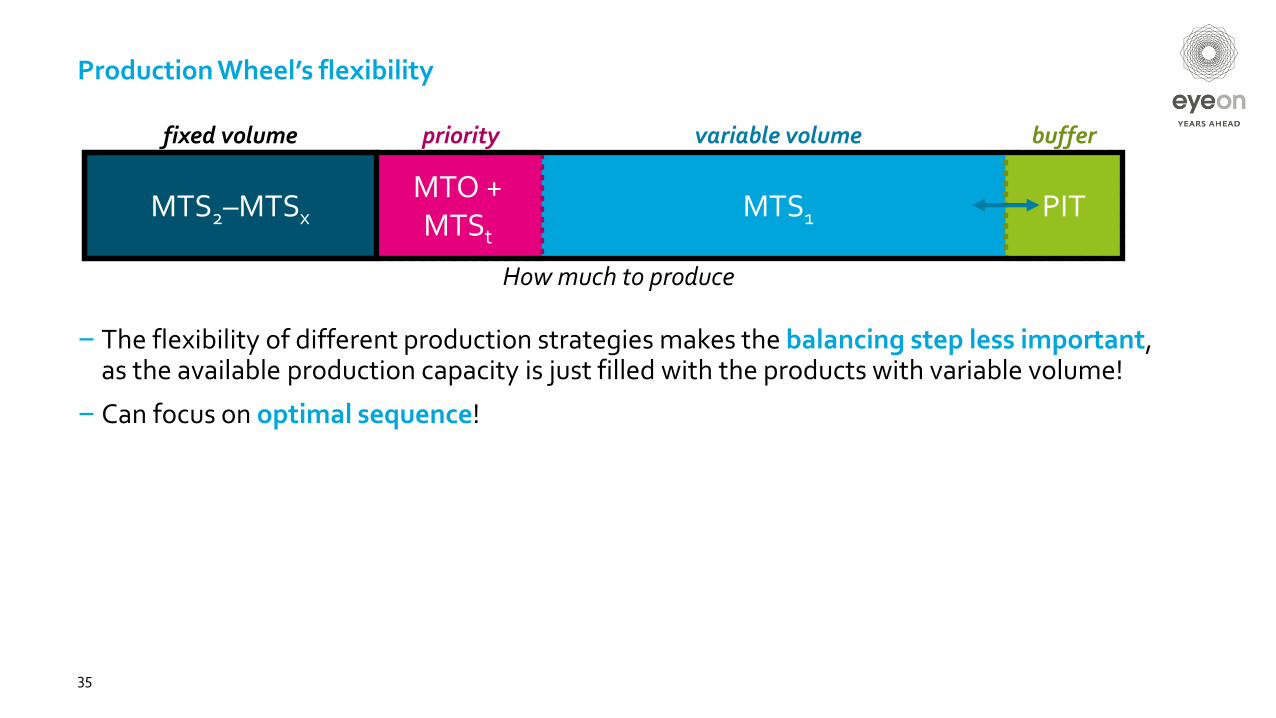
Production Wheel’s flexibility
35
MTS2–MTSx PIT
fixed volume priority variable volume buffer
– The flexibility of different production strategies makes the balancing step less important,as the available production capacity is just filled with the products with variable volume!
– Can focus on optimal sequence!
How much to produce

Conclusion

37
Conflicting goals #1
Heijunka !Takt !
38
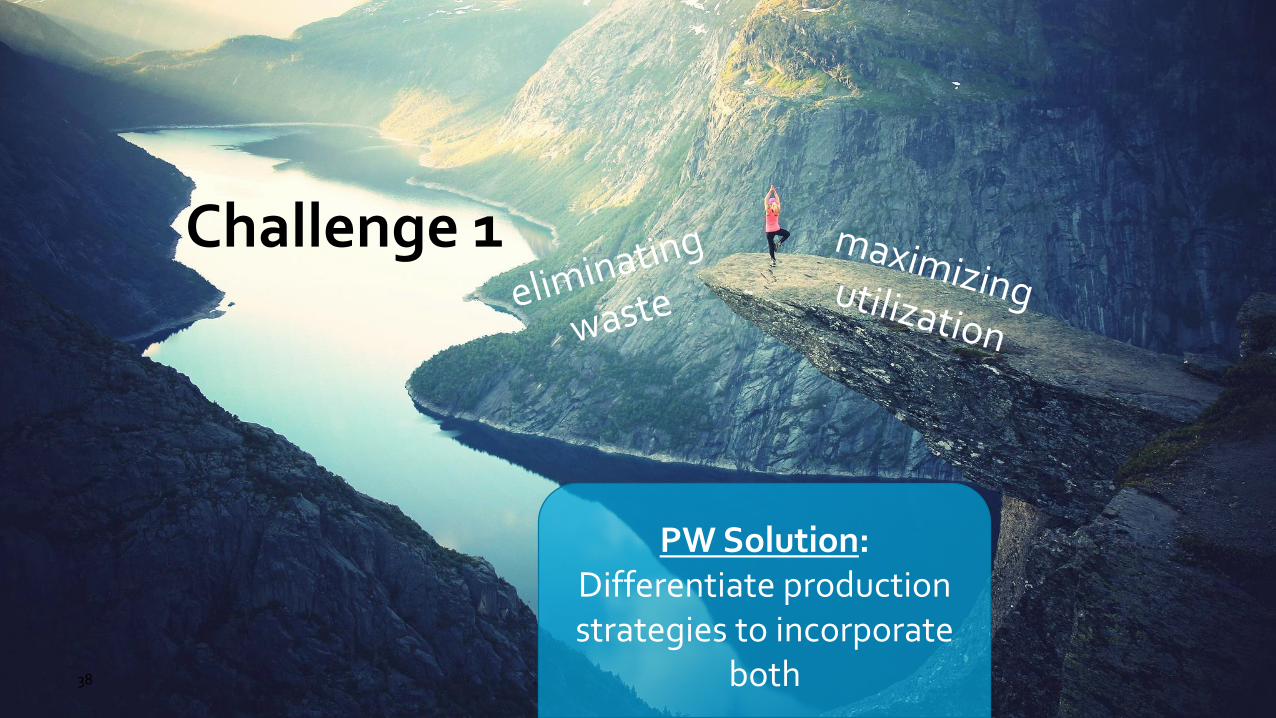
Challenge 1
PW Solution:Differentiate production strategies to incorporate
both

39
Shortwheel time!
Longwheel time!
Conflicting goals #2

40
Challenge 2
PW Solution:Determine best wheel
time and then optimize changeovers

41
Optimalutilization!
Optimal sequence!
Conflicting goals #3
42
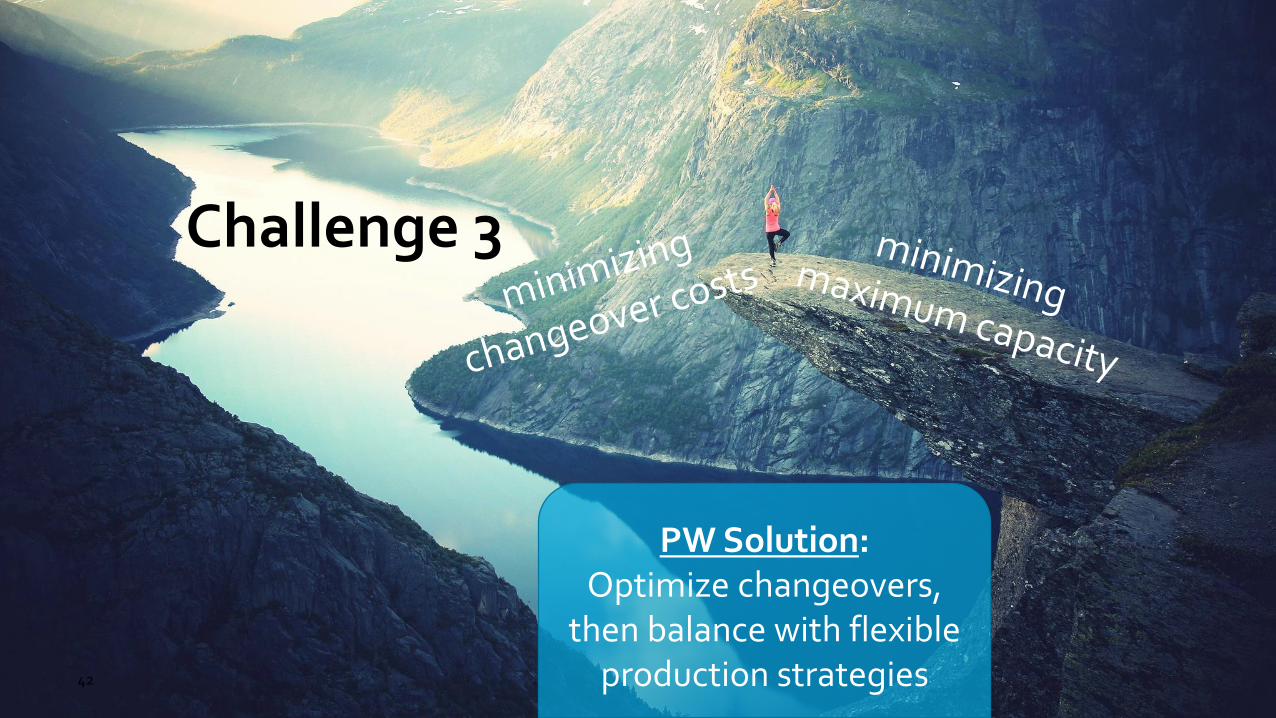
Challenge 3
PW Solution:Optimize changeovers,
then balance with flexible production strategies
Production Wheel takeaways
– Addresses most challenges in a comprehensive holistic fashion
– Production planning in cycles– Differentiated production strategies: both strict and flexible schedules – Balanced capacity utilization– Reduced changeover costs & inventory costs– Differentiated and improved service levels
– Intuitive planning tool
43

44
Predictable planning& performance
Focus on irregularities & improvements

EyeOn bvCroylaan 145735 PC Aarle-RixtelThe NetherlandsT +31 492 38 88 [email protected]
EyeOn AmsterdamHerengracht 124-1281015 BT AmsterdamThe NetherlandsT +31 492 38 88 [email protected]
EyeOn Belgium BVBADe Keyserlei 58-60 B19B-2018 AntwerpBelgiumT +32 (0)3 304 95 [email protected]
EyeOn SolutionsCroylaan 145735 PC Aarle-RixtelThe NetherlandsT +31 492 38 88 [email protected]
EyeOn Forecast ServicesCroylaan 145735 PC Aarle-RixtelThe NetherlandsT +31 492 38 88 [email protected]
EyeOn SwitzerlandAeschenvorstadt 71CH-4051 BaselSwitzerlandT +41 61 225 42 [email protected]
Arthur Nazarian+31(0) 88 88 300 45