Embed Size (px)
Citation preview
MINISTRY OF PUBLIC WORKS THE REPUBLIC OF LIBERIA
THE LIBERIA WATER AND SEWER CORPORATION
THE MASTER PLAN STUDY
ON
URBAN FACILITIES RESTORATION AND IMPROVEMENT
IN MONROVIA IN THE REPUBLIC OF LIBERIA
GROUNDWATER DEVELOPMENT PLAN
IN
PAYNESVILLE AREA
FINAL REPORT
March 2010
JAPAN INTERNATIONAL COOPERATION AGENCY
YACHIYO ENGINEERING CO., LTD. KATAHIRA & ENGINEERS INTERNATIONAL EID
JR
09- 125

MINISTRY OF PUBLIC WORKS THE REPUBLIC OF LIBERIA
THE LIBERIA WATER AND SEWER CORPORATION
THE MASTER PLAN STUDY
ON
URBAN FACILITIES RESTORATION AND IMPROVEMENT
IN MONROVIA IN THE REPUBLIC OF LIBERIA
GROUNDWATER DEVELOPMENT PLAN
IN
PAYNESVILLE AREA
FINAL REPORT
March 2010
JAPAN INTERNATIONAL COOPERATION AGENCY
YACHIYO ENGINEERING CO., LTD. KATAHIRA & ENGINEERS INTERNATIONAL

Location Map of Greater Monrovia and Study Area
LOCATION MAP
Map of Study Area
②
①
③④
⑤
Community
① Duport Road North
② Duport Road North-East
③ Duport Road South
④ Paynesville Joe Bar
⑤ Rehab/ Borbor Town
Study Area

The Master Plan Study on Urban Facilities Restoration and Improvement in Monrovia in the Republic of Liberia
Final Report on Groundwater Development Plan in Paynesville Area
i
The Master Plan Study on Urban Facilities Restoration and Improvement in Monrovia in the Republic of Liberia
Table of Contents
LOCATION MAP TABLE OF CONTENTS ABBREVIATION
1. INTRODUCTION............................................................................................................................ 1-1
1.1 Objectives................................................................................................................................ 1-1 1.2 Study Area............................................................................................................................... 1-1 1.3 Study Schedule........................................................................................................................ 1-1 1.4 Investigation Quantity ............................................................................................................. 1-1
2. TOPOGRAPHY AND GEOLOGY ................................................................................................. 2-1
2.1 Topography ............................................................................................................................. 2-1 2.2 Geology ................................................................................................................................... 2-2
3. ELECTRICAL SOUNDING............................................................................................................ 3-1
3.1 Outline of Electrical Sounding................................................................................................ 3-1 3.2 Results of Electrical Sounding and Interpretation................................................................... 3-4 3.3 Hydrogelogical Condition Presumed from Electrical Sounding before and after Exploratory
Well Drilling ....................................................................................................................... 3-11
4. EXPLORATORY WELL DRILLING............................................................................................. 4-1
4.1 Exploratory Well Drilling Work ............................................................................................. 4-1 4.2 Pumping Test .......................................................................................................................... 4-6 4.3 Shallow Wells Situation and Influence during Pumping Test............................................... 4-19
5. WATER QUALITY ANALYSIS .................................................................................................... 5-1
6. EVALUATION OF HYDROGEOLOGICAL CONDITION.......................................................... 6-1
6.1 Hydrogeological Structure ...................................................................................................... 6-1 6.2 Ground Water Potential........................................................................................................... 6-6
7. GROUNDWATER DEVELOPMENT PLAN................................................................................. 7-1
7.1 Direction of Groundwater Development................................................................................. 7-1 7.2 Groundwater Development Area and Required Amount ........................................................ 7-2 7.3 Possible Yield.......................................................................................................................... 7-2 7.4 Well Specification ................................................................................................................... 7-2 7.5 Well Arrangement ................................................................................................................... 7-3 7.6 Public Water Tap Work........................................................................................................... 7-3
8. CONCLUSION AND RECOMMENDATION ............................................................................... 8-1
8.1 Conclusion............................................................................................................................... 8-1 8.2 Recommendation..................................................................................................................... 8-2
Appendices Appendix-1 Well Inventory Record surrounding Exploratory Wells Appendix-2 Record of 2nd Inventory Survey

The Master Plan Study on Urban Facilities Restoration and Improvement in Monrovia in the Republic of Liberia
Final Report on Groundwater Development Plan in Paynesville Area
ii
List of Figures and Tables
Figures Figure 1.2-1 Location of the Study............................................................................................... 1-1 Figure 2.1-1 Feature of Topography of the Study Aria ................................................................ 2-1 Figure 2.2-1 Geological map of the Grater Monrovia and Surrounding Area.............................. 2-3 Figure 3.1-1 Location of Electric Sounding ................................................................................. 3-1 Figure 3.2-1(1) The Appearance Resistivity – Depth Curve and Interpretation Result (1)............... 3-5 Figure 3.2-1(2) The Appearance Resistivity – Depth Curve and Interpretation Result (2)............... 3-6 Figure 3.3-2(1) Columnar of Resistivity of VES Sites (1) ................................................................ 3-7 Figure 3.2-2(2) Columnar of Resistivity of VES Sites (2) ................................................................ 3-8 Figure 3.2-2(3) Columnar of Resistivity of VES Sites (3) ................................................................ 3-9 Figure 3.2-2(4) Columnar of Resistivity of VES Sites (4) .............................................................. 3-10 Figure R-1 VES columnar of Phase 1 Exploratory Well Site .................................................. 3-14 Figure R-2 Lithology, Resistivity and Wellcolumnar of Phase 1 Exploratory Well ................ 3-15 Figure R-3 Relation of VES11-2 and LWSC Production Well No.1 ....................................... 3-16 Figure 4.1-1 Location of Exploratory Well .................................................................................. 4-1 Figure 4.1-2(1) Lithological Log, Electric Ligging Log and Well Structure of
Exploratory Well (1) ................................................................................................ 4-3 Figure 4.1-2(2) Lithological Log, Electric Ligging Log and Well Structure of
Exploratory Well (2) ................................................................................................ 4-4 Figure 4.2-1(1) Multi-stage Pumping Test Graph (1) ....................................................................... 4-8 Figure 4.2-1(2) Multi-stage Pumping Test Graph (2) ....................................................................... 4-9 Figure 4.2-2(1) Constant Discharge Pumping Test and Recovery Test Graph of J-5 ..................... 4-12 Figure 4.2-2(2) Constant Discharge Pumping Test and Recovery Test Graph of J-6 ..................... 4-13 Figure 4.2-2(3) Constant Discharge Pumping Test and Recovery Test Graph of J-7 ..................... 4-14 Figure 4.2-2(4) Constant Discharge Pumping Test and Recovery Test Graph of J-8 ..................... 4-15 Figure 4.2-2(5) Constant Discharge Pumping Test and Recovery Test Graph of J-9 ..................... 4-16 Figure 4.2-2(6) Constant Discharge Pumping Test and Recovery Test Graph of J-10 ................... 4-17 Figure 4.2-2(7) Constant Discharge Pumping Test and Recovery Test Graph of J-11 ................... 4-18 Figure 4.3-1 Well Structure in North West Part ......................................................................... 4-19 Figure 4.3-2 Use of Water in North West Part ........................................................................... 4-19 Figure 4.3-3 Dry up Situation and Water Quality Consciousness in North West Part ............... 4-20 Figure 4.3-4 Well Structure in Central and South East Part ....................................................... 4-20 Figure 4.3-5 Purpose of Water Use in Central and South East Part ........................................... 4-20 Figure 4.3-6 Dry up Situation and Water Quality Consciousness in Central
and South East Part................................................................................................. 4-21 Figure 4.3-7 Well Structure in Diabase Intrusion Area .............................................................. 4-21 Figure 4.3-8 Purpose of Water Use in Diabase Intrusion Area .................................................. 4-22 Figure 4.3-9 Dry up Situation and Water Quality Consciousness
in Diabase Intrusion Area....................................................................................... 4-22 Figure 4.3-10 Seasonal Variation of Water Level and Water Quality in North West Part........... 4-24 Figure 4.3-11 Seasonal Variation of Water Level and Water Quality
in Central and South East Part................................................................................ 4-25 Figure 4.3-12 Seasonal Variation of Water Level and Water Quality
in Diabase Intrusion Area....................................................................................... 4-26 Figure 4.3-13(1) Influence to Existing Shallow Wells during Pumping Test (1) ............................. 4-28 Figure 4.3-13(2) Influence to Existing Shallow Wells during Pumping Test (2) ............................. 4-29 Figure 4.3-13(3) Influence to Existing Shallow Wells during Pumping Test (3) ............................. 4-30 Figure 6.1-1 Geological Map of the Study Area........................................................................... 6-2 Figure 6.1-1(1) Geological Cross Section of Study Area (1) ............................................................ 6-3 Figure 6.1-1(2) Geological Cross Section of Study Area (2) ............................................................ 6-4 Figure 6.2-1 Geological Distribution of Surface .......................................................................... 6-8

The Master Plan Study on Urban Facilities Restoration and Improvement in Monrovia in the Republic of Liberia
Final Report on Groundwater Development Plan in Paynesville Area
iii
Figure 6.2-2 Geological Distribution of Deep portion.................................................................. 6-9 Figure 6.2-3 Groundwater Development Potential Indicated by Transmissivity ....................... 6-10 Figure 6.2-4 Groundwater Development Potential and Water Quality Contamination Area ..... 6-11 Figure 7.4-1 Standard Structure of Production Well .................................................................... 7-2 Figure 7.5-1 Arrangement of Production Wells for Groundwater Development Project ............. 7-3 Figure 7.6-1 Image of Water Tap Installation System.................................................................. 7-3 Figure 8.1-1 Groundwater Development Potential and Contamination Area............................... 8-2
Tables Table 1.4-1 Investigation Items and Quantity of the Study......................................................... 1-1 Table 2.1-1 Geological Composition of Study Area and Surrounding Area............................... 2-2 Table 3.1-1 Location and Quantity of Vertical Electric Sounding.............................................. 3-2 Table 3.1-2 Resistivity of Stratum or Rock................................................................................. 3-3 Table 3.2-1 Resistivity classification .......................................................................................... 3-4 Table 3.3-1 Presumed Hydrogeological Condition of the Study Area...................................... 3-11 Table 3.3-2 Presumed Condition of Proposed Exploratory
Well Drilling Site before Drilling .......................................................................... 3-12 Table 3.3-3 Re-presumed Hydrogeological Condition after Exploratory Well Drilling........... 3-13 Table R-1 VES result at Existing wells................................................................................... 3-16 Table 4.1-1 Location and Quantity of Exploratory Well............................................................. 4-1 Table 4.1-2 Feature of Lithology and Water Producing Portion During Drilling ....................... 4-2 Table 4.1-3 Electric Logging Result ........................................................................................... 4-2 Table 4.1-4 Quantity of Main Items of Exploratory Well Drilling Work ................................... 4-5 Table 4.2-1 Summary of Recording Results of Multi Stage Pumping Test ................................ 4-6 Table 4.2-2 Maximum Yield, and Optimum Yield Obtained by Inflection
Point on s-Q Curve................................................................................................... 4-7 Table 4.2-3 Calculated Safety Yield ........................................................................................... 4-7 Table 4.2-4 Summary of Recording Results of Constant Discharge Pumping Test.................... 4-9 Table 4.2-5 Hydraulic Parameters of Each Exploratory Well Obtained from
Various Methods .................................................................................................... 4-10 Table 4.2-6 Selected Hydraulic Parameter of Each Exploratory Well ...................................... 4-10 Table 4.2-7 Adjusted Hydraulic Parameter and Yield at Drawdown 5m,10mand 15m............ 4-11 Table 4.3-1 Well Dimension in North West Part ...................................................................... 4-19 Table 4.3-2 Water Use Volume of Well in North West Part..................................................... 4-19 Table 4.3-3 Water Quality of Wells in North West Part (by Field Measurement).................... 4-19 Table 4.3-4 Well Dimension in Central and South East Part .................................................... 4-20 Table 4.3-5 Water Use Volume of Well in Central and South East Part................................... 4-20 Table 4.3-6 Water Quality of Wells in Central and South East Part (by Field Measurement).. 4-21 Table 4.3-7 Well Dimension in Diabase Intrusion Area ........................................................... 4-21 Table 4.3-8 Water Use Volume of Well in Diabase Intrusion Area ........................................ 4-22 Table 4.3-9 Water Quality of Wells in Diabase Intrusion Area .............................................. 4-22 Table 4.3-10 Results of Water Level Observation in Surrounding Shallow Well
during Pumping Test .............................................................................................. 4-27 Table 5-1 Summary of Result of Water Quality Analysis........................................................ 5-1 Table 5-2 Result of Water Quality Analysis of Exploratory Well ........................................... 5-2 Table 6.1-1 Possibility of Aquifer in Each Formation ................................................................ 6-5 Table 6.1-2 Yield Condition of Wells ......................................................................................... 6-6 Table 6.1-3 Classification of Yield Capacity of Wells................................................................ 6-6 Table 7.1-1 Rank Classification of Yield Capacity of Well........................................................ 7-1 Table 7.2-1 Required Water Supply Amount of Each Community to Recharge ........................ 7-1 Table 7.3-1 Possible Yield .......................................................................................................... 7-2 Table 7.6-1 Criteria of Public Water Tap and Hand Pump Installation ...................................... 7-3 Table 8.1-1 Safety Yield.............................................................................................................. 8-1

The Master Plan Study on Urban Facilities Restoration and Improvement in Monrovia in the Republic of Liberia
Final Report on Groundwater Development Plan in Paynesville Area
iv
Table 8.1-2 Classification of Yield Capacity .............................................................................. 8-1

The Master Plan Study on Urban Facilities Restoration and Improvement in Monrovia in the Republic of Liberia
Final Report on Groundwater Development Plan in Paynesville Area
v
ABBREVIATIONS
EC Electric Conductivity GIS Geographic Information System GPS Global Positioning System GM Greater Monrovia JICA Japan International Cooperation Agency LHS Liberian Hydrological Services LISGIS Liberia Institute for Statistics and GeoInformation Services LWSC Liberia Water and Sewer Corporation MLME Ministry of Lands, Mines and Energy MPEA Ministry of Planning and Economic Affairs MPW Ministry of Public Works MTA Monrovia Transit Authority VES Vertical Electric Sounding WB World Bank WG Working Group WHO World Health Organization WMO World Meteorological Organization WSRP Water and Sanitation Rehabilitation Program WTP Water Treatment Plant

The Master Plan Study on Urban Facilities Restoration and Improvement in Monrovia in the Republic of Liberia
Final Report on Groundwater Development Plan in Paynesville Area
1-1
1. INTRODUCTION 1.1 Objectives This study is carried out to examine the implementability of groundwater development project in Paynesville as a grant aid project of Japan for water supply facilities improvement, and to make water development plan in detail by additional investigation. The study is succeedingly conducted as a additional study from “The Master Plan Study on Urban Facilities Restoration and Improvement in Monrovia in the Republic of Liberia” executed as a main project from November .2008 to November 2009. The study includes following items. 1) Electrical sounding 2) Exploratory well drilling 3) Water quality analysis Following other 2 additional studies are carried out at same time in the main project. 1) Operation & Maintenance and Monitoring of Community-Managed Satellite Water Supply
System 2) Environment Impact Assessment of Somalia Drive
1.2 Study Area The study area includes following 4 communities in Paynesville as shown in Figure 1.1-1. 1) Duport Road North-East Community 2) Duport Road North Community 3) Duport Road South Community 4) Paynesville Joe Bar Community 5) Rehab/ Borbor Town Community
Figure 1.2-1 Location of the Study 1.3 Study Schedule The study commenced in October 2009 and to be completed in March 2010. 1.4 Investigation Items and Quantity The investigation items of the study are shown in Table 1.4-1.
Table 1.4-1 Investigation Items and Quantity of the Study Item Place Point Total Quantity Remarks
Electrical Sounding 12 3 points/ place 36 points Exploratory Well Drilling 6 7 wells Total depth 484m Screen/ Casing Installation 6 5wells Total length 326m 6”Casing Water Quality Analysis 6 6 wells 38 items x 6 wells

The Master Plan Study on Urban Facilities Restoration and Improvement in Monrovia in the Republic of Liberia
Final Report on Groundwater Development Plan in Paynesville Area
2-1
2. TOPOGRAPHY AND GEOLOGY 2.1 Topography The study area locates in the south-west part of the Du river watershed. The watershed boundary exist west side and south side of the study area. The future of topography of the study area is shown in Figure 2.1-1 The land form classification of the Study area is as follows. 1) Diabase hills (sub-zone 1a; Central hills; sub-zone 1b; North side hill, sub-zone1c; Masurado river
south-east hill) 2) Upper to middle stream area of south-west branches of the Du river (zone 2). 3) Soth side narrow plain (zone 3) 4) Low land of the south-west area of Du river (4 zone) 5) Beach zone (5 zone) The low mound like sand dune is recognized along beach between zone 3 and zone5. The elevation of watershed ridge and each zone around the study area is as follows. 1) The elevation of watershed ridge is 10 to 18m in west side, and 10 to 16 m in south side. 1) The elevation of sub-zone 1a is 10 to 48m, sub-zone 1b is 10 to 18m, and sub-zone 1c is 8 to 12m. 2) The elevation of zone 2 is 4 to 14m. 3) The elevation of zone 3 is 2 to 8m. 4) The elevation of zone 4 is 2 to 4m. 5) The elevation of zone 5 is 0 to 12m. The week lineaments are recognized along foot of Diabase low hills. West-north-west to east-south-east direction is predominant. North-east to South-west direction is secondly predominant.
Figure 2.1-1 Feature of Topography of the Study Aria

The Master Plan Study on Urban Facilities Restoration and Improvement in Monrovia in the Republic of Liberia
Final Report on Groundwater Development Plan in Paynesville Area
2-2
2.2 Geology The geology of the greater Monrovia and surrounding area mainly consists of Precambrian Melanocratic gneiss, Devonian Paynesville sandstone, Jurassic Diabase dike, Tertiary Edna sandstone and Quaternary Beach and Fluvial deposits. The geological composition of the greater Monrovia and surrounding area is shown in Table 2.2-1. The geological map of the greater Monrovia and surrounding area is shown in Figure 2.2-1. The Precambrian Melanocratic gneiss is widely distributed as a base rock in north part of the grater Monrovia such as New kru town, North part of Logan town, Caldwell, Barnesville, North part of New Georgia, North part of Gardnesville and Johnsonville. The Devonian Paynesville sandstone is distributed at central area of New Georgia and at everywhere of Paynesville. The formation is intruded by Jurassic Diabase at everywhere and covered by Tertiary and Quaternary deposit at low flat area. The Jurassic Diabase is distributed as a dike or intrusive rock with rather large rock body in Central Monrovia A and B, Congo Town and Paynesville. The rock bodies often form row height hill. The Tertiary Edina sandstone is distributed at front of Paynesville sandstone at central and south east area of New Georgia and at central and partly south area of Paynesville. The Quaternary deposit is distributed low flat land of all the grater Monrovia area and covers underlying other formations. The geology of the study area consists of Devonian Paynesville sandstone, Jurassic Diabase dike, Tertiary Edna sandstone and Quaternary Beach and Fluvial deposits. The Paynesville sandstone is distributed partly forming tinny outcrops in plain area around Diabase low hill (1a sub-zone). The hard outcrops are recognized at VES 19 to VES 20 area. The formation is almost overlaid widely by Quaternary deposit in north-west and central area and Tertiary Edina sandstone in north-west area of the study area. The Diabase is distributed forming low hills in 1a, 1b and 1c zone. West-north-west to east-south-east directed arrangement of Diabase rock bodies is recognized. The Edina sandstone is distributed in north-west area of the study area, and overlaid widely by Quaternary deposit in north-east area and central area of the study area. The Quaternary beach and fluvial deposit is distributed widely in low land and middle area up to watershed boundary overlaying old formations.
Table 2.2-1 Geological Composition of Study Area and Surrounding Area Era Period Symbol Formation Description Remarks
Quaternary Qb/QfBeach and FluvialDeposit
Modern beach deposits (seashore sand), Older beach deposits (purewhite quartz sand, buff to yellowish-brown sand and silt)
Tertiary Te Edina SandstoneBrownish yellow, light-brown, white, medium to coarse grainedgritly to conglomeratic quartz sandstone
Generally less than afew meters thick
Cretaceous KfFarmington RiverFormation
Brown to dark green massive sandstone, poorly to moderately wellsorted, Conglomerate unit at base
No indication in thegeological map
Jurassic Jd DiabaseDark-gray, fine to course grained rock, mainly diabasic but locallygabbroic in texture, chiefly dikes with north-west trending, partlyforming sill-like bodies
Paleozoic Devonian DpPaynesvilleSandstone
Light colored, fine to medium grained, well rounded and well sorted,cross bedded quartz sandstone, subordinate cross bedded reddishbrown siltstone and shale
gnl Leucocratic GneissLight colored, medium to coarse grained, foliated, commonlybanded, rock composition ranging from granite to granodiorite,locally quart diorite
Distribution out ofthe study area
gnm Melanocratic GneissDark colored, medium grained, moderately foliated, rockcomposition ranging from diorite to gabbro, including amphiboliteand granitic gneiss
Source: 1/62,500 GEOLOGICAL MAP OF MONROVIA AREA (LISGIS Material)
Cenozoic
Mesozoic
Precambrian

The Master Plan Study on Urban Facilities Restoration and Improvement in Monrovia in the Republic of Liberia
Final Report on Groundwater Development Plan in Paynesville Area
2-3
Source: Geological Map of Monrovia Area (LISGIS materials) Figure 2.2-1 Geological map of the Grater Monrovia and Surrounding Area
Qb/Qf Beach and Fluvial Deposit
Te Edina Sandstone
Kf Farmington River Formation
Jd Diabase
Dp Paynesville Sandstone
gnl Leucocratic Gneiss
gnm Melanocratic Gneiss
LEGEND

The Master Plan Study on Urban Facilities Restoration and Improvement in Monrovia in the Republic of Liberia
Final Report on Groundwater Development Plan in Paynesville Area
3-1
3. ELECTRICAL SOUNDING 3.1 Outline of Electrical Sounding (1) Objectives and method The vertical electric sounding (VES) is carried out to grasp widely hydrogeological condition in the study area and to select exploratory well sites. The Schlumberger method is applied as vertical electric sounding in consideration of the method generally performed in Liberia and the method of enforcing a number of people. The field work of vertical electric sounding is carried out by Bezaleel Turnkey Contractors Inc. Liberia from 16th Oct. 2009 to 23rd Oct. 2009. (2) Location and quantity The location map of the electrical sounding is shown in Figure 3.1-1. The quantity of the sounding is shown in Table 3.1-1. The vertical electric sounding is carried out at selected 12 places, 3 points per each place, total 36 points. The current electrode spacing (AB) is set from 2m to maximum 900m, and the potential electrode spacing (MN) is set from 0.66m to 15m at each measurement point. Each point is arranged about 300-500m apart.
VES-11
VES-12
VES-14
VES-15
VES-17
VES-16
VES-18
VES-19VES-20
VES-22
VES-13
VES-21
LWSC No.1
LWSC No.2
LEGEND
Vertical Electric Sounding
Study Area
LWSC Production Well
1
2
3
J-5
J-6
J-7
J-8
ExploratoryWell Site
J-9 J-10
J-11
Figure 3.1-1 Location of Electric Sounding

The Master Plan Study on Urban Facilities Restoration and Improvement in Monrovia in the Republic of Liberia
Final Report on Groundwater Development Plan in Paynesville Area
3-2
Table 3.1-1 Location and Quantity of Vertical Electric Sounding UTM Coordinate
VES No. Sub-No.
Community Easting Northing
Elevation (m)
AB (Max m)
Remark
1 313375 694670 11 400
2 313283 694351 11 300 VES-11
3
Outland C. / Hammond Field C., Duport Road North 313216 694045 13 400
1 314815 694011 10 400
2 314629 693842 9 400 Well J-5 VES-12
3
Cowfield C., Duport Road North-East
314398 693573 8 400
1 316042 693426 6 400
2 315888 693171 5 300 VES-13
3
Sahra C., Duport Road North-East
315687 692881 7 400
1 313267 693236 8 400
2 313024 692922 11 400 Well J-6 VES-14
3
Worldwide C., Duport Road South Block/ G-2., Paynesville Joe Bar 312779 692731 14 400
1 314762 692979 7 300
2 314577 692842 10 400 Well J-7 VES-15
3
Zubah Town Rehab C., Duport Road South
314117 692584 12 400
1 315388 691973 7 400
2 315108 691806 8 300 VES-16
3
Zubah Town C., Rehab/ Borbor Town
314773 691549 6 400
1 316538 691257 8 400
2 316469 691046 6 400 Well J-8 VES-17
3
Thinkers Village Old Field C., Rehab/ Borbor Town
316061 690534 9 400
1 314064 690639 8 400
2 313901 690363 10 400 VES-18
3
Rehab C., Rehab/ Borbor Town
313735 690110 8 400
1 315583 690301 7 400
2 315381 689999 8 400 Well J-9 VES-19
3
Kendeh Town Old Field C., Rehab/ Borbor Town
315041 689483 10 400
1 316890 690052 5 300
2 316692 689655 6 400 VES-20
3
Kpayam Town C., Rehab/ Borbor Town
316584 689416 7 400
1 318196 690119 3 200
2 318191 689759 4 400 Well J-10VES-21
3
Ghengbah C., Rehab/ Borbor Town
317835 689388 6 400 Well J-11
1 319886 689713 3 400
2 319689 689192 4 400 VES-22
3
VOA C., Rehab/ Borbor Town
319408 688710 7 400

The Master Plan Study on Urban Facilities Restoration and Improvement in Monrovia in the Republic of Liberia
Final Report on Groundwater Development Plan in Paynesville Area
3-3
(3) General information related VES interpretation General information for VES interpretation is as follows. The resistivity of stratum and rock is shown in Table 3.1-2. 1) The resistivity of rain shows 1,000-1,500 ohm-m. Generally, the resistivity of groundwater in
shallow aquifer shows 50-100 ohm-m, and the resistivity of groundwater in deep aquifer shows 20-50 ohm-m
2) Rock which has less than 100 ohm-m of resitivity has possibility of aquiclude. 3) Rock which has more than 1,000 ohm-m of resistivity has possibility of igneous rock, metamorphic
rock or dry condition among aquifer’s rock. 4) Rock which has more than 1,000 ohm-m of resistivity under groundwater has possibility of rock
belonging to aquiclude except of a kind of gravel layer such as fun gravel. 5) Aquifer saturated groundwater shows 100-1,000 ohm-m except of a kind of gravel layer such as fun
gravel. (Source; Shimura (1984) Method of Electric Sounding, Shoukodo Publish Japan)
Furthermore, there is following information; a) In case of increase of moisture content at fault or weathered portion, resistivity remarkably
decreases. In case of increase of graphite or iron ore content, resistivity clearly decreases. b) Crackly portion or weathered portion of hard rock shows 100-1,000 ohm-m, and hard weathering
clay zone shows less than 100 ohm-m. c) In case of Tertiary soft rock, conglomerate shows more than 100 ohm-m, sand stone shows 80-100
ohm-m, and alternation portion of sand stone and mud stone shows 20-80 ohm-m.
Table 3.1-2 Resistivity of Stratum or Rock
Resistivity (Ohm-m) Stratum/ Rock
Dry Wet Gravel 1,000-15,000 200-10,000 Gravel with sand 1,000-7,000 200-5,000 Sand 300-7,000 100-700 Conglomerate 300-1,800 100-500
Aquifer
Sand stone 200-2,500 100-500 Silt <100 Clay <100 Marl <100
Aquiclude
Sale <100 Tuff breccia 100-1,000 Granite 1,000-10,000 Andesite 200-10,000 Basalt 20,000 Crystaline shist 200-20,000 Gneiss 200-20,000
Non-Aquifer
Limestone 60-500,000 Source; Shimura (1984) Method of Electric Sounding, Shoukodo Publish Japan

The Master Plan Study on Urban Facilities Restoration and Improvement in Monrovia in the Republic of Liberia
Final Report on Groundwater Development Plan in Paynesville Area
3-4
3.2 Results of Electrical Sounding and Interpretation (1) Results of VES The appearance resistivity – depth curve and analysis result of each point is shown in Figure 3.2-1. The columnar indication of the vertical electric sounding results is shown in Figure 3.2-2. The classification of resistivity is shown in Table 3.2-1.
Table 3.2-1 Resistivity classification Clasification Resistivity Range Description
Resistivity <50 Silt, clay, mudstone, shale, groundwater of fissure zone
50 =< Resistivity < 100 Alteration of sand and silt, alteration of sandstone and siltstone or shale, a part of sandstone
100 =< Resistivity < 500 Sand, sandstone or highly weathered rock
500 =< Resistivity < 1,000 Weathered or crackly portion of hard rock
1,000 =< Resistivity Hard rock
(2) Interpretation of resistivity of the study area According to the resistivity classification, the general interpretation of resistivity of the study area is as follows. 1) The Resistivity < 50 ohm-m zone shows a possibility of silt, clay, mudstone and shale (Aquiclude).
Sometimes groundwater in fissure zone may show very low resistivity (Possibility of Aquifer). 2) 50 =< Resistivity <100 ohm-m zone may show a part of sandstone, alternation of sandstone
(Possibility of Aquifer) and mudstone (Aquiclude). 3) The 100 =< Resistivity <500 ohm-m zone shows a possibility of sand and sandstone (Aquifer). 4) The 500 =< Resistivity < 1,000 ohm-m zone shows a possibility of weathered or crackly portion of
hard rock and a part of sandstone (Aquifer to Aquiclude). 5) Resistivity =>1,000 ohm-m zone shows a possibility of hard rock (Non-Aquifer). 5) The Resistivity >= 5,000 ohm-m zone shows very hard portion of base rock (Non-Aquifer). .

3-5
The M
aster Plan Study on U
rban Facilities R
estoration and Improvem
ent in M
onrovia in the Republic of L
iberiaF
inal Report on G
roundwater D
evelopment P
lan in Paynesville A
rea
Figure 3.2-1(1) The Appearance Resistivity – Depth Curve and Interpretation Result (1)
3-6
The M
aster Plan Study on U
rban Facilities R
estoration and Improvem
ent in M
onrovia in the Republic of L
iberiaF
inal Report on G
roundwater D
evelopment P
lan in Paynesville A
rea
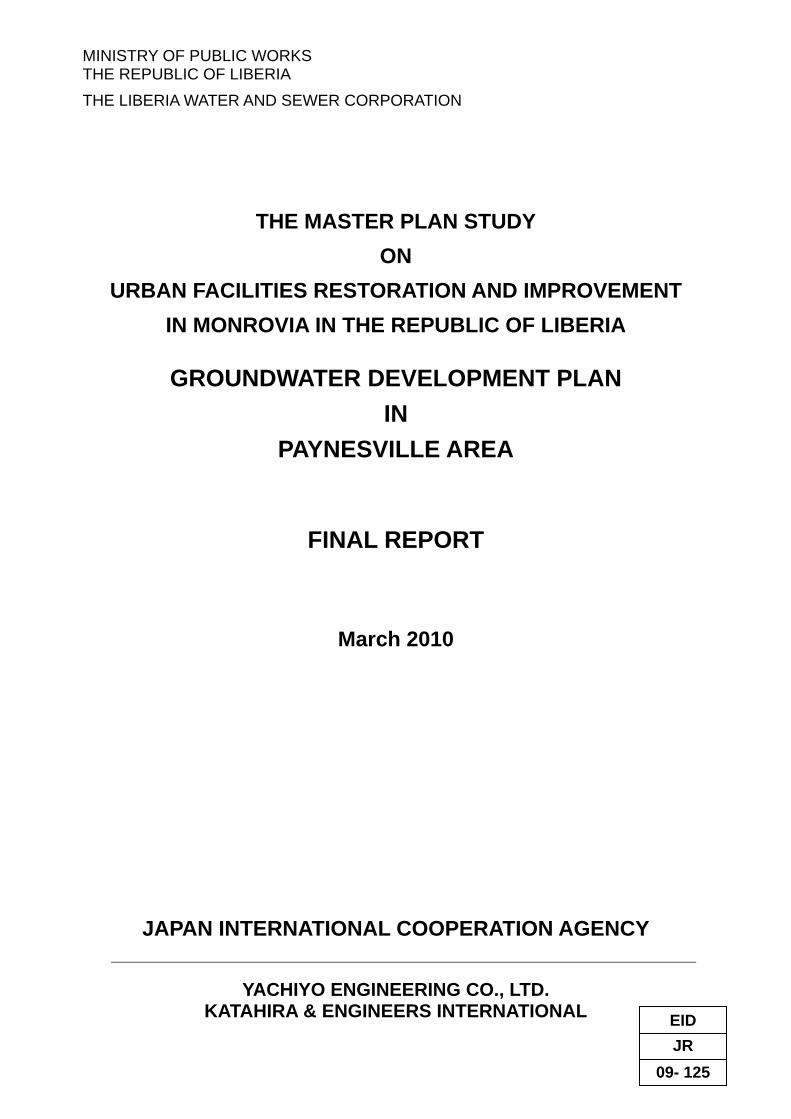
Figure 3.2-1(2) The Appearance Resistivity – Depth Curve and Interpretation Result (2)

3-7
The M
aster Plan Study on U
rban Facilities R
estoration and Improvem
ent in M
onrovia in the Republic of L
iberiaF
inal Report on G
roundwater D
evelopment P
lan in Paynesville A
rea
Figure 3.2-2(1) Columnar of Resistivity of VES Sites (1)

3-8
The M
aster Plan Study on U
rban Facilities R
estoration and Improvem
ent in M
onrovia in the Republic of L
iberiaF
inal Report on G
roundwater D
evelopment P
lan in Paynesville A
rea
Figure 3.2-2(2) Columnar of Resistivity of VES Sites (2)

3-9
The M
aster Plan Study on U
rban Facilities R
estoration and Improvem
ent in M
onrovia in the Republic of L
iberiaF
inal Report on G
roundwater D
evelopment P
lan in Paynesville A
rea
Figure 3.2-2(3) Columnar of Resistivity of VES Sites (3)

3-10
The M
aster Plan Study on U
rban Facilities R
estoration and Improvem
ent in M
onrovia in the Republic of L
iberiaF
inal Report on G
roundwater D
evelopment P
lan in Paynesville A
rea
Figure 3.2-2 Columnar of Resistivity of VES Sites (4)
The Master Plan Study on Urban Facilities Restoration and Improvement in Monrovia in the Republic of Liberia
Final Report on Groundwater Development Plan in Paynesville Area
3-11
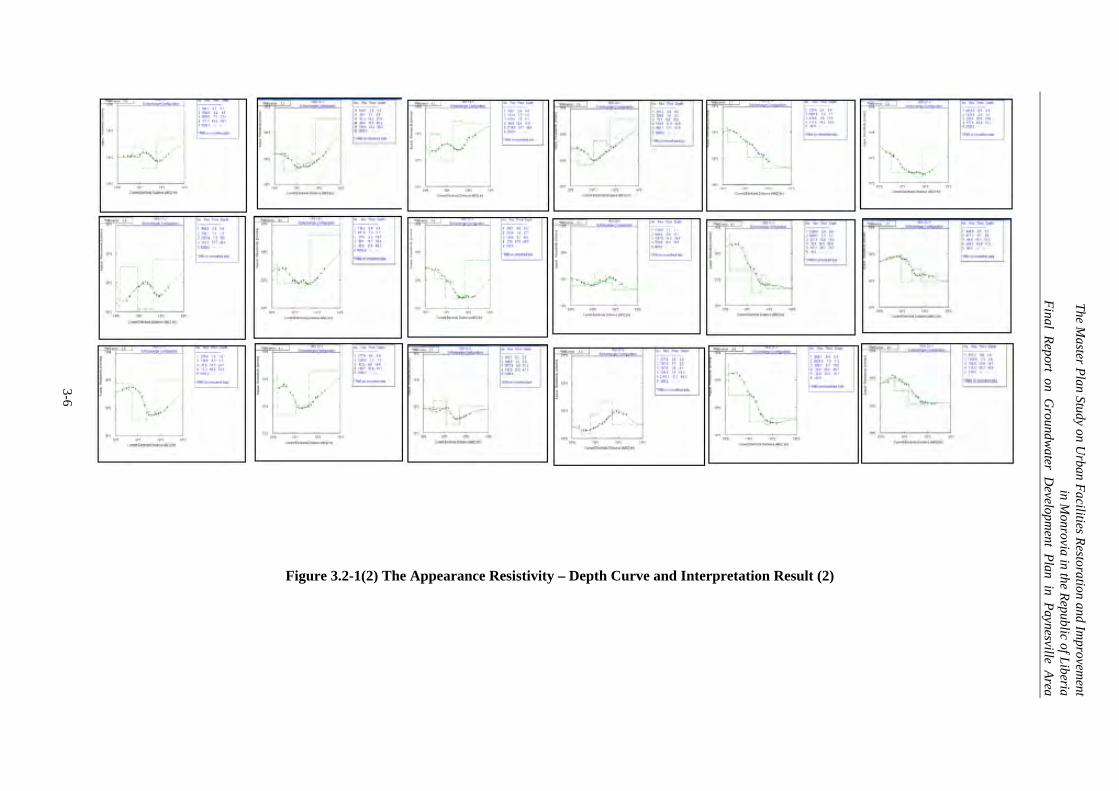
3.3 Hydrogelogical Condition Presumed from Electrical Sounding before and after Exploratory Well Drilling
(1) Presumed hydrogeological condition from VES before exploratory well drilling The hydrogeological structure presumed from VES results in the study area is summarized as follows. 1) In north west zone of this study area (VES 11 to VES 15 area), sandstone or sandstone
predominant alteration are distributed widely. Low resistivity less than 50 ohm-m, which generally indicates fine soil or fine rock, exists only at VES11-1. The hard rock is distributed under 50-94m (Average 70m)
2) In central zone of this study area (VES 16 to VES 19 area), sandstone predominant alteration portions increase more than half compared to north west zone, and thin low resistivity sections indicated less than 50 ohm-m are included. The hard rock is distributed under 42-73m (Average 55m) and becomes shallow compared to the north west zone. VES 7-1 and VES 7-3 locate in diabase distributed area. One shows fine rock condition with less than 100 ohm-m, and another shows weathered or crackly condition with 380 ohm-m. VES 19-2 shows fine rock condition with less than 50 ohm-m up to 70m and crackly hard rock condition with 500 ohm-m under 70m. low resistivity section sometime shows highly crackly portion bearing fresh or brackish water. VES 16-2 shows sandstone predominant alteration condition with less than 100 ohm-m up to 82m and sandstone or weathered/ crackly condition with 200 ohm-m under 82m. These 2 VES points show hard rock is rather deeper than other VES points
3) In south east zone of this study area (VES 20 to VES 22 area), VES results show very varied condition such as hard rock or crackly hard rock condition in VES 20 area, sandstone and fine rock condition in VES 21 area, and sandstone predominant condition in VES 22 area. The hard rock is distributed under 55-75m in VES 20-1 and VES22-1 points, but in other VES points, hard rock becomes deep, it indicates ordinary sandstone predominant or alteration or fine rock condition exist at deeper portion, or sometimes existence of fresh or brackish water in highly crackly rocks.
The geological and hydrogeological condition of the study area presumed from VES results is shown in Table 3.3-1. The hydrogeological condition of proposed exploratory well drilling site presumed from VES results is shown in Table 3.3-2.
Table 3.3-1 Presumed Hydrogeological Condition of the Study Area
No. Presumed Condition Hard Rock Depth
(m) VES11 Possibility of sand or sandstone, or sandstone predominant alteration in upper portion
alteration or mudstone/ shale in deep portion (VES11-2 & VES11-3, near LWSC Well No.1) Possibility of alteration or mudstone/ shale (VES11-1)
71-94
VES12 Possibility of sandstone, Resemblance of J-1 condition 68-75 VES13 Possibility of sandstone predominant alteration 57-71 VES14 Possibility of sand or sandstone, or sandstone predominant alteration in upper portion
alteration or mudstone/ shale in deep portion Resemblance of VES 11-2 in LWSC Well No.1 area
50-66
VES15 Possibility of sandstone, Resemblance of J-1 condition (VES15-1, VES15-2), Possibility of mudstone/ shale predominant alteration
69-78
VES16 Possibility of mudstone/ shale predominant alteration (VES16-1, VES16-2), Possibility of sandstone (VES16-3)
59-62, deep at VES16-2
VES17 Possibility of sandstone (VES17-2), Possibility of weathered and crackly diabase (VES17-1), Possibility of weathered diabase or hard rock like J-4 (VES17-3)
42-73
VES18 Possibility of mudstone/ shale or fine rock predominant alteration 42-50 VES19 Possibility of silt, mudstone/ shale or crackly rock (VES19-2), Possibility of shallow hard
rock (VES19-1), Possibility of sandstone (VES19-3) 47-46, deep at
VES19-2 VES20 Possibility of shallow hard rock and crackly hard rock of Paynesville sandstone, Possibility
of weathered sandstone with flesh or blackish water in deeper portion (VES20-2, VES 20-3) 55, deep at VES20-2, VES20-3
VES21 Possibility of mudstone/ shale predominant alteration, Possibility of weathered fine rock with blackish water or fresh water in crackly portion
Deep at all points
VES22 Possibility of sandstone or sandstone predominant alteration, Possibility of weathered sandstone or alteration with flesh or blackish water in deeper portion (VES20-2, VES 20-3)
75, deep at VES22-2, VES22-3

The Master Plan Study on Urban Facilities Restoration and Improvement in Monrovia in the Republic of Liberia
Final Report on Groundwater Development Plan in Paynesville Area
3-12
Table 3.3-2 Presumed Condition of Proposed Exploratory Well Drilling Site before Drilling Well No.
Resistivity of VES Presumed Lithology Presumed Condition of Aquifer
J-5 215-443 ohm-m up to 75m 3500 ohm-m under 75m
Sandstone or sandstone predominant alteration Hard rock under 75m
Aquifer (Resemblance of J-1)
J-6 180-399 ohm-m up to 30m, 82 ohm-m up to 66m, 5000 ohm-m under 66m
Sandstone at upper portion and sandstone predominant alteration at middle portion. Hard rock under 66m
Aquifer (Resemblance of LWSC Well No.1)
J-7 172-267 ohm-m up to 69m 3500 ohm-m under 69m
Sandstone or sandstone predominant alteration Hard rock under 69m
Aquifer (Resemblance of J-1)
J-8 123 ohm-m up to 47m 6500 ohm-m under 42m
Sandstone or sandstone predominant alteration Hard rock under 42m
Aquifer (Confirmation of a portion with about 100 ohm-m )
J-9 23 ohm-m up to 70m, 500 ohm-m under 70m
Mudstone/ shale or portion of water bearing in cracks, crackly rock with fresh water or blackish water under 70m
Aquitard or Aquifer (Confirmation of a portion with less than 50 ohm-m )
J-10 217 ohm-m up to 16m, 32 ohm-m up to 42m, 147 ohm-m up to 71m, 45 ohm-m under 71m
Sandstone half and Mudstone/ shale half, Fine rock or crackly rock with fresh water or blackish water under 71m
Aquifer or Aquitard (Confirmation of a alteration portion with 100-200 ohm-m and less than 50 ohm-m )
(2) Hydrogeological condition of the study area from VES and exploratory well drilling results The results of having compared VES with drilled exploratory well is as follows.
1) The resistivity 150-500 ohm-m zone shows sandstone. The water producing capacity is separated into J-1type (VES1-1 and 1-2, Yield: 10-20m3/day at 8 hours pumping), J-5 type (VES 12-2, Yield: 70-90m3/day at 8 hours pumping), and J-7 type (VES 15-2, Yield: less than 5m3/day at 8hours pumping).
2) The resistivity 100-500 ohm-m zone including 100-150 ohm-m zone shows sandstone. The water producing capacity indicates rather high such as J-8 (VESS17-2, Yield: 70-90 m3/day at 8hours pumping).
3) The resistivity 50-100 ohm-m zone shows sandstone predominant alternation, sometimes indicates intrusion of diabase. The water producing capacity become high incase of intrusion of diabase and having crackly zone around diabase intrusion body such as J-6(VES 14-2, Yield: 150-180m3/day at 8hours).
4) The resistivity 50-100 ohm-m zone shows shale and fine rock, sometimes indicates intrusion of diabase. The water producing capacity become high incase of crackly or fracture zone in biabase body or around diabase intrusion body such as J-9(VES 17-2, Yield: more than 500m3/day at 8hours). And J-11(VES 21-3, Yield: 150-170m3/day at 8hours). But, the low resistivity zone sometimes shows hard diabase without crackly zone such as J-10 (VES 14-2, Yield: less than 5m3/day at 8hours).
The re-presumed hydrogeological condition of each VES point from above mentioned condition is shown in Table 3.2-3.

The Master Plan Study on Urban Facilities Restoration and Improvement in Monrovia in the Republic of Liberia
Final Report on Groundwater Development Plan in Paynesville Area
3-13
Table 3.3-3 Re-presumed Hydrogeological Condition after Exploratory Well Drilling
VES No. VES Pattern Similar to
Condition Yield
(Possibility) Remarks
-1 J-6 Shale, Alternation/ Diabase △-○ -2 J-6 Sandstone、Alternation/ Diabase ○ 11 -3 J-6 Sandstone、Alternation/ Diabase ○ -1 J-1, J-7 Sandstone, Hard rock X-△ -2 J-5 Sandstone predominant △ J-5 12 -3 J-5 Sandstone predominant Sandstone △ Including (< 150 ohm-m) -1 J-6 Alternation, Sandstone/ Diabase ○ -2 J-5, J-8 Sandstone predominant Sandstone △-○ Including (< 150 ohm-m) 13 -3 J-6 Alternation/ Diabase ○ -1 J-1, J-7 Sandstone X-○ -2 J-6 Sandstone ○ J-6 14 -3 J-6 Sandstone/ Diabase ○ -1 J-1, J-7 Sandstone predominant X-○ -2 J-7 Sandstone, Hard rock X J-7 15 -3 J-6 Alternation, Sandstone/ Diabase ○ -1 J-6 Alternation, Sandstone/ Diabase ○ -2 J-6 Alternation/ Diabase ○ 16 -3 J-5, J-8 Sandstone △-○ Including (< 150 ohm-m) -1 J-1, J-7 Sandstone X-○ -2 J-8 Sandstone ○ J-8 17 -3 J-6 Shale, Alternation/ Diabase △-○ -1 J-6 Alternation/ Diabase ○ -2 J-6 Alternation, Sandstone/ Diabase ○ 18 -3 J-5, J-8 Sandstone △-○ Including (< 150 ohm-m) -1 Shallow hardrock X -2 J-9 Diabase with crackly zone ◎ J-9 19 -3 J-1, J-7 Sandstone X-○ -1 Shallow hardrock X -2 Shallow hardrock X – ? < 400 ohm-m at deep portion20 -3 Shallow hardrock X – ? < 300 ohm-m at deep portion-1 Shale/ Diabase X – ? <50 ohm-m at deep portion -2 J-10 Diabase hard X <50 ohm-m at deep portion 21 -3 J-11 Diabase hard, Fracture zone ○ <50 ohm-m at deep portion -1 J-1, J-7 Sandstone X-○ -2 J-1, J-7 Sandstone/ Diabase X-○? <50 ohm-m at deep portion 22 -3 J-5, J-8 Sandstone △-○? Including (< 150 ohm-m)
Remarks; Yield; x: very low, △: low, ○: high. ◎: very high

The M
aster Plan Study on U
rban Facilities R
estoration and Improvem
ent in M
onrovia in the Republic of L
iberiaF
inal Report on G
roundwater D
evelopment P
lan in Paynesville A
rea
3-14
<< Reference Data>>
Figure R-1 VES columnar of Phase 1 Exploratory Well Site

The M
aster Plan Study on U
rban Facilities R
estoration and Improvem
ent in M
onrovia in the Republic of L
iberiaF
inal Report on G
roundwater D
evelopment P
lan in Paynesville A
rea
3-15
11 1/4”drilling
73
67
70
W ell J-1
28
37
52
64
50
60
40
30
10
20
0
Resistvity (ohm-m) Structure
Alt Ms / fSs
Alt Ms / fSs
Ms / Di
fSs
ob
10
70
Silt / sand
c-fSs
mSs
Silt st.
fSs
Silt st.
20
30
40
Ms
50
Ms
Alt. Ms/fSs
60
Ms
Ait.fSs/Ms
0 0 1000
.
10
20
0
70
ob
hwGn (silt)
hwGn(sand)
wGn(rock)
Gn
50
60
40
30
68
W ell J-40
10
20
60
30
40
70
20
41
53
6970
50
AM: 2.5ft
Resistvity (ohm-m) Structure
AM: 0.25ft
0 20
ob Overburden
Silt/ sand Silt with sand
c-fSs Coarse to fine sandstone
fSs Fine sandstone
mSs Medium sandstone
cSs Coarse sandstone
Alt.fSs/Ms Arteration (fSs/Ms)
Alt.Ms/fSs Arteration (Ms/sSs)
Silt. st Sandy gravel
Ms Clay stone
Sh Sandstone
hwGn Conglomerate
wGn Weathered gneiss (Rock)
Gn Melanocratic gneiss
LEGEND
0 100 200 (ohm-m)
13
34
49
46
37
25
50
60
50
Well J-20
10
20
30
40
Ms
fSs
fs / silt
Silt st./ fSs
0ob
ms
M s / Di40
10
20
Di
30
50
60
0 100 200
(ohm-m) Well J-30
10
20
5
18
ob
Ms
silt / fs
cl. Silt
Ms
fs
Alt. Ms/fSs
Alt. Ms/fSs
Alt. Ms/fSs
Ms
30
40
33
38
Ms
Ms / Di
50
60
44
51
63
22
25
0
10
20
30
50
60
36.8
40
52.5
63
60
18
43.5
57
19.5
30.8
Grouting section
Cutting material
Gravel packing section
Buried portion
Screen
Plane casing
14 1/2”drilling
6”screen and casing
Casing
<< Reference Data>>
Figure R-2 Lithology, Resistivity and Wellcolumnar of Phase 1 Exploratory Well

The Master Plan Study on Urban Facilities Restoration and Improvement in Monrovia in the Republic of Liberia
Final Report on Groundwater Development Plan in Paynesville Area
3-16
<< Reference Data>> Table R-1 VES result at Existing wells
Existing Well
Lithology Resistivity of VES Resistivity of Logging Yield (L/min)
LWSC Well No.1
Gravel, Conglomerate, Sandstone
118-307 ohm-m (main), 83 ohm-m in deep (by VES11-2)
No data 200m3/day
J-1 Sandstone dominant, Alteration, Shale
167-438 ohm-m 200 ohm-m to 900 ohm-m, 200-500 ohm-m shows Aquifer
Optimum yield 96L/min
J-2 Shale dominant, Partly sandstone at shallow portion
47-99 ohm-m (main), 144-207ohm-m (upper part)
100-200 ohm-m up to 23m (Aquifer), Stacking the prove in deeper section
Optimum yield 19L/min
J-3 Shale dominant, Partly sandstone at shallow portion
50-64 ohm-m & 105-204 ohm-m
0-100 ohm-m under 10m (Aquitard)
Optimum yield 29L/min
J-4 Hard rock of melanocratic gneiss
55-86 ohm-m including 535 ohm-m a part
0-20 ohm-m (Aquitard) Optimum yield 6L/min
Figure R-3 Relation of VES11-2 and LWSC Production Well No.1
The Master Plan Study on Urban Facilities Restoration and Improvement in Monrovia in the Republic of Liberia
Final Report on Groundwater Development Plan in Paynesville Area
4-1
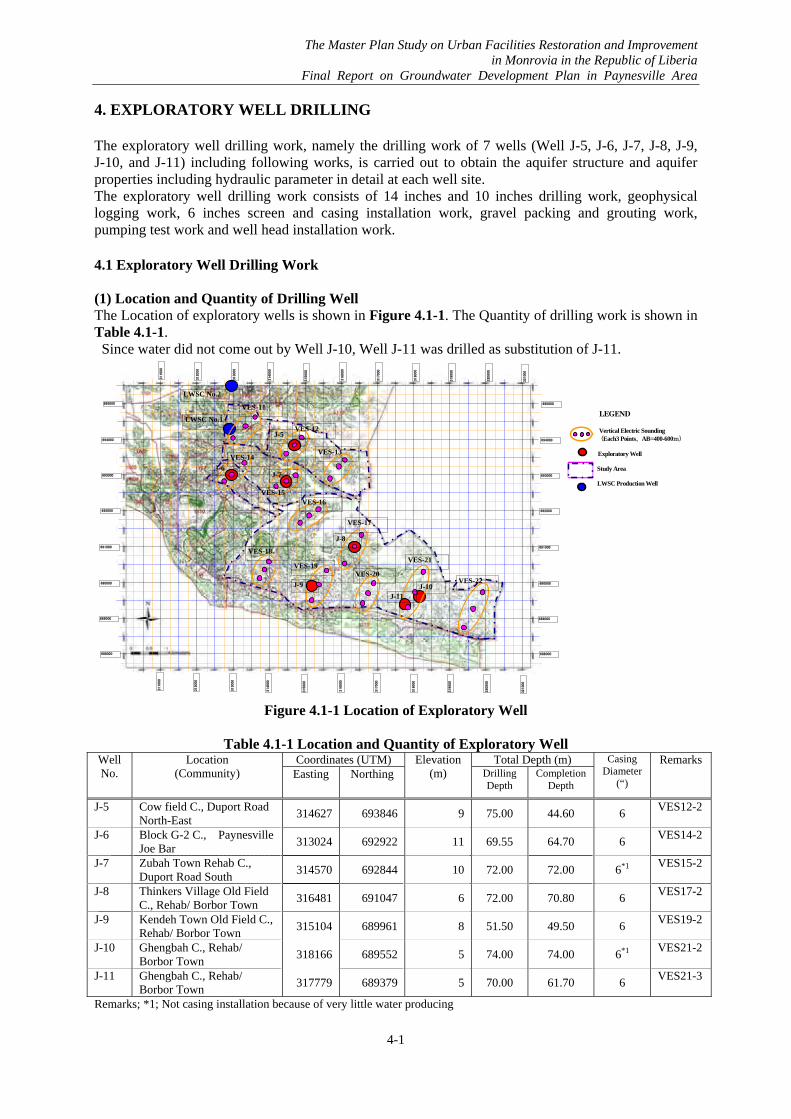
4. EXPLORATORY WELL DRILLING The exploratory well drilling work, namely the drilling work of 7 wells (Well J-5, J-6, J-7, J-8, J-9, J-10, and J-11) including following works, is carried out to obtain the aquifer structure and aquifer properties including hydraulic parameter in detail at each well site. The exploratory well drilling work consists of 14 inches and 10 inches drilling work, geophysical logging work, 6 inches screen and casing installation work, gravel packing and grouting work, pumping test work and well head installation work. 4.1 Exploratory Well Drilling Work (1) Location and Quantity of Drilling Well The Location of exploratory wells is shown in Figure 4.1-1. The Quantity of drilling work is shown in Table 4.1-1.
Since water did not come out by Well J-10, Well J-11 was drilled as substitution of J-11.
311000
312000
313000
314000
315000
316000
317000
318000
319000
320000
321000
695000
694000
693000
692000
691000
690000
689000
688000
311000
312000
313000
314000
315000
316000
317000
318000
319000
320000
321000
695000
694000
693000
692000
691000
690000
689000
688000
J-8
J-10J-9
J-5
J-7J-6
VES-11
VES-12
VES-14
VES-15
VES-17
VES-16
VES-18
VES-19VES-20
VES-22
VES-13
VES-21
LWSC No.1
LWSC No.2
J-11
LEGEND
Vertical Electric Sounding (Each3 Points、AB=400-600m) Exploratory Well
Study Area
LWSC Production Well
Figure 4.1-1 Location of Exploratory Well
Table 4.1-1 Location and Quantity of Exploratory Well
Coordinates (UTM) Total Depth (m) Well No.
Location (Community) Easting Northing
Elevation(m) Drilling
Depth Completion
Depth
Casing Diameter
(“)
Remarks
J-5 Cow field C., Duport Road North-East
314627 693846 9 75.00 44.60 6 VES12-2
J-6 Block G-2 C., Paynesville Joe Bar
313024 692922 11 69.55 64.70 6 VES14-2
J-7 Zubah Town Rehab C., Duport Road South
314570 692844 10 72.00 72.00 6*1 VES15-2
J-8 Thinkers Village Old Field C., Rehab/ Borbor Town
316481 691047 6 72.00 70.80 6 VES17-2
J-9 Kendeh Town Old Field C., Rehab/ Borbor Town
315104 689961 8 51.50 49.50 6 VES19-2
J-10 Ghengbah C., Rehab/ Borbor Town
318166 689552 5 74.00 74.00 6*1 VES21-2
J-11 Ghengbah C., Rehab/ Borbor Town
317779 689379 5 70.00 61.70 6 VES21-3
Remarks; *1; Not casing installation because of very little water producing

The Master Plan Study on Urban Facilities Restoration and Improvement in Monrovia in the Republic of Liberia
Final Report on Groundwater Development Plan in Paynesville Area
4-2
(2) Lithology and Electric Logging Result of Drilling Well The lithological log and electric logging log of J-5 to J-11 is shown in Figure 4.1-2. The feature of lithology and electric logging result of each well is summarized in Table 4.1-2 and Table 4.2-3.. As for the electric logging, normal resistivity logging AM=0.25 ft, 2.5 ft, 10ft and spontaneous potential (SP) logging is carried out.
Table 4.1-2 Feature of Lithology and Water Producing Portion During Drilling Well No.
Lithology Water Producing Potion
during Drilling Remarks
J-5 0-19m; Quaternary/Tertiary, 19-37m; Sandstone, 37-48m; Diabase, 48-75m; Gneiss
Not clear Rather little water producing
J-6 0-18m;Quaternary/Tertiary, 18-49m, Diabase, 49-69.65m; Sandstone (hard)
2.5m, 17-19m, 41m, 67m High water producing
J-7 0-19m;Quaternary/Tertiary, 19-20m; Weathered sandstone, 26-72m; Sandstone (hard) intercalated thin shale layers
Not clear Very low water producing
J-8 0-16m;Quaternary/Tertiary, 19-29m; Weathered sandstone, 29-72m; Sandstone, 68-71m; Diabase intrusion
11-13m, 24m, 39m, 67m Rather High water producing
J-9 0-7m;Quaternary/Tertiary, 7-12m; Weathered sandstone, 12-18m; Sandstone, 18-51.5m; Diabase 49-51.5m; Crackly zone
11m, 12m, 23m, 51-52m Very High water producing
J-10 0-4m;Quaternary/Tertiary, 4-74m; Diabase
Not clear Very low water producing
J-11 0-8m;Quaternary/Tertiary, 8-56m; Diabase, 56-70m; Weathered Gneiss 56-59m; Fracture zone
22m, 26m,38-52m 57m High water producing
Table 4.1-3 Electric Logging Result
Well No.
Resistivity and Spontaneous Potential (SP) Water Producing Portion by Logging Remarks
J-5 Resistivity 0-1300ohm-m, low up to 37m, becoming very high under37m SP; 0-1000mV, becoming gradually high below section
Not clear indication, Water producing portion; under 37m in Diabase. Same trend resistivity and SP (Device badness)
J-6 Resistivity; 0->1000ohm-m, 19-29m and 32-40m; high separation of each AM, 40-56m; separation SP; 0-500mV, 25-26m,38-57m; low portion
Water producing portion; 24-27m, 31-40m in Diabase
J-7 Resistivity ; 0-500ohm-m, 44-53m, 58-72m separation portion Sp; 0-1000mV, Not clear indication of low portion
Not clear indication Same trend resistivity and SP (Device badness)
Very low water producing well
J-8 Rsistivity; 0-4000ohm-m, too high indication, 25-46m; separation portion SP; Device fault
Water producing portion; 25-46m in sandstone
J-9 Resistivity; 0-1000ohm-m, high separation under 26m, but 10ft shows rather low resistivity. SP; 0-20m; uniform under 20m
Not clear indication 49-51.5m; Crackly zone
J-10 Resistivity; 0-100ohm-m, 18-69m; separation50m SP; 0-1000mV, almost uniform with high voltage
Not clear indication Same trend resistivity and SP (Device badness)
Very low water producing well
J-11 Resistivity; 0-100ohm-m, low resistivity and monotonous up to 50m, high separation under 50m SP; 0-900mV, very high under 58
Not clear indication Same trend resistivity and SP (Device badness)
56-59m; Fracture zone

4-3
The M
aster Plan Study on U
rban Facilities R
estoration and Improvem
ent in M
onrovia in the Republic of L
iberiaF
inal Report on G
roundwater D
evelopment P
lan in Paynesville A
rea
Well No. J-5 Well No. J-6 Well No. J-7 Well No. J-8
Figure 4.1-2(1) Lithological Log, Electric Ligging Log and Well Structure of Exploratory Well (1)
37
48
20
30
1
4
6
12
10
16
19
ob
sit/ s
fs
mf
40
50
Di
s/ sit
Ss
cl/ s
Ss
0
Well J-5
70
60
Gn
75
50
40
20
44.6m
20.0m
44.2m
0
10
30
23.7m
70
60
75.0m75
14''drilling
10''drilling
12''casing
Dregs
Bottom Cap
6''drilling
Gravel Pack
Grouting
6'Screen
6'casing
SP 0 10
Resisti it
AM
AM
A
1
7
18
49
10
30
cl
Di
20
Well J-60
m-cs
40
Ss
ob
50
60
69.65 70
20
60
30
40
0
10
19.8-21.3m
23.7m
10.0m
64.7m
50
44.2m
55.9m
69.65m
14''drilling
10''drilling
10&12''drilling
Grouting
Fine Cuttings
Gravel Pack
Bottom Cap
Dregs
10''casing
12''casing
6'Screen
6'casing
SP 0 50
Resisti it
A
AM
AM
A
10
47
Sh
Well J-70
70
50
60
30
5
16
2019
ob
cs2
fs
72 Sh
Ss
wSs
Ss
40
cl
26
44
72.0m
50
20
0
10
40
30
72
70
60
12.5m
14''drilling
12''casing
6''drilling
SP 0 10
Resisti it
AM
A
A
29
ms
68
10
50
20
71
Ss
Di70
Ss
wSs
16
72
ob2
Well J-80
60
40
30
70.8m
41.0m
43.9m
61.5m
70.3m
48.8m
21.5-23.0m
70
72
20
10
0
26.3m
20.0m
30
60
40
50
Fine Cuttings
Grouting
14''drilling
12''casing
10''drilling
6'Screen
Bottom Cap
Dregs
Gravel Pack
6'casing
Resistiit
AM
AM
AM

4-4
The M
aster Plan Study on U
rban Facilities R
estoration and Improvem
ent in M
onrovia in the Republic of L
iberiaF
inal Report on G
roundwater D
evelopment P
lan in Paynesville A
rea
Well No. J-9 Well No. J-10 Well No. J-11
Figure 4.1-2(2) Lithological Log, Electric Ligging Log and Well Structure of Exploratory Well (2)
11
50
51.5
49
Ss
40
30
10
20
obcl/s
ms
12
18
Di
Well J-90
cl
wSs
1
3
5
7
14.3m
17.3m
51.5m
31.9m
51.5
30
9.0-10.0m
40
20
0
10
7.0m
49.5m
37.8m
11.4m
50
14''drilling
10''drilling
Grouting
Fine Cuttings
Gravel Pack
Bottom Cap
Dregs
12''casing
6'Screen
SP 0 10
Resisti it
AM
A
A
11
70
Di
4
30
20
ob
m-cs1
Well J-100
10
40
50
60
74
70
60
4.0m
40
50
30
0
10
20
74.0m74
14''drilling
12''casing
6''drilling
SP 0 10
Resistivity
AM
A
A
Resisti it
30
40
wGn
70
50
60
56
59
Di
Well J-110
10
20
cl
ob
ms1
4
8
12.0-13.5m
17.3m
20.2m
23.2m
31.9m
52.5m
58.3m
67.1m
37.8m
60
70
30
40
50
0
10
20
8.0m
10''drilling
Bottom Cap
Dregs
6'casing
6'Screen
14''drilling
12''casing
Fine Cuttings
SP 0 10
A
A
A
ob Overburden
cl Clay
sit Silt
cl/s Clay with sand
sil/ s Silt with sand
s Sand
fs Fine sand
ms Medium sand
m-cs Medium to coarse sand
Sh Shale
Ss Sandstone
wDi Weathered diabase
Di Diabase
wGn Weathered gneiss
Gn Melanocratic gneiss
Fracture zone
Water Tap PortionColored Water Portion
LEGEND
Resistivity AM=0.25ft
Resistivity AM=2.5ft
Resistivity AM=10ft
Spontaneous Potential

The Master Plan Study on Urban Facilities Restoration and Improvement in Monrovia in the Republic of Liberia
Final Report on Groundwater Development Plan in Paynesville Area
4-5
(3) Screen and Casing Installation, Gravel Packing and Grouting The well structure of J-5 to J-11 is shown in Figure 4.1-2. The quantity of drilling work is shown in Table 4.1-4. The screen of each well is installed in consideration of lithology, electric logging result and water tapping situation under drilling. J-7 and J-10 remain with the situation of precedence drilling by 6”, and not installation of casing and screen, because of little amount of water under drilling work. The 12” temporary casing for protection of well mouth portion still remains, and well head concrete slab and cover is installed. Although it tried to perform a backfill, there is a strong request of landowner to leave a well and this remaining procedure was performed at J-7 and J-10 well site.
Table 4.1-4 Quantity of Main Items of Exploratory Well Drilling Work Item J-5 J-6 J-7 J-8 J-9 J-10 J-11 Total
Drilling Total depth (m) 75.00 69.55 72.00 72.00 51.50 74.00 70.00 484.05Well Completion Total depth (m) 44.60 64.00 72.00 70.80 49.50 74.00 61.70 436.60Drilling diameter (“) 10 10 6 10 10 6 10 Casing diameter (“) 6 6 6 6 6 6 6 Casing length (m) 23.9 34.3 41.1 22.8 28.9 273.6Screen length (m) 21.0 30.0 30.0 27.0 33.0 163.0Gravel packing (m) 20.9 43.4 44.5 38.1 53.6 200.5Grouting length (m) 21.0 20.0 22.0 9.0 12.0 24.0

The Master Plan Study on Urban Facilities Restoration and Improvement in Monrovia in the Republic of Liberia
Final Report on Groundwater Development Plan in Paynesville Area
4-6
4.2 Pumping Test The pumping test (Pre-pumping test, Multi-stage pumping test, 72 hours constant discharge pumping test, and Recovery test) is carried out after well development at each exploratory well. (1) Multi-stage Pumping Test
The summary of the recording result of multi-stage pumping test is shown in Table 4.2-1.
Table 4.2-1 Summary of Recording Result of Multi Stage Pumping Test Well No.
Initial Water Level (m)
Stage Yield
(L/min) Pumping
Duration (min)Drawdown
(m) Remarks
1 18 120 4.12 2 30 240 8.30 3 51 360 18.84 4 68 385 30.83
J-5 4.03
5
Depth of pump set: 41.6m, Remarkable drawdown at stage 4
1 74 120 1.45 2 148 240 2.77 3 222 360 4.40 4 296 480 6.75
J-6 5.03
5 365 600 8.84
Depth of pump set: 42.1m
1 4 120 2.98 2 8 240 7.56 3 12 360 16.21 4 16 480 25.54
J-7 5.48
5
Depth of pump set: 40.7m, Remarkable drawdown at stage 4
1 74 120 4.68 2 150 240 10.29 3 225 360 14.52 4 300 480 20.05
J-8 2.37
5 373 600 23.06
Depth of pump set: 41.7m
1 76 120 0.32 2 150 240 0.54 3 225 360 0.82 4 300 480 1.15
J-9 1.83
5 375 600 1.51
Depth of pump set: 41.9m
1 6 60 3.98 2 8 240 13.24 J-10 0.83
Preliminary Test Depth of pump set: 34.7m
1 75 120 1.24 2 150 240 3.27 3 225 360 6.01 4 300 480 8.58
J-11 1.94
5 375 600 12.90
Depth of pump set: 41.8m
The drawdown (s)–time (t) graph and the drawdown (s)–yield (Q) graph of the multi-stage pumping test are shown in Figure 4.2-2. The maximum yield and the optimum yield of the each exploratory well estimated from the results of the multi-stage pumping test are shown in Table 4.2-2. The optimum yield is obtained mechanically using the inflection point on the multi-stage pumping test drawdown (s)-yield (Q) curve, such as 42 L/min in J-5, 220 L/min in J-6, 8 L/min in J-7, 200 L/min in J-9, 200L/min in J-9, 8L/min in J-10, 300L/min in J-11 and so on. But J-6, J-11, especially J-9 shows low drawdown. Though J-8 indicates gradually rather large drawdown according to increasing yield, the inflection point is not clear. In case like this situation, it is necessary to calculate optimum yield or safety yield under a condition of fixed drawdown. The following condition is applied in this report to obtain the calculated optimum yield.

The Master Plan Study on Urban Facilities Restoration and Improvement in Monrovia in the Republic of Liberia
Final Report on Groundwater Development Plan in Paynesville Area
4-7
Table 4.2-2 Maximum Yield, and Optimum Yield Obtained by Inflection Point on s-Q Curve Well No. Maximum Yield Optimum Yield
J-5 < 51 L/min 42 L/min J-6 > 365 L/min ( 220 L/min ) J-7 < 16 L/min 8 L/min J-8 > 373 L/min Not clear J-9 > 375 L/min ( 200L/min ) J-10 < 11 L/min 8 L/min J-11 > 375 L/min (300L/min)
Remarks; ( ) shows uncertain because of low drawdown
1) The yield that can pump up during 8 hours pumping per day with 10 m drawdown in ordinary wells
2) The yield that can pump up during 8 hours pumping per day with 5m drawdown in high water producing well
This setting is a procedure to formulate safety plan for groundwater development. The paragraph 2) is considered not to estimate exceed capacity per well on planning because of not confirmation of large yield pumping condition. The calculated safety yield of each well is shown in Table 4.2-3. The calculation is carried out under confined aquifer condition and using hydraulic parameters obtained constant discharge pumping test (Refer to Paragraph (2)).
Table 4.2-3 Calculated Safety Yield Safety Yield
Well No. L/ min m3/ day (in case of 8hours pumping)
J-5 38 18 J-6 355 170 J-7 7 3.4 J-8 183 88 J-9 1236 593 J-10 4 1.9 J-11 336 161

The Master Plan Study on Urban Facilities Restoration and Improvement in Monrovia in the Republic of Liberia
Final Report on Groundwater Development Plan in Paynesville Area
4-8
0.00
5.00
10.00
15.00
20.00
25.00
30.00
35.00
40.00
0 50 100 150 200 250 300 350 400 450 500 550 600t(min)
s(m) 18L/min
30L/min
68L/min
51L/min
18, 4.29
30, 8.03
51, 18.84
68, 35.04
1 .00
10 .00
100 .00
10 100 1000Q( lit/min)
s(m)
0.00
2.00
4.00
6.00
8.00
10.00
0 50 100 150 200 250 300 350 400 450 500 550 600t(min)
s(m) 74L/min
148L/min
296L/min
222L/min
365L/min
74, 1.45
148, 2.77
222, 4.40
296, 6.75
365, 8.84
1 .00
10 .00
100 .00
10 100 1000Q(lit/min)
s(m)
0.00
5.00
10.00
15.00
20.00
25.00
30.00
0 50 100 150 200 250 300 350 400 450 500 550 600t(min)
s(m)
4L/min8L/min
16L/min
12L/min
4, 2.98
8, 7.56
12, 16.21
16, 26.54
1 .00
10 .00
100 .00
1 10 100Q(lit/min)
s(m)
0.00
5.00
10.00
15.00
20.00
25.00
0 50 100 150 200 250 300 350 400 450 500 550 600t(min)
s(m)74L/min
150L/min
300L/min
225L/min
373L/min
74, 4.68
150, 10.29
225, 14.52
300, 20.05
373, 23.06
1 .00
10 .00
100 .00
10 100 1000Q(lit/min)
s(m)
Well No. J-5 Drawdown (s) – Time (t) Drawdown (Log s) – Yield (Log Q)
Well No. J-6 Drawdown (s) – Time (t) Drawdown (Log s) – Yield (Log Q)
Well No. J-7 Drawdown (s) – Time (t) Drawdown (Log s) – Yield (Log Q)
Well No. J-8 Drawdown (s) – Time (t) Drawdown (Log s) – Yield (Log Q)
Figure 4.2-1(1) Multi-stage Pumping Test Graph (1)
The Master Plan Study on Urban Facilities Restoration and Improvement in Monrovia in the Republic of Liberia
Final Report on Groundwater Development Plan in Paynesville Area
4-9
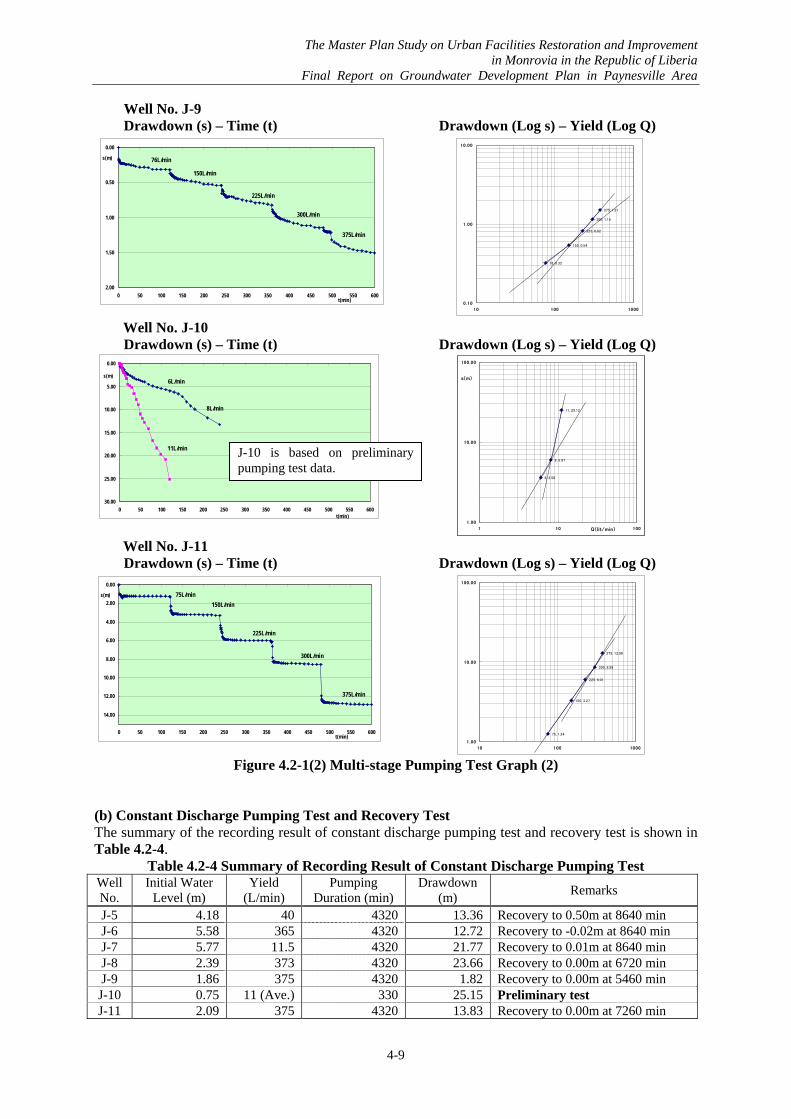
Well No. J-9 Drawdown (s) – Time (t) Drawdown (Log s) – Yield (Log Q)
Well No. J-10 Drawdown (s) – Time (t) Drawdown (Log s) – Yield (Log Q)
Well No. J-11 Drawdown (s) – Time (t) Drawdown (Log s) – Yield (Log Q)
Figure 4.2-1(2) Multi-stage Pumping Test Graph (2) (b) Constant Discharge Pumping Test and Recovery Test The summary of the recording result of constant discharge pumping test and recovery test is shown in Table 4.2-4.
Table 4.2-4 Summary of Recording Result of Constant Discharge Pumping Test Well No.
Initial Water Level (m)
Yield (L/min)
Pumping Duration (min)
Drawdown (m)
Remarks
J-5 4.18 40 4320 13.36 Recovery to 0.50m at 8640 min J-6 5.58 365 4320 12.72 Recovery to -0.02m at 8640 min J-7 5.77 11.5 4320 21.77 Recovery to 0.01m at 8640 min J-8 2.39 373 4320 23.66 Recovery to 0.00m at 6720 min J-9 1.86 375 4320 1.82 Recovery to 0.00m at 5460 min J-10 0.75 11 (Ave.) 330 25.15 Preliminary test J-11 2.09 375 4320 13.83 Recovery to 0.00m at 7260 min
0.00
0.50
1.00
1.50
2.00
0 50 100 150 200 250 300 350 400 450 500 550 600t(min)
s(m) 76L/min
150L/min
300L/min
225L/min
375L/min
76, 0.32
150, 0.54
225, 0.82
300, 1.15
375, 1.51
0 .10
1 .00
10 .00
10 100 1000
0.00
2.00
4.00
6.00
8.00
10.00
12.00
14.00
0 50 100 150 200 250 300 350 400 450 500 550 600t(min)
s(m) 75L/min
150L/min
300L/min
225L/min
375L/min
75, 1.24
150, 3.27
225, 6.01
300, 8.58
375, 12.90
1 .00
10 .00
100 .00
10 100 1000
6, 3.58
8, 5.97
11, 25.12
1 .00
10 .00
100 .00
1 10 100Q(lit/min)
s(m)
6, 3.58
8, 5.97
11, 25.12
1 .00
10 .00
100 .00
1 10 100Q(lit/min)
s(m)
0.00
5.00
10.00
15.00
20.00
25.00
30.00
0 50 100 150 200 250 300 350 400 450 500 550 600t(min)
s(m)6L/min
8L/min
11L/min J-10 is based on preliminary pumping test data.

The Master Plan Study on Urban Facilities Restoration and Improvement in Monrovia in the Republic of Liberia
Final Report on Groundwater Development Plan in Paynesville Area
4-10
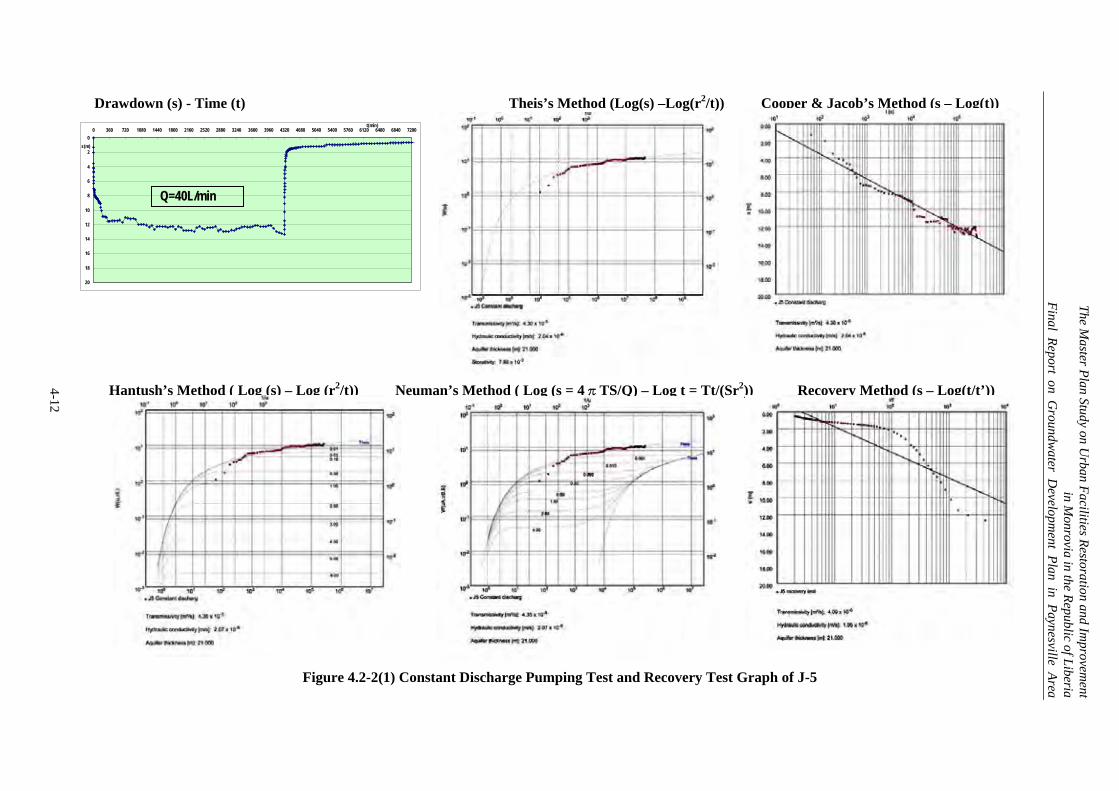
The drawdown(s)-time(t) graph, Theis’s method graph, Cooper & Jacob’s method graph, Hantush’s method graph, Neuman’s Method and Recovery method graph of the constant discharge pumping test and recovery test are shown in Figure 4.2-2 (1) to 4.2-2 (7). The estimation of hydraulic parameter by various methods is carried out using the software “Aquifer Test for Windows Version 2.56 of Waterloo Hydrogeologic Inc.”. The obtained values of hydraulic parameters by various methods are shown in Table 4.2-5. In each well, a set hydraulic parameter value, which indicates most suitable mating with standard curve or line among various method, is selected as an applied value of the well. The selected hydraulic parameter of the constant discharge pumping test and recovery test is shown in Table 4.2-6. Table 4.2-5 Hydraulic Parameters of Each Exploratory Well Obtained from Various Methods
Item J-5 J-6 J-7 J-8 Theis’s method 4.30 x 10⁻⁵ 4.31 x 10⁻⁴ 4.03 x 10⁻⁶ 2.91 x 10⁻⁴
Cooper & Jacob’s method 4.30 x 10⁻⁵ 3.02 x 10⁻⁴ 4.68 x 10⁻⁶ 4.72 x 10⁻⁴
Hantash’s method 4.36 x 10⁻⁵ 4.31 x 10⁻⁴ 4.03 x 10⁻⁶ 2.91 x 10⁻⁴
Neuman’s method 4.36 x 10⁻⁵ 2.16 x 10⁻⁴ 4.03 x 10⁻⁶ 2.93 x 10⁻⁴
Transmissivity (m3/sec/m)
Recovery method 4.09 x 10⁻⁵ 2.42 x 10⁻⁶ 6.56 x 10⁻⁶ 2.78 x 10⁻⁴
Theis’s method 7.86 x 10⁻² 7.33 x 10⁻¹ 1.23 x 100 1.97 x 10⁻³
Cooper & Jacob’s method 8.41 x 100 6.62 x 10⁻¹ 1.02 x 10⁻⁶
Hantash’s method 7.50 x 10⁻¹ 1.23 x 100 1.97 x 10⁻³
Storativity
Neuman’s method 2.98 x 10⁻³ 1.38 x 10⁻⁴ 1.82 x 10⁻³
Theis’s method 2.04 x 10⁻⁶ 1.59 x 10⁻⁵ 6.77 x 10⁻⁸ 9.71 x 10⁻⁶
Cooper & Jacob’s method 2.04 x 10⁻⁶ 1.12 x 10⁻⁵ 7.87 x 10⁻⁸ 1.57 x 10⁻⁵
Hantash’s method 2.07 x 10⁻⁶ 1.59 x 10⁻⁵ 6.77 x 10⁻⁸ 9.71 x 10⁻⁶
Neuman’s method 2.07 x 10⁻⁶ 8.00 x 10⁻⁶ 6.77 x 10⁻⁸ 9.77 x 10⁻⁶
Permeability Coefficient (m/sec)
Recovery method 1.95 x 10⁻⁶ 8.98 x 10⁻⁶ 1.10 x 10⁻⁷ 9.28 x 10⁻⁶
Item J-9 J-10 J-11 Remarks Theis’s method 2.44 x 10⁻³ 5.07 x 10⁻⁶ 3.72 x 10⁻⁴
Cooper & Jacob’s method 2.05 x 10⁻³ 6.19 x 10⁻⁶ 1.32 x 10⁻⁴ Hantash’s method 2.44 x 10⁻³ 5.07 x 10⁻⁶ 3.72 x 10⁻⁴
Neuman’s method 2.44 x 10⁻³ 4.02 x 10⁻⁶ 3.72 x 10⁻⁴
Transmissivity (m3/sec/m)
Recovery method 2.29 x 10⁻³ 3.46 x 10⁻⁶ 1.89 x 10⁻³ Theis’s method 1.57 x 101 6.66 x 10⁻¹ 6.67 x 10⁻³
Cooper & Jacob’s method 2.86 x 101 5.56 x 10⁻¹ 1.87 x 10⁻¹¹
Hantash’s method 1.57 x 101 7.68 x 10⁻¹ 6.67 x 10⁻³
Storativity
Neuman’s method 1.57 x 101 9.41 x 10⁻¹ 6.67 x 10⁻³
Theis’s method 5.05 x 10⁻⁶ 1.87 x 10⁻⁷ 1.03 x 10⁻⁵
Cooper & Jacob’s method 8.15 x 10⁻⁶ 9.38 x 10⁻⁸ 3.68 x 10⁻⁵
Hantash’s method 6.83 x 10⁻⁶ 7.68 x 10⁻⁶ 1.03 x 10⁻⁵
Neuman’s method 8.15 x 10⁻⁶ 6.10 x 10⁻⁶ 1.03 x 10⁻⁵
Permeability Coefficient (m/sec)
Recovery method 8.15 x 10⁻⁶ 5.25 x 10⁻⁸ 5.26 x 10⁻⁵
Table 4.2-6 Selected Hydraulic Parameter of Each Exploratory Well
Transmissivity Well No. (m3/sec/m) (m3/day/m)
Storativity Permeability Coefficient (m/sec)
J-5 4.30 x 10⁻⁵ 3.71 7.86 x 10⁻² 2.04 x 10⁻⁶ J-6 4.31 x 10⁻⁴ 37.2 7.33 x 10⁻¹ 1.59 x 10⁻⁵ J-7 4.03 x 10⁻⁶ 0.35 1.38 x 10⁻⁴ 6.77 x 10⁻⁸ J-8 2.91 x 10⁻⁴ 25.1 1.97 x 10⁻³ 9.71 x 10⁻⁶ J-9 2.44 x 10⁻³ 211 1.57 x 10 1.16 x 10⁻⁴
J-10 5.07 x 10⁻⁶ 0.44 6.66 x 10⁻¹ 1.87 x 10⁻⁷ J-11 3.72 x 10⁻⁴ 32.1 1.03 x 10⁻⁵ 1.03 x 10⁻⁵
About selected hydraulic parameter from pumping test has still irregular with a extremely high

The Master Plan Study on Urban Facilities Restoration and Improvement in Monrovia in the Republic of Liberia
Final Report on Groundwater Development Plan in Paynesville Area
4-11
storativity or low strativity, and sometimes there is not reproducibility on check calculation getting the last drawdown in 72 hours pumping test. The adjusted hydraulic parameter which is examined by calculation to become the last drawdown of the constant discharge pumping test under same condition of yield and pumping duration is shown in Table 4.2-7 together with yield which becomes 5m, 10m and 20m drawdown by 8hours pumping per day. The yield which gives 5m or 10m drawdown by 8 hours pumping par day is considered as a safety yield on ground water development planning,
Table 4.2-7 Adjusted Hydraulic Parameter, and Yield at Drawdown 5m, 10m and 15m Transmissivity Yield per each drawdown (s)
(L/min) Well No. (m3/sec/m) (m3/day/m)
Storativity Permeability Coefficient
(m/sec) s=5m s=10m S=20m J-5 4.30 x 10⁻⁵ 3.71 8.6 x 10⁻² 2.04 x 10⁻⁶ 18.8 37.6 75.2 J-6 4.31 x 10⁻⁴ 37.2 5.2 x 10⁻¹ 1.59 x 10⁻⁵ 178 355 712 J-7 7.50 x 10⁻⁶ 0.35 9.0 x 10⁻² 3.53 x 10⁻⁷ 3.4 6.8 13.6 J-8 2.91 x 10⁻⁴ 25.1 1.9 x 10⁻² 9.71 x 10⁻⁶ 91 183 365 J-9 3.65 x 10⁻³ 315 6.0 x 10⁻¹ 1.74 x 10⁻⁴ 1236 J-10 5.07 x 10⁻⁶ 0.44 3.6 x 10⁻³ 1.87 x 10⁻⁷ 2.0 4.0 7.9 J-11 4.07 x 10⁻⁴ 35.2 5.0 x 10⁻¹ 1.03 x 10⁻⁵ 168 336 672
The M
aster Plan Study on U
rban Facilities R
estoration and Improvem
ent in M
onrovia in the Republic of L
iberiaF
inal Report on G
roundwater D
evelopment P
lan in Paynesville A
rea
4-12
Drawdown (s) - Time (t) Theis’s Method (Log(s) –Log(r2/t)) Cooper & Jacob’s Method (s – Log(t)) Hantush’s Method ( Log (s) – Log (r2/t)) Neuman’s Method ( Log (s = 4πTS/Q) – Log t = Tt/(Sr2)) Recovery Method (s – Log(t/t’))
Figure 4.2-2(1) Constant Discharge Pumping Test and Recovery Test Graph of J-5
0
2
4
6
8
10
12
14
16
18
20
0 360 720 1080 1440 1800 2160 2520 2880 3240 3600 3960 4320 4680 5040 5400 5760 6120 6480 6840 7200t(min)
s(m)
Q=40L/min

The M
aster Plan Study on U
rban Facilities R
estoration and Improvem
ent in M
onrovia in the Republic of L
iberiaF
inal Report on G
roundwater D
evelopment P
lan in Paynesville A
rea
4-13
0
2
4
6
8
10
12
14
16
18
20
0 360 720 1080 1440 1800 2160 2520 2880 3240 3600 3960 4320 4680 5040 5400 5760 6120 6480 6840 7200t(min)
s(m)
Drawdown (s) - Time (t) Theis’s Method (Log(s) –Log(r2/t)) Cooper & Jacob’s Method (s – Log(t)) Hantush’s Method ( Log (s) – Log (r2/t)) Neuman’s Method ( Log (s = 4πTS/Q) – Log t = Tt/(Sr2)) Recovery Method (s – Log(t/t’))
Figure 4.2-2(2) Constant Discharge Pumping Test and Recovery Test Graph of J-6
Q=365L/min

The M
aster Plan Study on U
rban Facilities R
estoration and Improvem
ent in M
onrovia in the Republic of L
iberiaF
inal Report on G
roundwater D
evelopment P
lan in Paynesville A
rea
4-14
0
2
4
6
8
10
12
14
16
18
20
22
24
0 360 720 1080 1440 1800 2160 2520 2880 3240 3600 3960 4320 4680 5040 5400 5760 6120 6480 6840 7200t(min)
s(m)
Drawdown (s) - Time (t) Theis’s Method (Log(s) –Log(r2/t)) Cooper & Jacob’s Method (s – Log(t)) Hantush’s Method ( Log (s) – Log (r2/t)) Neuman’s Method ( Log (s = 4πTS/Q) – Log t = Tt/(Sr2)) Recovery Method (s – Log(t/t’))
Figure 4.2-2(3) Constant Discharge Pumping Test and Recovery Test Graph of J-7
Q=11.5L/min

The M
aster Plan Study on U
rban Facilities R
estoration and Improvem
ent in M
onrovia in the Republic of L
iberiaF
inal Report on G
roundwater D
evelopment P
lan in Paynesville A
rea
4-15
0
2
4
6
8
10
12
14
16
18
20
22
24
26
28
30
0 360 720 1080 1440 1800 2160 2520 2880 3240 3600 3960 4320 4680 5040 5400 5760 6120 6480 6840 7200t(min)
Drawdown (s) - Time (t) Theis’s Method (Log(s) –Log(r2/t)) Cooper & Jacob’s Method (s – Log(t)) Hantush’s Method ( Log (s) – Log (r2/t)) Neuman’s Method ( Log (s = 4πTS/Q) – Log t = Tt/(Sr2)) Recovery Method (s – Log(t/t’))
Figure 4.2-2 (4) Constant Discharge Pumping Test and Recovery Test Graph of J-8
Q=372.6L/min

The M
aster Plan Study on U
rban Facilities R
estoration and Improvem
ent in M
onrovia in the Republic of L
iberiaF
inal Report on G
roundwater D
evelopment P
lan in Paynesville A
rea
4-16
Drawdown (s) - Time (t) Theis’s Method (Log(s) –Log(r2/t)) Cooper & Jacob’s Method (s – Log(t)) Hantush’s Method ( Log (s) – Log (r2/t)) Neuman’s Method ( Log (s = 4πTS/Q) – Log t = Tt/(Sr2)) Recovery Method (s – Log(t/t’))
Figure 4.2-2(5) Constant Discharge Pumping Test and Recovery Test Graph of J-9
0.00.10.20.30.40.50.60.70.80.91.01.11.21.31.41.51.61.71.81.92.0
0 360 720 1080 1440 1800 2160 2520 2880 3240 3600 3960 4320 4680 5040 5400 5760 6120 6480 6840 7200t(min)
Q=375L/min

The M
aster Plan Study on U
rban Facilities R
estoration and Improvem
ent in M
onrovia in the Republic of L
iberiaF
inal Report on G
roundwater D
evelopment P
lan in Paynesville A
rea
4-17
0.00
5.00
10.00
15.00
20.00
25.00
30.00
0 50 100 150 200 250 300 350 400 450 500 550 600t(min)
s(m)6L/min
8L/min
Drawdown (s) - Time (t) Theis’s Method (Log(s) –Log(r2/t)) Cooper & Jacob’s Method (s – Log(t)) Hantush’s Method ( Log (s) – Log (r2/t)) Neuman’s Method ( Log (s = 4πTS/Q) – Log t = Tt/(Sr2)) Recovery Method (s – Log(t/t’))
Figure 4.2-2(6) Constant Discharge Pumping Test and Recovery Test Graph of J-10

The M
aster Plan Study on U
rban Facilities R
estoration and Improvem
ent in M
onrovia in the Republic of L
iberiaF
inal Report on G
roundwater D
evelopment P
lan in Paynesville A
rea
4-18
0
2
4
6
8
10
12
14
16
18
20
0 360 720 1080 1440 1800 2160 2520 2880 3240 3600 3960 4320 4680 5040 5400 5760 6120 6480 6840 7200t(min)
s(m)
Drawdown (s) - Time (t) Theis’s Method (Log(s) –Log(r2/t)) Cooper & Jacob’s Method (s – Log(t)) Hantush’s Method ( Log (s) – Log (r2/t)) Neuman’s Method ( Log (s = 4πTS/Q) – Log t = Tt/(Sr2)) Recovery Method (s – Log(t/t’))
Figure 4.2-2(7) Constant Discharge Pumping Test and Recovery Test Graph of J-11
Q=375L/min

The Master Plan Study on Urban Facilities Restoration and Improvement in Monrovia in the Republic of Liberia
Final Report on Groundwater Development Plan in Paynesville Area
4-19
D
65%
P,D
35%
P
0%
P
P,D
D
Max. 14 Max. 10.58 Max. 6.77 Max. 11.60
Min. 8 Min. 1.68 Min. 0.01 Min. 5.16
Average 11 Average 5.24 Average 2.02 Average 8.41
Median 11 Median 4.99 Median 1.44 Median 7.99
Mode 12 Mode 3.90 Mode 0.33 Mode ー
Total N 37 Total N 35 Total N 35 Total N 35
Well Dimension
Ground Hight (m) Total Depth (m) Water Level (m) WL(Elevation, m)
Max. 1500 Max. 20.0
Min. 8 Min. 3.0
Average 346 Average 13.7 Average 4,744
Median 500 Median 15.0
Mode 500 Mode 15.0
Total N 37 Total N 37
Person/ Well
Water Use
Vol./ P. (Gal/day) T. Volume (Well, Gal/day))
Max. 29.9 Max. 6.88 Max. 0.720 Max. 191.0 Max. 33.5
Min. 27.0 Min. 4.20 Min. 0.035 Min. 22.0 Min. 0.0
Average 28.0 Average 5.72 Average 0.151 Average 75.4 Average 6.1
Median 27.9 Median 6.05 Median 0.106 Median 66.0 Median 4.4
Mode 27.4 Mode 6.17 Mode 0.058 Mode 49.0 Mode 0.0
Total N 37 Total N 37 Total N 37 Total N 37 Total N 37
TDS(mg/L) Turbidity (NTU)
Water Quolity
Temp. (oC) pH EC (mS/cm)
Dug+B
38%
Dug+D
0%Dug
3%
Dug+M
0%
Dug+C
51%
Drillrd Well
0%
Drilled W/HP
0%
Dug+C/HP
8%
Dug
Dug+D
Dug+B
Dug+M
Dug+C
Dug+C/HP
Drillrd Well
Drilled W/HP
4.3 Shallow Wells Situation and Influence during Pumping Test (1) Shallow Wells Situation surrounding Exploratory Wells The Inventory records of surrounding wells of each exploratory drilling site and an area along central low hills formed by diabase intrusion is shown in APPENDIX 1. The feature of shallow wells’ structure, water use and situation of quality as resident consciousness in a) north west part of the study area, b) central and south west part of the study area and c) diabase intrusion area is as follows. 1) Shallow Wells in North West Part of the Study Area a) Well structure and water level Dug wells with concrete cover or block cover reach to 89%. The diffusion rate of hand pump is rather low. Dug well with hand pump is 8% and drilled well with hand pump is 0%. Diameter of Dug wells is 0.8 to 1.2m, total depth is 1.7 to 10.6m, average 5.2m. Water level is 0.0 to 6.8m, average 2.0m. Table 4.3-1 Well Dimension in North West Part
Figure 4.3-1 Well Structure in North West Part
b) Groundwater use Drinking water use including domestic water use is 35%, 65% of wells can not use as drilling water. Average water use per well is 13.7 gallon/ day/ person. Average total volume of water use per well is 4,744 gallon/ day. Table 4.3-2 Water Use Volume of Well in North West Part Figure 4.3-2 Use of Water in North West Part c) Dry-up Condition and Quality of groundwater Dry up well in dry season is 24%, and well in which water level goes down in dry season is 41%. 35% of wells are not recognized any dry up situation. The water quality or problem as resident consciousness is as follows.
i) 27% of wells has bad water quality situation such as cloudy water (8%), colored water (14%), and dirty water (5%).
ii) Contamination such as dust/ leaves/ rubbish blowing in and odor is felt in 52% of wells.
Table 4.3-3 Water Quality of Wells in North West Part (by Field Measurement)

The Master Plan Study on Urban Facilities Restoration and Improvement in Monrovia in the Republic of Liberia
Final Report on Groundwater Development Plan in Paynesville Area
4-20
Clean
48%
Other
Contamination
52%
Oil
Contamination
0%
Oil Contamination
Other Contamination
Clean
Dug+B
20%
Dug+D
0%Dug
0%
Dug+M
0%
Dug+C
80%
Drillrd Well
0%
Drilled W/HP
0%
Dug+C/HP
0% Dug
Dug+D
Dug+B
Dug+M
Dug+C
Dug+C/HP
Drillrd Well
Drilled W/HP
D
79%
P,D
19%
P
2%P
P,D
D
Tadpol, Worm
0%Odor
4%
Foamy
0%Rusty
0%
Dust, Leaves
83%
Rubbish
13%
Muddy
0%
Dust, Leaves
Rubbish
Muddy
Rusty
Foamy
Tadpol, Worm
Odor
Colored
14%
Cloudy
8%
Clean
73%
Dirty
5%
Salty
0%
Clean
Cloudy
Colored
Dirty
Salty
Not dry
35%
WL_Down-DS
41%
Dry-DS
24%
Dry-Up
0%
Dry-Up
Dry-DS
WL_Down-DS
Not dry
Max. 10 Max. 6.92 Max. 2.69 Max. 8.90
Min. 4 Min. 1.06 Min. 0.06 Min. 2.93
Average 6 Average 4.07 Average 0.71 Average 5.61
Median 6 Median 3.89 Median 0.46 Median 5.19
Mode 6 Mode 4.30 Mode 0.10 Mode ー
Total N 41 Total N 41 Total N 41 Total N 41
Well Dimension
Ground Hight (m) Total Depth (m) Water Level (m) WL(Elevation, m)
Max. 500 Max. 20.0
Min. 9 Min. 3.0
Average 162 Average 12.9 Average 2,091
Median 50 Median 15.0
Mode 50 Mode 15.0
Total N 40 Total N 40
Water Use
Vol./ P. (Gal/day) T. Volume (Well, Gal/day))Person/ Well
Figure 4.3-3 Dry up Situation and Water Quality Consciousness in North West Part 2) Shallow Wells in Central and South East Part of the Study Area a) Well structure and water level Dug wells with concrete cover or block cover reach to 100%. The diffusion rate of hand pump is very low, especially in south east part of the study area. Diameter of dug wells is 0.8 to 1.2m, total depth is 1.1 to 6.9m, average 4.1m. Water level is 0.1 to 2.7m, average 0.7m. Table 4.3-4 Well Dimension in Central and South East Part
Figure 4.3-4 Well Structure in Central and South East Part b) Groundwater use Drinking water use including domestic water use is 21%, 79% of wells can not use as drilling water. Average water use per well is 12.9 gallon/ day/ person. Average total volume of water use per well is 2,091 gallon/ day. Table 4.3-5 Water Use Volume of Well in Central and South East Part Figure 4.3-5 Purpose of Water Use in Central and South East Part c) Dry-up Condition and Quality of groundwater Dry up well in dry season is 20%, and well in which water level goes down in dry season is 24%. 56% of wells is not recognized any dry up situation. The water quality or problem as resident consciousness is as follows.
i) 62% of wells has bad water quality situation such as cloudy water(7%), colored water (46%), dirty water (7%) and salty water (2%).

The Master Plan Study on Urban Facilities Restoration and Improvement in Monrovia in the Republic of Liberia
Final Report on Groundwater Development Plan in Paynesville Area
4-21
Not dry
56%
WL_Down-DS
24%
Dry-DS
20%Dry-Up
0%
Dry-Up
Dry-DS
WL_Down-DS
Not dry
Colored
46%
Cloudy
7%
Clean
38%Dirty
7%
Salty
2%
Clean
Cloudy
Colored
Dirty
Salty
Clean
46%
Other
Contamination
54%
Oil
Contamination
0%
Oil Contamination
Other Contamination
Clean
Tadpol, Worm
4%Odor
4%
Foamy
4%
Rusty
13%
Dust, Leaves
53%Rubbish
4%
Muddy
18%
Dust, Leaves
Rubbish
Muddy
Rusty
Foamy
Tadpol, Worm
Odor
Max. 31.3 Max. 8.37 Max. 1.000 Max. 641.0 Max. 77.0
Min. 21.6 Min. 4.94 Min. 0.024 Min. 15.0 Min. 0.0
Average 27.8 Average 6.76 Average 0.265 Average 171.5 Average 12.7
Median 28.0 Median 6.85 Median 0.216 Median 140.0 Median 10.6
Mode 28.1 Mode 6.85 Mode 0.216 Mode 140.0 Mode 0.0
Total N 41 Total N 41 Total N 41 Total N 41 Total N 41
pH EC (mS/cm) TDS(mg/L) Turbidity (NTU)
Water Quolity
Temp. (oC)
Dug+B
61%
Dug+D
0%
Dug
0%
Dug+M
0%
Dug+C
29%
Drillrd Well
0%Drilled W/HP
5%Dug+C/HP
5%
Dug
Dug+D
Dug+B
Dug+M
Dug+C
Dug+C/HP
Drillrd Well
Drilled W/HP
Max. 27 Max. 12.20 Max. 7.69 Max. 21.95
Min. 6 Min. 3.20 Min. 0.30 Min. 4.45
Average 11 Average 6.83 Average 2.97 Average 8.26
Median 10 Median 7.43 Median 2.40 Median 7.83
Mode 8 Mode 7.85 Mode - Mode ー
Total N 24 Total N 24 Total N 20 Total N 20
Well Dimension
Ground Hight (m) Total Depth (m) Water Level (m) WL(Elevation, m)
ii) Contamination such as dust/ leaves/ rubbish blowing in, muddy/ rusty/ foamy situation, tadpole/ worm generation, and odor is felt in 54% of wells.
Table 4.3-6 Water Quality of Wells in Central and South East Part (by Field Measurement)
Figure 4.3-6 Dry up Situation and Water Quality Consciousness in Central and South East Part 3) Shallow Wells in Diabase Intrusion Area a) Well structure and water level Dug wells with concrete cover or block cover reach to 90%. The diffusion rate of hand pump is low. Dug well with hand pump is 5% and drilled well with hand pump is also 5%. Diameter of Dug wells is 0.8 to 1.2m, total depth is 3.2 to 12.2m, average 6.8m. Water level is 0.3 to 7.7m, average 3.0m. Table 4.3-7 Well Dimension in Diabase Intrusion Area Figure 4.3-7 Well Structure in Diabase Intrusion Area b) Groundwater use Drinking water use including domestic water use is only 50%, 50% of wells can not use as drilling water. Average water use per well is 14.7 gallon/ day/ person. Average total volume of water use per well is 6,420 gallon/ day.

The Master Plan Study on Urban Facilities Restoration and Improvement in Monrovia in the Republic of Liberia
Final Report on Groundwater Development Plan in Paynesville Area
4-22
Max. 500 Max. 15.0
Min. 25 Min. 8.0
Average 436 Average 14.7 Average 6,420
Median 500 Median 15.0
Mode 500 Mode 15.0
Total N 24 Total N 24
Water Use
Vol./ P. (Gal/day) T. Volume (Well, Gal/day))Person/ Well
Max. 29.0 Max. 7.52 Max. 0.215 Max. 94.0 Max. 19.0
Min. 26.1 Min. 4.85 Min. 0.016 Min. 0.0 Min. 3.0
Average 27.3 Average 5.74 Average 0.059 Average 23.8 Average 2.0
Median 27.2 Median 5.67 Median 0.052 Median 16.0 Median 0.0
Mode 26.8 Mode 5.70 Mode 0.040 Mode 8.0 Mode 0.0
Total N 24 Total N 24 Total N 24 Total N 24 Total N 24
Temp. (oC) pH EC (mS/cm) TDS(mg/L) Turbidity (NTU)
Water Quolity
Not dry
29%
WL_Down-DS
21%
Dry-DS
50%
Dry-Up
0%Dry-Up
Dry-DS
WL_Down-DS
Not dry
Salty
0%Dirty
0%
Clean
79%
Cloudy
13%
Colored
8%Clean
Cloudy
Colored
Dirty
Salty
Clean
58% Other
Contamination
42%
Oil
Contamination
0%
Oil Contamination
Other Contamination
Clean
Tadpol, Worm
18%Odor
0%
Foamy
18%
Rusty
0%
Dust, Leaves
46%
Rubbish
18%
Muddy
0%
Dust, Leaves
Rubbish
Muddy
Rusty
Foamy
Tadpol, Worm
Odor
D
50%
P,D
50%
P
0%
P
P,D
D
Table 4.3-8 Water Use Volume of Well in Diabase Intrusion Area Figure 4.3-8 Purpose of Water Use in Diabase Intrusion Area c) Dry-up Condition and Quality of groundwater Dry up well in dry season is 50%, and well in which water level goes down in dry season is 21%. 29% of wells is not recognized any dry up situation. The water quality or problem as resident consciousness is as follows.
i) 21% of wells has bad water quality situation such as cloudy water(13%) and colored water (8%). ii) Contamination such as dust/ leaves/ rubbish blowing in, foamy situation and tadpole/ worm
generation is felt in 42% of wells.
Table 4.3-9 Water Quality of Wells in Diabase Intrusion Area Figure 4.3-9 Dry up Situation and Water Quality Consciousness in Diabase Intrusion Area

The Master Plan Study on Urban Facilities Restoration and Improvement in Monrovia in the Republic of Liberia
Final Report on Groundwater Development Plan in Paynesville Area
4-23
(2) Seasonal water level and quality variation The 2nd well inventory survey was carried out from 24th Feb. 2010 to 28th Feb. 2010 in order to obtain water level and simple water quality by site measurement in dry season. The 1st inventory work was conducted from 27th Oct. 2009 to 6th Nov. 2009 at end of rainy season. The seasonal water level and water quality variation between a rainy season and a dry season is as follows. 1) Seasonal variation in North West Part of the Study Area The Seasonal variation of water level and simple water quality in North West Part of the Study Area is shown in Figure 4.3-11. The record of the 2nd well inventory survey is arranged in Appendix-II. a) Variation of Water Level The water level goes down in dry season. The variation of water level between rainy season and dry season shows 0.36 to 2.98m, average 1.81m. b) Water Quality
The PH does not show clearly a trend to change between rainy season and dry season. The graph shows some portion increases and other portion decreases.
The electric conductivity shows the tendency which increases slightly to the rainy season. It can be thought an influence of inflow of surface water with slightly high content of dissolved substitute. Total dissolved solid shows a remarkable difference is not recognized.
The turbidity shows the tendency which increases to the dry season. It may show an influence of increase of insoluble content according to decrease of water level.
2) Seasonal variation in Central and South East Part of the Study Area The Seasonal variation of water level and simple water quality in Central and South East Part of the Study Area is shown in Figure 4.3-12. The record of the 2nd well inventory survey is arranged in Appendix-II. a) Variation of Water Level The water level goes down in dry season. The variation of water level between rainy season and dry season shows -0.03 to 2.36m, average 1.21m. b) Water Quality
The PH shows the tendency which increases slightly to the rainy season. The reason is not known. There may be conditions which cannot be easily influenced by rain and surface water about PH. The electric conductivity shows the tendency which increases slightly to the rainy season. It can be thought an influence of inflow of surface water with slightly high content of dissolved substitute. Total dissolved solid also shows the same tendency.
The turbidity shows the tendency which increases to the dry season. It may show an influence of increase of insoluble content according to decrease of water level.
3) Seasonal variation in Diabase Intrusion Area The Seasonal variation of water level and simple water quality in Diabase Intrusion Area of the Study Area is shown in Figure 4.3-13. The record of the 2nd well inventory survey is arranged in Appendix-II. a) Variation of Water Level The water level goes down in dry season. The variation of water level between rainy season and dry season shows -4.04 to 5.64m, average 1.88m. b) Water Quality
The PH shows the tendency which decreases to the dry season. In rainy season, the influence of the rain and surface water with low PH can be considered. The electric conductivity shows the tendency which increases slightly to the dry season. An influence of increase of dissolved substitute according to decrease of water level is considered.
The turbidity shows the tendency which increases to the dry season. It may show an influence of increase of insoluble content according to decrease of water level.

The Master Plan Study on Urban Facilities Restoration and Improvement in Monrovia in the Republic of Liberia
Final Report on Groundwater Development Plan in Paynesville Area
4-24
4.00
4.50
5.00
5.50
6.00
6.50
7.00
7.50
8.00
OW
J5-1
OW
J5-2
OW
J5-3
OW
J5-4
OW
J5-5
OW
J5-6
OW
J5-7
OW
J5-8
OW
J5-9
OW
J5-1
0
OW
J6-1
OW
J6-2
OW
J6-3
OW
J6-4
OW
J6-5
OW
J6-6
OW
J6-7
OW
J6-8
OW
J6-9
OW
J6-1
0
OW
J6-1
1
OW
J6-1
2
OW
J6-1
3
OW
J6-1
4
OW
J6-1
5
OW
J6-1
6
OW
J6-1
7
OW
J6-1
8
OW
J7-1
OW
J7-2
OW
J7-3
OW
J7-4
OW
J7-5
OW
J7-6
OW
J7-7
OW
J7-8
OW
J7-9
PH (Rainy Season)
PH (Dry Season)
PH
0.000
0.100
0.200
0.300
0.400
0.500
0.600
0.700
0.800
OW
J5-1
OW
J5-2
OW
J5-3
OW
J5-4
OW
J5-5
OW
J5-6
OW
J5-7
OW
J5-8
OW
J5-9
OW
J5-1
0
OW
J6-1
OW
J6-2
OW
J6-3
OW
J6-4
OW
J6-5
OW
J6-6
OW
J6-7
OW
J6-8
OW
J6-9
OW
J6-1
0
OW
J6-1
1
OW
J6-1
2
OW
J6-1
3
OW
J6-1
4
OW
J6-1
5
OW
J6-1
6
OW
J6-1
7
OW
J6-1
8
OW
J7-1
OW
J7-2
OW
J7-3
OW
J7-4
OW
J7-5
OW
J7-6
OW
J7-7
OW
J7-8
OW
J7-9
EC(Rainy Season)
EC(Dry Season)
Electric Conductivity (mS/cm)
(A) Water Level ` (B) PH (C) Electric Conductivity (D) Total Dissolved Solid (E) Turbidity
Figure 4.3-10 Seasonal Variation of Water Level and Water Quality in North West Part
0
50
100
150
200
250
300
350
400
OW
J5-1
OW
J5-2
OW
J5-3
OW
J5-4
OW
J5-5
OW
J5-6
OW
J5-7
OW
J5-8
OW
J5-9
OW
J5-1
0
OW
J6-1
OW
J6-2
OW
J6-3
OW
J6-4
OW
J6-5
OW
J6-6
OW
J6-7
OW
J6-8
OW
J6-9
OW
J6-1
0
OW
J6-1
1
OW
J6-1
2
OW
J6-1
3
OW
J6-1
4
OW
J6-1
5
OW
J6-1
6
OW
J6-1
7
OW
J6-1
8
OW
J7-1
OW
J7-2
OW
J7-3
OW
J7-4
OW
J7-5
OW
J7-6
OW
J7-7
OW
J7-8
OW
J7-9
TDS (Rainy Season)
TDS (Dry Season)
TDS (mg/L)
0.00
1.00
2.00
3.00
4.00
5.00
6.00
7.00
8.00
9.00
10.00
OW
J5-1
OW
J5-2
OW
J5-3
OW
J5-4
OW
J5-5
OW
J5-6
OW
J5-7
OW
J5-8
OW
J5-9
OW
J5-1
0
OW
J6-1
OW
J6-2
OW
J6-3
OW
J6-4
OW
J6-5
OW
J6-6
OW
J6-7
OW
J6-8
OW
J6-9
OW
J6-1
0
OW
J6-1
1
OW
J6-1
2
OW
J6-1
3
OW
J6-1
4
OW
J6-1
5
OW
J6-1
6
OW
J6-1
7
OW
J6-1
8
OW
J7-1
OW
J7-2
OW
J7-3
OW
J7-4
OW
J7-5
OW
J7-6
OW
J7-7
OW
J7-8
OW
J7-9
WL(Rainy Season_)
WL(Dry Season)
Water Level (m)
Dry-up Well
0.0
10.0
20.0
30.0
40.0
50.0
OW
J5-1
OW
J5-2
OW
J5-3
OW
J5-4
OW
J5-5
OW
J5-6
OW
J5-7
OW
J5-8
OW
J5-9
OW
J5-1
0
OW
J6-1
OW
J6-2
OW
J6-3
OW
J6-4
OW
J6-5
OW
J6-6
OW
J6-7
OW
J6-8
OW
J6-9
OW
J6-1
0
OW
J6-1
1
OW
J6-1
2
OW
J6-1
3
OW
J6-1
4
OW
J6-1
5O
WJ6
-16
OW
J6-1
7
OW
J6-1
8
OW
J7-1
OW
J7-2
OW
J7-3
OW
J7-4
OW
J7-5
OW
J7-6
OW
J7-7
OW
J7-8
OW
J7-9
Terbidity (Rainy Season)
Terbidity (Dry Season)
Turbidity (NTU)

The Master Plan Study on Urban Facilities Restoration and Improvement in Monrovia in the Republic of Liberia
Final Report on Groundwater Development Plan in Paynesville Area
4-25
0.0
20.0
40.0
60.0
80.0
100.0
OW
J8-1
OW
J8-2
OW
J8-3
OW
J8-4
OW
J8-5
OW
J8-6
OW
J8-7
OW
J8-8
OW
J8-9
OW
J8-1
0
OW
J8-1
1
OW
J8-1
2
OW
J9-1
OW
J9-2
OW
J9-3
OW
J9-4
OW
J9-5
OW
J9-6
OW
J9-7
OW
J9-8
OW
J9-9
OW
J9-1
0
OW
J9-1
1
OW
J9-1
2
OW
J9-1
3
OW
J10-
1
OW
J10-
2
OW
J10-
3
OW
J10-
4
OW
J10-
5
OW
J10-
6
OW
J10-
7
OW
J10-
8
OW
J10-
9
OW
J10-
10
Terbidity (Rainy Season)
Terbidity (Dry Season)
Turbidity (NTU)
(A) Water Level (B) PH (C) Electric Conductivity (D) Total Dissolved Solid (E) Turbidity
Figure 4.3-11 Seasonal Variation of Water Level and Water Quality in Central and South East Part
4.00
4.50
5.00
5.50
6.00
6.50
7.00
7.50
8.00
OW
J8-1
OW
J8-2
OW
J8-3
OW
J8-4
OW
J8-5
OW
J8-6
OW
J8-7
OW
J8-8
OW
J8-9
OW
J8-1
0
OW
J8-1
1
OW
J8-1
2
OW
J9-1
OW
J9-2
OW
J9-3
OW
J9-4
OW
J9-5
OW
J9-6
OW
J9-7
OW
J9-8
OW
J9-9
OW
J9-1
0
OW
J9-1
1
OW
J9-1
2
OW
J9-1
3
OW
J10-
1
OW
J10-
2
OW
J10-
3
OW
J10-
4
OW
J10-
5
OW
J10-
6
OW
J10-
7
OW
J10-
8
OW
J10-
9
OW
J10-
10
PH (Rainy Season)
PH (Dry Season)
PH
0.000
0.100
0.200
0.300
0.400
0.500
0.600
0.700
0.800
OW
J8-1
OW
J8-2
OW
J8-3
OW
J8-4
OW
J8-5
OW
J8-6
OW
J8-7
OW
J8-8
OW
J8-9
OW
J8-1
0
OW
J8-1
1
OW
J8-1
2
OW
J9-1
OW
J9-2
OW
J9-3
OW
J9-4
OW
J9-5
OW
J9-6
OW
J9-7
OW
J9-8
OW
J9-9
OW
J9-1
0
OW
J9-1
1
OW
J9-1
2
OW
J9-1
3
OW
J10-
1
OW
J10-
2
OW
J10-
3
OW
J10-
4
OW
J10-
5
OW
J10-
6
OW
J10-
7
OW
J10-
8
OW
J10-
9
OW
J10-
10
EC(Rainy Season)
EC(Dry Season)
Electric Conductivity (mS/cm)
0
50
100
150
200
250
300
350
400
OW
J8-1
OW
J8-2
OW
J8-3
OW
J8-4
OW
J8-5
OW
J8-6
OW
J8-7
OW
J8-8
OW
J8-9
OW
J8-1
0
OW
J8-1
1
OW
J8-1
2
OW
J9-1
OW
J9-2
OW
J9-3
OW
J9-4
OW
J9-5
OW
J9-6
OW
J9-7
OW
J9-8
OW
J9-9
OW
J9-1
0
OW
J9-1
1
OW
J9-1
2
OW
J9-1
3
OW
J10-
1
OW
J10-
2
OW
J10-
3
OW
J10-
4
OW
J10-
5
OW
J10-
6
OW
J10-
7
OW
J10-
8
OW
J10-
9
OW
J10-
10
TDS (Rainy Season)
TDS (Dry Season)
TDS (mg/L)
0.00
0.50
1.00
1.50
2.00
2.50
3.00
3.50
4.00
4.50
5.00
OW
J8-1
OW
J8-2
OW
J8-3
OW
J8-4
OW
J8-5
OW
J8-6
OW
J8-7
OW
J8-8
OW
J8-9
OW
J8-1
0
OW
J8-1
1
OW
J8-1
2
OW
J9-1
OW
J9-2
OW
J9-3
OW
J9-4
OW
J9-5
OW
J9-6
OW
J9-7
OW
J9-8
OW
J9-9
OW
J9-1
0
OW
J9-1
1
OW
J9-1
2
OW
J9-1
3
OW
J10-
1
OW
J10-
2
OW
J10-
3
OW
J10-
4
OW
J10-
5
OW
J10-
6
OW
J10-
7
OW
J10-
8
OW
J10-
9
OW
J10-
10
WL(Rainy Season_)
WL(Dry Season)
Water Level (m)
Dry-up Well

The Master Plan Study on Urban Facilities Restoration and Improvement in Monrovia in the Republic of Liberia
Final Report on Groundwater Development Plan in Paynesville Area
4-26
(A) Water Level (B) PH (C) Electric Conductivity (D) Total Dissolved Solid (E) Turbidity
Figure 4.3-12 Seasonal Variation of Water Level and Water Quality in Diabase Intrusion Area
4.00
4.50
5.00
5.50
6.00
6.50
7.00
7.50
8.00
IWD
1-1
IWD
1-2
IWD
1-3
IWD
1-4
IWD
1-5
IWD
1-6
IWD
1-7
IWD
1-8
IWD
1-9
IWD
1-10
IWD
1-11
IWD
1-12
IWD
1-13
IWD
2-1
IWD
2-2
IWD
2-3
IWD
2-4
IWD
2-5
IWD
2-6
IWD
2-7
IWD
2-8
IWD
2-9
IWD
2-10
IWD
2-11
PH (Rainy Season)
PH (Dry Season)
PH
0.000
0.050
0.100
0.150
0.200
0.250
0.300
IWD
1-1
IWD
1-2
IWD
1-3
IWD
1-4
IWD
1-5
IWD
1-6
IWD
1-7
IWD
1-8
IWD
1-9
IWD
1-10
IWD
1-11
IWD
1-12
IWD
1-13
IWD
2-1
IWD
2-2
IWD
2-3
IWD
2-4
IWD
2-5
IWD
2-6
IWD
2-7
IWD
2-8
IWD
2-9
IWD
2-10
IWD
2-11
EC(Rainy Season)
EC(Dry Season)
Electric Conductivity (mS/cm)
0
50
100
150
200
IWD
1-1
IWD
1-2
IWD
1-3
IWD
1-4
IWD
1-5
IWD
1-6
IWD
1-7
IWD
1-8
IWD
1-9
IWD
1-10
IWD
1-11
IWD
1-12
IWD
1-13
IWD
2-1
IWD
2-2
IWD
2-3
IWD
2-4
IWD
2-5
IWD
2-6
IWD
2-7
IWD
2-8
IWD
2-9
IWD
2-10
IWD
2-11
TDS (Rainy Season)
TDS (Dry Season)
TDS (mg/L)
0.0
20.0
40.0
60.0
80.0
100.0
IWD
1-1
IWD
1-2
IWD
1-3
IWD
1-4
IWD
1-5
IWD
1-6
IWD
1-7
IWD
1-8
IWD
1-9
IWD
1-10
IWD
1-11
IWD
1-12
IWD
1-13
IWD
2-1
IWD
2-2
IWD
2-3
IWD
2-4
IWD
2-5
IWD
2-6
IWD
2-7
IWD
2-8
IWD
2-9
IWD
2-10
IWD
2-11
Terbidity (Rainy Season)
Terbidity (Dry Season)
Turbidity
0.00
2.00
4.00
6.00
8.00
10.00
IWD
1-1
IWD
1-2
IWD
1-3
IWD
1-4
IWD
1-5
IWD
1-6
IWD
1-7
IWD
1-8
IWD
1-9
IWD
1-10
IWD
1-11
IWD
1-12
IWD
1-13
IWD
2-1
IWD
2-2
IWD
2-3
IWD
2-4
IWD
2-5
IWD
2-6
IWD
2-7
IWD
2-8
IWD
2-9
IWD
2-10
IWD
2-11
WL(Rainy Season_)
WL(Dry Season)
Water Level (m)
Dry-up Well

The Master Plan Study on Urban Facilities Restoration and Improvement in Monrovia in the Republic of Liberia
Final Report on Groundwater Development Plan in Paynesville Area
4-27
(3) Influence to Surrounding Shallow Wells during Pumping Test At each drilling well site except for J-10 in which normal pumping test other than preliminary pumping test was not conducted because of very low water producing condition, the observation of water level of surrounding shallow wells during the constant discharge pumping test and recovery test is carried out in order to confirm the situation of influence on existing shallow wells by pumping. The influence on water level of existing shallow wells during pumping test is shown in Table 4.3-10. The recording water level of observation shallow wells during pumping test is plotted in Figure 4.3-11 shown with the location map. Any clear influence is not recognized during pumping test in each well site.
Table 4.3-10 Results of Water Level Observation in Surrounding Shallow Well during Pumping Test
Well No Description Influence J-5 OW5-1 indicates partly water level drops during pumping, but water
level recovers at last one day pumping duration. Other wells do not indicate influence of exploratory well pumping.
Not influence
J-6 All observation well indicates slightly rising trend of water level during exploratory well pumping.
Not influence
J-7 All observation wells does not indicate any decline trend of water level during exploratory well pumping.
Not influence
J-8 OW8-2 indicates partly water level declines during pumping, but water level recovers at last few hours pumping duration.
Not influence
J-9 OW9-6 indicates water level declines about 40cm at last one day of pumping duration and after stopping pump. But the trend is not reflected the very first recover situation and the only 1.8m drawdown of the pumping well.
Not clear
J-11 OW11-1 indicates gradually decline about 10cm during pumping. But the trend is not concerned to the drawdown trend of the pumping well.
Not clear
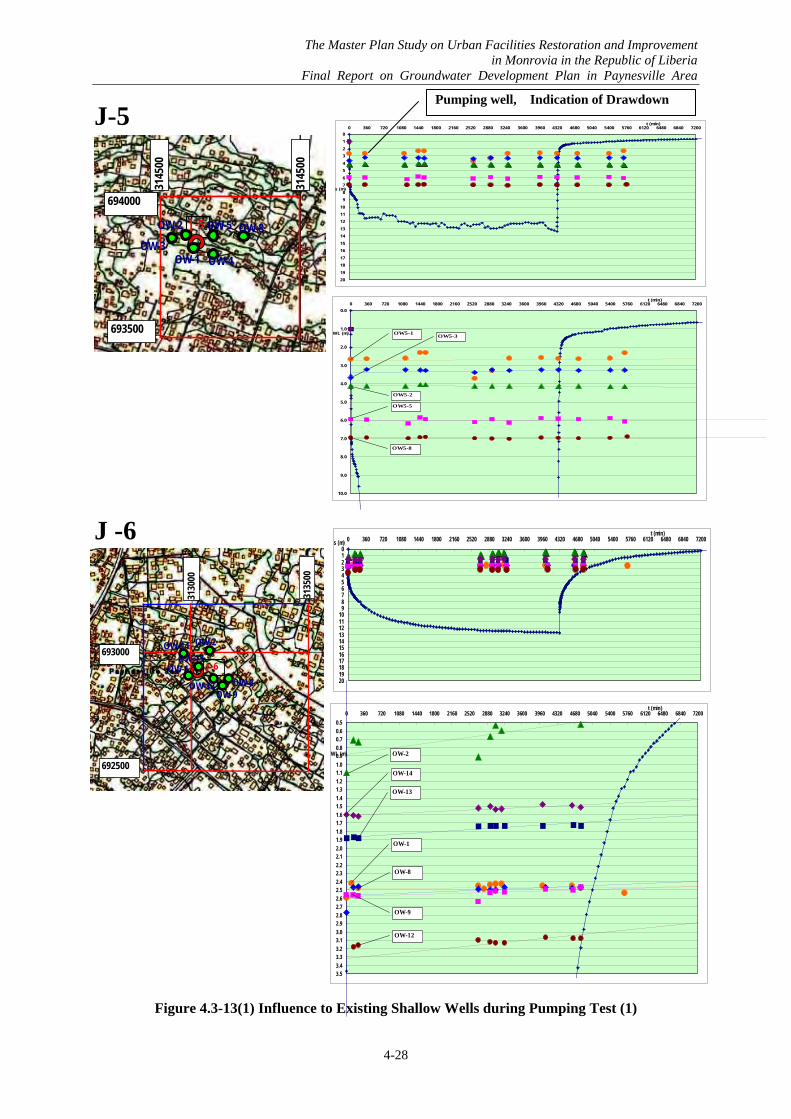
The Master Plan Study on Urban Facilities Restoration and Improvement in Monrovia in the Republic of Liberia
Final Report on Groundwater Development Plan in Paynesville Area
4-28
J-5
J -6
Figure 4.3-13(1) Influence to Existing Shallow Wells during Pumping Test (1)
0.0
1.0
2.0
3.0
4.0
5.0
6.0
7.0
8.0
9.0
10.0
0 360 720 1080 1440 1800 2160 2520 2880 3240 3600 3960 4320 4680 5040 5400 5760 6120 6480 6840 7200t (min)
WL (m)
OW5-5
OW5-1
OW5-8
OW5-3
OW5-2
0123456789
1011121314151617181920
0 360 720 1080 1440 1800 2160 2520 2880 3240 3600 3960 4320 4680 5040 5400 5760 6120 6480 6840 7200t (min)
s (m)
0.5
0.60.7
0.80.9
1.01.1
1.21.3
1.41.5
1.61.7
1.81.9
2.02.1
2.22.3
2.42.5
2.62.7
2.82.9
3.03.1
3.23.3
3.43.5
0 360 720 1080 1440 1800 2160 2520 2880 3240 3600 3960 4320 4680 5040 5400 5760 6120 6480 6840 7200t (min)
WL (m)
OW-1
OW-2
OW-8
OW-9
OW-14
OW-13
OW-12
0
1
2
3
4
5
6
7
8
9
10
11
12
13
14
15
16
17
18
19
20
0 360 720 1080 1440 1800 2160 2520 2880 3240 3600 3960 4320 4680 5040 5400 5760 6120 6480 6840 7200t (min)
s (m)
Pumping well, Indication of Drawdown
J-5
694000
693500
3145
00
3145
00
OW-1
OW-2
OW-3OW-4
OW-5 OW-8
J-6
OW-8OW-9
OW-1
OW-2693000
692500
3130
00
3135
00
OW-12
OW-13OW-14

The Master Plan Study on Urban Facilities Restoration and Improvement in Monrovia in the Republic of Liberia
Final Report on Groundwater Development Plan in Paynesville Area
4-29
J-7
J-8
Figure 4.3-13(2) Influence to Existing Shallow Wells during Pumping Test (2)
02468
1012141618202224262830
0 360 720 1080 1440 1800 2160 2520 2880 3240 3600 3960 4320 4680 5040 5400 5760 6120 6480 6840 7200t (min)
s (m)
2.0
2.5
3.0
3.5
4.0
4.5
5.0
5.5
6.0
6.5
7.0
7.5
8.0
0 360 720 1080 1440 1800 2160 2520 2880 3240 3600 3960 4320 4680 5040 5400 5760 6120 6480 6840 7200t (min)
WL (m)
OW7-1
OW7-4
OW7-7
OW7-8
OW7-5
OW7-2
02468
1012141618202224262830
0 360 720 1080 1440 1800 2160 2520 2880 3240 3600 3960 4320 4680 5040 5400 5760 6120 6480 6840 7200t (min)
s (m)
0.0
0.2
0.4
0.6
0.8
1.0
1.2
1.4
1.6
1.8
2.0
2.2
2.4
2.6
2.8
3.0
3.2
3.4
3.6
3.8
4.0
4.2
4.4
4.6
4.8
5.0
0 360 720 1080 1440 1800 2160 2520 2880 3240 3600 3960 4320 4680 5040 5400 5760 6120 6480 6840 7200t (min)
WL (m)
OW8-8
OW8-3
OW8-1
OW8-10
OW8-9
OW8-2
J-7
OW-7
OW-8
OW-1
OW-2
OW-4
OW-5
693000
692500
3145
00
3150
00
J-8OW-8OW-9
OW-1
OW-2
OW-3691000
691500 3160
00
3165
00
OW-10

The Master Plan Study on Urban Facilities Restoration and Improvement in Monrovia in the Republic of Liberia
Final Report on Groundwater Development Plan in Paynesville Area
4-30
J-9
J-11
Figure 4.3-13(3) Influence to Existing Shallow Wells during Pumping Test (3)
1.0
1.1
1.2
1.3
1.4
1.5
1.6
1.7
1.8
1.9
2.0
2.1
2.2
2.3
2.4
2.5
0 360 720 1080 1440 1800 2160 2520 2880 3240 3600 3960 4320 4680 5040 5400 5760 6120 6480 6840 7200t (min)
WL (m)
OW9-11
OW9-3
OW9-5
OW9-6
OW9-10
OW9-9
0123456789
1011121314151617181920
0 360 720 1080 1440 1800 2160 2520 2880 3240 3600 3960 4320 4680 5040 5400 5760 6120 6480 6840 7200t (min)
s (m)
0.0
0.1
0.2
0.3
0.4
0.5
0.6
0.7
0.8
0.9
1.0
1.1
1.2
1.3
1.4
1.5
1.6
1.7
1.8
1.9
2.0
0 360 720 1080 1440 1800 2160 2520 2880 3240 3600 3960 4320 4680 5040 5400 5760 6120 6480 6840 7200t (min)
WL (m)
OW11-2
OW11-1
OW10-4
OW10-3
OW11-3
OW10-5
0
1
2
3
4
5
0 360 720 1080 1440 1800 2160 2520 2880 3240 3600 3960 4320 4680 5040 5400 5760 6120 6480 6840 7200t (min)
s (m)
J-9
OW-9
OW-10
OW-3
OW-5
689500
3150
00
3155
00
690000
OW-11
OW-6
J-10
689500
3175
00
3180
00
689000
J-11
OW10-5
OW10-4
OW10-3
OW11-1
OW11-2OW11-3

The Master Plan Study on Urban Facilities Restoration and Improvement in Monrovia in the Republic of Liberia
Final Report on Groundwater Development Plan in Paynesville Area
5-1
5. WATER QUALITY ANALYSIS Water Quality analysis is carried out using sampling water at the last day of constant discharge pumping test. The results of water quality analysis are shown in Table 5-2. The situation of the results is summarized in Table 5-1.
Table 5-1 Summary of Result of Water Quality Analysis Well No. Description Evaluation Remarks
J-5 Iron, turbidity, color exceed WHO standard
Nit drinking Concentration of metal
J-6 Iron, Arsenic, color exceed WHO standard. Total coliforms is detected.
Not drinking Concentration of metal
J-7 Arsenic exceeds WHO standard. Total coliforms is detected.
Not drinking Concentration of metal
J-8 PH is slightly low. Other items clear WHO standard.
Almost clean
J-9 Iron, Nickel, and color exceed WHO standard Total coliforms is detected.
Not drinking Concentration of metal
J-11 All items clear WHO standard. Good for drinking
water

The M
aster Plan Study on U
rban Facilities R
estoration and Improvem
ent in M
onrovia in the Republic of L
iberiaF
inal Report on G
roundwater D
evelopment P
lan in Paynesville A
rea
5-2
Well No.Sampling Date 23-Feb-10 23-Feb-10 2-Jan-10 2-Jan-10 9-Jan-10 9-Jan-10 22-Jan-10 22-Jan-10 11-Jan-10 11-Jan-10 3-Feb-10 3-Feb-10Test Organization Site Japan Site Japan Site Japan Site Japan Site Japan Site JapanpH (-) 6.55 7.4 7.0 7.7 7.2 8.0 5.6 5.2 7.1 8.0 7.7 8.1T ( °C) 30.1 28.8 30.9 28.7 27.8 29.3Turbidity (NTU) 0.0 29.2 3.8 2.6 10.6 1.6 0.6 0.4 4.4 2.0 4.3 <0.2 5Color (°) 56.8 42.1 0.7 <0.5 16.5 1.2 15EC (mS/cm) 0.180 0.255 0.364 0.027 0.318 0.133Alkalinity -OH-(mg/l as CaCO3) <2 <2 <2 <2 <2 <2Alkalinity -CO3
2-(mg/l as CaCO3) <2 <2 <2 <2 <2 <2Alkalinity -HCO3-(mg/l as CaCO3) 62 94 161 6 143 87Calcium (mg/L) 14 20.5 19.7 <1 44.5 2Magnesium (mg/L) 4 7.1 6.5 <1 5.2 1Total Hardness (mg-CaCO3/l) 53 80 76 <1 133 10LI (-) -1.09 -0.46 0.05 0.35 -1.1Potassium (mg/L) 6.2 3.6 6.0 0.2 3.1 2.4Sodium (mg/L) 10.7 10.7 23.0 1.9 7.4 1.9Chlorides (mg/L) 2.2 2.6 1.9 2.7 9.2 3.6SO4
2- (mg/L) 6.5 14.9 13.7 <1.0 <1.0 <1.0 250TDS (mg/L) 116 171 165 206 238 212 18 16 206 214 205 169 1000NH4 -N (mg/L) 0.08 0.07 0.12 <0.05 0.12 0.10NO3 -N (mg/L) <0.5 <0.5 <0.5 <0.5 <0.5 <0.5 11NO2 -N (mg/L) <0.5 <0.5 <0.5 <0.5 <0.5 <0.5 0.9Silica (mg/L) 93 82 43 13 73 65Iron (mg/L) 2.40 0.85 0.01 <0.01 0.53 0.08 0.3Manganese (mg/L) 0.217 0.118 0.012 0.007 0.104 0.035 0.5Arsenic (mg/L) 0.007 0.011 0.017 <0.001 0.005 <0.001 0.01Selenium (mg/L) <0.001 <0.001 <0.001 <0.001 <0.001 <0.001 0.01Copper (mg/L) <0.01 <0.01 0.10 <0.01 <0.01 <0.01 2Cadmimum (mg/L) <0.001 <0.001 <0.001 <0.001 <0.001 <0.001 0.003Chromium (mg/L) <0.005 <0.005 <0.005 <0.005 <0.005 <0.001 0.05Cyanide (mg/L) <0.001 <0.001 <0.001 <0.001 <0.001 <0.005 0.07Lead (mg/L) <0.001 <0.001 0.002 <0.001 <0.001 <0.001 0.01Mercury (mg/L) <0.00005 <0.00005 <0.00005 <0.00005 <0.00005 <0.00005 0.001Boron (mg/L) <0.1 <0.1 0.2 <0.1 <0.1 <0.1 0.5Barium (mg/L) <0.07 <0.07 0.09 <0.07 <0.07 <0.07 0.7Molybdenum (mg/L) <0.007 <0.007 <0.007 <0.007 <0.007 <0.007 0.07Nickel (mg/L) 0.010 0.019 0.017 <0.001 0.033 0.003 0.02Flouride (mg/L) 0.32 0.15 0.53 <0.08 0.15 0.18 1.5Total Coliforms (CFU/100ml) 0 0 1 0 1 0E.Coli. (CFU/100ml) 0 0 0 0 0 0
WHOStandard
J-5 J-6 J-7 J-8 J-9 J-11
Table 5-2 Result of Water Quality Analysis of Exploratory Well
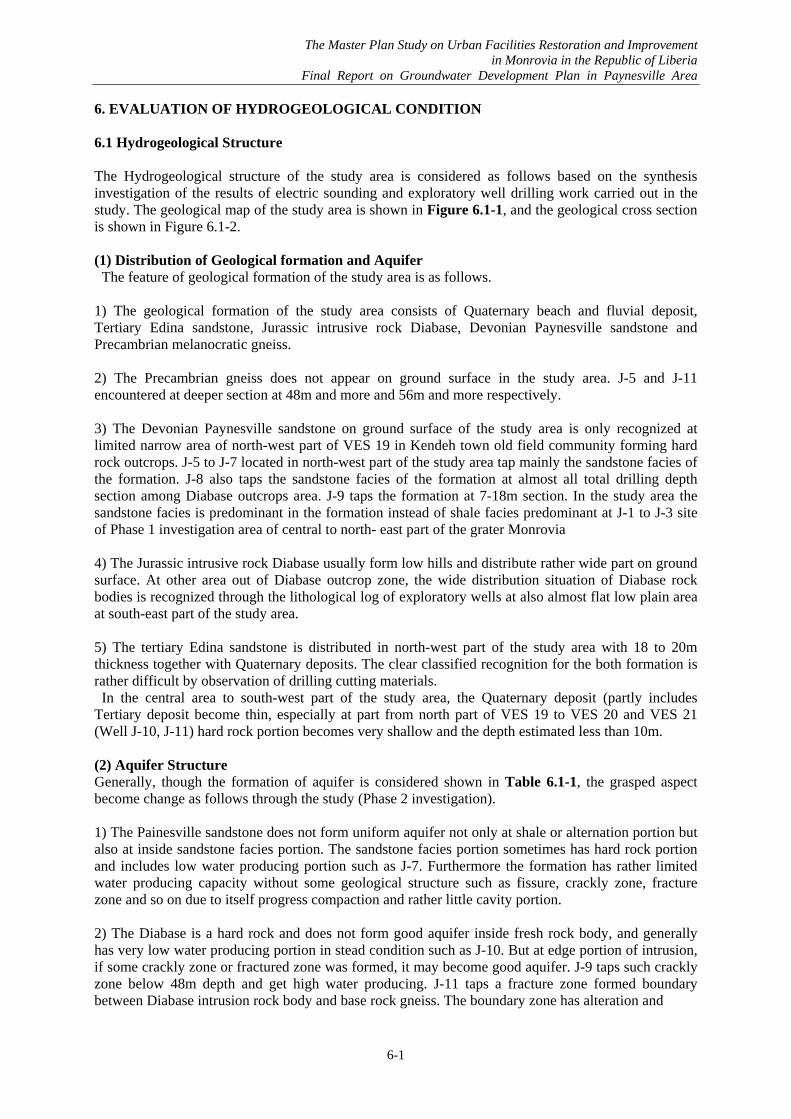
The Master Plan Study on Urban Facilities Restoration and Improvement in Monrovia in the Republic of Liberia
Final Report on Groundwater Development Plan in Paynesville Area
6-1
6. EVALUATION OF HYDROGEOLOGICAL CONDITION 6.1 Hydrogeological Structure The Hydrogeological structure of the study area is considered as follows based on the synthesis investigation of the results of electric sounding and exploratory well drilling work carried out in the study. The geological map of the study area is shown in Figure 6.1-1, and the geological cross section is shown in Figure 6.1-2. (1) Distribution of Geological formation and Aquifer The feature of geological formation of the study area is as follows. 1) The geological formation of the study area consists of Quaternary beach and fluvial deposit, Tertiary Edina sandstone, Jurassic intrusive rock Diabase, Devonian Paynesville sandstone and Precambrian melanocratic gneiss. 2) The Precambrian gneiss does not appear on ground surface in the study area. J-5 and J-11 encountered at deeper section at 48m and more and 56m and more respectively. 3) The Devonian Paynesville sandstone on ground surface of the study area is only recognized at limited narrow area of north-west part of VES 19 in Kendeh town old field community forming hard rock outcrops. J-5 to J-7 located in north-west part of the study area tap mainly the sandstone facies of the formation. J-8 also taps the sandstone facies of the formation at almost all total drilling depth section among Diabase outcrops area. J-9 taps the formation at 7-18m section. In the study area the sandstone facies is predominant in the formation instead of shale facies predominant at J-1 to J-3 site of Phase 1 investigation area of central to north- east part of the grater Monrovia 4) The Jurassic intrusive rock Diabase usually form low hills and distribute rather wide part on ground surface. At other area out of Diabase outcrop zone, the wide distribution situation of Diabase rock bodies is recognized through the lithological log of exploratory wells at also almost flat low plain area at south-east part of the study area. 5) The tertiary Edina sandstone is distributed in north-west part of the study area with 18 to 20m thickness together with Quaternary deposits. The clear classified recognition for the both formation is rather difficult by observation of drilling cutting materials. In the central area to south-west part of the study area, the Quaternary deposit (partly includes Tertiary deposit become thin, especially at part from north part of VES 19 to VES 20 and VES 21 (Well J-10, J-11) hard rock portion becomes very shallow and the depth estimated less than 10m. (2) Aquifer Structure Generally, though the formation of aquifer is considered shown in Table 6.1-1, the grasped aspect become change as follows through the study (Phase 2 investigation). 1) The Painesville sandstone does not form uniform aquifer not only at shale or alternation portion but also at inside sandstone facies portion. The sandstone facies portion sometimes has hard rock portion and includes low water producing portion such as J-7. Furthermore the formation has rather limited water producing capacity without some geological structure such as fissure, crackly zone, fracture zone and so on due to itself progress compaction and rather little cavity portion. 2) The Diabase is a hard rock and does not form good aquifer inside fresh rock body, and generally has very low water producing portion in stead condition such as J-10. But at edge portion of intrusion, if some crackly zone or fractured zone was formed, it may become good aquifer. J-9 taps such crackly zone below 48m depth and get high water producing. J-11 taps a fracture zone formed boundary between Diabase intrusion rock body and base rock gneiss. The boundary zone has alteration and

The M
aster Plan Study on U
rban Facilities R
estoration and Improvem
ent in M
onrovia in the Republic of L
iberiaF
inal Report on G
roundwater D
evelopment P
lan in Paynesville A
rea
6-2
Figure 6.1-1 Geological Map of the Study Area
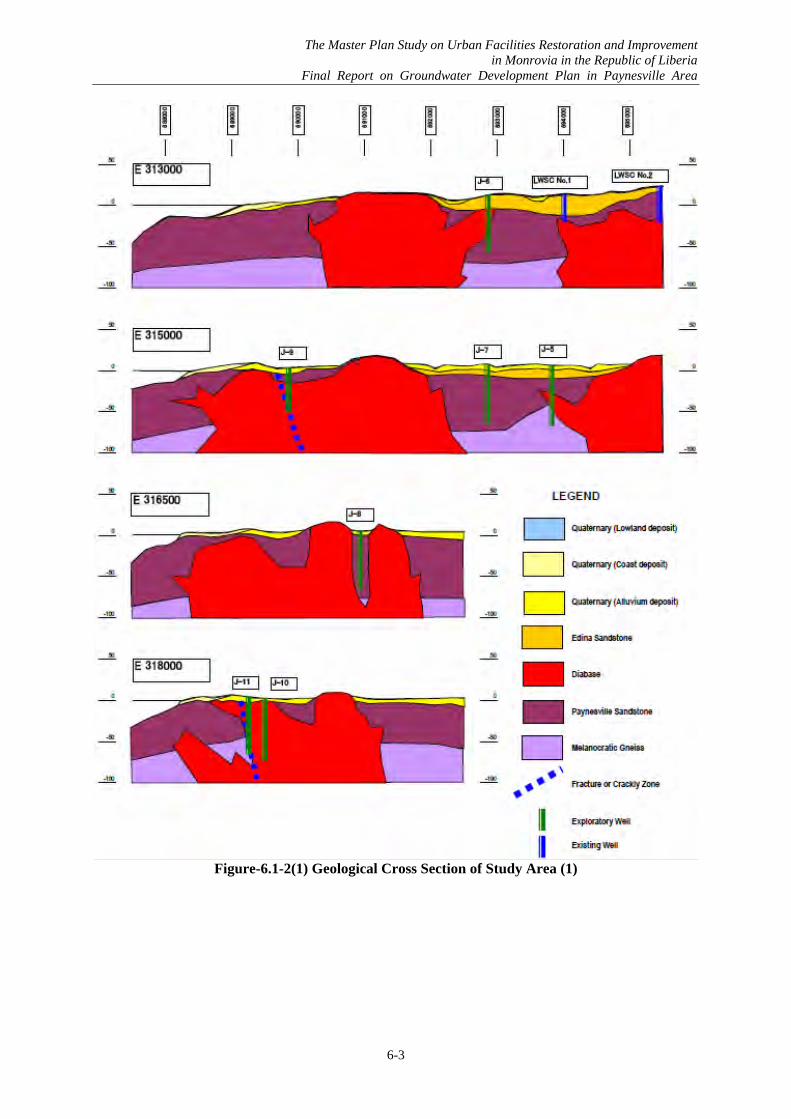
The Master Plan Study on Urban Facilities Restoration and Improvement in Monrovia in the Republic of Liberia
Final Report on Groundwater Development Plan in Paynesville Area
6-3
Figure-6.1-2(1) Geological Cross Section of Study Area (1)

The M
aster Plan Study on U
rban Facilities R
estoration and Improvem
ent in M
onrovia in the Republic of L
iberiaF
inal Report on G
roundwater D
evelopment P
lan in Paynesville A
rea
6-4
Figure-6.1-2(2) Geological Cross Section of Study Area (2)

The Master Plan Study on Urban Facilities Restoration and Improvement in Monrovia in the Republic of Liberia
Final Report on Groundwater Development Plan in Paynesville Area
6-5
Symbol Formation Feature as Aquifer Possibility of Aquifer
Qb/QfBeach andFluvial Deposit
Quaternary deposit is supposed to be thinly deposited on the lowlands of the stablebasin. Sand strata have possibility of an aquifer for shallow well.
Possible for shallow well
Te Edina SandstoneTertiary sandstone has possibility of an aquifer. However, according to literature,this formation is as thin as several meters.
Possible for shallow well
KfFarmingtonRiver Formation
Sandstone formation has possibility of an aquifer. However, the distribution ofthis formation is not well known in the study area.
Unknown in the study area
Jd DiabaseGenerally dike and intrusive rock has not possibility of an aquifer, However,Crackly zone or boundary portion with fissure sometimes storage groundwater.
Unsuitable for well
DpPaynesvilleSandstone
Sandstone formation has high possibility of an aquifer. Sometimes mudstone andshale layer are intercalated.
Possible for deep well
gnlLeucocraticGneiss
Generally this formation is non aquifer because of hard rock of a part ofPrecambrian craton. Highly weathered or fissure zone has possibility of groundwater presence
Unsuitable for well
gnmMelanocraticGneiss
Generally this formation is non aquifer because of hard rock of a part ofPrecambrian craton. Fissure zone nearby fault has possibility of ground waterpresence
Unsuitable for well
Table 6.1-1 Possibility of Aquifer in Each Formation (Source; Phase 1 study) rather soft portion at gneiss portion owing to alteration and weathering. The high water producing exists in the portion and Diabase rock portion with crackly zone along the fracture zone. J-8 taps almost Paynesville sandstone, but the well locates in a structure zone put between north side Diabase rock body and south side Diabase body apart only 200 to 300m, and the nipped sandstone zone becomes partly soft condition like by weathering. The water producing portions are recognized some upper portions of sandstone and around branch intrusion of Diabase. J-6 also has rather thin Diabase intrusion section, and the water producing portions are recognized at its boundary part. 3) The Tertiary and Quaternary aquifer are distributed in north-west to central part of the study area. The thickness is 10 to maximum 20m in the study area. Mainly the sand portion is predominant in the study area, and sometimes rather thick clay layer intercalated in bottom portion such as J-6. Owing to the limited thickness and distribution, Though it is considered to be difficult to use as the only one target aquifer for urban or semi-urban type groundwater development with rather high water producing demand per well, to use as a source for the compound of shallow aquifer section and deeper section in same well is possible. (3) Yield Condition of Well The yield condition of wells in phase 1 study and in this phase 2 study together with existing LWSC wells is shown in Table 6.1-2. From Table 6.1-2 the classification of the yield capacity of well can be obtained shown in Table 6.1-3.
- Group A (Transmissivity;>50m3/day/m, Yield; >200m3/day on 8hours pumping) contains J-9 and LWSC Well No.1.
- Group B (Transmissivity 10-50m3/day/m, Yield; 100-200m3/day on 8hours pumping) contains J-6, J-8,J-11 and LWSC Well No.2.
- Group C (Transmissivity 5-10m3/day/m, Yield; 10-100m3/day on 8hours pumping) contains J-1. - Group D (Transmissivity 1-5m3/day/m, Yield; 5-10m3/day on 8hours pumping) contains J-2, J-3
and J-5.. - Group D (Transmissivity <1m3/day/m, Yield; <5m3/day on 8hours pumping) contains J-4, J-7
and J-10. The yield capacity suggests rather higher in fissure or structure zone than the Paynesville sandstone proper portion.

The Master Plan Study on Urban Facilities Restoration and Improvement in Monrovia in the Republic of Liberia
Final Report on Groundwater Development Plan in Paynesville Area
6-6
Table 6.1-2 Yield Condition of Wells Transmissivity Yield per each drawdown (s)
(L/min) Well No. (m3/sec/m) (m3/day/m)
Storativity Permeability Coefficient
(m/sec) s=5m s=10m S=20m J-1 1.04x 10⁻⁴ 8.99 2.2 x 10⁻² 4.69 x 10⁻⁴ 36.0 72.1 144 J-2 1.29x 10⁻⁵ 1.11 2.7 x 10⁻² 1.08 x 10⁻⁶ 5.7 14.4 22.8J-3 3.11x 10⁻⁵ 2.69 4.3x 10⁻² 3.13 x 10⁻⁶ 13.0 26.1 52.2J-4 4.70 x 10⁻⁶ 0.41 6.3 x 10⁻³ 2.23 x 10⁻⁷ 2.6 5.3 10.6J-5 4.30 x 10⁻⁵ 3.71 8.6 x 10⁻² 2.04 x 10⁻⁶ 18.8 37.6 75.2J-6 4.31 x 10⁻⁴ 37.2 5.2 x 10⁻¹ 1.59 x 10⁻⁵ 178 355 712 J-7 7.50 x 10⁻⁶ 0.35 9.0 x 10⁻² 3.53 x 10⁻⁷ 3.4 6.8 13.6J-8 2.91 x 10⁻⁴ 25.100 1.9 x 10⁻² 9.71 x 10⁻⁶ 91 183 365 J-9 3.65 x 10⁻³ 315. 6.0 x 10⁻¹ 1.74 x 10⁻⁴ 1,236 J-10 5.07 x 10⁻⁶ 0.44 3.6 x 10⁻³ 1.87 x 10⁻⁷ 2.0 4.0 7.9J-11 4.07 x 10⁻⁴ 35.2 5.0 x 10⁻¹ 1.03 x 10⁻⁵ 168 336 672 LWSCNo.1
4.6 x 10⁻⁴
- 1.2 x 10⁻³ 40 – 106 5.0 x 10⁻² 2.5 x 10⁻⁵
- 6.8 x 10⁻⁵ 150 –
363 300 -
726 600 - 1,452
LWSCNo,2
2.5 x 10⁻⁴
- 5.2 x 10⁻⁴ 21 – 45 1.0 x 10⁻³ 2.5 x 10⁻⁵
- 6.8 x 10⁻⁵ 64 - 126
127 - 252
254 - 504
Table 6.1-3 Classification of Yield Capacity of Wells
Transmissivity Yield (Safety) Group
m3/day/m L/min m3/day (8hours) Well Remark
A >50 >400 >200 J-9, LWSC No.1 Fissure, Tertiary
B 10-50 200-400 100-200 J-6,J-8,J-11, LWSC No.2
Fissure, Sandstone
C 5-10 20-200 10-100 J-1 Sandstone D 1-5 20-100 5-10 J-2, J-3,J-5 Sandstone E <1 <20 <5 J-4,J-7, J-10 Hard rock
6.2 Groundwater Potential (1) Shallow aquifer The surface geology of the study area indicated on 250m mesh grid is shown in Figure 6.2-1. The Quaternary and Tertiary deposit is widely distributed in low to middle height area in the study area. The thickness is 10 to 20m in north-west and central part in the study area., and 5 to 10m in central to south-east part in the study area. Owing to rather thin condition, the Quaternary and Tertiary deposit has not enough capacity to develop as a main aquifer. the Quaternary and Tertiary deposit can be used as a sub aquifer in north-west part of the study area in case of the development of wells combined withdrawal from shallow aquifer and deeper aquifer. (2) Deeper aquifer The geology of the taking out the Quaternary and Tertiary deposit area indicated on 250m mesh grid is shown in Figure 6.2-2. In consideration with geological structure and results of electrical sounding and exploratory well drilling, the groundwater water potential is presumed as shown in Figure 6.2-3. The evaluation criteria is applied the Classification category of the water producing capacity of wells shown in Table 6.1.3. The high potential is assumed in surroundings along Daiabase intrusive area with geological structures and partly along beach mound elongated along coast. The indication added water quality information on the same map is shown in Figure 6.2.4. The water quality contaminated zone supposed to be originated ore deposits accompanied with Diabase intrusion activity. There is possibility which appears every place in Diabase intrusion area. It

The Master Plan Study on Urban Facilities Restoration and Improvement in Monrovia in the Republic of Liberia
Final Report on Groundwater Development Plan in Paynesville Area
6-7
is necessary to check contamination distribution and to advance adjustment, for example sorting of the development area in detail with new information furthering development. The production wells are arranged in high water producing capacity zone without water quality contaminated zone.
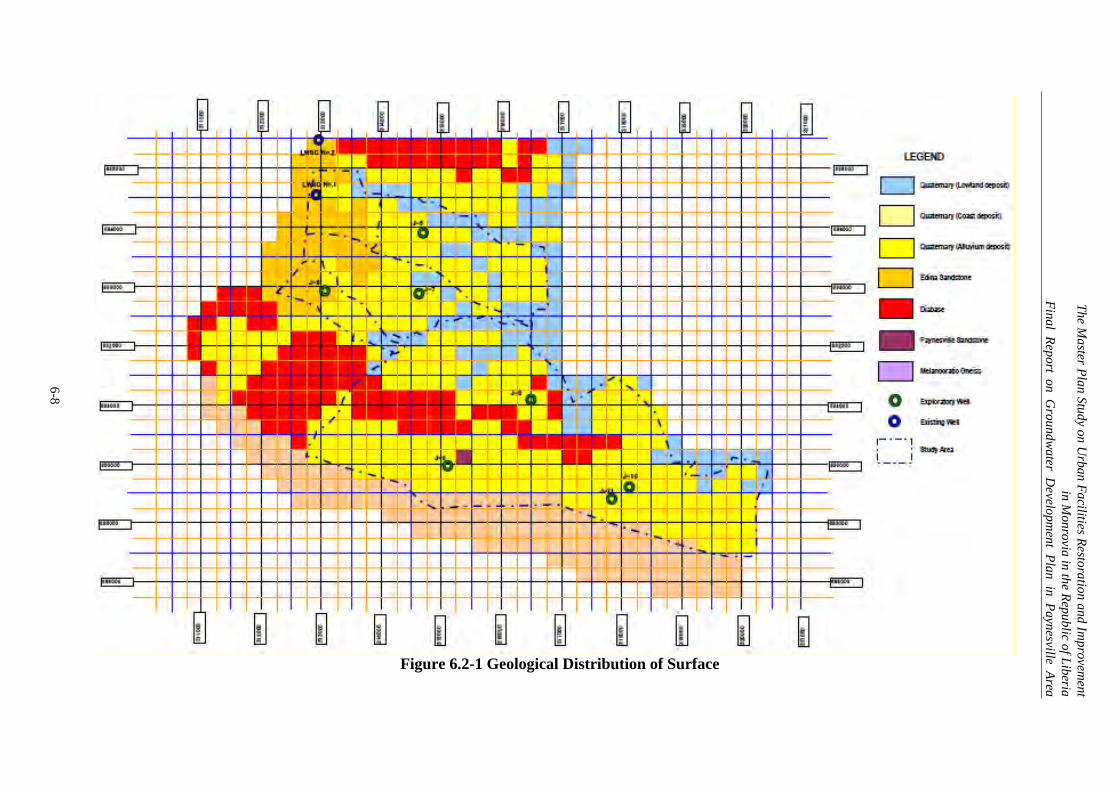
The M
aster Plan Study on U
rban Facilities R
estoration and Improvem
ent in M
onrovia in the Republic of L
iberiaF
inal Report on G
roundwater D
evelopment P
lan in Paynesville A
rea
6-8
Figure 6.2-1 Geological Distribution of Surface

The M
aster Plan Study on U
rban Facilities R
estoration and Improvem
ent in M
onrovia in the Republic of L
iberiaF
inal Report on G
roundwater D
evelopment P
lan in Paynesville A
rea
6-9
Figure 6.2-2 Geological Distribution of Deep portion

The M
aster Plan Study on U
rban Facilities R
estoration and Improvem
ent in M
onrovia in the Republic of L
iberiaF
inal Report on G
roundwater D
evelopment P
lan in Paynesville A
rea
6-10
Figure 6.2-3 Groundwater Development Potential Indicated by Transmissivity

The M
aster Plan Study on U
rban Facilities R
estoration and Improvem
ent in M
onrovia in the Republic of L
iberiaF
inal Report on G
roundwater D
evelopment P
lan in Paynesville A
rea
6-11
Figure 6.2-4 Groundwater Development Potential and Water Quality Contamination Area
311000
312000
313000
314000
315000
316000
317000
318000
319000
320000
321000
695000
694000
693000
692000
691000
690000
689000
688000
311000
312000
313000
314000
315000
316000
317000
318000
319000
320000
321000
695000
694000
693000
692000
691000
690000
689000
688000
J-9
J-11
J-10
J-8
J-5
J-7J-6
LWSC No.1
LWSC No.2 LEGEND
Transmissivity
>= 50 m2/day
10- 50 m2/day
5- 10 m2/day
1- 5 m2/day
<1 m2/day
Exploratory Well
Existing Well
Week Lineament
Study Area
Arsenic: 0.017mg/L (WHO:
Color: 16.4 degree (WHO: <15)
Iron: 0.53 mg/L (WHO: <0.3)
Nickel: 0.033mg/L (WHO:
Color: 42.1 degree (WHO: <15)
Iron: 0.85 mg/L (WHO: <0.3)
Arsenic: 0.011mg/L (WHO:
Arsenic & Iron content exceeds WHO standard
Arsenic content exceeds WHO standard
Nickel & Iron content exceeds WHO standard
Iron exceeds WHO standard
Turbidity: 29.2 (WHO: <5)
Color: 56.8 degree (WHO:
<15)

The Master Plan Study on Urban Facilities Restoration and Improvement in Monrovia in the Republic of Liberia
Final Report on Groundwater Development Plan in Paynesville Area
7-1
7. GROUNDWATER DEVELOPMENT PLAN 7.1 Direction of Groundwater Development The direction of groundwater development plan is set up as follows. 1) The structure zone concerning the Diabase intrusion such as crackly zone, fault or fracture zone,
and boundary zone with Diabase rock bodies sometimes form fissure type aquifer and water producing capacity is rather high in comparison with the Paynesville sandstone. The structure zone is as a main target to develop ground water. The Pynesville sandstone has possibility of water producing is also a important target.
2) The Tertiary Edina sandstone and Quaternary deposit is also sub target to obtain the ground water
from two sources in one well, One is shallow aquifer and main is deeper aquifer. 3) The rank classification for estimation of water producing capacity of well shown in Table 7.1-1 is
applied.
Table 7.1-1 Rank Classification of Water Producing Capacity of Well
Rank Category based on
Transmissivity Description
A >= 50m3/day/m Yield comparable as LWSC Well No.1 and J-9 B 10-50 m3/day/m Yield comparable as LWSC Well No.2 and J-6, J-8 and J-11 C 5-10 m3/day/m Yield comparable as Well J-1
4) The sustainable groundwater development is performed. That is, the withdrawal of groundwater exceeding the amount of groundwater recharge by rainfall every year is not performed. 7.2 Groundwater Development Area and Required Amount The ground water development target area is Duport road north-east community, Duport road north community, Duport road south community, Paynesville Joe Bar Community, Rehab/ Borbor town community. However, according to the result of the study, the following condition is confirmed. 1) The Duport road north east community area has not enough water producing capacity of well. 2) Duport road south community and Paynesville Joe Bar Community has arsenic and partly iron
contamination problem. 3) J-9 area of Rehab/ Borbor town community has iron and nickel contamination problem. For these areas the required water should be supplied from other area, or downsizing of project area is necessary to select. In the study the plan is examined as that all necessary water volume is developed in good producing area, and delivered by water tanker etc.
Table 7.2-1 Required Water Supply Amount of Each Community to Recharge
Area Water Supply AmountMean
Annual Rainfall
Amount of Rainfall
Recharge Supply
Amount/ RechargeID. Community
km2 m3/day m3/yr mm m3/yr m3/yr %
1107 Duport Road North-East 3.324 1,136 414,458 3,500 11,634,000 1,163,400 36
1108 Duport Road North 1.241 568 207,229 4,300 5,336,300 533,630 39
1109 Duport Road South 2.65 871 317,751 4,000 10,600,000 1,060,000 30
1117 Paynesville Joe Bar 1.018 606 221,044 4,500 4,581,000 458,100 48
1123 Rehab / Borbor Town 15.977 1,211 442,088 4,085 65,266,045 6,526,605 7
The total required amount is 4,391m3/day(.Duport road north-east community; 1,136n3/day, Duport

The Master Plan Study on Urban Facilities Restoration and Improvement in Monrovia in the Republic of Liberia
Final Report on Groundwater Development Plan in Paynesville Area
7-2
road north community; 568m3, Duport road south community; 871m3/day, Paynesville Joe Bar Community; 606m3/day, and Rehab/ Borbor town community;1211m3/day). 7.3 Possible Yield The possible yield for rank classification of producing capacity of well is set as shown in Table 7.3-1 referring to Table 6.1-2 and Table 6.1-3.
Table 7.3-1 Possible Yield Item Rank A Rank B Rank C
Possible yield / well (L/nin) 500 350 100 Possible yield / well (m3/day) 240 168 48 Pumping duration (hour/day) 8 8 8 Drawdown (m) 10-15 10-15 10-15
To 19 wells are necessary incase of rank A well,, 27 wells are required in case of rank B and 92 wells in case of rank C.. 7.4 Well Specification The well structure is shown in Figure 7.4-1. Two type well specifications united with amount of yield are prepared, and the selection of specification (well diameter change) of the well is used properly.
Figure 7.4-1 Standard Structure of Production Well

The Master Plan Study on Urban Facilities Restoration and Improvement in Monrovia in the Republic of Liberia
Final Report on Groundwater Development Plan in Paynesville Area
7-3
7.5 Well Arrangement The well arrangement in case of rank B well is shown in Figure 7.5-1.
31
10
00
31
200
0
31
300
0
31
400
0
31
50
00
31
600
0
31
700
0
31
800
0
31
90
00
32
00
00
32
10
00
6 95000
694000
693000
692000
691000
690000
689000
688000
31
10
00
31
20
00
31
30
00
31
40
00
31
50
00
31
60
00
31
70
00
31
80
00
31
90
00
32
00
00
32
10
00
6 95000
694000
693000
692000
691000
690000
689000
688000
J-9
J-11
J-10
J-8
J-5
J-7J-6
LWSC No.1
LWSC No.2
Figure 7.5-1 Arrangement of Production Wells for Groundwater Development Project
7.6 Public Water Tap Work The public water tap system is installed based on the criteria shown in Table 7.6-1. The image of public water tap is shown in Figure 7.6-1.
Table 7.6-1 Criteria of Public Water Tap and Hand Pump Installation Category Criteria
Public Water Tap Installation Yield >= 1.5 L/sec & satisfaction of WHO’s water quality standard Hand Pump Installation 0.3 L/sec <= Y <1.5 L/sec & satisfaction of WHO’s standard No Installation Y < 0.3 L/sec or dissatisfaction of WHO’s standard
Figure 7.6-1 Image of Water Tap Installation System
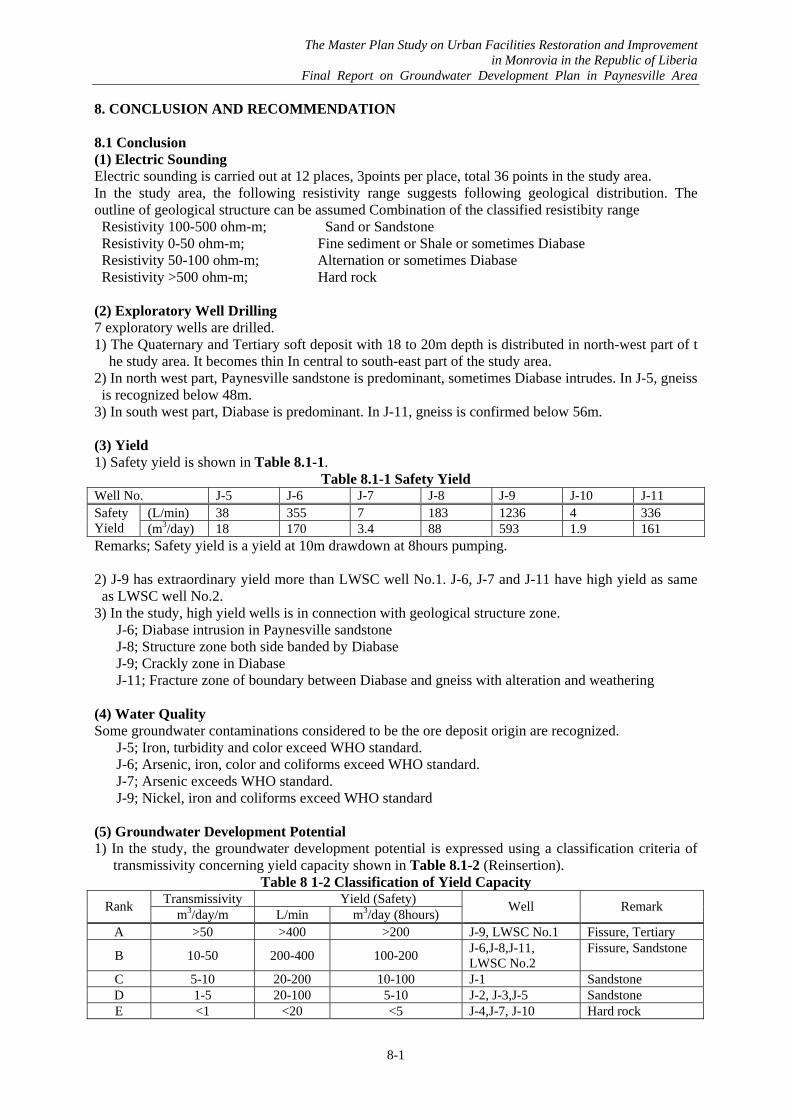
The Master Plan Study on Urban Facilities Restoration and Improvement in Monrovia in the Republic of Liberia
Final Report on Groundwater Development Plan in Paynesville Area
8-1
8. CONCLUSION AND RECOMMENDATION 8.1 Conclusion (1) Electric Sounding Electric sounding is carried out at 12 places, 3points per place, total 36 points in the study area. In the study area, the following resistivity range suggests following geological distribution. The outline of geological structure can be assumed Combination of the classified resistibity range Resistivity 100-500 ohm-m; Sand or Sandstone Resistivity 0-50 ohm-m; Fine sediment or Shale or sometimes Diabase Resistivity 50-100 ohm-m; Alternation or sometimes Diabase Resistivity >500 ohm-m; Hard rock (2) Exploratory Well Drilling 7 exploratory wells are drilled. 1) The Quaternary and Tertiary soft deposit with 18 to 20m depth is distributed in north-west part of t
he study area. It becomes thin In central to south-east part of the study area. 2) In north west part, Paynesville sandstone is predominant, sometimes Diabase intrudes. In J-5, gneiss
is recognized below 48m. 3) In south west part, Diabase is predominant. In J-11, gneiss is confirmed below 56m. (3) Yield 1) Safety yield is shown in Table 8.1-1.
Table 8.1-1 Safety Yield Well No. J-5 J-6 J-7 J-8 J-9 J-10 J-11
(L/min) 38 355 7 183 1236 4 336 Safety Yield (m3/day) 18 170 3.4 88 593 1.9 161 Remarks; Safety yield is a yield at 10m drawdown at 8hours pumping. 2) J-9 has extraordinary yield more than LWSC well No.1. J-6, J-7 and J-11 have high yield as same
as LWSC well No.2. 3) In the study, high yield wells is in connection with geological structure zone. J-6; Diabase intrusion in Paynesville sandstone J-8; Structure zone both side banded by Diabase J-9; Crackly zone in Diabase J-11; Fracture zone of boundary between Diabase and gneiss with alteration and weathering (4) Water Quality Some groundwater contaminations considered to be the ore deposit origin are recognized. J-5; Iron, turbidity and color exceed WHO standard. J-6; Arsenic, iron, color and coliforms exceed WHO standard. J-7; Arsenic exceeds WHO standard. J-9; Nickel, iron and coliforms exceed WHO standard (5) Groundwater Development Potential 1) In the study, the groundwater development potential is expressed using a classification criteria of
transmissivity concerning yield capacity shown in Table 8.1-2 (Reinsertion). Table 8 1-2 Classification of Yield Capacity
Transmissivity Yield (Safety) Rank
m3/day/m L/min m3/day (8hours) Well Remark
A >50 >400 >200 J-9, LWSC No.1 Fissure, Tertiary
B 10-50 200-400 100-200 J-6,J-8,J-11, LWSC No.2
Fissure, Sandstone
C 5-10 20-200 10-100 J-1 Sandstone D 1-5 20-100 5-10 J-2, J-3,J-5 Sandstone E <1 <20 <5 J-4,J-7, J-10 Hard rock

The Master Plan Study on Urban Facilities Restoration and Improvement in Monrovia in the Republic of Liberia
Final Report on Groundwater Development Plan in Paynesville Area
8-2
2) High yield condition is considered to be in area along Diabase belt. Inside Diabase mass is supposed to be rather low yield.
(6) Problem of Target Area In Figure 8.1-1(Reinsertion), the water quality contamination area is indicated on groundwater development potential map. The problem area is as follows.
1) Paynesville Joe Bar Community to Duport Road South Community; Groundwater development is difficult due to contamination containing arsenic, partly iron.
2) Central area of Rehab/ Borbor Town Community; Groundwater development is difficult due to contamination containing nickel and iron.
3) Dup0rt Road North East Community; Groundwater development is difficult due to low yield capacity and partly high iron content.
Figure 8.1-1 Groundwater Development Potential and Contamination Area (7) Groundwater Development Plan In the report, the groundwater development plan with following direction is proposed. 1) All required volume of 5 communities, that is 4,391 m3/day, is target for development. 2) Development is carried out in possible area with high yield capacity. It is sometimes apart from
community residence. Necessary well number is 27 in case of rank B yield capacity. In the study the success rate of rank B well is 57%, and it becomes 29% in case of including contamination. 8.2 Recommendation (1) Investigation of Geological Structure Zone At present, the success rate of grade B well is rather low. If the full-scale production well construction project is commenced, it generates large amount of useless drilling, The second additional investigation along the foot areas of Diabase belt is necessary to confirm the certain yield capacity and the success rate of well before going into a full-scale project..
311000
312000
313000
314000
315000
316000
317000
318000
319000
320000
321000
695000
694000
693000
692000
691000
690000
689000
688000
311000
312000
313000
314000
315000
316000
317000
318000
319000
320000
321000
695000
694000
693000
692000
691000
690000
689000
688000
J-9
J-11
J-10
J-8
J-5
J-7J-6
LWSC No.1
LWSC No.2 LEGEND
Transmissivity
>= 50 m2/day
10- 50 m2/day
5- 10 m2/day
1- 5 m2/day
<1 m2/day
Exploratory Well
Existing Well
Week Lineament
Study Area
Arsenic: 0.017mg/L (WHO:
Color: 16.4 degree (WHO: <15)
Iron: 0.53 mg/L (WHO: <0.3)
Nickel: 0.033mg/L (WHO:
Color: 42.1 degree (WHO: <15)
Iron: 0.85 mg/L (WHO: <0.3)
Arsenic: 0.011mg/L (WHO:
Arsenic & Iron content exceeds WHO standard
Arsenic content exceeds WHO standard
Nickel & Iron content exceeds WHO standard
Iron exceeds WHO standard
Turbidity: 29.2 (WHO: <5)
Color: 56.8 degree (WHO:
<15)

The Master Plan Study on Urban Facilities Restoration and Improvement in Monrovia in the Republic of Liberia
Final Report on Groundwater Development Plan in Paynesville Area
8-3
(2) Stage Development The target area is divided and a project is advanced from the high area of the possibility of development. It starts from Rehab/ Borbor Town Community and amount of water has a margin, and after the possibility of water supply in other areas is checked, next stage development for other areas is advanced. (3) Device of Well Work and Well Structure 1) Pre-proceeding drilling At first, 6”pre-proceeding drilling is carried out. After getting information, the size of completion well is decided, and the reaming work is performed up to completion depth. 2) Selection of the well structure united with amount of yield At some wells with large amount of yield, well diameter is enlarged and it enables to install a big pump, thus, well number can be reduced. However, it is necessary to change the scale of a public water tap system. 3) Well completion with 2 sources from shallow aquifer and deep aquifer. At some area where the Quaternary and Tertiary deposit are thick and available to use, the screen is set at both of shallow aquifer portion and deeper aquifer portion in a well. In case that well completion work becomes slightly complicated. After preparing temporary steel casing, gravel pack, fine-grained-soil filling, gravel pack, and fine-grained-soil filling are performed through steel casing, and steel casing needs to be extracted. (4) Establishment and Capacity Development of Water Quality Analysis Organization In order to judge the propriety of well completion and to lessen futility according to water quality, foundation and training of the organization which can do water analysis speedily are required.