Embed Size (px)
Citation preview
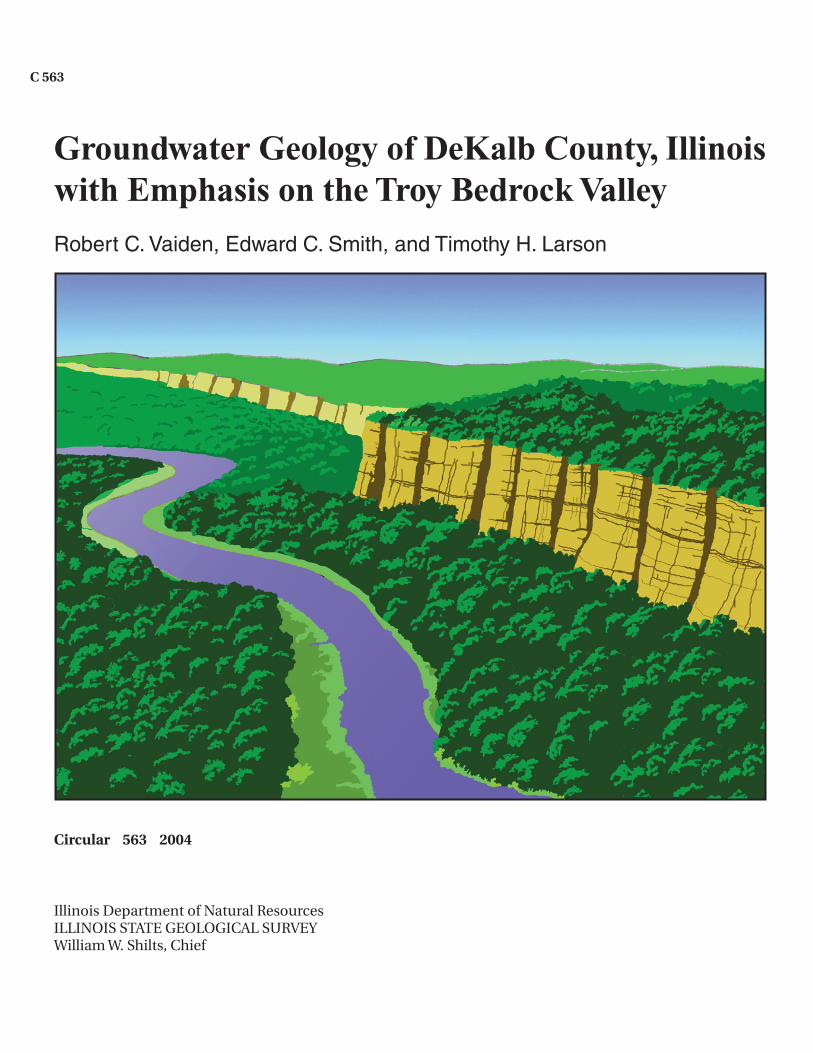
Groundwater Geology of DeKalb County, Illinois with Emphasis on the Troy Bedrock Valley
Robert C. Vaiden, Edward C. Smith, and Timothy H. Larson
C 563
Circular 563 2004
Illinois Department of Natural ResourcesILLINOIS STATE GEOLOGICAL SURVEYWilliam W. Shilts, Chief
Equal opportunity to participate in programs of the Illinois Department of Natural Resources (IDNR) and those funded by the U.S. Fish and Wildlife Service and other agencies is available to all individuals regardless of race, sex, national origin, disability, age, religion, or other non-merit factors. If you believe you have been discriminated against, contact the funding source’s civil rights office and/or the Equal Employment Opportunity Officer, IDNR, One Natural Resources Way, Springfield, Illinois 62701-1271; 217-785-0067; TTY 217-782-9175.
This information may be provided in an alternative format if required. Contact the IDNR Clearinghouse at 217-782-7498 for assistance.
AcknowledgmentsThis project was primarily funded through the Illinois Department of Natural Resources Water Inven-tory and Aquifer Assessment Program. The authors gratefully acknowledge the cooperation of H.I. Stone and Sons, Inc., well drillers, Professor Colin Booth of Northern Illinois University, Gerald Bever and Ralph Tompkins of the City of DeKalb, Larry Thomas of Baxter and Woodman—Consulting Engi-neers, and staff of the University of Illinois Agricultural Research Station, DeKalb County. We also thank Timothy C. Young and Steven L. Sargent of the Illinois State Geological Survey for assistance in geo-physical field operations conducted for this study. The manuscript benefited from reviewers sugges-tions and editorial assistance.
Released by the authority of the State of Illinois 3/04
Editorial Board
Jonathan H. Goodwin, Chair Michael L. Barnhardt David R. Larson Anne L. Erdmann Donald G. Mikulic
William R. Roy
Front Cover: Artist’s rendering, based on well log and geophysical data, of the depositional history of the Troy Bedrock Valley. This view shows the near-vertical dolomite cliffs lining the valley. Total elevation change from the river to the top of the bluffs is more than 200 feet with a vertical drop approaching 150 feet.
Circular 563 2004
Illinois Department of Natural ResourcesILLINOIS STATE GEOLOGICAL SURVEYWilliam W. Shilts, Chief615 E. Peabody DriveChampaign, Illinois 61820-6964217-333-4747www.isgs.uiuc.edu
Groundwater Geology of DeKalb County, Illinois, with Emphasis on the Troy Bedrock Valley
Robert C. Vaiden, Edward C. Smith, and Timothy H. Larson

Contents
Abstract 1
Introduction 1Previous Studies 1
Data Sources and Methods 3
Geophysical Logging 3
Natural Gamma-Ray Log 5
Neutron Log 5
Maps 5
Cross Sections 5
Landscape of the Study Area 5
Bedrock Geology 7
Bedrock Topography 11
Glacial Geology 11Thickness of Quaternary Materials 14
Sediments of the Troy Bedrock Valley 14
Down-Valley Cross Section 16
Geophysical Cross Section 16
Regional Cross Sections 17
Interpreted Geologic History 22
Pre-glacial River Erosion of the Valley 22
Glacial Fluvial Deposition 22
Lacustrine-dominated Deposition in the Troy Valley 23
Glacial Diamicton Deposition 23
Groundwater Geology 23Bedrock Aquifers 23
Sand and Gravel Aquifers 24
Troy Bedrock Valley Aquifer 24
Middle Aquifer 27
Upper Aquifer 27
Surfi cial (Henry Formation) Aquifers 27
Aquifer Distribution 27
Conclusions 27
References 30
Appendices 311 Test Hole Descriptions 31
2 Natural Gamma-Ray and Neutron Logs 39
1
Figures
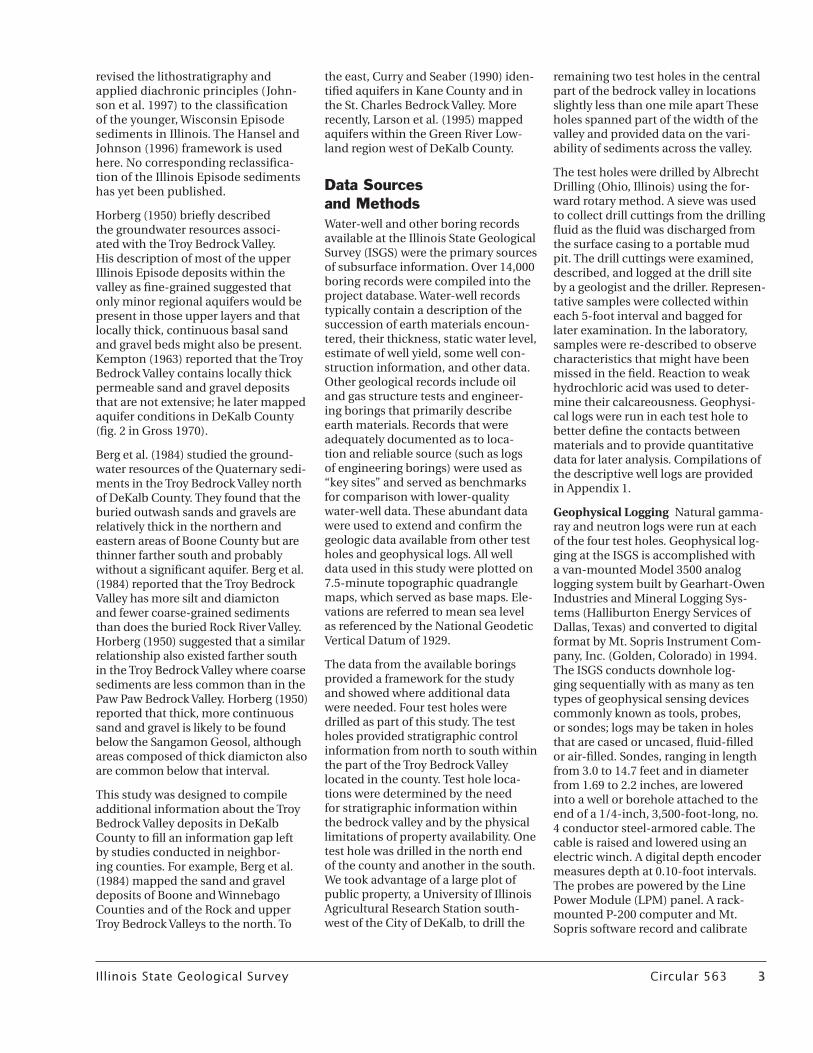
1 Test holes and data locations 2
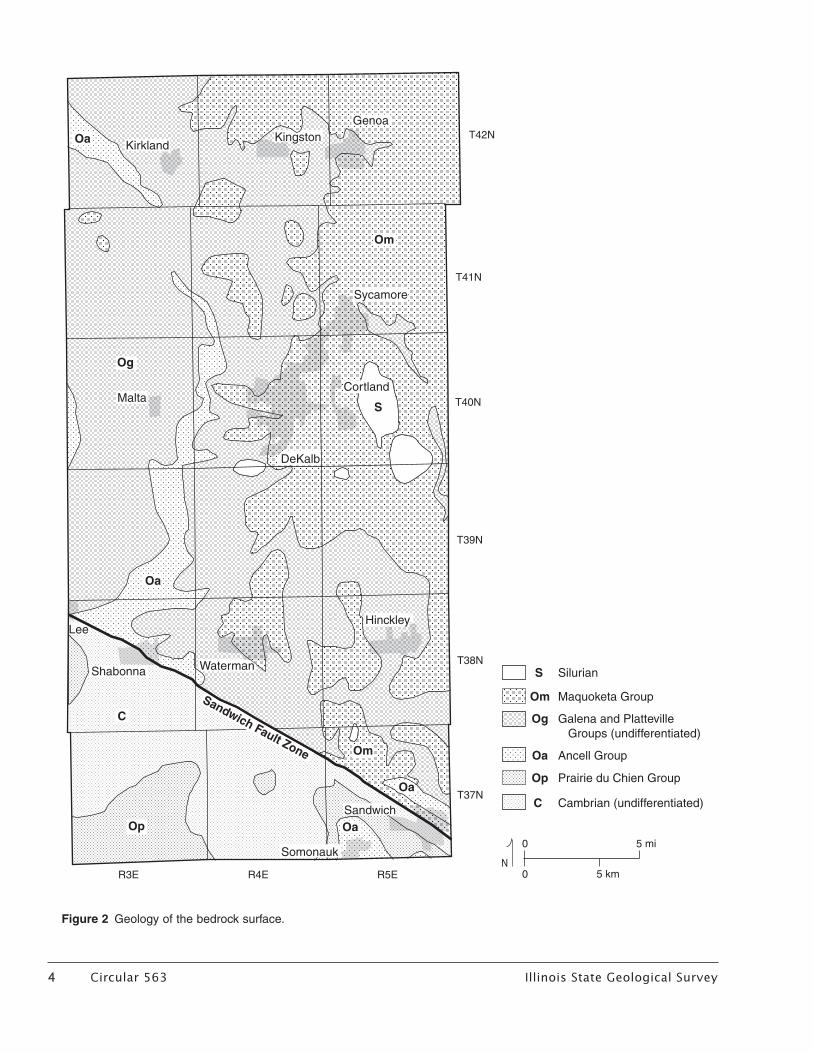
2 Geology of the bedrock surface 4
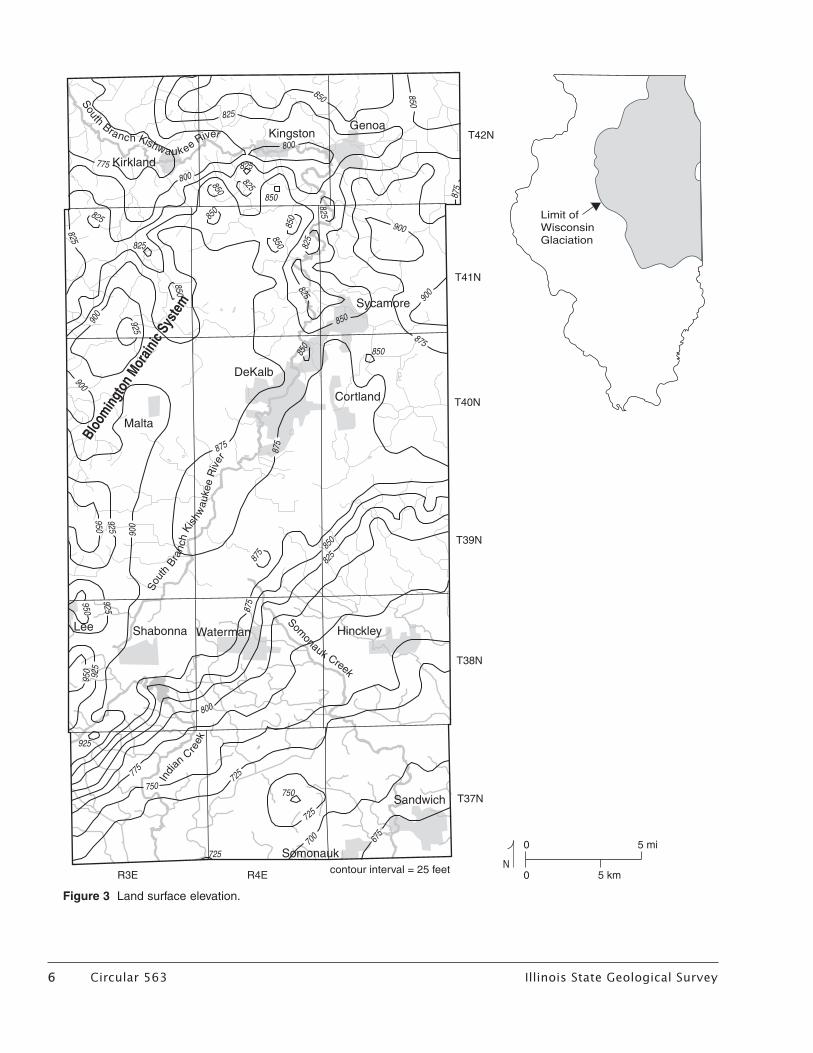
3 Land surface elevation 6
4 Regional stratigraphy 8
5 Thickness of the Ancell Group 9
6 Elevation of the top of the Ancell Group 10
7 Thickness of the bedrock overlying the Ancell Group 12
8 Elevation of the bedrock surface 13
9 Thickness of the Quaternary materials 15
10 Schematic diagram of glacial sediments showing their stratigraphic relationships 16
11 Down-valley cross section A–A� 17
12 Cross sections B–B�, C–C�, D–D�, E–E�, and F–F� 18
13 Surfi cial Quaternary deposits 20
14 Artist’s rendering, based on well log and geophysical data, of the depositional history of the Troy Bedrock Valley 21
15 Down-valley geophysical log information for cross section A–A� 22
16 Thickness of the basal sand in the Troy Bedrock Valley 25
17 Distribution of the middle unit aquifer materials 26
18 Distribution of the upper unit aquifer materials 28
19 Idealized diagram of Troy Bedrock Valley aquifers 29
Illinois State Geological Survey Circular 563 1
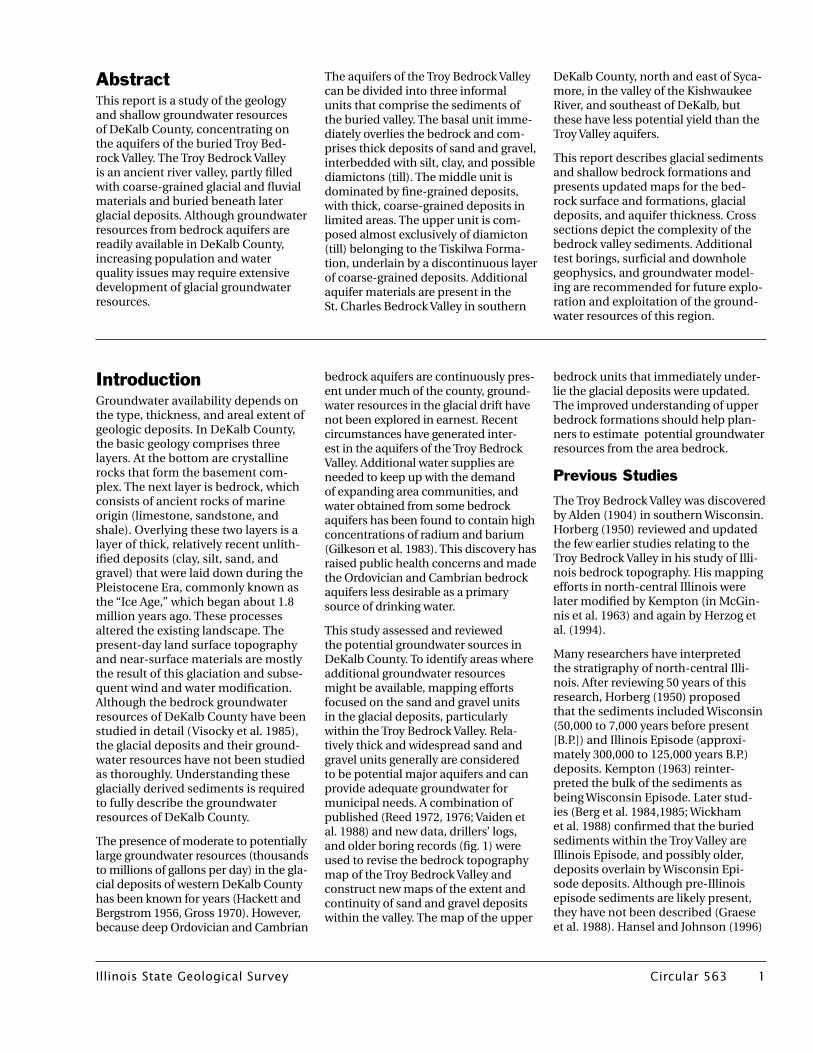
IntroductionGroundwater availability depends on the type, thickness, and areal extent of geologic deposits. In DeKalb County, the basic geology comprises three layers. At the bottom are crystalline rocks that form the basement com-plex. The next layer is bedrock, which consists of ancient rocks of marine origin (limestone, sandstone, and shale). Overlying these two layers is a layer of thick, relatively recent unlith-ifi ed deposits (clay, silt, sand, and gravel) that were laid down during the Pleistocene Era, commonly known as the “Ice Age,” which began about 1.8 million years ago. These processes altered the existing landscape. The present-day land surface topography and near-surface materials are mostly the result of this glaciation and subse-quent wind and water modifi cation. Although the bedrock groundwater resources of DeKalb County have been studied in detail (Visocky et al. 1985), the glacial deposits and their ground-water resources have not been studied as thoroughly. Understanding these glacially derived sediments is required to fully describe the groundwater resources of DeKalb County.
The presence of moderate to potentially large groundwater resources (thousands to millions of gallons per day) in the gla-cial deposits of western DeKalb County has been known for years (Hackett and Bergstrom 1956, Gross 1970). However, because deep Ordovician and Cambrian
AbstractThis report is a study of the geology and shallow groundwater resources of DeKalb County, concentrating on the aquifers of the buried Troy Bed-rock Valley. The Troy Bedrock Valley is an ancient river valley, partly fi lled with coarse-grained glacial and fl uvial materials and buried beneath later glacial deposits. Although groundwater resources from bedrock aquifers are readily available in DeKalb County, increasing population and water quality issues may require extensive development of glacial groundwater resources.
bedrock aquifers are continuously pres-ent under much of the county, ground-water resources in the glacial drift have not been explored in earnest. Recent circumstances have generated inter-est in the aquifers of the Troy Bedrock Valley. Additional water supplies are needed to keep up with the demand of expanding area communities, and water obtained from some bedrock aquifers has been found to contain high concentrations of radium and barium (Gilkeson et al. 1983). This discovery has raised public health concerns and made the Ordovician and Cambrian bedrock aquifers less desirable as a primary source of drinking water.
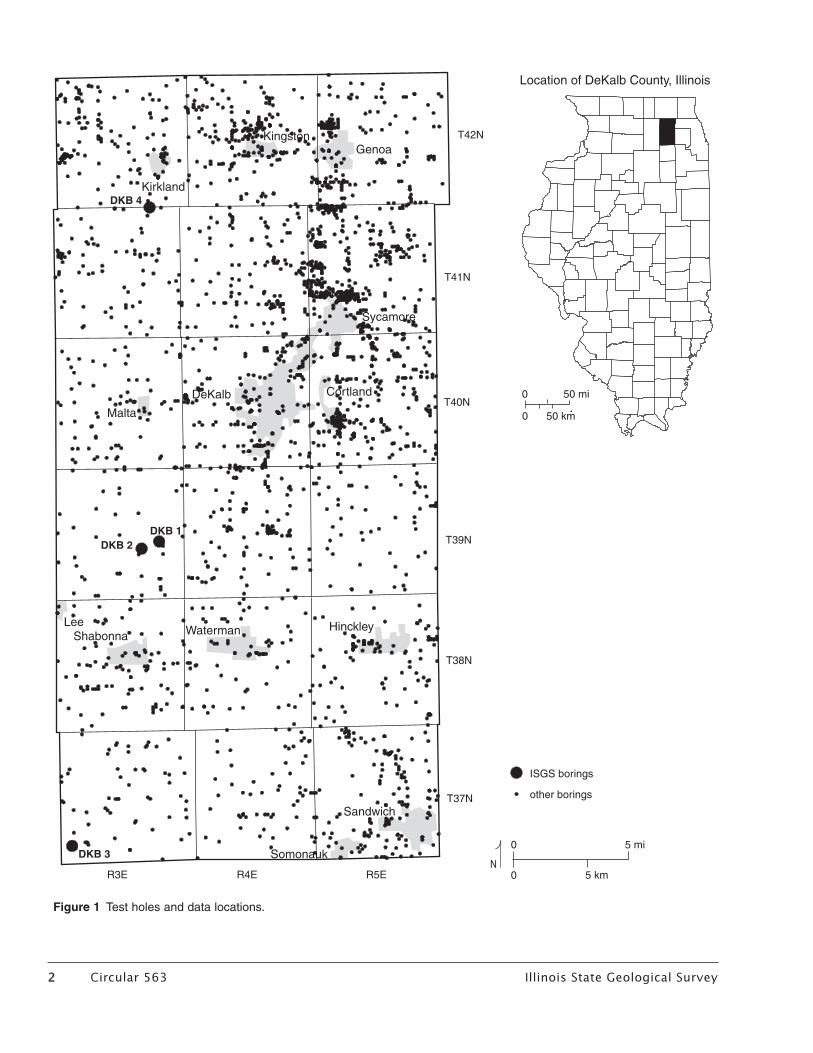
This study assessed and reviewed the potential groundwater sources in DeKalb County. To identify areas where additional groundwater resources might be available, mapping efforts focused on the sand and gravel units in the glacial deposits, particularly within the Troy Bedrock Valley. Rela-tively thick and widespread sand and gravel units generally are considered to be potential major aquifers and can provide adequate groundwater for municipal needs. A combination of published (Reed 1972, 1976; Vaiden et al. 1988) and new data, drillers’ logs, and older boring records (fi g. 1) were used to revise the bedrock topography map of the Troy Bedrock Valley and construct new maps of the extent and continuity of sand and gravel deposits within the valley. The map of the upper
The aquifers of the Troy Bedrock Valley can be divided into three informal units that comprise the sediments of the buried valley. The basal unit imme-diately overlies the bedrock and com-prises thick deposits of sand and gravel, interbedded with silt, clay, and possible diamictons (till). The middle unit is dominated by fi ne-grained deposits, with thick, coarse-grained deposits in limited areas. The upper unit is com-posed almost exclusively of diamicton (till) belonging to the Tiskilwa Forma-tion, underlain by a discontinuous layer of coarse-grained deposits. Additional aquifer materials are present in the St. Charles Bedrock Valley in southern
DeKalb County, north and east of Syca-more, in the valley of the Kishwaukee River, and southeast of DeKalb, but these have less potential yield than the Troy Valley aquifers.
This report describes glacial sediments and shallow bedrock formations and presents updated maps for the bed-rock surface and formations, glacial deposits, and aquifer thickness. Cross sections depict the complexity of the bedrock valley sediments. Additional test borings, surfi cial and downhole geophysics, and groundwater model-ing are recommended for future explo-ration and exploitation of the ground-water resources of this region.
bedrock units that immediately under-lie the glacial deposits were updated. The improved understanding of upper bedrock formations should help plan-ners to estimate potential groundwater resources from the area bedrock.
Previous Studies
The Troy Bedrock Valley was discovered by Alden (1904) in southern Wisconsin. Horberg (1950) reviewed and updated the few earlier studies relating to the Troy Bedrock Valley in his study of Illi-nois bedrock topography. His mapping efforts in north-central Illinois were later modifi ed by Kempton (in McGin-nis et al. 1963) and again by Herzog et al. (1994).
Many researchers have interpreted the stratigraphy of north-central Illi-nois. After reviewing 50 years of this research, Horberg (1950) proposed that the sediments included Wisconsin (50,000 to 7,000 years before present [B.P.]) and Illinois Episode (approxi-mately 300,000 to 125,000 years B.P.) deposits. Kempton (1963) reinter-preted the bulk of the sediments as being Wisconsin Episode. Later stud-ies (Berg et al. 1984,1985; Wickham et al. 1988) confi rmed that the buried sediments within the Troy Valley are Illinois Episode, and possibly older, deposits overlain by Wisconsin Epi-sode deposits. Although pre-Illinois episode sediments are likely present, they have not been described (Graese et al. 1988). Hansel and Johnson (1996)
2 Circular 563 Illinois State Geological Survey Illinois State Geological Survey Circular 563 3
Figure 1 Test holes and data locations.
�
� ����
�����
��������
�������������
��������
������ ��������
�����
����������� �������� ��������
��������
��������
DKB 4
DKB 2DKB 1
DKB 3
��� ��� ���
����
����
����
����
����
����
������������
�������������
�����������������������������������
� �����
� �����
2 Circular 563 Illinois State Geological Survey Illinois State Geological Survey Circular 563 3
revised the lithostratigraphy and applied diachronic principles (John-son et al. 1997) to the classification of the younger, Wisconsin Episode sediments in Illinois. The Hansel and Johnson (1996) framework is used here. No corresponding reclassifica-tion of the Illinois Episode sediments has yet been published.
Horberg (1950) briefly described the groundwater resources associ-ated with the Troy Bedrock Valley. His description of most of the upper Illinois Episode deposits within the valley as fine-grained suggested that only minor regional aquifers would be present in those upper layers and that locally thick, continuous basal sand and gravel beds might also be present. Kempton (1963) reported that the Troy Bedrock Valley contains locally thick permeable sand and gravel deposits that are not extensive; he later mapped aquifer conditions in DeKalb County (fig. 2 in Gross 1970).
Berg et al. (1984) studied the ground-water resources of the Quaternary sedi-ments in the Troy Bedrock Valley north of DeKalb County. They found that the buried outwash sands and gravels are relatively thick in the northern and eastern areas of Boone County but are thinner farther south and probably without a significant aquifer. Berg et al. (1984) reported that the Troy Bedrock Valley has more silt and diamicton and fewer coarse-grained sediments than does the buried Rock River Valley. Horberg (1950) suggested that a similar relationship also existed farther south in the Troy Bedrock Valley where coarse sediments are less common than in the Paw Paw Bedrock Valley. Horberg (1950) reported that thick, more continuous sand and gravel is likely to be found below the Sangamon Geosol, although areas composed of thick diamicton also are common below that interval.
This study was designed to compile additional information about the Troy Bedrock Valley deposits in DeKalb County to fill an information gap left by studies conducted in neighbor-ing counties. For example, Berg et al. (1984) mapped the sand and gravel deposits of Boone and Winnebago Counties and of the Rock and upper Troy Bedrock Valleys to the north. To
the east, Curry and Seaber (1990) iden-tified aquifers in Kane County and in the St. Charles Bedrock Valley. More recently, Larson et al. (1995) mapped aquifers within the Green River Low-land region west of DeKalb County.
Data Sourcesand MethodsWater-well and other boring records available at the Illinois State Geological Survey (ISGS) were the primary sources of subsurface information. Over 14,000 boring records were compiled into the project database. Water-well records typically contain a description of the succession of earth materials encoun-tered, their thickness, static water level, estimate of well yield, some well con-struction information, and other data. Other geological records include oil and gas structure tests and engineer-ing borings that primarily describe earth materials. Records that were adequately documented as to loca-tion and reliable source (such as logs of engineering borings) were used as “key sites” and served as benchmarks for comparison with lower-quality water-well data. These abundant data were used to extend and confirm the geologic data available from other test holes and geophysical logs. All well data used in this study were plotted on 7.5-minute topographic quadrangle maps, which served as base maps. Ele-vations are referred to mean sea level as referenced by the National Geodetic Vertical Datum of 1929.
The data from the available borings provided a framework for the study and showed where additional data were needed. Four test holes were drilled as part of this study. The test holes provided stratigraphic control information from north to south within the part of the Troy Bedrock Valley located in the county. Test hole loca-tions were determined by the need for stratigraphic information within the bedrock valley and by the physical limitations of property availability. One test hole was drilled in the north end of the county and another in the south. We took advantage of a large plot of public property, a University of Illinois Agricultural Research Station south-west of the City of DeKalb, to drill the
remaining two test holes in the central part of the bedrock valley in locations slightly less than one mile apart These holes spanned part of the width of the valley and provided data on the vari-ability of sediments across the valley.
The test holes were drilled by Albrecht Drilling (Ohio, Illinois) using the for-ward rotary method. A sieve was used to collect drill cuttings from the drilling fluid as the fluid was discharged from the surface casing to a portable mud pit. The drill cuttings were examined, described, and logged at the drill site by a geologist and the driller. Represen-tative samples were collected within each 5-foot interval and bagged for later examination. In the laboratory, samples were re-described to observe characteristics that might have been missed in the field. Reaction to weak hydrochloric acid was used to deter-mine their calcareousness. Geophysi-cal logs were run in each test hole to better define the contacts between materials and to provide quantitative data for later analysis. Compilations of the descriptive well logs are provided in Appendix 1.
Geophysical Logging Natural gamma-ray and neutron logs were run at each of the four test holes. Geophysical log-ging at the ISGS is accomplished with a van-mounted Model 3500 analog logging system built by Gearhart-Owen Industries and Mineral Logging Sys-tems (Halliburton Energy Services of Dallas, Texas) and converted to digital format by Mt. Sopris Instrument Com-pany, Inc. (Golden, Colorado) in 1994. The ISGS conducts downhole log-ging sequentially with as many as ten types of geophysical sensing devices commonly known as tools, probes, or sondes; logs may be taken in holes that are cased or uncased, fluid-filled or air-filled. Sondes, ranging in length from 3.0 to 14.7 feet and in diameter from 1.69 to 2.2 inches, are lowered into a well or borehole attached to the end of a 1/4-inch, 3,500-foot-long, no. 4 conductor steel-armored cable. The cable is raised and lowered using an electric winch. A digital depth encoder measures depth at 0.10-foot intervals. The probes are powered by the Line Power Module (LPM) panel. A rack-mounted P-200 computer and Mt. Sopris software record and calibrate
4 Circular 563 Illinois State Geological Survey Illinois State Geological Survey Circular 563 5
Figure 2 Geology of the bedrock surface.
������
��
����������������
�����
��������
�������������
���
�������� ��������
��������
��������
��� ��� ���
����
����
����
����
����
����
�
��
��
��
��
��
�
��
��
��
��
�
���������������
��������
��������������������������������������������������
��
��
�
������������
����������������������
���������������������������
�
� ����
�����
��������
�������������������
4 Circular 563 Illinois State Geological Survey Illinois State Geological Survey Circular 563 5
the downhole signals as the sonde is withdrawn upward through the bore-hole, providing a continuous digital record. Because the downhole signals are digital, the logs can be analyzed and reproduced at any scale desired.
Natural Gamma-Ray Log A natural gamma-ray (or “gamma log”) log is a graph of the gross gamma radiation (high-energy electromagnetic radia-tion) emitted by the earth materials surrounding the sonde. Most natural earth radiation is generated from iso-topes of potassium-40, thorium-232, and uranium-238. In Illinois, these ele-ments are most abundant in clay min-erals and less concentrated in clean quartz sand, gravel, and pure dolomite or limestone rock. Consequently, low values on natural gamma logs normally indicate zones of porous and perme-able earth materials in unconsolidated deposits. Whether fluid or air-filled and whether plastic- or steel-cased, the nature of the borehole generally has only a limited effect on the levels of radiation detected by the sodium iodide crystal in the gamma sonde. The detection radius generally is about 6 inches but may be greater in some instances. ISGS natural gamma logs are graduated in counts per second, Amer-ican Petroleum Institute (API) values, or both. The API values can be related to oil field borehole logs.
The chief use of the natural gamma log is in stratigraphic correlation and identification of lithology. Detrital sedi-ments with fine-grained textures such as shale, buried soil zones, and silty lake clay normally have the highest gamma-ray intensities.
Neutron Log The neutron log is potentially one of the most useful logs in hydrogeologic investigations because the sonde responds to hydro-gen concentrations in and around the borehole. The ISGS sonde uses a 3.0-Ci americium-241/beryllium (241Am/Be) source, which has a flux of 6.67 x 10⁶ neutrons per second and is screwed onto the bottom of the probe. Above the source is the helium-3 detector tube, which is used to detect the influx of epithermal neutrons (0.1 to 100 eV) originating as fast neutrons (more than 100,000 eV) from the 241Am/Be source. The neutrons emitted in the form of
fast neutrons from the source are even-tually slowed down, either becoming epithermal or thermal neutrons or else being captured by hydrogen. Hydrogen is the most effective element in slow-ing and capturing neutrons because its nucleus has nearly the same mass as a neutron. Because the flux of fast neutrons is inversely proportional to the amount of hydrogen present and because most of the hydrogen present is in water, the flux is inversely propor-tional to the amount of water. In other words, when water fills interstitial pore space, the neutron log records relative amounts of rock porosity. A decrease in the detection of fast neutrons (counts per second decreases) indicates a relative increase in hydrogen content, or increased porosity. An increase in the detection of fast neutrons would, therefore, indicate a decrease in hydro-gen content, or decreased porosity.
A neutron log cannot discriminate between hydrogen associated with native formation water and hydrogen in bound water associated with hydroxyl ions (OH) found in clay minerals, the primary constituents of shales. As a result, shale and other deposits that are rich in clay minerals may have log departures that resemble high porosity on neutron logs. Natural gamma logs are used to determine the clay mineral content and allow hydrogen associa-tions to be differentiated. Neutron logs of sandstones, limestones, and dolo-mites that have very low clay mineral content are good indicators of relative porosity. The radius of investigation of the neutron probe is about 12 inches but may be more in some instances. ISGS logs can be graduated in both counts per second and/or API values.
The geophysical logs are depicted in Appendix 2.
Maps The maps presented here were created using traditional hand-con-touring methods and software for contouring and surface mapping. Maps showing unconsolidated aqui-fers and bedrock surface elevation were mapped by hand on 7.5-minute U.S. Geological Survey (USGS) quad-rangle base maps. The contour lines were then digitized and brought into the ArcInfoTM geographic information system (ESRI 1998). The drawn lines
were then converted to points and re-contoured with the SurferTM contour-ing package using an inverse distance algorithm (Golden Software 1999). The inverse distance algorithm was chosen in this instance because it more closely reproduced the actual contours of the land surface. Digitization and re-grid-ding allowed these data to be com-bined with verified bedrock surface points from well data to improve the accuracy and reliability of the resulting surface. The bedrock topography map was used with the land surface eleva-tion map to create the derivative drift thickness map. Land surface informa-tion was obtained from the Aurora and Elgin USGS 30-minute quadrangle digital line graphs. Data used to con-struct all of the contour maps were interpolated to uniform grids to allow for comparisons between grid surfaces. Contour intervals for each map were selected to allow for ready interpreta-tion by the reader. Locations of subsur-face data points are shown on figure 1.
North of the Sandwich Fault Zone, bedrock subcrop units were mapped by plotting the data on 7.5-minute topographic maps (fig. 2). Previously published mapping data were used for the bedrock subcrop geology south of the Sandwich Fault Zone (Kolata et al. 1978).
Cross Sections Cross sections were created by hand from appropriate data, working from 7.5-minute USGS quad-rangle base maps. The down-valley cross section connects data points that follow the valley; the remaining cross sections follow straight east to west or north to south lines. Data from nearby points were extrapolated onto the cross section lines.
Landscape of theStudy AreaThe land surface topography of DeKalb County is dominated by a series of ridges that are part of the Bloomington Morainic System (fig. 3). These end moraines trend northeast to southwest and span most of the width of DeKalb County. Elevations reach more than 950 feet along the western edge of the county. The elevation drops to less than 775 feet in the northwest corner
6 Circular 563 Illinois State Geological Survey Illinois State Geological Survey Circular 563 7
Figure 3 Land surface elevation.
�����
������ ���������� �����
��������
�������������
��������
������
��������
�����
��� �������� �������� ��������
��������
��������
��� ���
����
����
����
����
����
����
Bloo
min
gton
Mor
ainic
Syst
em
��������������������������
���
�����
���
����
���
���
���
��
�������� �����
����
�����
��
���������������������������
�
� ����
�����
850
875
850
875
850
800
825
825
850
850
800825
850825
775
825
825
850
900
925
825
825850
850
825
850
850
900
900
875
875
900
900
925
950
950
925
875
875
850
825
800
950 925
925
775
750
725
725
725
700
750
675
6 Circular 563 Illinois State Geological Survey Illinois State Geological Survey Circular 563 7
of the county and to less than 675 feet in the southeast corner. The Bloom-ington Morainic System was created as the glaciers began retreating to the northeast during the last episode (Wis-consin) of glaciation approximately 17,000 years ago (Hansel and Johnson 1996). The end moraines of several glacial advances during the Wisconsin Episode combined to form the massive moraine structure. Subsequent erosion dissected the moraine complex and the surrounding landscape with stream val-leys such as Indian Creek, Somonauk Creek, and the South Branch of the Kishwaukee River. The moraines cause surface drainage in the county to flow generally to the north and west, from north of a diagonal extending from T38N R3E to T41N R5E, and toward the south and east, south of the diagonal. The uplands of the moraine contain numerous hummocks, depressions, and wetlands and were poorly drained prior to installation of extensive drain-age tiles and ditches.
Bedrock GeologyThe bedrock underlying DeKalb County is composed of layers of sandstone, dolomite, limestone, and shale depos-ited, for the most part, in relatively shallow seas that covered the mid North American continent from about 550 to 400 million years ago. Younger sedi-mentary rocks were probably deposited, but later eroded. Today, the bedrock is buried beneath less than 25 feet to as much as 475 feet of glacial sediments.
Paleozoic rocks of Cambrian, Ordovi-cian, and Silurian age make up the bedrock of DeKalb County (figs. 2 and 4). The following discussion of the bed-rock geology and stratigraphy is based on more detailed descriptions by Will-man (1973), Willman and Kolata (1978), and Kolata and Graese (1983).
The Sandwich Fault Zone (fig. 2), described by Kolata et al. (1978), is a northwest- to southeast–trending series of high-angle faults that extend from Ogle County to Will County. Dis-placement along the fault line ranges from inches to over 800 feet. In DeKalb County, the Sandwich Fault Zone extends from the northwest corner of T38N R3E to the southeast corner of T37N R5E. Maximum displacement
along the fault zone in DeKalb County, about 180 feet, is found in T37N R5E near Sandwich. The rocks on the south-ern side of the fault are upthrown.
The Eminence Formation, the geo-logically oldest unit encountered at the bedrock surface in DeKalb County, is the uppermost formation of Cambrian-aged bedrock (fig. 4). It is a light-colored gray to light brown, sandy, oolitic dolo-mite and underlies all of the county. It subcrops only south of the Sandwich Fault Zone (fig. 2), where it is mapped as “Cambrian (undifferentiated).” The formation is up to 50 feet thick in this area and is conformably overlain by the Prairie du Chien Group (Willman 1973, Willman and Kolata 1978, Kolata and Graese 1983).
The Prairie du Chien Group, the oldest of the Ordovician units that subcrop in the county, is composed of limestone and cherty dolomite with interbedded sandstones. It subcrops only south of the Sandwich Fault Zone. The Prairie du Chien Group comprises four princi-pal formations: the Gunter Sandstone, the Oneota Dolomite, the New Rich-mond Sandstone, and the Shakopee Dolomite. The dolomites are relatively pure, and the sandstones are dolo-mitic. The thickness of these units and their occurrence near the Sandwich Fault Zone are highly variable, but the total thickness of the group is gener-ally less than 50 feet. The thickness of the Prairie du Chien Group increases to more than 300 feet just south of DeKalb County. The rather abrupt thin-ning of the group in DeKalb County implies that these units were originally thicker in DeKalb County and that a long period of erosion took place after the deposition of the Prairie du Chien Group. This interpretation is supported by the very irregular base of the Ancell. Because the rocks making up the Prai-rie du Chien Group are mostly carbon-ates, a karstic surface formed with large sinkholes and other solution features. The resulting landscape contained a tremendous amount of relief as the rock was dissolved away. This land-scape was subsequently submerged, and the thick sand beds that then filled and covered the irregular karst surface became the St. Peter Sandstone of the Ancell Group.
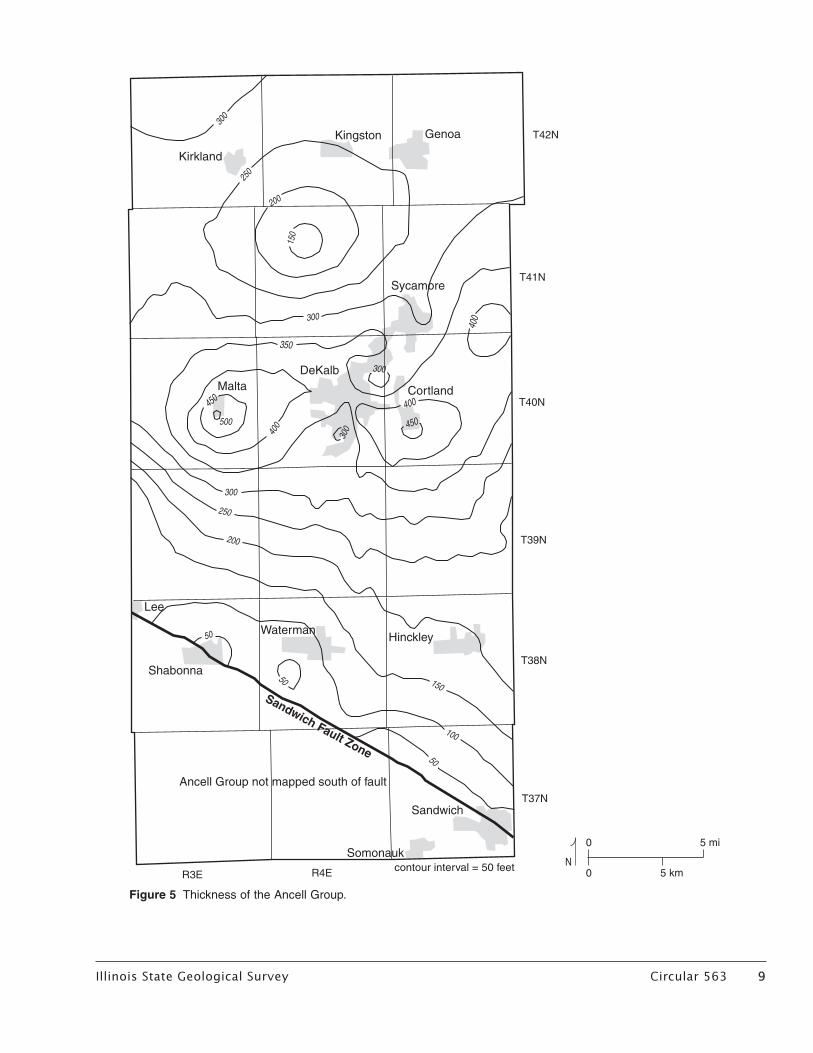
The Ancell Group, consisting of the St. Peter Sandstone and the Glenwood Sandstone, unconformably overlies the Prairie du Chien Group (fig. 2). It subcrops through much of the center of the Troy Bedrock Valley, south of the Sandwich Fault Zone and in a fault block just north of the Sandwich Fault Zone in T37N R5E. The irregular karstic erosional surface of the Prairie du Chien Group causes the Ancell Group to vary greatly in thickness (fig. 5). The Ancell is absent from much of southern DeKalb County, and its thickness was not mapped south of the Sandwich Fault Zone because only eroded remnants are present. North of the Sandwich Fault Zone, the Ancell Group attains a thickness of more than 500 feet in DeKalb County and more than 700 feet in a few places in northeastern Illinois (Willman et al. 1975). Structure contour maps of the elevation of the top of the Ancell Group (Visocky et al. 1985) and the St. Peter Sandstone (Lamar 1927) were used as the base for our more detailed map of the Ancell Group. The St. Peter Sandstone and the Glenwood Sand-stone were mapped as a single unit because of the difficulty of differentiat-ing the two sandstones on the basis of descriptions in well logs.
The St. Peter Sandstone is characterized as a clean, white, well-sorted, fine- to medium-grained, friable sandstone. In drill cuttings, it resembles white beach sand. In places, chert or thin clay beds are found at the base. The overlying Glenwood Sandstone can be variable in nature. It typically is an argillaceous, dolomitic sandstone, but may contain silty dolomite or dolomitic shale.
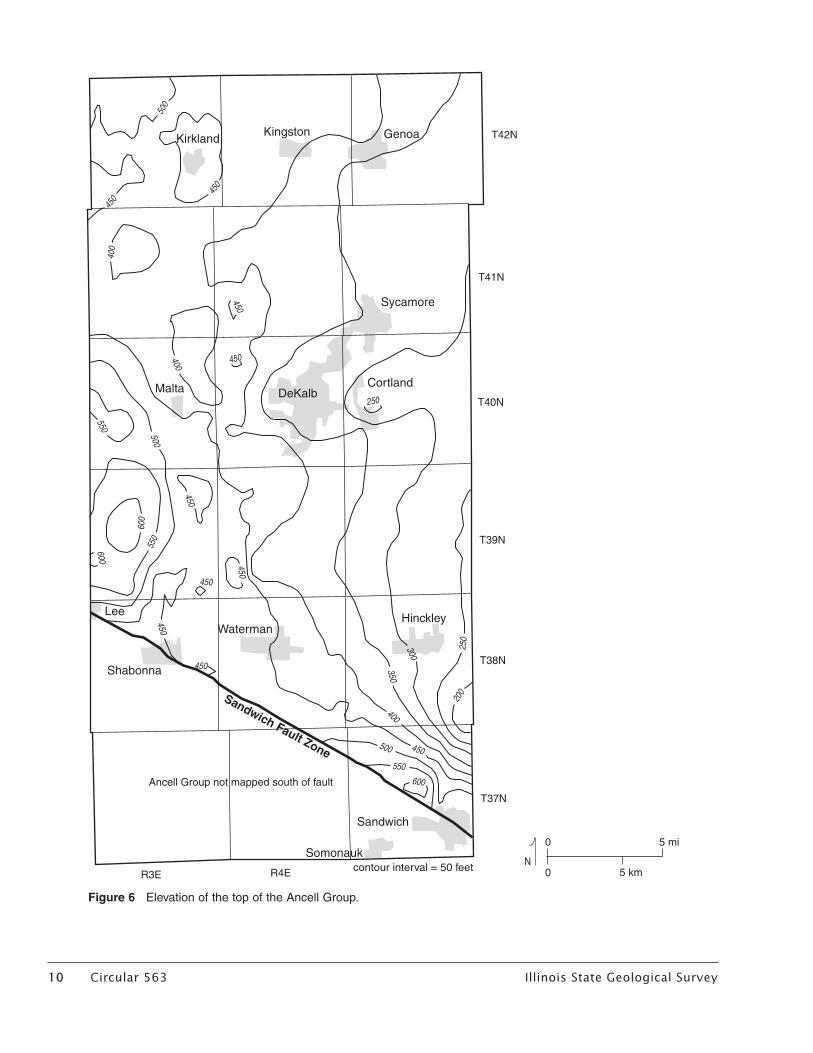
The upper surface of the Ancell Group (fig. 6) is relatively smooth and slopes gently toward the east. The surface was not mapped southward of the Sand-wich Fault Zone because the original surface of the Ancell Group was eroded and the Ancell is absent in much of this area. This erosion did not occur between the time of its deposition or during the deposition of the immedi-ately overlying bedrock units. Rather, the shoreline where the sandstones of the Ancell Groups were deposited retreated northward as the shallow seas deepened and the thick units of lime-stone and dolomite were deposited.

8 Circular 563 Illinois State Geological Survey Illinois State Geological Survey Circular 563 9
ERAQ
UAT
ER
NA
RY
SY
ST
EM
SIL
UR
IAN
FORMATION(thickness in feet)G
roup
GRAPHICCOLUMN
(not to scale) DESCRIPTION Aqu
i-gr
oup
OR
DO
VIC
IAN
CE
NO
ZO
ICPA
LEO
ZO
IC
CA
MB
RIA
N
Maq
uoke
taG
alen
aP
latte
ville
Anc
ell
Pra
irie
duC
hien
PRECAMBRIAN granite
ShakopeeNew RichmondOneotaGunter
NedaBrainardFort Atkinson
Scales
(0–500)
(0–50)
(0–200)
(0–350)
(0–500)Glenwood-St. Peter
(0–300)
Eminence
Potosi(0–200)
Franconia (80–130)
(100–300)Ironton-Galesville
(200–450)Eau Claire
Mt. Simon (1,500–2,500)
loess (wind-blown silt)
sand and gravel
diamicton (clay, silt, sand, gravel, and boulders;commonly till)
dolomite, fine-grained, cherty
shale, argillaceous dolomite and limestone
Pra
irie
Upp
er B
edro
c kM
idw
est B
edro
ckB
asal
Bed
rock
Cry
stal
-lin
e
dolomite, some limestone, fine- to medium-grained, slightly cherty
sandstone, white, fine- to medium-grained, sandy
dolomite, sandstone
dolomite, fine- to medium-grained, sandy
dolomite, fine-grained, trace sand and glauconite
sandstone, fine-grained, glauconitic; green andred shale
sandstone, fine- to medium-grained, dolomitic
sandstone, fine-grained, glauconitic; siltstone,shale, and dolomite
sandstone, white, coarse-grained, poorly sorted
bedrock valley deposits (sand, silt, and diamicton)
Figure 4 Regional stratigraphy (modified from Visocky et al. 1985; Vaiden et al. 1988).
8 Circular 563 Illinois State Geological Survey Illinois State Geological Survey Circular 563 9
��������
�������� �����
��������
������
�������������
���
��������
����������������
��������
��������
���
����
����
����
����
����
����
��� ��������������������������
Sandwich Fault Zone
��������������������������������������
�
� ����
�����
50
50
50
100
150
200
250
300
300400 450
400
300
500
450
350
300
400
150
200
250
300
Figure 5 Thickness of the Ancell Group.
10 Circular 563 Illinois State Geological Survey Illinois State Geological Survey Circular 563 11
���������������� �����
��������
�������������������
���
��������
����������������
��������
��������
���
����
����
����
����
����
����
��� ��������������������������
Sandwich Fault Zone
��������������������������������������
300
200
250
350
450
400
500
550
600
450450
450450
250
450
450
400450
500
550
550
600
600
400
450
500
450
�
� ����
�����
Figure 6 Elevation of the top of the Ancell Group.
10 Circular 563 Illinois State Geological Survey Illinois State Geological Survey Circular 563 11
The contact between the sandstone of the Ancell Group and the dolomite of the conformably overlying Platteville Group is easily identified. The lithologic change is especially striking because of the marked color contrast in drill cut-tings between the groups.
The Platteville Group (fig. 4) consists of brown and blue-gray, lithographic dolomite or dolomite-mottled lime-stone. The overlying Galena Group is made up of light brown to gray dolo-mite and limestone and was mapped with the similar Platteville Group (see fig. 2). These two groups reach a combined thickness of over 200 feet along the eastern edge of the county and form the bedrock surface through most of the western half of the county north of the Sandwich Fault Zone (fig. 2). They are unconformably overlain by the Maquoketa Group.
The Maquoketa Shale Group is made up of silty, dolomitic shale with some thin dolomite and limestone beds within the middle of the group. The Maquoketa Shale Group comprises the Scales Shale, Fort Atkinson Lime-stone, Brainard Shale, and the Neda Formation. The group is present at the bedrock surface in the eastern third of the county and therefore varies greatly in thickness throughout that area. Where the overlying Silurian dolomite is present, the Maquoketa Shale Group may reach a thickness of over 125 feet (center of T40N R5E). Elsewhere, ero-sion has reduced the group to less than 75 feet thick (Willman 1973, Willman and Kolata 1978, Kolata and Graese 1983).
Silurian dolomite occurs in DeKalb County only as isolated erosional outliers less than 50 feet thick in T40N R5E and T39N R5E (fig. 2). The dolomite is quarried near Cortland because of its desirable properties as construction aggregate.
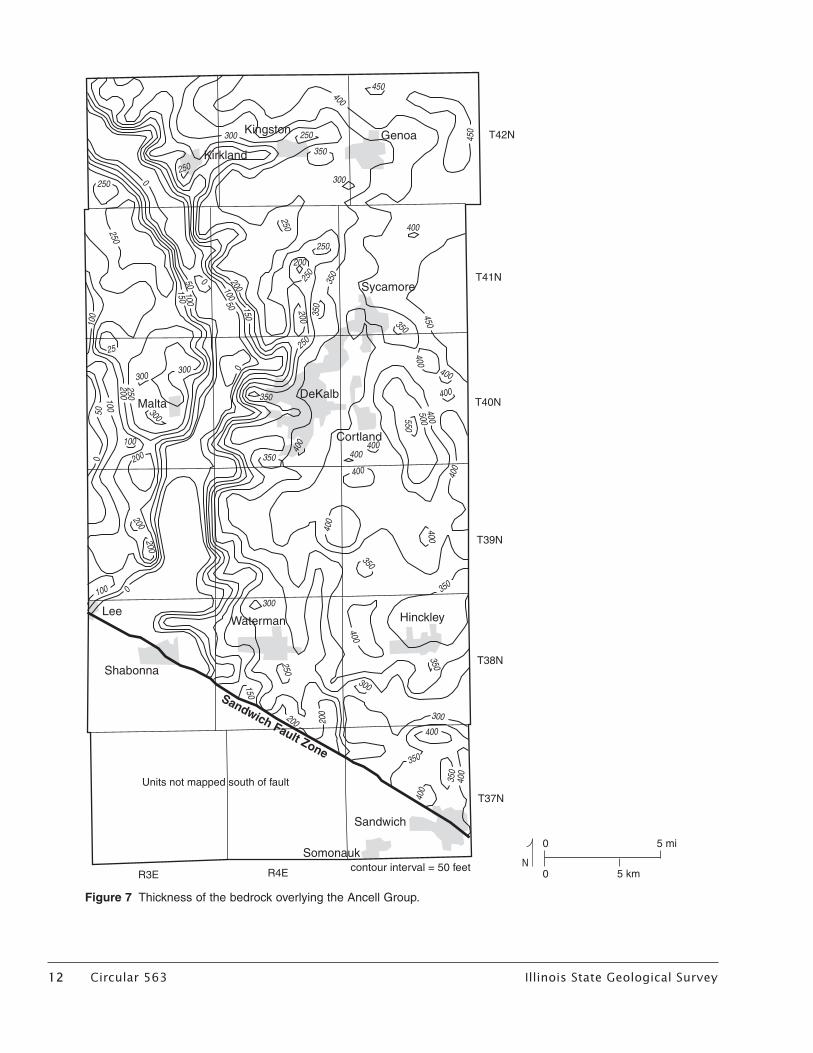
The thickness of the bedrock units overlying the Ancell Group were combined into a single thickness map (fig. 7) because the rock types are similar, and well construction reports and water-well drillers’ descriptive logs generally do not provide enough detail to differentiate among them. All of these units provide only limited
amounts of groundwater. These units do not extend south of the Sandwich Fault Zone because they were eroded away on the upthrown side of the fault.
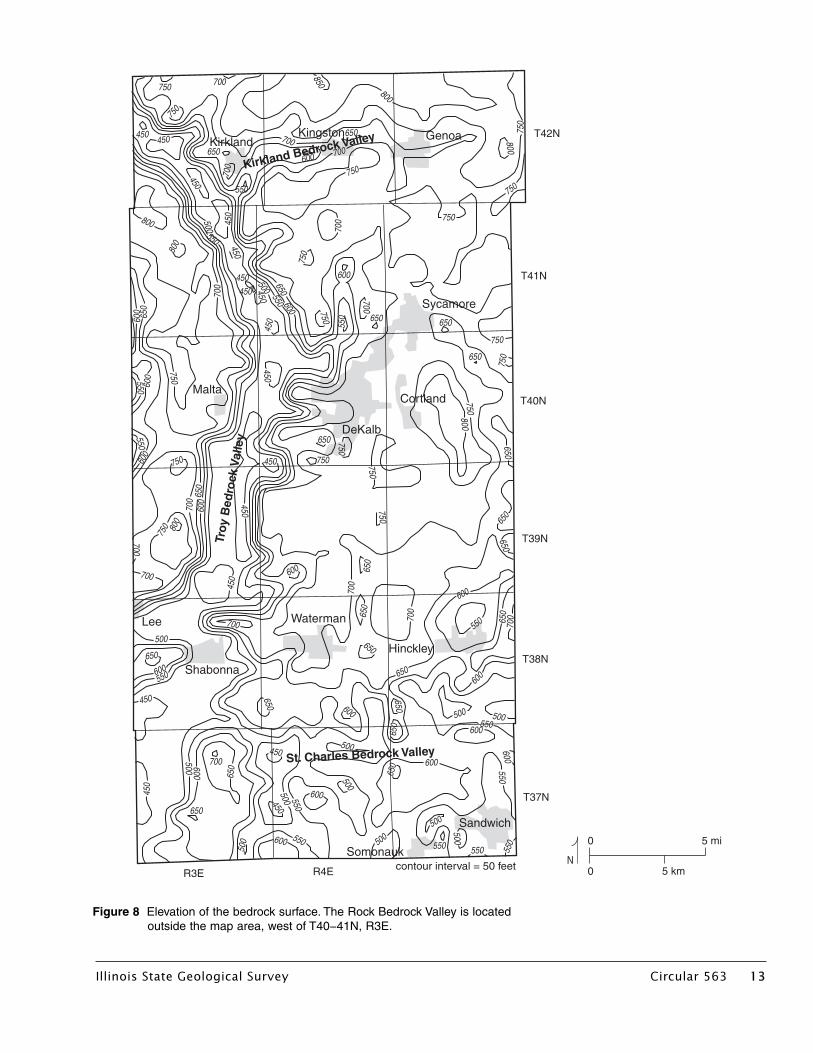
Bedrock TopographyThe bedrock topography of DeKalb County is clearly dominated by the Troy Bedrock Valley (fig. 8). The Troy Bedrock Valley enters DeKalb County at the northwest corner of the county, trends southeast, and then south before bending southwest and exiting the county in the southwest corner. Relief between the valley bottom and the surrounding uplands is 250 to 300 feet throughout much of the valley’s length. This deep incision into the bedrock occurred prior to glaciation (Horberg 1950). The trend of the valley axis, from northwest to southeast and then turning approximately northeast to southwest, is likely due to the joint pattern within the bedrock. The pre-dominant orientation of the bedrock joint system, generated by regional stress fields, is northeast-southwest and northwest-southeast in northern Illinois (Foote 1982).
Although relatively few wells reach bedrock within the valley, the narrow range of bedrock elevation values obtained from the valley floor indi-cates that the Troy Bedrock Valley is characterized by a wide, relatively flat floodplain channel. Erosion has probably modified the channel into a gently undulating surface with a general downward slope from north to south. There is some evidence for valley floor elevations less than 450 feet. These well data may represent a deeper main channel or possibly local erosional features that do not represent a continuous part of the main channel. The close physical proximity of the valley floor to the uplands, shown by well and geo-physical data, implies steep or vertical valley side walls. Therefore, the Troy Bedrock Valley, prior to subsequent in-filling, probably had a relatively flat valley floor flanked by limestone cliffs 100 feet or more in height, resembling a larger version of the modern-day Kishwaukee River valley to the north. The geometry of the valley is likely the result of fluvial ero-
sion prior to the deposition of Illinois Episode sediments.
The eastern edge of the Rock Bedrock Valley is found along the western edge of the county, west of Malta. The bed-rock surface is also dissected by sev-eral major tributary valleys, all enter-ing from the east (fig. 8). In the north, a tributary of the Troy, here named the Kirkland Bedrock Valley, trends slightly south of west and intersects the main valley near the southeast corner of T42N R3E. Other tributary valleys intersecting the Troy Bedrock Valley are found in T40N R4E, west and north of the City of DeKalb, and in T37N R3E in southern DeKalb County. The southern tributary valley, the St. Charles Bedrock Valley, trends gener-ally westward from its origin in Kane County, passing south of Hinckley. The occurrence of sand and gravel deposits within the St. Charles Bedrock Valley make it a noteworthy aquifer in Kane County (Curry and Seaber 1990). How-ever, the valley is not well explored in DeKalb County and warrants further investigation. The exact morphology of the valley is not well defined because of a lack of subsurface data in south-eastern DeKalb County.
The bedrock uplands (fig. 8) range from gently rolling to relatively flat topography. Upland elevations range from more than 850 feet in the north to less than 600 feet in the south; there is a general decrease in eleva-tion toward the south. Bedrock sur-face elevations approach or exceed 800 feet along the north-central edge of the county and at isolated bedrock “highs” in the east-central part of the county. One of these highs, consist-ing of resistant Silurian dolomite, rises to over 825 feet elevation east of Cortland and is mined for aggregate (center of T40N R5E).
Glacial GeologyThe glacial geology of DeKalb County consists of Illinois Episode deposits overlain by thicker, more recent glacial deposits. In the Troy Bedrock Valley, thick deposits of Illinois Episode out-wash, diamicton, and lacustrine silt and clay are capped by thick Wisconsin Episode diamicton deposits.
12 Circular 563 Illinois State Geological Survey Illinois State Geological Survey Circular 563 13
��������
�������� �����
��������
������
��������
�����
���
��������
�������� ��������
��������
��������
���
����
����
����
����
����
����
��� ��������������������������
Sandwich Fault Zone
�������������������������������
�
� ����
�����
500
150
100
250200
350
300
450
400
100
200
100
25
300300
200
0100
200
250
200
300
300
400350
400
400
400400
300
350
400
400
350
400
350
350
400
400
400400
400
400550
500
400
350
350
250
0
200
200
50
0
100
350
250
150
200
250
350
250250
50100
150
250 0
250
250300
300
450
350
400
450
200
Figure 7 Thickness of the bedrock overlying the Ancell Group.
Illinois State Geological Survey Circular 563 1313
KirklandKingston Genoa
Sycamore
DeKalb
0
0 5 mi
5 kmN
CortlandMalta
Lee
Shabonna
Waterman
Hinckley
Sandwich
Somonauk
R3E
T42N
T37N
T38N
T39N
T40N
T41N
R4E contour interval = 50 feet
Troy
Bed
rock
Val
ley
St. Charles Bedrock Valley
Kirkland Bedrock Valley
550
450
450
500 600
650
500
500 550
550600
600
650
700450
500
500
650
500
600
650
600
450 650
550600650
500
700
650
650
650
650
700
700
650
600
750
450700
700
750 80
0
750
700 65
060
0 450
450 750
650 750
600
750
450
750
600550
600 650
700
450
45045
0
450500
550 600650
750
550
600
450
450
450
800
800550
500
550
750
700
650450450
750
700
600
750 700
750
700
700
650
850
800
700
500
650
500
550 550 550
550600
600550
500500
600
550 650
700
600
650
650
650
750800
650
650
750
750
750
750
750
800
Figure 8 Elevation of the bedrock surface. The Rock Bedrock Valley is located outside the map area, west of T40−41N, R3E.
1414 Circular 563 Illinois State Geological Survey
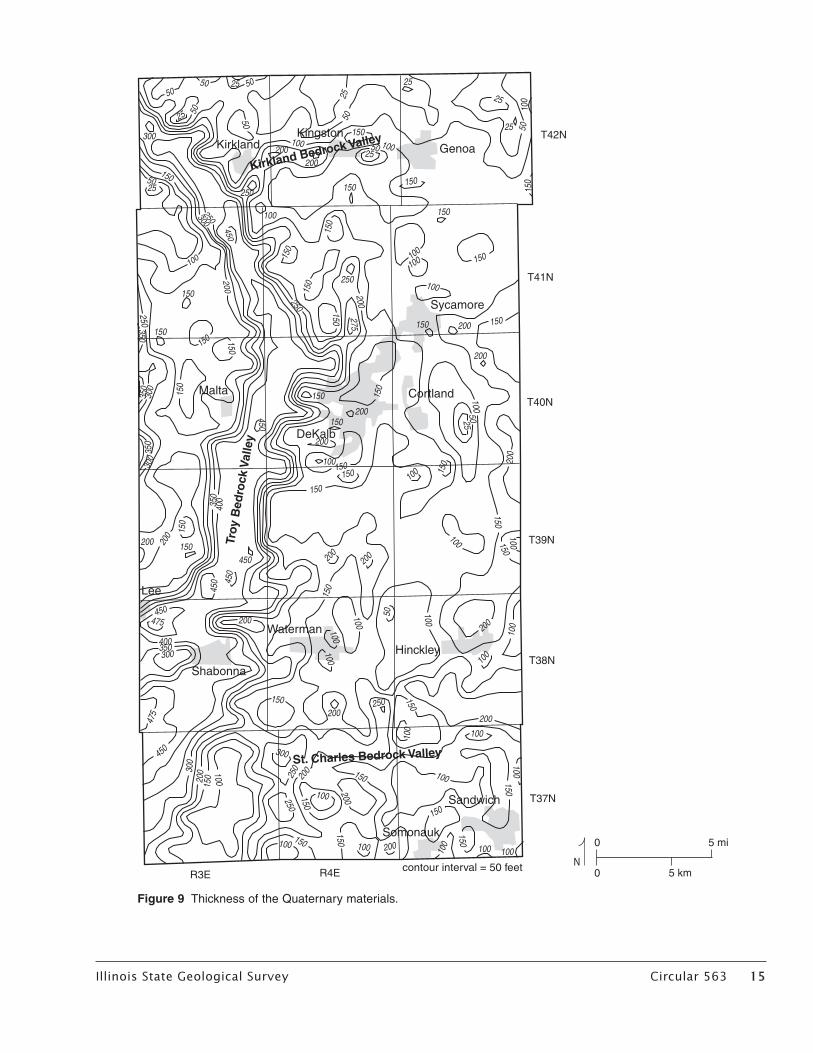
Thickness of Quaternary Materials Thicknesses of Quaternary materials (fi g. 9) can vary considerably depend-ing on (1) the elevation of the bedrock and (2) the presence or absence of gla-cial end moraines. Over the uplands, drift thickness generally varies between 100 and 200 feet. Thickness of the Quaternary material is 50 feet or less along the north edge of the county and just east of the town of Cortland (T40N R5E), allowing the economical opera-tion of a stone quarry at that site. Over the Troy Bedrock Valley, thickness com-monly increases dramatically to more than 400 feet. In the southwestern part of the county, the rise in elevation of the Bloomington Morainic System over the Troy Bedrock Valley produces thicknesses of 475 feet. Areas of thick-est Quaternary material are most likely to contain signifi cant sand and gravel deposits and, therefore, the most sig-nifi cant groundwater resources.
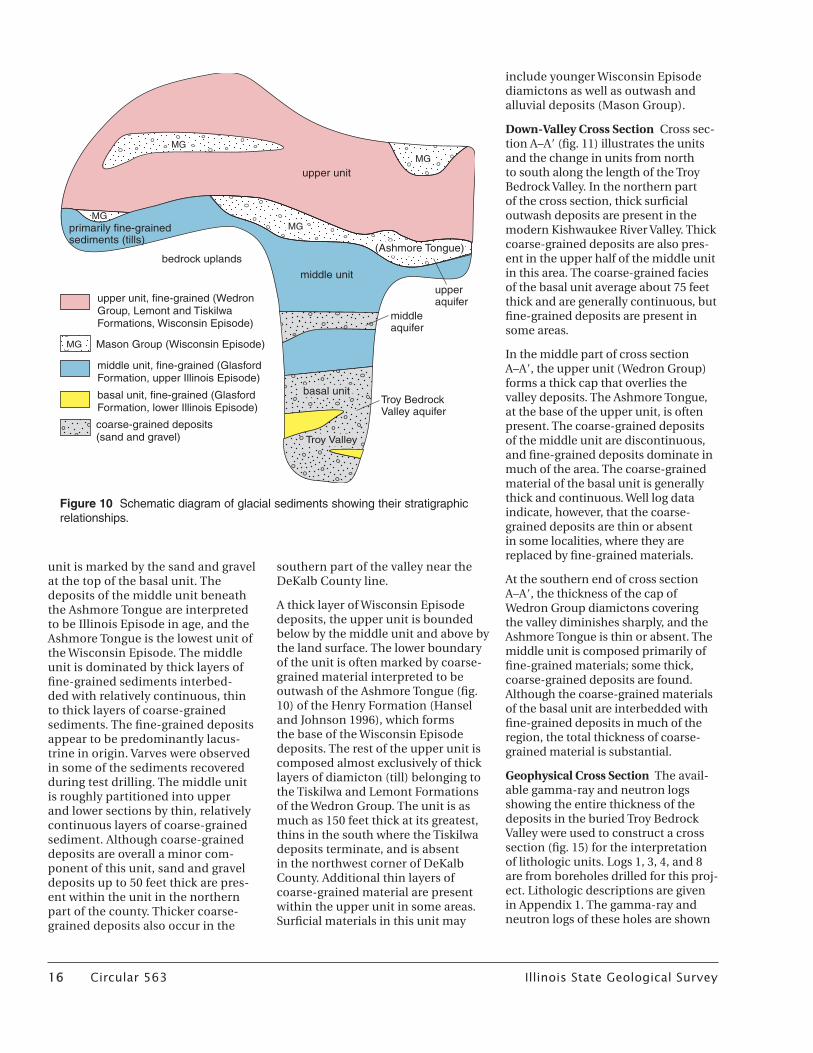
The sediments overlying the bedrock of DeKalb County were deposited by glaciers during at least two, and possibly more, episodes of glaciation (fi g. 10). Basal sediments may date to pre-Illinois episode deposition, but no study has yet differentiated them from Illinois Episode materials. Depo-sition early in the Illinois Episode left thick proglacial deposits of mostly sand and gravel and thin diamictons (till) within the pre-existing Troy Bedrock Valley. Relatively thin till was left on upland areas. Later Illinois Episode glaciation left additional till on the uplands (Kempton 1963) and thick deposits of sand, gravel, and lacustrine silt and clay in the Troy Bedrock Valley. Conditions were much different during the last glacia-tion (Wisconsin Episode), however, because the Troy and other bedrock valleys in the county by this time had been mostly or wholly fi lled. During the Wisconsin Episode, ice entering from the east and southeast deposited a thick cap of sediment over all but the northernmost part of the county. Wind and water erosion have since modifi ed the landscape slightly.
Illinois Episode deposits of varying thickness (Glasford Formation) are present throughout the county (fi gs.
10, 11, and 12) (Horberg 1950, Berg et al. 1984, Wickham et al. 1988). Thick-ness ranges from a few feet in some areas of bedrock uplands to more than 200 feet in the Troy Bedrock Valley. The upland deposits are pre-dominantly diamicton, but contain minor amounts, and in places larger amounts, of sand and gravel. The deposits in the Troy Bedrock Valley are predominantly coarse-grained depos-its interpreted to be proglacial out-wash, interbedded with fi ne-grained deposits interpreted to be lacustrine sediment and till (fi gs. 11 and 12).
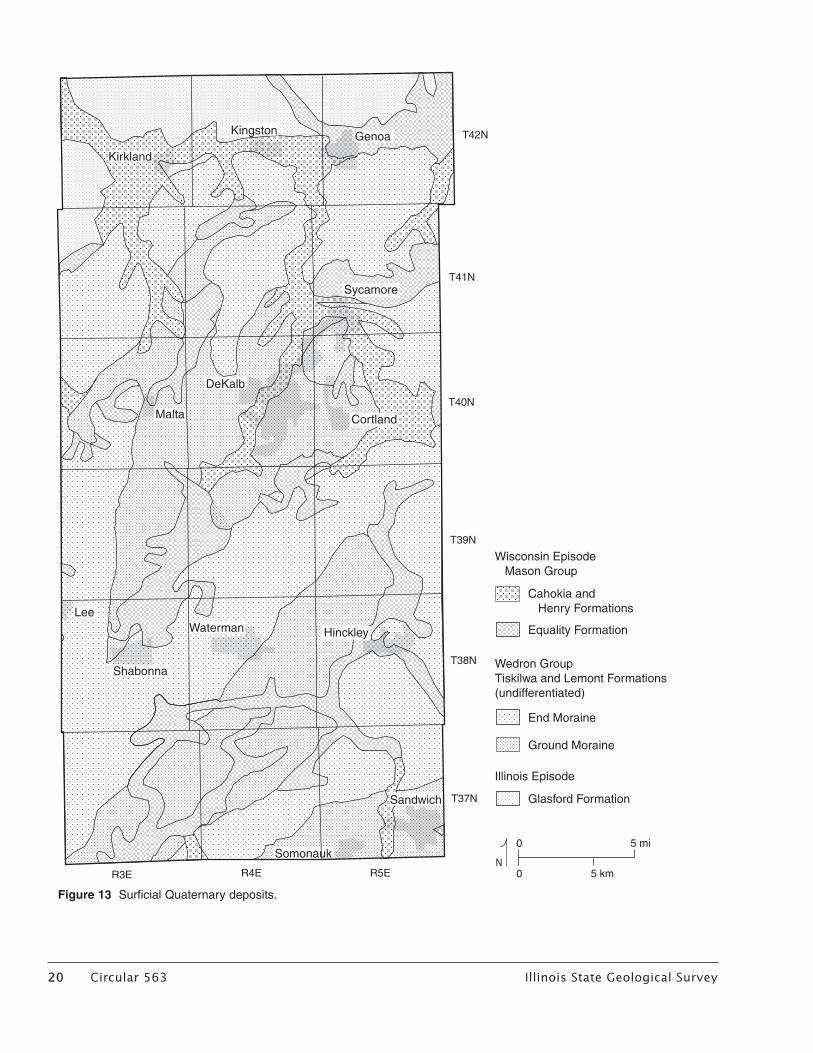
The deposits of the most recent glaciation, the Wisconsin Episode, dominate the present landscape of DeKalb County (fi gs. 10, 11, 12, and 13). Thinly covered by more recent eolian and fl uvial deposits in many places, the deposits are predomi-nantly thick diamictons (Wedron Group) left as ridges (end moraines), interbedded with sand, gravel, and lacustrine sediments (Mason Group). The westernmost moraine is part of the Bloomington Morainic System (fi g. 3), a prominent ridge composed primarily of diamicton of the basal Tiskilwa Formation deposited by the initial ice advance of the last (Wiscon-sin) glaciation (fi g. 10). This moraine trends north to south, stretching from south of Kirkland in the north, pass-ing just west of Malta, and extending south past Lee (fi gs. 1 and 3). The moraine is buried under younger glacial sediments in the southern two townships of DeKalb County. At Kirk-land, the moraine curves east to the county boundary. It is bordered by the present-day Kishwaukee River east of Kirkland and cut through by the river west of Genoa. The Tiskilwa sediments form a thick cap on older glacial sedi-ments in much of the county and are overlain by younger sediments of the Lemont Formation (fi g. 10). Neither Tiskilwa nor Lemont sediments are present north of the river, where older Illinois Episode deposits form the land surface (fi g. 13). Tiskilwa deposits are also absent in some parts of southern DeKalb County, although younger Wisconsin Episode sediments are present. The total thickness of the Wisconsin Episode deposits exceeds 150 feet in some areas.
Sediments of the Troy Bedrock ValleyFigure 14 (a and b) show the approxi-mate appearance of the Troy Bedrock Valley prior to the deposition of gla-cial sediments. The available evidence shows that the deposits that fi lled in the Troy Bedrock Valley vary from place to place and are discontinu-ous, which makes precise description and interpretation of the stratigraphy diffi cult without detailed sampling, seismic profi ling, or other geophysical techniques. Because of the variability in stratigraphy, it is not described in detail herein. Based on predominant sediment types, the valley deposits have been divided into three informal units (fi g. 10) that refl ect the domi-nant depositional environments pres-ent in the Troy Bedrock Valley during three distinct periods of deposition (fi g. 14c, d, and e). The basal unit (fi g. 10) is dominated by coarse-grained, glaciofl uvial deposits; the middle unit is a mix of fi ne and coarse-grained, lacustrine, glacial, and glaciofl uvial deposits (fi g. 14d); and the upper unit is dominated by fi ne-grained, glacial deposits (fi g.14e). In our interpreta-tion of these sediments, the age of the upper unit corresponds to the Wisconsin Episode, and the age of the middle unit corresponds to the upper Illinois Episode. The basal unit is equivalent to the lower Illinois Episode, but may include pre-Illinois Episode sediments.
The predominantly coarse-grained basal unit rests on the bedrock surface of the Troy Bedrock Valley (fi g. 10). This unit consists of thick deposits of sand and gravel interpreted to be glacial outwash deposited during the Illinois Episode. The coarse-grained deposit is often interbedded with silt and clay, which we interpret to be of lacustrine origin, and till. These fi ne-grained deposits are generally 20 to 50 feet thick. In limited areas, as much as half of this unit may be composed of fi ne-grained materials. Elsewhere, the unit is predominantly sand and gravel. Total sand and gravel thicknesses of 50 to 75 feet are common.
The middle unit is a complex mélange of fi ne to coarse-grained materials. The lower boundary of the middle
14 Circular 563 Illinois State Geological Survey Illinois State Geological Survey Circular 563 15
KirklandKingston
Genoa
Sycamore
DeKalb
CortlandMalta
Lee
Shabonna
Waterman
Hinckley
Sandwich
Somonauk
R3E
T42N
T37N
T38N
T39N
T40N
T41N
R4E contour interval = 50 feet
Troy
Bed
rock
Val
ley
St. Charles Bedrock Valley
Kirkland Bedrock Valley
0
0 5 mi
5 kmN
200
150
100
300
450
475
100150
250150
150
100
250
200
200
150
300
200250
150
15010
0
100
150
100 200
100
150
100 100
150
100
200
100
100
10020
0
10050
100
150150
100
150
100
200
1005025
200
150 200 150
150
100
100100150
150
150
150
25
5025
100
25
2550 100
150
150
2550
100200
200
250
50
50
50
5050
25
25
300
1505025
150
150
150
250
200250
275
150
100
100
450200
300250
250350
350
300
150
150150 150
150
350
300
450
400350
150
150
200
200
450
450 45
0
450475 200
400350300
100100
100
200
200
150
150
150150100
200
150200
150
Figure 9 Thickness of the Quaternary materials.
16 Circular 563 Illinois State Geological Survey Illinois State Geological Survey Circular 563 17
unit is marked by the sand and gravel at the top of the basal unit. The deposits of the middle unit beneath the Ashmore Tongue are interpreted to be Illinois Episode in age, and the Ashmore Tongue is the lowest unit of the Wisconsin Episode. The middle unit is dominated by thick layers of fine-grained sediments interbed-ded with relatively continuous, thin to thick layers of coarse-grained sediments. The fine-grained deposits appear to be predominantly lacus-trine in origin. Varves were observed in some of the sediments recovered during test drilling. The middle unit is roughly partitioned into upper and lower sections by thin, relatively continuous layers of coarse-grained sediment. Although coarse-grained deposits are overall a minor com-ponent of this unit, sand and gravel deposits up to 50 feet thick are pres-ent within the unit in the northern part of the county. Thicker coarse-grained deposits also occur in the
southern part of the valley near the DeKalb County line.
A thick layer of Wisconsin Episode deposits, the upper unit is bounded below by the middle unit and above by the land surface. The lower boundary of the unit is often marked by coarse-grained material interpreted to be outwash of the Ashmore Tongue (fig. 10) of the Henry Formation (Hansel and Johnson 1996), which forms the base of the Wisconsin Episode deposits. The rest of the upper unit is composed almost exclusively of thick layers of diamicton (till) belonging to the Tiskilwa and Lemont Formations of the Wedron Group. The unit is as much as 150 feet thick at its greatest, thins in the south where the Tiskilwa deposits terminate, and is absent in the northwest corner of DeKalb County. Additional thin layers of coarse-grained material are present within the upper unit in some areas. Surficial materials in this unit may
include younger Wisconsin Episode diamictons as well as outwash and alluvial deposits (Mason Group).
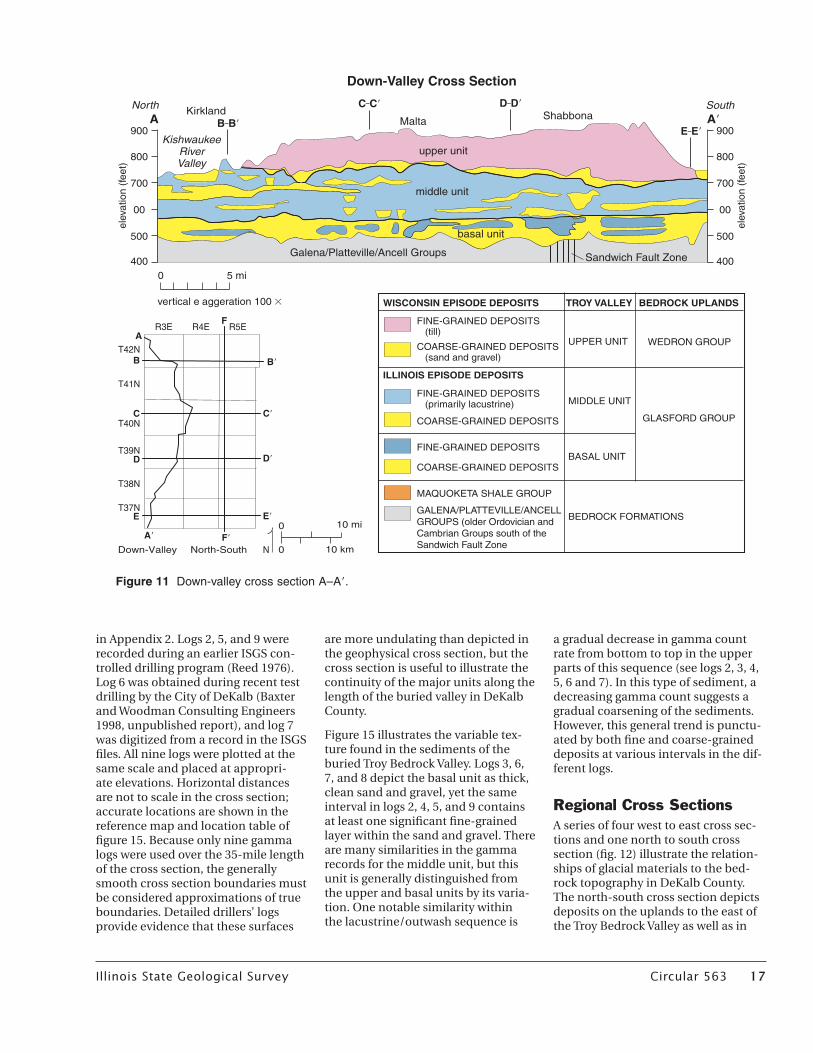
Down-Valley Cross Section Cross sec-tion A–A (fig. 11) illustrates the units and the change in units from north to south along the length of the Troy Bedrock Valley. In the northern part of the cross section, thick surficial outwash deposits are present in the modern Kishwaukee River Valley. Thick coarse-grained deposits are also pres-ent in the upper half of the middle unit in this area. The coarse-grained facies of the basal unit average about 75 feet thick and are generally continuous, but fine-grained deposits are present in some areas.
In the middle part of cross section A–A, the upper unit (Wedron Group) forms a thick cap that overlies the valley deposits. The Ashmore Tongue, at the base of the upper unit, is often present. The coarse-grained deposits of the middle unit are discontinuous, and fine-grained deposits dominate in much of the area. The coarse-grained material of the basal unit is generally thick and continuous. Well log data indicate, however, that the coarse-grained deposits are thin or absent in some localities, where they are replaced by fine-grained materials.
At the southern end of cross section A–A, the thickness of the cap of Wedron Group diamictons covering the valley diminishes sharply, and the Ashmore Tongue is thin or absent. The middle unit is composed primarily of fine-grained materials; some thick, coarse-grained deposits are found. Although the coarse-grained materials of the basal unit are interbedded with fine-grained deposits in much of the region, the total thickness of coarse-grained material is substantial.
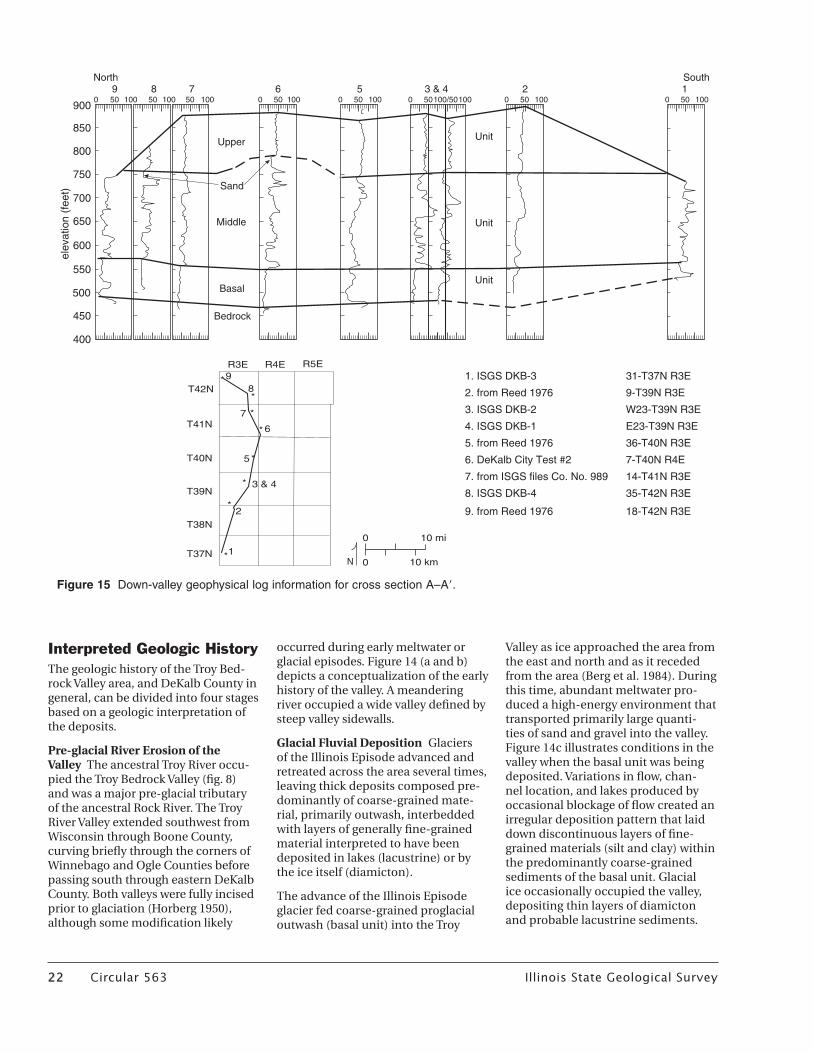
Geophysical Cross Section The avail-able gamma-ray and neutron logs showing the entire thickness of the deposits in the buried Troy Bedrock Valley were used to construct a cross section (fig. 15) for the interpretation of lithologic units. Logs 1, 3, 4, and 8 are from boreholes drilled for this proj-ect. Lithologic descriptions are given in Appendix 1. The gamma-ray and neutron logs of these holes are shown
Figure 10 Schematic diagram of glacial sediments showing their stratigraphicrelationships.
����������
�����������
��������������������������
�������������
������������
����������������������������������������
���������������������������������������������������������������������
��������������������������������������������������������������������
�����������������������������������������������������������������������������������������
��
����������
���������������
�����������
���������������������������������������
��
��
��
����������������
���������������������������������
16 Circular 563 Illinois State Geological Survey Illinois State Geological Survey Circular 563 17
in Appendix 2. Logs 2, 5, and 9 were recorded during an earlier ISGS con-trolled drilling program (Reed 1976). Log 6 was obtained during recent test drilling by the City of DeKalb (Baxter and Woodman Consulting Engineers 1998, unpublished report), and log 7 was digitized from a record in the ISGS files. All nine logs were plotted at the same scale and placed at appropri-ate elevations. Horizontal distances are not to scale in the cross section; accurate locations are shown in the reference map and location table of figure 15. Because only nine gamma logs were used over the 35-mile length of the cross section, the generally smooth cross section boundaries must be considered approximations of true boundaries. Detailed drillers’ logs provide evidence that these surfaces
are more undulating than depicted in the geophysical cross section, but the cross section is useful to illustrate the continuity of the major units along the length of the buried valley in DeKalb County.
Figure 15 illustrates the variable tex-ture found in the sediments of the buried Troy Bedrock Valley. Logs 3, 6, 7, and 8 depict the basal unit as thick, clean sand and gravel, yet the same interval in logs 2, 4, 5, and 9 contains at least one significant fine-grained layer within the sand and gravel. There are many similarities in the gamma records for the middle unit, but this unit is generally distinguished from the upper and basal units by its varia-tion. One notable similarity within the lacustrine/outwash sequence is
a gradual decrease in gamma count rate from bottom to top in the upper parts of this sequence (see logs 2, 3, 4, 5, 6 and 7). In this type of sediment, a decreasing gamma count suggests a gradual coarsening of the sediments. However, this general trend is punctu-ated by both fine and coarse-grained deposits at various intervals in the dif-ferent logs.
Regional Cross SectionsA series of four west to east cross sec-tions and one north to south cross section (fig. 12) illustrate the relation-ships of glacial materials to the bed-rock topography in DeKalb County. The north-south cross section depicts deposits on the uplands to the east of the Troy Bedrock Valley as well as in
Figure 11 Down-valley cross section A–A.
�������������������������
�����
����
���� ����
����
�����
����� �����������������
���������������������
�������������������������� ����������� ���������������
������������������������������
��������������������������������������������
�������������������������
�����������������������
�����������������������������������������������
�����������������������
���������������������
���������������������
����������
�����������
����������
������������������
������������
��������������
� �
� �����
����������������� ������������
�����
�����
�����
�����
�����
�����
���� ���� ����
����������
�����������
��
���
�
�
�
�
�
��
��
��
����
�������������������������������������������������������������������������������������������������������
�������������������������������� �������������������
����������
�������������������� ���
���
���
���
���
���
��������������������
���
���
���
��������������������������
� �������
18 Circular 563 Illinois State Geological Survey Illinois State Geological Survey Circular 563 19
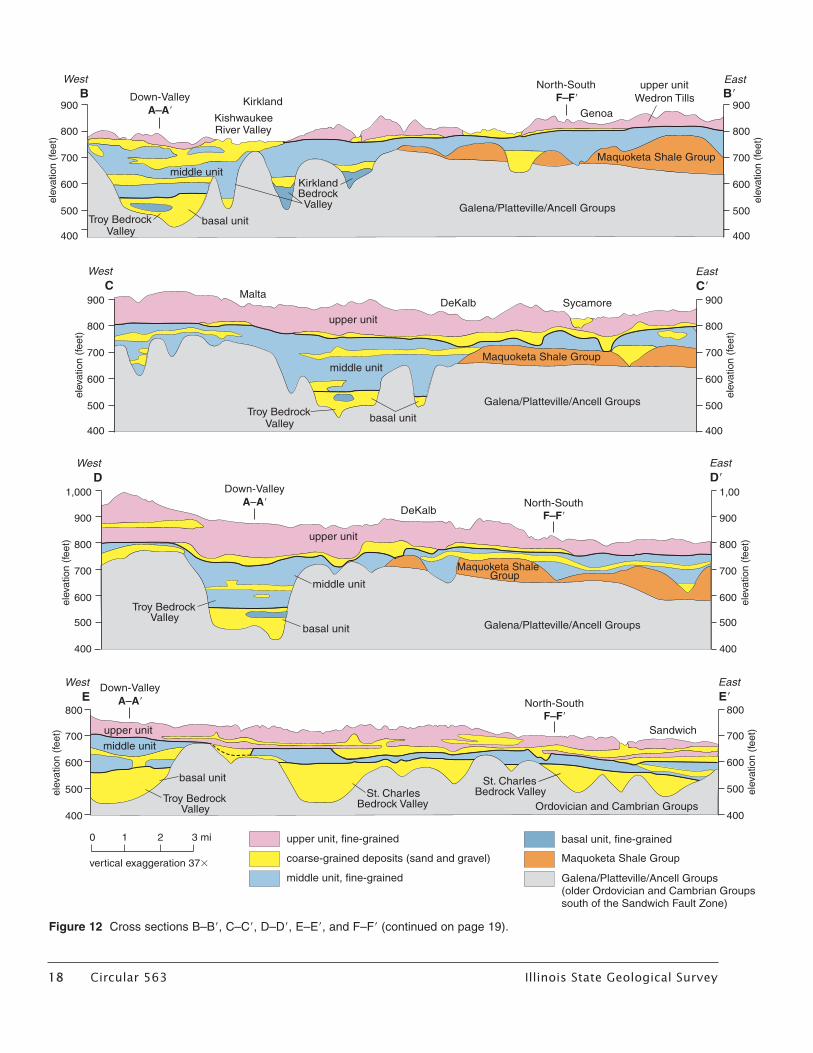
Figure 12 Cross sections B–B, C–C, D–D, E–E, and F–F (continued on page 19).
�������������������������
������������������������
���������������������
������������������������������������������������������������������������������������������������������
������������������������
�����������������������������������������
� ��
����
�����
�����
��
����
����������
�����������
����������������������
������
���������������������
��������������������������������
����������� ��������
����
����������
�����������
����������
������������������
��������������������������������
������
����������
�����������
����������
������������������ ������������������������������
��������
�������������������������
�������������������������
����������������������
�����������
����������������������������
��������������������������������
�������������������
�����
����������� ����
����������������������
���������������������
��������� ��
����
���������������
���������������
��
����
��������������� �����������
����
��������������������
���������������������
���
����������������� ���
���
���
���
���
���
��������������������
���
���
���
���
�����
�����������������
���
���
���
���
���
����
�����������������
���
���
���
���
���
���
�����������������
���
���
���
���
���
�����������������
���
���
���
���
� � � ����
�������������������������
��� ���
���
����������������� ���
���
���
���
���
���
��������������������
���
���
���
���
18 Circular 563 Illinois State Geological Survey Illinois State Geological Survey Circular 563 19
the St. Charles Bedrock Valley in south-ern DeKalb County.
Cross section B–B, the northern west to east cross section (figs. 11 and 12), shows the Troy Valley in the northwest corner of the county. Thick surficial or near-surface sand and gravel depos-its are encountered in the modern Kishwaukee River valley. To the east, the bedrock is deeply dissected by the Kirkland Bedrock Valley. Some coarse-grained deposits of the middle unit are present in this bedrock valley. The upper unit is generally 50 to 75 feet thick and overlies deposits of the middle unit. The Wedron Group diamic-ton is absent west of the Kishwaukee River. The thickness of the middle unit ranges from about 50 feet to more than 100 feet. The eastern two thirds of cross section B–B lacks thick coarse-grained deposits, although a thick basal deposit is present in a tributary of the Kirkland Bedrock Valley west of Genoa. The Ash-more Tongue sand (base of the top unit) is generally present but is usually less than 10 feet thick.
Cross section C–C crosses the county just north of the City of DeKalb (fig. 12). As in all of the west to east cross sections, cross section C–C is domi-nated by the Troy Bedrock Valley, revealing the extent of the potential groundwater sources located between
the cities of DeKalb and Malta. East of DeKalb, the stratigraphy is signifi-cantly different from that shown in cross section B–B. The coarse-grained deposits at the base of the upper unit (Ashmore Tongue) are more than 50 feet thick in some areas east of DeKalb and east of Sycamore. The basal unit is present only in the Troy Bedrock Valley.
Cross section D–D shows the broad nature of the Troy Bedrock Valley and illustrates all three valley units (fig. 12). The basal unit exceeds 100 feet in thickness and is overlain by a thick middle unit. The relatively flat valley bottom, with a deeper main channel, is shown. The basal coarse-grained deposit of the upper unit is present over the bedrock valley and thick-ens just east of the bedrock valley. It thins and is absent farther east. East of the bedrock valley, 100 to 150 feet of Glasford Formation and Wedron Group diamictons are present over the bedrock uplands. Significant coarse-grained deposits are present within the middle unit in much of the area. West of the Troy Bedrock Valley, coarse-grained deposits are present in both the middle and upper units.
Cross section E–E shows the shift of the Troy Bedrock Valley to the west (fig. 12). The basal unit is 75 to 100 feet thick or more in much of the area, and
coarse-grained deposits in the middle unit are 20 to 30 feet thick locally. The basal coarse-grained deposit of the upper unit is thin and discontinuous. To the east lies a tributary valley of the Troy Valley (St. Charles Bedrock Valley) that contains thick basal sand and gravel deposits below an eleva-tion of 600 feet. Together with coarse-grained deposits in the middle and upper units, the basal sand and gravel deposits may prove to be a substantial groundwater resource in the south-eastern part of the county.
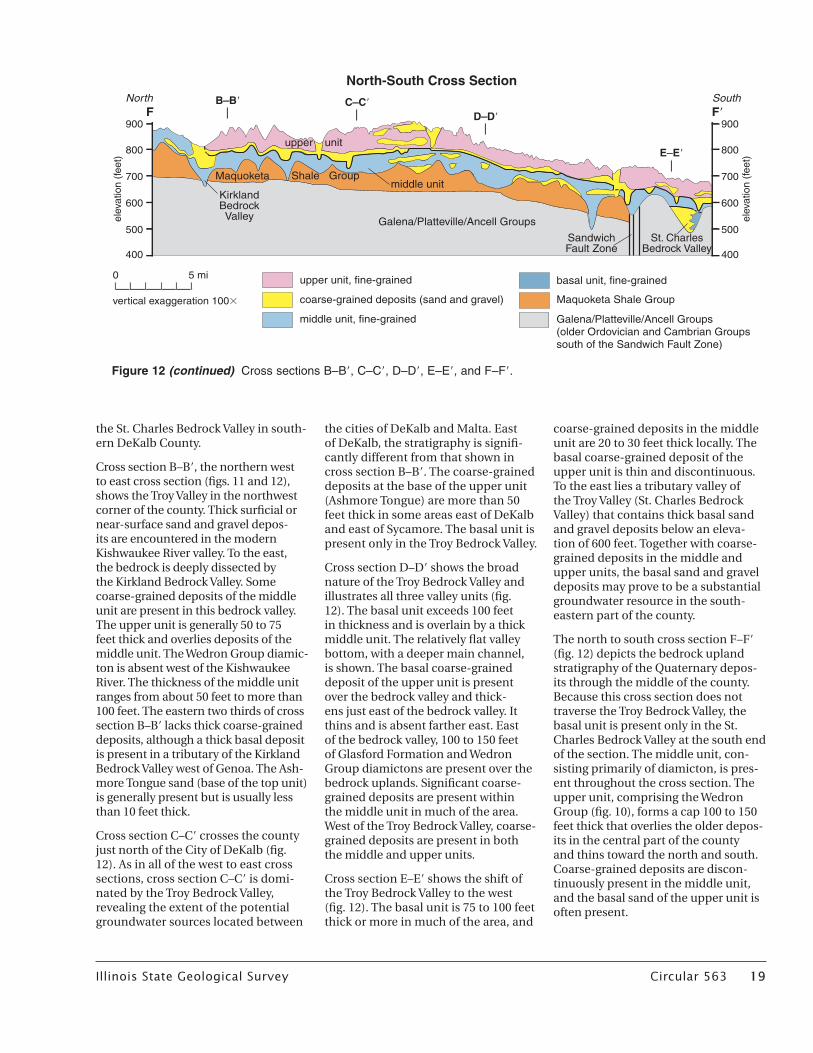
The north to south cross section F–F (fig. 12) depicts the bedrock upland stratigraphy of the Quaternary depos-its through the middle of the county. Because this cross section does not traverse the Troy Bedrock Valley, the basal unit is present only in the St. Charles Bedrock Valley at the south end of the section. The middle unit, con-sisting primarily of diamicton, is pres-ent throughout the cross section. The upper unit, comprising the Wedron Group (fig. 10), forms a cap 100 to 150 feet thick that overlies the older depos-its in the central part of the county and thins toward the north and south. Coarse-grained deposits are discon-tinuously present in the middle unit, and the basal sand of the upper unit is often present.
Figure 12 (continued) Cross sections B–B, C–C, D–D, E–E, and F–F.
�������������������������
������������������������
���������������������
������������������������������������������������������������������������������������������������������
������������������������
�����������������������������������������
�������������������������
���������������������
����� ����
�����
North��South����
����
����
�����������
��������������������������������
����� ��������������
������������������
�������������������������
�������������������� ���
���
���
���
���
���
��������������������
���
���
���
���
� ����
��������������������������
20 Circular 563 Illinois State Geological Survey Illinois State Geological Survey Circular 563 21
Kirkland
Kingston Genoa
Sycamore
DeKalb
CortlandMalta
Lee
Shabonna
Waterman Hinckley
Sandwich
Somonauk
R3E
T42N
T37N
T38N
T39N
T40N
T41N
R4E R5E
Wisconsin Episode Mason Group
Cahokia and Henry Formations
Wedron GroupTiskilwa and Lemont Formations(undifferentiated)
Equality Formation
End Moraine
Ground Moraine
Illinois Episode
Glasford Formation
0
0 5 mi
5 kmN
Figure 13 Surficial Quaternary deposits.

20 Circular 563 Illinois State Geological Survey Illinois State Geological Survey Circular 563 21
Figure 14 Artist’s rendering, based on well log and geophysical data, of the depositional history of the Troy Bedrock Valley. (a) Overall view of the ancient preglacial valley. (b) Closer view showing the near-vertical dolomite cliffs lining the valley. Total elevation change from the river to the top of the bluffs is more than 200 feet with a vertical drop approaching 150 feet. (c) Rivers form a braided stream pattern as sand and gravel from distant glaciers are deposited as the basal unit in the partially filled Troy Bedrock Valley. (d) Marshes and lakes domi-nate the environment during deposition of the middle unit. Much of the original Troy Bedrock Valley had been filled by this time. (e) Before the Wisconsin Episode Glacier covered the area, glacial meltwater deposited the top sand and gravel of the upper aquifer. The Troy Bedrock Valley was entirely filled by this time, and the advancing glacier buried it even deeper under a thick layer of till (upper unit).
�����
������
�����������
�����������
�����������
�
�
�
�
�
22 Circular 563 Illinois State Geological Survey Illinois State Geological Survey Circular 563 23
Interpreted Geologic HistoryThe geologic history of the Troy Bed-rock Valley area, and DeKalb County in general, can be divided into four stages based on a geologic interpretation of the deposits.
Pre-glacial River Erosion of the Valley The ancestral Troy River occu-pied the Troy Bedrock Valley (fig. 8) and was a major pre-glacial tributary of the ancestral Rock River. The Troy River Valley extended southwest from Wisconsin through Boone County, curving briefly through the corners of Winnebago and Ogle Counties before passing south through eastern DeKalb County. Both valleys were fully incised prior to glaciation (Horberg 1950), although some modification likely
occurred during early meltwater or glacial episodes. Figure 14 (a and b) depicts a conceptualization of the early history of the valley. A meandering river occupied a wide valley defined by steep valley sidewalls.
Glacial Fluvial Deposition Glaciers of the Illinois Episode advanced and retreated across the area several times, leaving thick deposits composed pre-dominantly of coarse-grained mate-rial, primarily outwash, interbedded with layers of generally fine-grained material interpreted to have been deposited in lakes (lacustrine) or by the ice itself (diamicton).
The advance of the Illinois Episode glacier fed coarse-grained proglacial outwash (basal unit) into the Troy
Valley as ice approached the area from the east and north and as it receded from the area (Berg et al. 1984). During this time, abundant meltwater pro-duced a high-energy environment that transported primarily large quanti-ties of sand and gravel into the valley. Figure 14c illustrates conditions in the valley when the basal unit was being deposited. Variations in flow, chan-nel location, and lakes produced by occasional blockage of flow created an irregular deposition pattern that laid down discontinuous layers of fine-grained materials (silt and clay) within the predominantly coarse-grained sediments of the basal unit. Glacial ice occasionally occupied the valley, depositing thin layers of diamicton and probable lacustrine sediments.
Figure 15 Down-valley geophysical log information for cross section A–A.
����
����
����
����
����
����
���
���������������� �����
�������������� ������������
������������������ ����������
�������������� ������������
�������������� ������������
������������������ �����������
����������������������� �����������
������������������������������� ������������
�������������� �����������
������������������ ��������������
����
�������
����� ����
����
������ ����
��� ���
�
�
�
�
�
�
�
���
�
�
�
�����
�
�
�
�����
����
�����������������
����
����
����
����
����
����
����
����
����
����
��� ��� ��� ��� ��� ��� ��� ��� ��� ������ ����������� ��� �� ���
� �
� �����
�����
22 Circular 563 Illinois State Geological Survey Illinois State Geological Survey Circular 563 23
Data from test holes and well logs show a lack of continuity of deposits in some locations.
Lacustrine-dominated Deposition in the Troy Valley The period of exten-sive outwash deposition in the Troy Valley ended as the regional drain-age pattern changed. The character of the middle unit suggests that the Troy Bedrock Valley was not an active drainageway during part of the Illinois Episode. Glacial repositioning during this period likely diverted stream flow, causing the Rock Valley to the west to become the primary drainage course. Large volumes of water flowing down the Rock River Valley may have blocked the drainage of the Troy Valley, caus-ing backwater flooding. The resulting lower energy environment produced a marked change in depositional pro-cesses in the valley. Deposition of sand and gravel ceased, and fine-grained sediments (silt and clay) were laid down in a lacustrine environment (middle unit). Although the valley was filled with predominantly lacustrine sediments, relatively thin layers of till (diamicton) were deposited on the uplands as the glacier advanced and retreated. During much of this time the valley landscape likely consisted of wetlands and lakes. Figure 14d depicts the valley near the present-day City of DeKalb during such a blocked drain-age phase, when the Illinois glacier had withdrawn from the immediate area. Occasionally, Illinois Episode glaciers extended into the valley from the uplands to the east, adding dis-continuous deposits of outwash and layers of diamicton. The result was the creation of relatively thick deposits of lake sediments interbedded with sand and gravel and relatively thin layers of diamicton. These deposits generally filled the Troy Bedrock Valley, ending further drainage through the valley.
Glacial Diamicton Deposition Glacial diamicton (till) deposition by the Wis-consin Episode glacier was proceeded by deposition of coarse-grained mate-rial over much of the area. Proglacial outwash (Ashmore Tongue, bottom deposit of the upper unit; fig. 10) from the advancing Wisconsin Episode gla-cier was deposited over the relatively level or gently rolling landscape. The glacier overrode the older deposits
in most of the area depositing the Tiskilwa and Lemont Tills (the upper unit). The Wisconsin Episode glacier did not advance into the northern part of the county, where the margin of the Wisconsin glaciation is marked by the edge of the Bloomington Morainic System. Figure 14e depicts the Troy Valley during deposition of the Ashmore Tongue at the beginning of the Wisconsin Episode. The deposits of this glaciation deeply buried the pre-glacial landscape under a thick layer of till. Today, the Troy Bedrock Valley is filled by as much as 200 feet of pre-Wis-consin Episode sediment, overlain by Wisconsin Episode deposits that com-monly are more than 100 feet thick.
Groundwater GeologyGroundwater in DeKalb County is obtained from both bedrock and sand and gravel aquifers. In the past, most large municipal wells only utilized water from the bedrock aquifers. Because the sand and gravel aquifers of the area have not been fully utilized or explored, our study concentrates on four of these aquifers.
Bedrock Aquifers Because the Ancell Group is a primary aquifer for the region, we generated updated maps showing details of the Ancell Group in DeKalb County (figs. 5, 6, and 7). These updated maps will help drillers estimate drilling times, costs, and potential well yields and can be used to provide better information to customers. Figure 5 shows where the Ancell Group is thickest. Given knowl-edge of site elevation, drillers can use figure 6 to estimate the approximate depth to the Ancell Group, which will improve estimates of drilling time. Figure 9 provides an approximate value for the length of casing needed to main-tain the well bore.
Carbonates (limestone and dolomite) yield water mostly from fractures and crevices formed along joints or bedding planes that are enlarged by dissolution. The amount of water available from a well finished in a carbonate formation is dependent on the size and number of joints and fractures that are intersected by the well. Generally, crevices are more
numerous within the upper few tens of feet of a carbonate formation. In sand-stones, which are typically good sources of groundwater, the water is held in interconnected pore spaces between sand grains. The quantity of available water is controlled in part by the thick-ness of the sandstone and its composi-tion. Some sandstones, such as the St. Peter Sandstone in the Ancell Group, yield significant volumes of water. Silty or clayey sandstones generally yield less water because they do not readily trans-mit water. Thicker sandstones may also have higher yields if their entire thick-ness is fully exploited. Shales are not a good source of water. They do not have many interconnected pore spaces, and fractures formed by weathering will fill with fine clay and silt particles.
In DeKalb County, water-well drill-ers target the Galena and Platteville Groups and the St. Peter Sandstone more often than other bedrock units. The Eminence and the Prairie du Chien Group underlying the St. Peter Sand-stone may be locally important sources of water but are generally considered confining units as they do not readily transmit water either vertically or later-ally (Visocky et al. 1985). The Maquo-keta Shale Group acts as a confining unit between the Galena-Platteville aquifer and the Silurian dolomite. The Fort Atkinson Limestone, found within the middle interval of the Maquoketa Group, has been used as a source of small water supplies where it is over-lain by the Silurian dolomite and gla-cial deposits (Visocky et al. 1985).
The Ancell aquifer (Visocky et al. 1985) includes the St. Peter and the Glenwood Sandstones. The thickness of the aqui-fer varies widely in the county (fig. 5). Yields from the aquifer are not propor-tional to the unit’s thickness, but vary with the grain size of the sandstone. Thicker portions of the formation are primarily composed of silty sandstone that yields little water. The water qual-ity is fairly good and may require only limited treatment; total dissolved solids range from about 300 mg/L to over 400 mg/L (Visocky et al. 1985). (The current Illinois limit for dissolved solids is 1,200 mg/L.) The Ancell aquifer provides water suitable for farm and domes-tic supplies and has been utilized for small municipal supplies. Where the
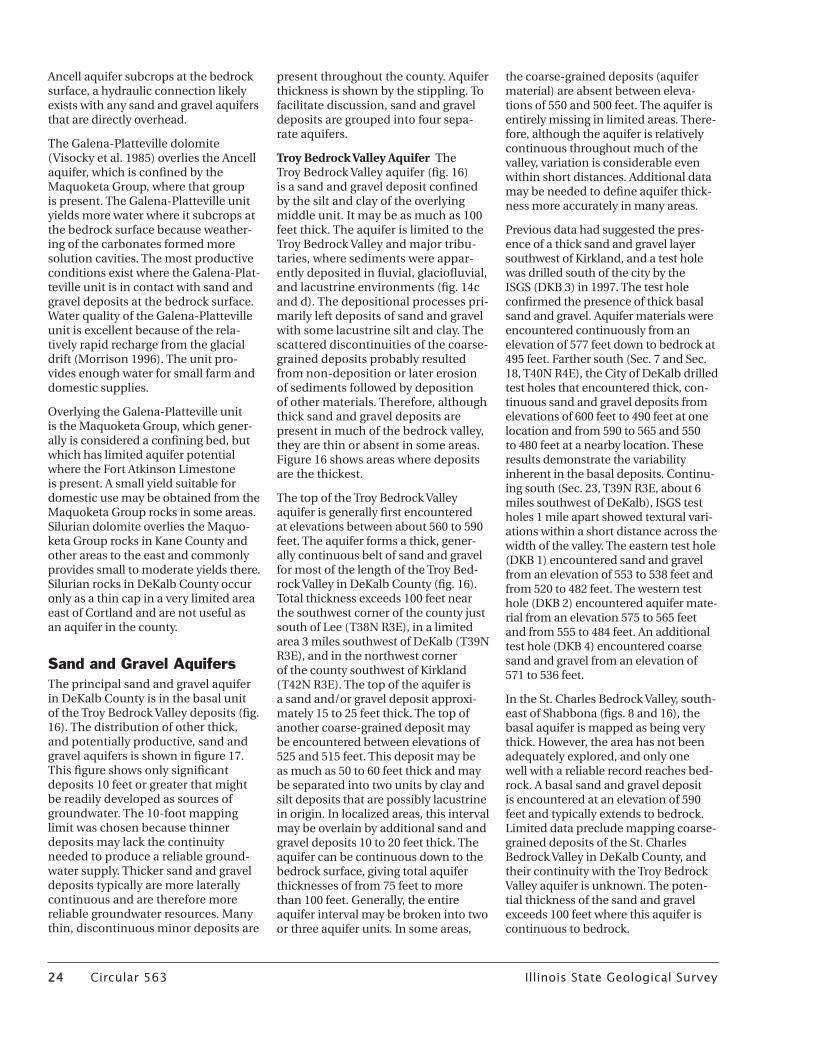
24 Circular 563 Illinois State Geological Survey Illinois State Geological Survey Circular 563 25
Ancell aquifer subcrops at the bedrock surface, a hydraulic connection likely exists with any sand and gravel aquifers that are directly overhead.
The Galena-Platteville dolomite (Visocky et al. 1985) overlies the Ancell aquifer, which is confined by the Maquoketa Group, where that group is present. The Galena-Platteville unit yields more water where it subcrops at the bedrock surface because weather-ing of the carbonates formed more solution cavities. The most productive conditions exist where the Galena-Plat-teville unit is in contact with sand and gravel deposits at the bedrock surface. Water quality of the Galena-Platteville unit is excellent because of the rela-tively rapid recharge from the glacial drift (Morrison 1996). The unit pro-vides enough water for small farm and domestic supplies.
Overlying the Galena-Platteville unit is the Maquoketa Group, which gener-ally is considered a confining bed, but which has limited aquifer potential where the Fort Atkinson Limestone is present. A small yield suitable for domestic use may be obtained from the Maquoketa Group rocks in some areas. Silurian dolomite overlies the Maquo-keta Group rocks in Kane County and other areas to the east and commonly provides small to moderate yields there. Silurian rocks in DeKalb County occur only as a thin cap in a very limited area east of Cortland and are not useful as an aquifer in the county.
Sand and Gravel AquifersThe principal sand and gravel aquifer in DeKalb County is in the basal unit of the Troy Bedrock Valley deposits (fig. 16). The distribution of other thick, and potentially productive, sand and gravel aquifers is shown in figure 17. This figure shows only significant deposits 10 feet or greater that might be readily developed as sources of groundwater. The 10-foot mapping limit was chosen because thinner deposits may lack the continuity needed to produce a reliable ground-water supply. Thicker sand and gravel deposits typically are more laterally continuous and are therefore more reliable groundwater resources. Many thin, discontinuous minor deposits are
present throughout the county. Aquifer thickness is shown by the stippling. To facilitate discussion, sand and gravel deposits are grouped into four sepa-rate aquifers.
Troy Bedrock Valley Aquifer The Troy Bedrock Valley aquifer (fig. 16) is a sand and gravel deposit confined by the silt and clay of the overlying middle unit. It may be as much as 100 feet thick. The aquifer is limited to the Troy Bedrock Valley and major tribu-taries, where sediments were appar-ently deposited in fluvial, glaciofluvial, and lacustrine environments (fig. 14c and d). The depositional processes pri-marily left deposits of sand and gravel with some lacustrine silt and clay. The scattered discontinuities of the coarse-grained deposits probably resulted from non-deposition or later erosion of sediments followed by deposition of other materials. Therefore, although thick sand and gravel deposits are present in much of the bedrock valley, they are thin or absent in some areas. Figure 16 shows areas where deposits are the thickest.
The top of the Troy Bedrock Valley aquifer is generally first encountered at elevations between about 560 to 590 feet. The aquifer forms a thick, gener-ally continuous belt of sand and gravel for most of the length of the Troy Bed-rock Valley in DeKalb County (fig. 16). Total thickness exceeds 100 feet near the southwest corner of the county just south of Lee (T38N R3E), in a limited area 3 miles southwest of DeKalb (T39N R3E), and in the northwest corner of the county southwest of Kirkland (T42N R3E). The top of the aquifer is a sand and/or gravel deposit approxi-mately 15 to 25 feet thick. The top of another coarse-grained deposit may be encountered between elevations of 525 and 515 feet. This deposit may be as much as 50 to 60 feet thick and may be separated into two units by clay and silt deposits that are possibly lacustrine in origin. In localized areas, this interval may be overlain by additional sand and gravel deposits 10 to 20 feet thick. The aquifer can be continuous down to the bedrock surface, giving total aquifer thicknesses of from 75 feet to more than 100 feet. Generally, the entire aquifer interval may be broken into two or three aquifer units. In some areas,
the coarse-grained deposits (aquifer material) are absent between eleva-tions of 550 and 500 feet. The aquifer is entirely missing in limited areas. There-fore, although the aquifer is relatively continuous throughout much of the valley, variation is considerable even within short distances. Additional data may be needed to define aquifer thick-ness more accurately in many areas.
Previous data had suggested the pres-ence of a thick sand and gravel layer southwest of Kirkland, and a test hole was drilled south of the city by the ISGS (DKB 3) in 1997. The test hole confirmed the presence of thick basal sand and gravel. Aquifer materials were encountered continuously from an elevation of 577 feet down to bedrock at 495 feet. Farther south (Sec. 7 and Sec. 18, T40N R4E), the City of DeKalb drilled test holes that encountered thick, con-tinuous sand and gravel deposits from elevations of 600 feet to 490 feet at one location and from 590 to 565 and 550 to 480 feet at a nearby location. These results demonstrate the variability inherent in the basal deposits. Continu-ing south (Sec. 23, T39N R3E, about 6 miles southwest of DeKalb), ISGS test holes 1 mile apart showed textural vari-ations within a short distance across the width of the valley. The eastern test hole (DKB 1) encountered sand and gravel from an elevation of 553 to 538 feet and from 520 to 482 feet. The western test hole (DKB 2) encountered aquifer mate-rial from an elevation 575 to 565 feet and from 555 to 484 feet. An additional test hole (DKB 4) encountered coarse sand and gravel from an elevation of 571 to 536 feet.
In the St. Charles Bedrock Valley, south-east of Shabbona (figs. 8 and 16), the basal aquifer is mapped as being very thick. However, the area has not been adequately explored, and only one well with a reliable record reaches bed-rock. A basal sand and gravel deposit is encountered at an elevation of 590 feet and typically extends to bedrock. Limited data preclude mapping coarse-grained deposits of the St. Charles Bedrock Valley in DeKalb County, and their continuity with the Troy Bedrock Valley aquifer is unknown. The poten-tial thickness of the sand and gravel exceeds 100 feet where this aquifer is continuous to bedrock.

Illinois State Geological Survey Circular 563 2525
KirklandKingston Genoa
Sycamore
DeKalb
CortlandMalta
Lee
Shabonna
Waterman Hinckley
Sandwich
Somonauk
R3E
T42N
T37N
T38N
T39N
T40N
T41N
R4E contour interval = 50 feet
Troy
Bed
rock
Val
ley
extent of basal sand
extent of basal sand(approx. 600 feet elevation msl)
this area is not includeddue to limited data
St. Charles Bedrock Valley
0
0 5 mi
5 kmN
100
50
100
50
5050
100 100 50
50
Figure 16 Thickness of the basal sand in the Troy Bedrock Valley. msl, mean sea level.
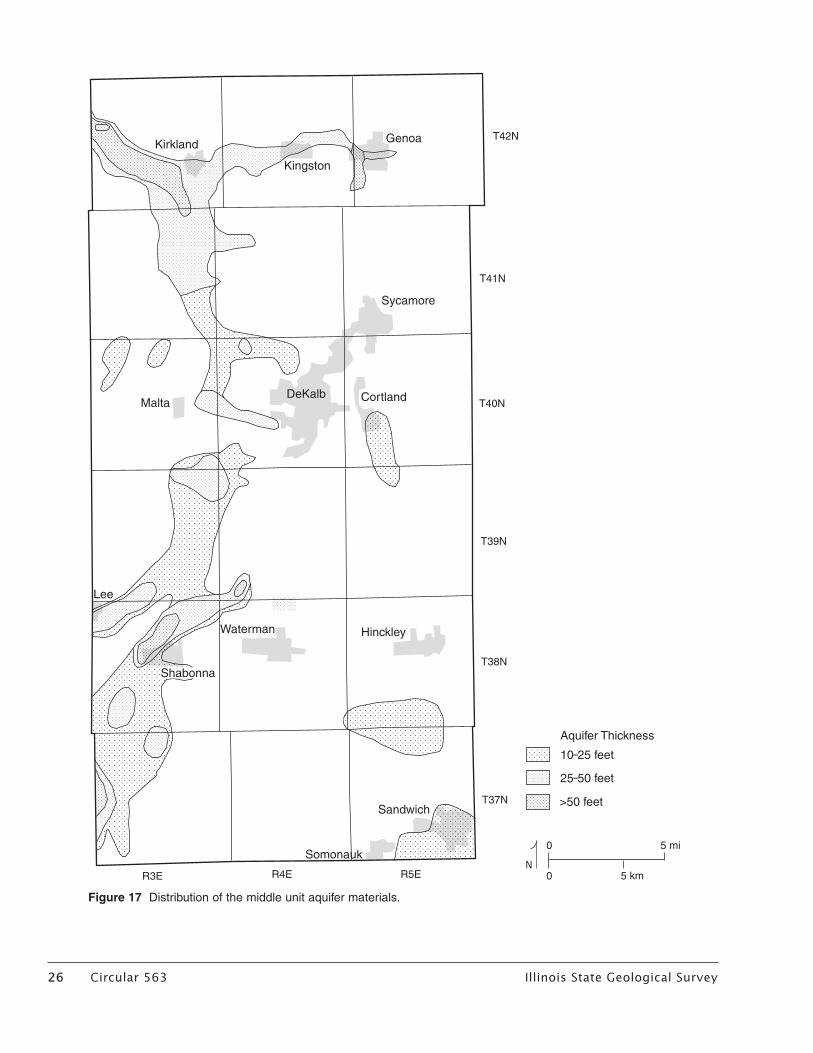
26 Circular 563 Illinois State Geological Survey Illinois State Geological Survey Circular 563 27
Figure 17 Distribution of the middle unit aquifer materials.
��������
��������
�����
��������
������ �������������
���
��������
�������� ��������
��������
��������
���
����
����
����
����
����
����
��� ���
�����������������
����������
����������
��������
�
� ����
�����
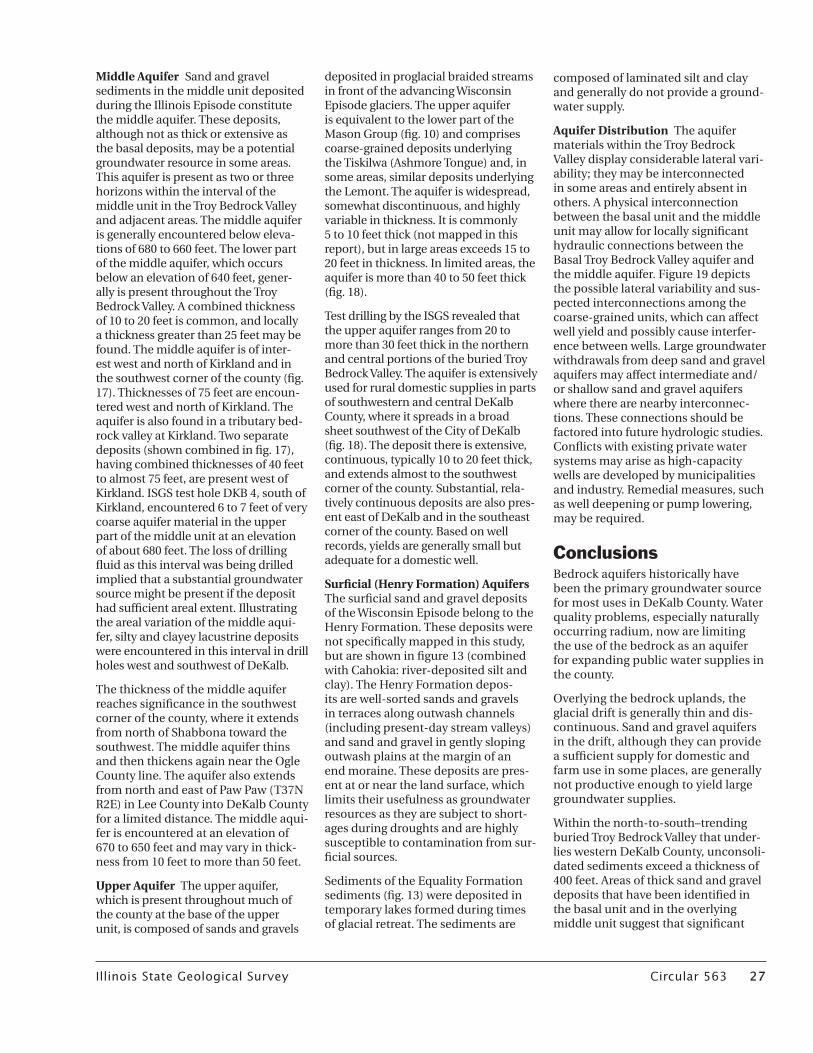
26 Circular 563 Illinois State Geological Survey Illinois State Geological Survey Circular 563 27
Middle Aquifer Sand and gravel sediments in the middle unit deposited during the Illinois Episode constitute the middle aquifer. These deposits, although not as thick or extensive as the basal deposits, may be a potential groundwater resource in some areas. This aquifer is present as two or three horizons within the interval of the middle unit in the Troy Bedrock Valley and adjacent areas. The middle aquifer is generally encountered below eleva-tions of 680 to 660 feet. The lower part of the middle aquifer, which occurs below an elevation of 640 feet, gener-ally is present throughout the Troy Bedrock Valley. A combined thickness of 10 to 20 feet is common, and locally a thickness greater than 25 feet may be found. The middle aquifer is of inter-est west and north of Kirkland and in the southwest corner of the county (fig. 17). Thicknesses of 75 feet are encoun-tered west and north of Kirkland. The aquifer is also found in a tributary bed-rock valley at Kirkland. Two separate deposits (shown combined in fig. 17), having combined thicknesses of 40 feet to almost 75 feet, are present west of Kirkland. ISGS test hole DKB 4, south of Kirkland, encountered 6 to 7 feet of very coarse aquifer material in the upper part of the middle unit at an elevation of about 680 feet. The loss of drilling fluid as this interval was being drilled implied that a substantial groundwater source might be present if the deposit had sufficient areal extent. Illustrating the areal variation of the middle aqui-fer, silty and clayey lacustrine deposits were encountered in this interval in drill holes west and southwest of DeKalb.
The thickness of the middle aquifer reaches significance in the southwest corner of the county, where it extends from north of Shabbona toward the southwest. The middle aquifer thins and then thickens again near the Ogle County line. The aquifer also extends from north and east of Paw Paw (T37N R2E) in Lee County into DeKalb County for a limited distance. The middle aqui-fer is encountered at an elevation of 670 to 650 feet and may vary in thick-ness from 10 feet to more than 50 feet.
Upper Aquifer The upper aquifer, which is present throughout much of the county at the base of the upper unit, is composed of sands and gravels
deposited in proglacial braided streams in front of the advancing Wisconsin Episode glaciers. The upper aquifer is equivalent to the lower part of the Mason Group (fig. 10) and comprises coarse-grained deposits underlying the Tiskilwa (Ashmore Tongue) and, in some areas, similar deposits underlying the Lemont. The aquifer is widespread, somewhat discontinuous, and highly variable in thickness. It is commonly 5 to 10 feet thick (not mapped in this report), but in large areas exceeds 15 to 20 feet in thickness. In limited areas, the aquifer is more than 40 to 50 feet thick (fig. 18).
Test drilling by the ISGS revealed that the upper aquifer ranges from 20 to more than 30 feet thick in the northern and central portions of the buried Troy Bedrock Valley. The aquifer is extensively used for rural domestic supplies in parts of southwestern and central DeKalb County, where it spreads in a broad sheet southwest of the City of DeKalb (fig. 18). The deposit there is extensive, continuous, typically 10 to 20 feet thick, and extends almost to the southwest corner of the county. Substantial, rela-tively continuous deposits are also pres-ent east of DeKalb and in the southeast corner of the county. Based on well records, yields are generally small but adequate for a domestic well.
Surficial (Henry Formation) Aquifers The surficial sand and gravel deposits of the Wisconsin Episode belong to the Henry Formation. These deposits were not specifically mapped in this study, but are shown in figure 13 (combined with Cahokia: river-deposited silt and clay). The Henry Formation depos-its are well-sorted sands and gravels in terraces along outwash channels (including present-day stream valleys) and sand and gravel in gently sloping outwash plains at the margin of an end moraine. These deposits are pres-ent at or near the land surface, which limits their usefulness as groundwater resources as they are subject to short-ages during droughts and are highly susceptible to contamination from sur-ficial sources.
Sediments of the Equality Formation sediments (fig. 13) were deposited in temporary lakes formed during times of glacial retreat. The sediments are
composed of laminated silt and clay and generally do not provide a ground-water supply.
Aquifer Distribution The aquifer materials within the Troy Bedrock Valley display considerable lateral vari-ability; they may be interconnected in some areas and entirely absent in others. A physical interconnection between the basal unit and the middle unit may allow for locally significant hydraulic connections between the Basal Troy Bedrock Valley aquifer and the middle aquifer. Figure 19 depicts the possible lateral variability and sus-pected interconnections among the coarse-grained units, which can affect well yield and possibly cause interfer-ence between wells. Large groundwater withdrawals from deep sand and gravel aquifers may affect intermediate and/or shallow sand and gravel aquifers where there are nearby interconnec-tions. These connections should be factored into future hydrologic studies. Conflicts with existing private water systems may arise as high-capacity wells are developed by municipalities and industry. Remedial measures, such as well deepening or pump lowering, may be required.
ConclusionsBedrock aquifers historically have been the primary groundwater source for most uses in DeKalb County. Water quality problems, especially naturally occurring radium, now are limiting the use of the bedrock as an aquifer for expanding public water supplies in the county.
Overlying the bedrock uplands, the glacial drift is generally thin and dis-continuous. Sand and gravel aquifers in the drift, although they can provide a sufficient supply for domestic and farm use in some places, are generally not productive enough to yield large groundwater supplies.
Within the north-to-south–trending buried Troy Bedrock Valley that under-lies western DeKalb County, unconsoli-dated sediments exceed a thickness of 400 feet. Areas of thick sand and gravel deposits that have been identified in the basal unit and in the overlying middle unit suggest that significant
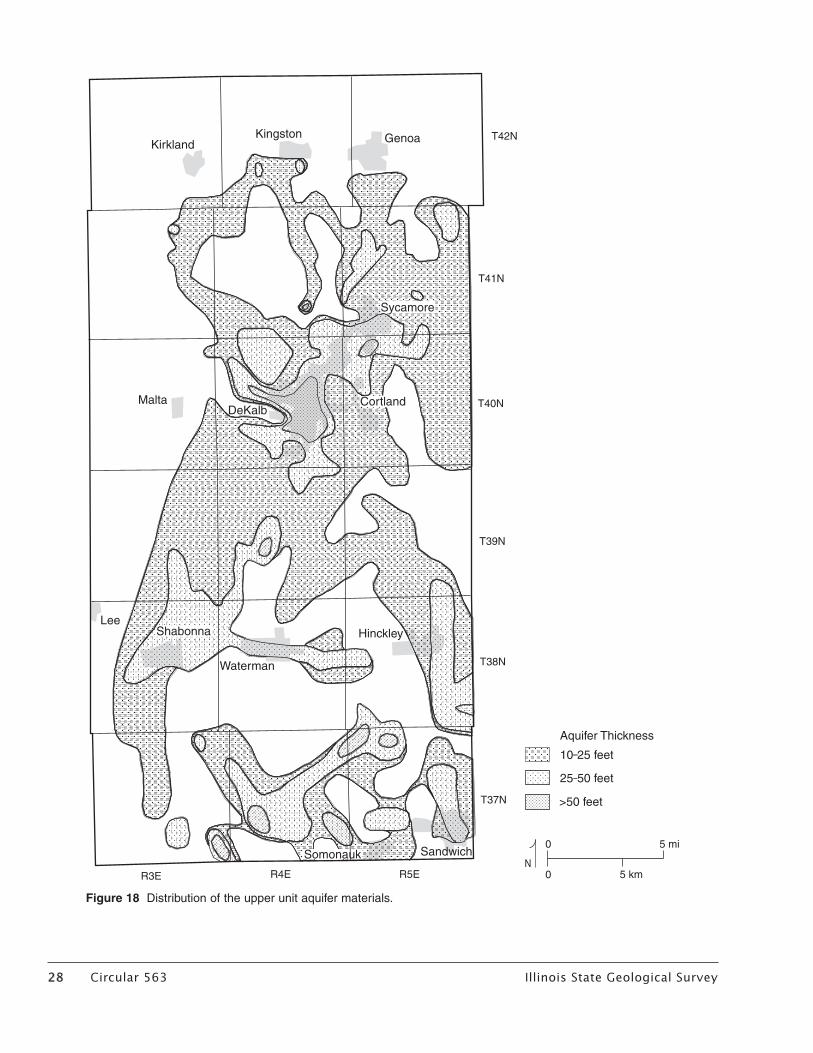
28 Circular 563 Illinois State Geological Survey Illinois State Geological Survey Circular 563 29
Figure 18 Distribution of the upper unit aquifer materials.
���������������� �����
�������������������
�����������
��������
��������
����������������
���
����
����
����
����
����
����
��� ���
�����������������
����������
����������
��������
��������
�
� ����
�����
28 Circular 563 Illinois State Geological Survey Illinois State Geological Survey Circular 563 29
groundwater resources may be avail-able for future development. Compre-hensive aquifer testing will be required to determine the full potential of these groundwater resources.
As the population of DeKalb County continues to grow, additional sources of groundwater will be required. Future, large-scale groundwater development will likely focus on that portion of the county underlain by the Troy Bedrock Valley. This mapping effort and a review of existing well information indicate that development potential exists for the sand and gravel aquifers within this valley. As more wells are drilled within these aquifers, a more detailed picture of the nature of the aquifers and their groundwater potential will emerge. Eventually, the sand and gravel aquifers of the Troy Bedrock Valley could provide a signifi-cant and increasing percentage of the county’s water needs.
and geophysical logging, which pro-vide knowledge of material grain size and particle sorting, factors that con-trol the hydraulic conductivity. Water-head data acquired from test holes help establish groundwater flow pat-terns. Seismic geophysical techniques can be used to establish more precisely the valley geometry that controls the presence or absence of aquifer materi-als. Additional geophysical techniques, such as resistivity surveys, can locate unknown deposits of coarse material suitable for groundwater production or establish more precisely the geom-etry of known aquifers.
Detailed mapping, using additional well data (e.g., geologic descriptions, geophysical logs) and information from seismic and resistivity surveys, will help establish the physical param-eters of the aquifers (e.g., areal extent, permeability) and water flow patterns necessary to develop groundwater flow models. These models can be used to
More detailed work is required to evaluate fully the potential ground-water yield from aquifers in the Troy Bedrock Valley, locate the most pro-ductive areas, and avoid potential well interference problems. The Troy Bed-rock Valley is a regional feature, and the variable conditions found within the valley’s sediments require site-specific research, including additional test holes, hydrologic testing, and other types of information to evaluate properly the groundwater resources in a particular area. Although of lesser prominence, exploration along the trend of the St. Charles Bedrock Valley will also yield a better appreciation of the development potential of its asso-ciated sand and gravel aquifers.
Additional test holes and surface geophysics could enhance the under-standing of aquifer geometry, allowing the areal extent and thickness of the aquifer to be defined more accurately. Test holes also allow sample collection
Figure 19 Idealized diagram of Troy Bedrock Valley aquifers.
�������������
�����������������
���������������
�����������������
������������������������
���������������
��������������
����
�����
��
����
����
����
����
����
���������������
���������������������
�����������������������
����������������������������������������������
�����������������
���������������������������
�������������������������������
����������������������������������������
�������������������������
������������������������
������������������������
30 Circular 563 Illinois State Geological Survey Illinois State Geological Survey Circular 563 31
characterize the water resources of the area more fully and to demonstrate the viability of future groundwater devel-opment from the sands and gravels of the Troy Bedrock Valley.
ReferencesAlden, W.C., 1904, The Delavan Lobe of
the Lake Michigan glacier: Reston, Virginia, U.S. Geological Survey, Professional Paper 34, 106 p.
Berg, R.C., J.P. Kempton, L.R. Follmer, and D.P. McKenna (leaders), 1985, Illinoian and Wisconsinan strati-graphy and environments in north-ern Illinois: The Altonian revised: Illinois State Geological Survey, Guidebook 19, 177 p.
Berg, R.C., J.P. Kempton, and A.N. Stecyk, 1984, Geology for planning in Boone and Winnebago Counties: Illinois State Geological Survey, Circular 531, 69 p.
Curry, B.B., and P.R. Seaber, 1990, hydrogeology of shallow ground-water resources, Kane County, Illi-nois: Illinois State Geological Survey, Contract/Grant Report 1990-1, 37 p.
Environmental Systems Research Institute, Inc., 1998, Arc/Info 7.2.1: Redlands, California.
Foote, G.R., 1982, Fracture analysis in northeastern Illinois and northern Indiana: Department of Geology, University of Illinois at Urbana-Champaign, M.S. thesis, 192 p.
Gilkeson, R.H., K. Cartwright, J.B. Cowart, and R.B. Holtzman, 1983, Hydrogeology and geochemical studies of selected natural radio-isotopes and barium in ground-water in Illinois: Illinois State Geological Survey, Contract/Grant Report 1983-6, 93 p.
Golden Software, 1999, Surfer 7 Users Guide: Golden, Colorado, Golden Software, Inc., 619 p.
Graese, A.M., R.A. Bauer, B.B. Curry, R.C. Vaiden, W.G. Dixon Jr., J.P. Kempton, 1988, Geological geotech-nical studies for siting the Supercon-ducting Super Collider in Illinois: Regional Summary: Illinois State Geological Survey, Environmental Geology Notes 123, 100 p.
Gross, D.L. (compiler), 1970, Geology for planning in DeKalb County, Illinois: Illinois State Geological Survey, Envi-ronmental Geology Notes 33, 26 p.
Hackett, J.E., and R.E. Bergstrom, 1956, Groundwater geology in northwest-ern Illinois: Illinois State Geological Survey, Circular 207, 24 p.
Hansel, A.K., and W.H. Johnson, 1996, Wedron and Mason Groups: Lithostratigraphic reclassification of deposits of the Wisconsin Episode, Lake Michigan Lobe area: Illinois State Geological Survey, Bulletin 104, 116 p.
Herzog, B.L., B.J. Stiff, C.A. Chenoweth, K.L. Warner, J.B. Sieverling, and C. Avery, 1994, Buried bedrock sur-face of Illinois: Illinois State Geo-logical Survey, Illinois Map 5, scale 1:500,000.
Horberg, L., 1950, Bedrock topography of Illinois: Illinois State Geological Survey, Bulletin 73, 111 p.
Johnson, W.H., A.K. Hansel, E.A. Bettis III, P.F. Karrow, G.J. Larson, T.V. Lowell, and A.F. Schneider, 1997, Late Quaternary temporal and event classifications, Great Lakes Region, North America: Quaternary Research, v. 47, no. 1, p. 1–12.
Kempton, J.P., 1963, Subsurface stra-tigraphy of the Pleistocene deposits of central northern Illinois: Illinois State Geological Survey, Circular 356, 43 p.
Kolata, D.R., T.C. Buschbach, and J.D. Treworgy, 1978, The Sandwich Fault Zone of northern Illinois: Illinois State Geological Survey, Circular 505, 26 p.
Kolata, D.R., and A.M. Graese, 1983, Lithostratigraphy and depositional environments of the Maquoketa Group (Ordovician) in northern Illinois: Illinois State Geological Survey, Circular 528, 49 p.
Lamar, J.E., 1927, Geology and eco-nomic resources of the St. Peter Sandstone of Illinois: Illinois State Geological Survey, Bulletin 53, 175 p.
Larson, D.R., B.L. Herzog, R.C. Vaiden, C.A. Chenoweth, Y. Xu, and R.C. Anderson, 1995, Hydrogeology of the Green River Lowland and associ-ated bedrock valleys in northwestern Illinois: Illinois State Geological Sur-vey, Environmental Geology 149, 20 p.
McGinnis, L.D., J.P. Kempton, and P.C. Heigold, 1963, Relationship of gravity anomalies to a drift-filled bedrock valley system in northern Illinois: Illinois State Geological Survey, Circular 354, 24 p.
Morrison, J.N., 1996, Evaluation of the hydrogeology and groundwater chemistry of the Troy Bedrock Valley in DeKalb County, Illinois: DeKalb, Illinois, Northern Illinois University, M.S. thesis, 135 p.
Munsell Soil Color Charts, 1975: Balti-more, Maryland, Kollmorgen Corpo-ration.
Reed, P.C., 1972, Data from controlled drilling program in Du Page, Kane, and Kendall Counties, Illinois: Illi-nois State Geological Survey, Envi-ronmental Geology Notes 53, 42 p.
Reed, P.C., 1976, Data from controlled drilling program in Boone and DeKalb Counties, Illinois: Illinois State Geological Survey, Environ-mental Geology Notes 77, 51 p.
Vaiden, R.C., M.J. Hasek, C.R. Gendron, B.B. Curry, A.M. Graese, and R.A. Bauer, 1988, Geological-geotechni-cal studies for siting the Supercon-ducting Super Collider in Illinois: Results of drilling large-diameter test holes in 1986: Illinois State Geological Survey, Environmental Geology Notes 124, 58 p.
Visocky, A.P., M.G. Sherrill, and K. Cart-wright, 1985, Geology, hydrology, and water quality of the Cambrian and Ordovician systems in north-ern Illinois: Illinois State Geologi-cal Survey and Illinois State Water Survey, Cooperative Groundwater Report 10, 136 p.
Wickham, S.S., W.H. Johnson, and H.D. Glass, 1988, Regional geology of the Tiskilwa Diamicton Member, Wedron Formation, northeastern Illinois: Illinois State Geological Survey, Circular 543, 35 p.
Willman, H.B., 1973, Rock stratigraphy of the Silurian System in north-eastern and northwestern Illinois: Illinois State Geological Survey, Circular 479, 55 p.
Willman, H.B., E. Atherton, T.C. Busch-bach, C. Collinson, J.C. Frye, M.E. Hopkins, J.A. Lineback, and J.A. Simon, 1975, Handbook of Illinois stratigraphy: Illinois State Geological Survey, Bulletin 95, 261 p.
Willman, H.B., and D.R. Kolata, 1978, The Platteville and Galena Groups in northern Illinois: Illinois State Geological Survey, Circular 502, 75 p.
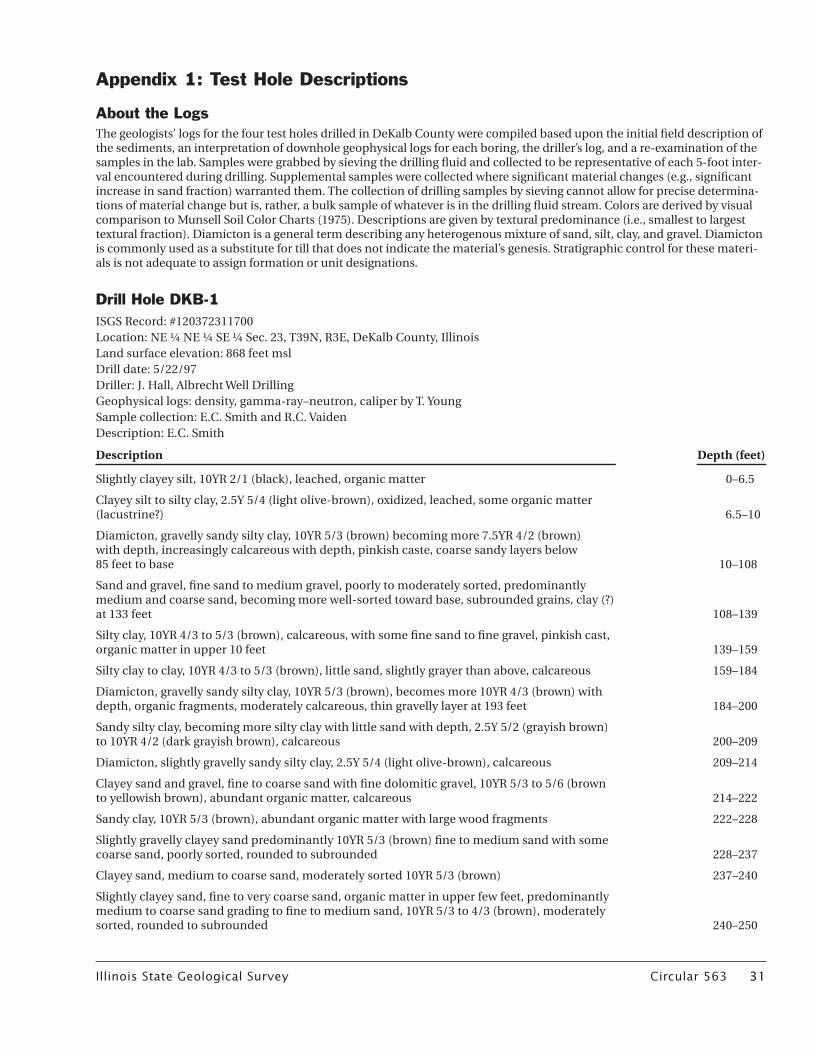
30 Circular 563 Illinois State Geological Survey Illinois State Geological Survey Circular 563 31
Appendix 1: Test Hole Descriptions
About the LogsThe geologists’ logs for the four test holes drilled in DeKalb County were compiled based upon the initial field description of the sediments, an interpretation of downhole geophysical logs for each boring, the driller’s log, and a re-examination of the samples in the lab. Samples were grabbed by sieving the drilling fluid and collected to be representative of each 5-foot inter-val encountered during drilling. Supplemental samples were collected where significant material changes (e.g., significant increase in sand fraction) warranted them. The collection of drilling samples by sieving cannot allow for precise determina-tions of material change but is, rather, a bulk sample of whatever is in the drilling fluid stream. Colors are derived by visual comparison to Munsell Soil Color Charts (1975). Descriptions are given by textural predominance (i.e., smallest to largest textural fraction). Diamicton is a general term describing any heterogenous mixture of sand, silt, clay, and gravel. Diamicton is commonly used as a substitute for till that does not indicate the material’s genesis. Stratigraphic control for these materi-als is not adequate to assign formation or unit designations.
Drill Hole DKB-1ISGS Record: #120372311700Location: NE 1⁄4 NE 1⁄4 SE 1⁄4 Sec. 23, T39N, R3E, DeKalb County, IllinoisLand surface elevation: 868 feet mslDrill date: 5/22/97Driller: J. Hall, Albrecht Well DrillingGeophysical logs: density, gamma-ray–neutron, caliper by T. YoungSample collection: E.C. Smith and R.C. VaidenDescription: E.C. Smith
Description Depth (feet)
Slightly clayey silt, 10YR 2/1 (black), leached, organic matter 0–6.5
Clayey silt to silty clay, 2.5Y 5/4 (light olive-brown), oxidized, leached, some organic matter (lacustrine?) 6.5–10
Diamicton, gravelly sandy silty clay, 10YR 5/3 (brown) becoming more 7.5YR 4/2 (brown) with depth, increasingly calcareous with depth, pinkish caste, coarse sandy layers below 85 feet to base 10–108
Sand and gravel, fine sand to medium gravel, poorly to moderately sorted, predominantly medium and coarse sand, becoming more well-sorted toward base, subrounded grains, clay (?) at 133 feet 108–139
Silty clay, 10YR 4/3 to 5/3 (brown), calcareous, with some fine sand to fine gravel, pinkish cast, organic matter in upper 10 feet 139–159
Silty clay to clay, 10YR 4/3 to 5/3 (brown), little sand, slightly grayer than above, calcareous 159–184
Diamicton, gravelly sandy silty clay, 10YR 5/3 (brown), becomes more 10YR 4/3 (brown) with depth, organic fragments, moderately calcareous, thin gravelly layer at 193 feet 184–200
Sandy silty clay, becoming more silty clay with little sand with depth, 2.5Y 5/2 (grayish brown) to 10YR 4/2 (dark grayish brown), calcareous 200–209
Diamicton, slightly gravelly sandy silty clay, 2.5Y 5/4 (light olive-brown), calcareous 209–214
Clayey sand and gravel, fine to coarse sand with fine dolomitic gravel, 10YR 5/3 to 5/6 (brown to yellowish brown), abundant organic matter, calcareous 214–222
Sandy clay, 10YR 5/3 (brown), abundant organic matter with large wood fragments 222–228
Slightly gravelly clayey sand predominantly 10YR 5/3 (brown) fine to medium sand with some coarse sand, poorly sorted, rounded to subrounded 228–237
Clayey sand, medium to coarse sand, moderately sorted 10YR 5/3 (brown) 237–240
Slightly clayey sand, fine to very coarse sand, organic matter in upper few feet, predominantly medium to coarse sand grading to fine to medium sand, 10YR 5/3 to 4/3 (brown), moderately sorted, rounded to subrounded 240–250
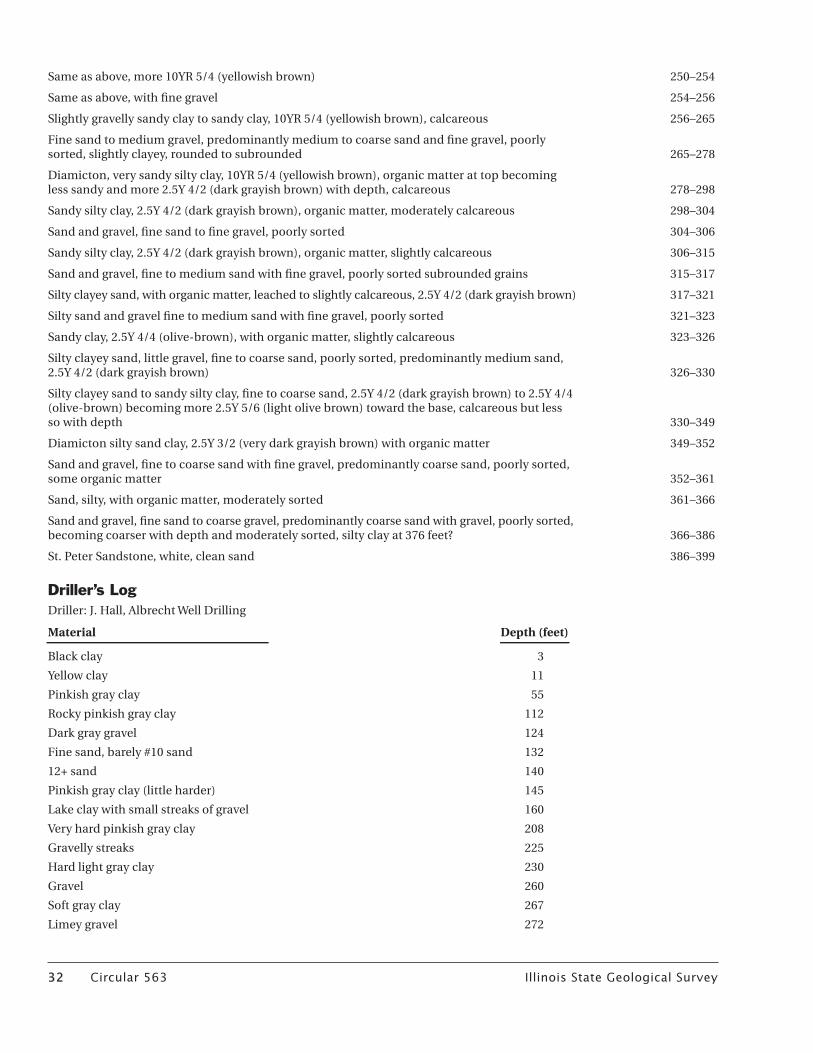
32 Circular 563 Illinois State Geological Survey Illinois State Geological Survey Circular 563 33
Same as above, more 10YR 5/4 (yellowish brown) 250–254
Same as above, with fine gravel 254–256
Slightly gravelly sandy clay to sandy clay, 10YR 5/4 (yellowish brown), calcareous 256–265
Fine sand to medium gravel, predominantly medium to coarse sand and fine gravel, poorlysorted, slightly clayey, rounded to subrounded 265–278
Diamicton, very sandy silty clay, 10YR 5/4 (yellowish brown), organic matter at top becoming less sandy and more 2.5Y 4/2 (dark grayish brown) with depth, calcareous 278–298
Sandy silty clay, 2.5Y 4/2 (dark grayish brown), organic matter, moderately calcareous 298–304
Sand and gravel, fine sand to fine gravel, poorly sorted 304–306
Sandy silty clay, 2.5Y 4/2 (dark grayish brown), organic matter, slightly calcareous 306–315
Sand and gravel, fine to medium sand with fine gravel, poorly sorted subrounded grains 315–317
Silty clayey sand, with organic matter, leached to slightly calcareous, 2.5Y 4/2 (dark grayish brown) 317–321
Silty sand and gravel fine to medium sand with fine gravel, poorly sorted 321–323
Sandy clay, 2.5Y 4/4 (olive-brown), with organic matter, slightly calcareous 323–326
Silty clayey sand, little gravel, fine to coarse sand, poorly sorted, predominantly medium sand, 2.5Y 4/2 (dark grayish brown) 326–330
Silty clayey sand to sandy silty clay, fine to coarse sand, 2.5Y 4/2 (dark grayish brown) to 2.5Y 4/4 (olive-brown) becoming more 2.5Y 5/6 (light olive brown) toward the base, calcareous but less so with depth 330–349
Diamicton silty sand clay, 2.5Y 3/2 (very dark grayish brown) with organic matter 349–352
Sand and gravel, fine to coarse sand with fine gravel, predominantly coarse sand, poorly sorted, some organic matter 352–361
Sand, silty, with organic matter, moderately sorted 361–366
Sand and gravel, fine sand to coarse gravel, predominantly coarse sand with gravel, poorly sorted, becoming coarser with depth and moderately sorted, silty clay at 376 feet? 366–386
St. Peter Sandstone, white, clean sand 386–399
Driller’s LogDriller: J. Hall, Albrecht Well Drilling
Material Depth (feet)
Black clay 3
Yellow clay 11
Pinkish gray clay 55
Rocky pinkish gray clay 112
Dark gray gravel 124
Fine sand, barely #10 sand 132
12+ sand 140
Pinkish gray clay (little harder) 145
Lake clay with small streaks of gravel 160
Very hard pinkish gray clay 208
Gravelly streaks 225
Hard light gray clay 230
Gravel 260
Soft gray clay 267
Limey gravel 272
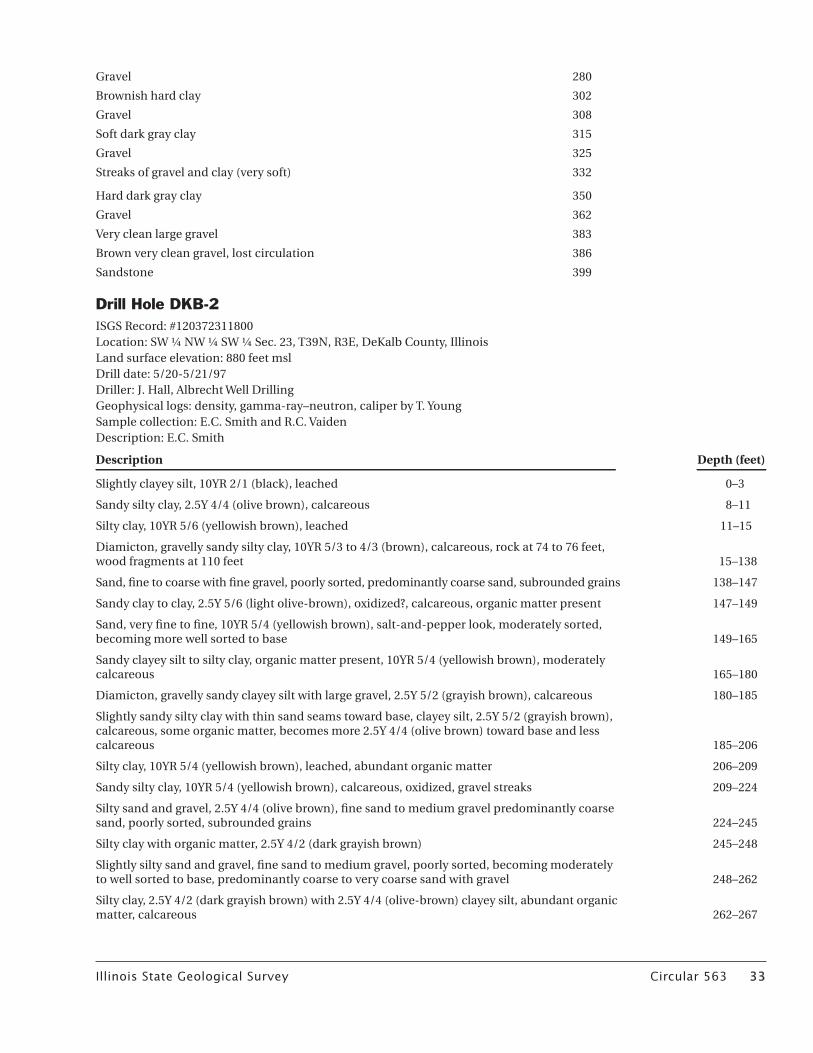
32 Circular 563 Illinois State Geological Survey Illinois State Geological Survey Circular 563 33
Gravel 280
Brownish hard clay 302
Gravel 308
Soft dark gray clay 315
Gravel 325
Streaks of gravel and clay (very soft) 332
Hard dark gray clay 350
Gravel 362
Very clean large gravel 383
Brown very clean gravel, lost circulation 386
Sandstone 399
Drill Hole DKB-2ISGS Record: #120372311800Location: SW 1⁄4 NW 1⁄4 SW 1⁄4 Sec. 23, T39N, R3E, DeKalb County, IllinoisLand surface elevation: 880 feet mslDrill date: 5/20-5/21/97Driller: J. Hall, Albrecht Well DrillingGeophysical logs: density, gamma-ray–neutron, caliper by T. YoungSample collection: E.C. Smith and R.C. VaidenDescription: E.C. Smith
Description Depth (feet)
Slightly clayey silt, 10YR 2/1 (black), leached 0–3
Sandy silty clay, 2.5Y 4/4 (olive brown), calcareous 8–11
Silty clay, 10YR 5/6 (yellowish brown), leached 11–15
Diamicton, gravelly sandy silty clay, 10YR 5/3 to 4/3 (brown), calcareous, rock at 74 to 76 feet, wood fragments at 110 feet 15–138
Sand, fine to coarse with fine gravel, poorly sorted, predominantly coarse sand, subrounded grains 138–147
Sandy clay to clay, 2.5Y 5/6 (light olive-brown), oxidized?, calcareous, organic matter present 147–149
Sand, very fine to fine, 10YR 5/4 (yellowish brown), salt-and-pepper look, moderately sorted, becoming more well sorted to base 149–165
Sandy clayey silt to silty clay, organic matter present, 10YR 5/4 (yellowish brown), moderately calcareous 165–180
Diamicton, gravelly sandy clayey silt with large gravel, 2.5Y 5/2 (grayish brown), calcareous 180–185
Slightly sandy silty clay with thin sand seams toward base, clayey silt, 2.5Y 5/2 (grayish brown), calcareous, some organic matter, becomes more 2.5Y 4/4 (olive brown) toward base and less calcareous 185–206
Silty clay, 10YR 5/4 (yellowish brown), leached, abundant organic matter 206–209
Sandy silty clay, 10YR 5/4 (yellowish brown), calcareous, oxidized, gravel streaks 209–224
Silty sand and gravel, 2.5Y 4/4 (olive brown), fine sand to medium gravel predominantly coarse sand, poorly sorted, subrounded grains 224–245
Silty clay with organic matter, 2.5Y 4/2 (dark grayish brown) 245–248
Slightly silty sand and gravel, fine sand to medium gravel, poorly sorted, becoming moderately to well sorted to base, predominantly coarse to very coarse sand with gravel 248–262
Silty clay, 2.5Y 4/2 (dark grayish brown) with 2.5Y 4/4 (olive-brown) clayey silt, abundant organic matter, calcareous 262–267
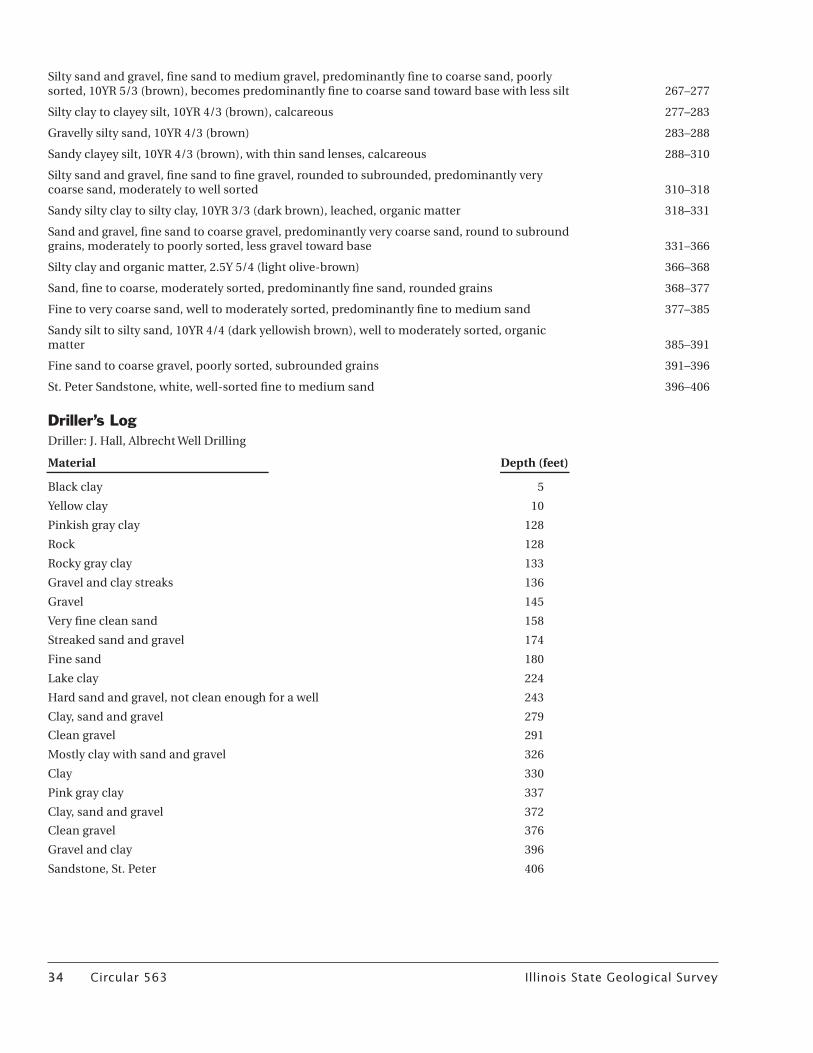
34 Circular 563 Illinois State Geological Survey Illinois State Geological Survey Circular 563 35
Silty sand and gravel, fine sand to medium gravel, predominantly fine to coarse sand, poorly sorted, 10YR 5/3 (brown), becomes predominantly fine to coarse sand toward base with less silt 267–277
Silty clay to clayey silt, 10YR 4/3 (brown), calcareous 277–283
Gravelly silty sand, 10YR 4/3 (brown) 283–288
Sandy clayey silt, 10YR 4/3 (brown), with thin sand lenses, calcareous 288–310
Silty sand and gravel, fine sand to fine gravel, rounded to subrounded, predominantly very coarse sand, moderately to well sorted 310–318
Sandy silty clay to silty clay, 10YR 3/3 (dark brown), leached, organic matter 318–331
Sand and gravel, fine sand to coarse gravel, predominantly very coarse sand, round to subround grains, moderately to poorly sorted, less gravel toward base 331–366
Silty clay and organic matter, 2.5Y 5/4 (light olive-brown) 366–368
Sand, fine to coarse, moderately sorted, predominantly fine sand, rounded grains 368–377
Fine to very coarse sand, well to moderately sorted, predominantly fine to medium sand 377–385
Sandy silt to silty sand, 10YR 4/4 (dark yellowish brown), well to moderately sorted, organic matter 385–391
Fine sand to coarse gravel, poorly sorted, subrounded grains 391–396
St. Peter Sandstone, white, well-sorted fine to medium sand 396–406
Driller’s LogDriller: J. Hall, Albrecht Well Drilling
Material Depth (feet)
Black clay 5
Yellow clay 10
Pinkish gray clay 128
Rock 128
Rocky gray clay 133
Gravel and clay streaks 136
Gravel 145
Very fine clean sand 158
Streaked sand and gravel 174
Fine sand 180
Lake clay 224
Hard sand and gravel, not clean enough for a well 243
Clay, sand and gravel 279
Clean gravel 291
Mostly clay with sand and gravel 326
Clay 330
Pink gray clay 337
Clay, sand and gravel 372
Clean gravel 376
Gravel and clay 396
Sandstone, St. Peter 406
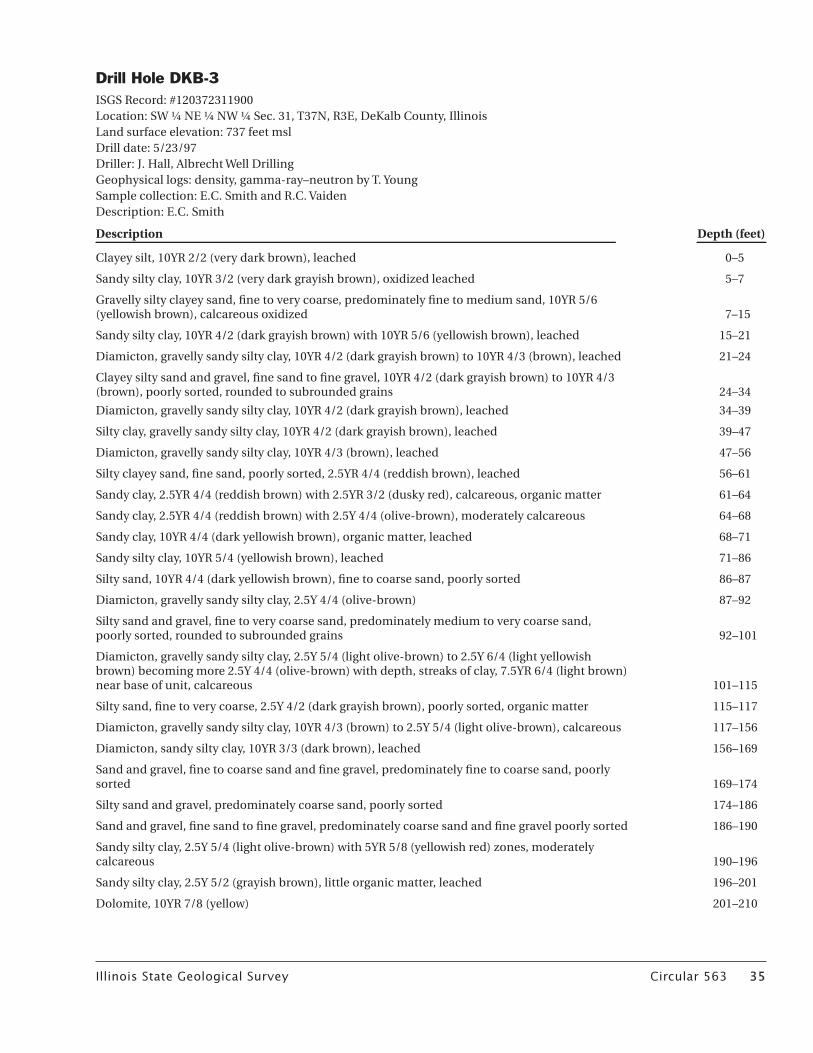
34 Circular 563 Illinois State Geological Survey Illinois State Geological Survey Circular 563 35
Drill Hole DKB-3ISGS Record: #120372311900Location: SW 1⁄4 NE 1⁄4 NW 1⁄4 Sec. 31, T37N, R3E, DeKalb County, IllinoisLand surface elevation: 737 feet mslDrill date: 5/23/97Driller: J. Hall, Albrecht Well DrillingGeophysical logs: density, gamma-ray–neutron by T. YoungSample collection: E.C. Smith and R.C. VaidenDescription: E.C. Smith
Description Depth (feet)
Clayey silt, 10YR 2/2 (very dark brown), leached 0–5
Sandy silty clay, 10YR 3/2 (very dark grayish brown), oxidized leached 5–7
Gravelly silty clayey sand, fine to very coarse, predominately fine to medium sand, 10YR 5/6 (yellowish brown), calcareous oxidized 7–15
Sandy silty clay, 10YR 4/2 (dark grayish brown) with 10YR 5/6 (yellowish brown), leached 15–21
Diamicton, gravelly sandy silty clay, 10YR 4/2 (dark grayish brown) to 10YR 4/3 (brown), leached 21–24
Clayey silty sand and gravel, fine sand to fine gravel, 10YR 4/2 (dark grayish brown) to 10YR 4/3 (brown), poorly sorted, rounded to subrounded grains 24–34
Diamicton, gravelly sandy silty clay, 10YR 4/2 (dark grayish brown), leached 34–39
Silty clay, gravelly sandy silty clay, 10YR 4/2 (dark grayish brown), leached 39–47
Diamicton, gravelly sandy silty clay, 10YR 4/3 (brown), leached 47–56
Silty clayey sand, fine sand, poorly sorted, 2.5YR 4/4 (reddish brown), leached 56–61
Sandy clay, 2.5YR 4/4 (reddish brown) with 2.5YR 3/2 (dusky red), calcareous, organic matter 61–64
Sandy clay, 2.5YR 4/4 (reddish brown) with 2.5Y 4/4 (olive-brown), moderately calcareous 64–68
Sandy clay, 10YR 4/4 (dark yellowish brown), organic matter, leached 68–71
Sandy silty clay, 10YR 5/4 (yellowish brown), leached 71–86
Silty sand, 10YR 4/4 (dark yellowish brown), fine to coarse sand, poorly sorted 86–87
Diamicton, gravelly sandy silty clay, 2.5Y 4/4 (olive-brown) 87–92
Silty sand and gravel, fine to very coarse sand, predominately medium to very coarse sand, poorly sorted, rounded to subrounded grains 92–101
Diamicton, gravelly sandy silty clay, 2.5Y 5/4 (light olive-brown) to 2.5Y 6/4 (light yellowish brown) becoming more 2.5Y 4/4 (olive-brown) with depth, streaks of clay, 7.5YR 6/4 (light brown) near base of unit, calcareous 101–115
Silty sand, fine to very coarse, 2.5Y 4/2 (dark grayish brown), poorly sorted, organic matter 115–117
Diamicton, gravelly sandy silty clay, 10YR 4/3 (brown) to 2.5Y 5/4 (light olive-brown), calcareous 117–156
Diamicton, sandy silty clay, 10YR 3/3 (dark brown), leached 156–169
Sand and gravel, fine to coarse sand and fine gravel, predominately fine to coarse sand, poorly sorted 169–174
Silty sand and gravel, predominately coarse sand, poorly sorted 174–186
Sand and gravel, fine sand to fine gravel, predominately coarse sand and fine gravel poorly sorted 186–190
Sandy silty clay, 2.5Y 5/4 (light olive-brown) with 5YR 5/8 (yellowish red) zones, moderately calcareous 190–196
Sandy silty clay, 2.5Y 5/2 (grayish brown), little organic matter, leached 196–201
Dolomite, 10YR 7/8 (yellow) 201–210
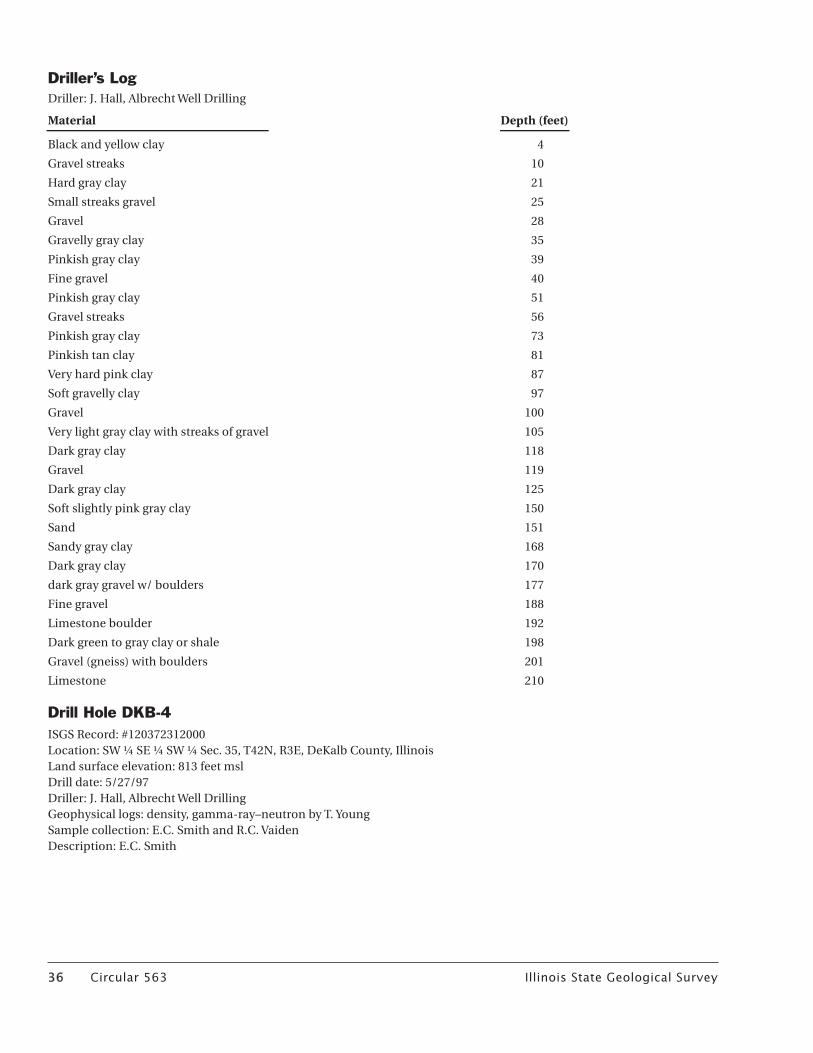
36 Circular 563 Illinois State Geological Survey Illinois State Geological Survey Circular 563 37
Driller’s LogDriller: J. Hall, Albrecht Well Drilling
Material Depth (feet)
Black and yellow clay 4
Gravel streaks 10
Hard gray clay 21
Small streaks gravel 25
Gravel 28
Gravelly gray clay 35
Pinkish gray clay 39
Fine gravel 40
Pinkish gray clay 51
Gravel streaks 56
Pinkish gray clay 73
Pinkish tan clay 81
Very hard pink clay 87
Soft gravelly clay 97
Gravel 100
Very light gray clay with streaks of gravel 105
Dark gray clay 118
Gravel 119
Dark gray clay 125
Soft slightly pink gray clay 150
Sand 151
Sandy gray clay 168
Dark gray clay 170
dark gray gravel w/ boulders 177
Fine gravel 188
Limestone boulder 192
Dark green to gray clay or shale 198
Gravel (gneiss) with boulders 201
Limestone 210
Drill Hole DKB-4ISGS Record: #120372312000Location: SW 1⁄4 SE 1⁄4 SW 1⁄4 Sec. 35, T42N, R3E, DeKalb County, IllinoisLand surface elevation: 813 feet mslDrill date: 5/27/97Driller: J. Hall, Albrecht Well DrillingGeophysical logs: density, gamma-ray–neutron by T. YoungSample collection: E.C. Smith and R.C. VaidenDescription: E.C. Smith
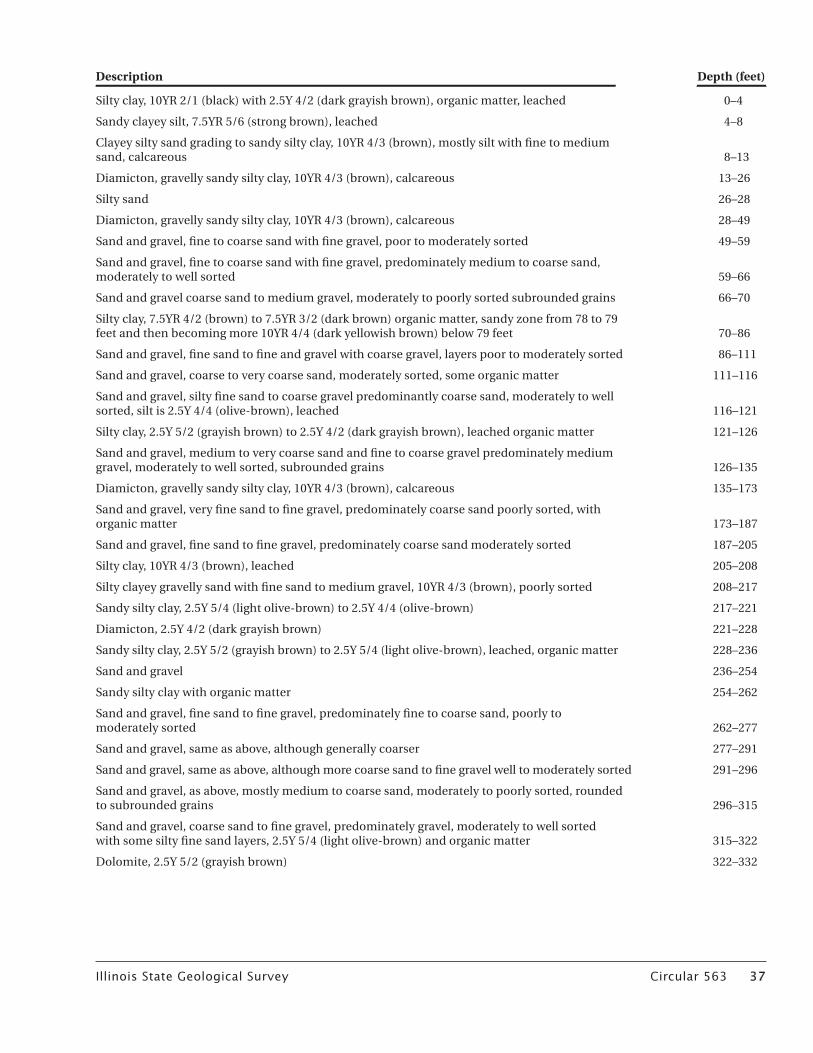
36 Circular 563 Illinois State Geological Survey Illinois State Geological Survey Circular 563 37
Description Depth (feet)
Silty clay, 10YR 2/1 (black) with 2.5Y 4/2 (dark grayish brown), organic matter, leached 0–4
Sandy clayey silt, 7.5YR 5/6 (strong brown), leached 4–8
Clayey silty sand grading to sandy silty clay, 10YR 4/3 (brown), mostly silt with fine to medium sand, calcareous 8–13
Diamicton, gravelly sandy silty clay, 10YR 4/3 (brown), calcareous 13–26
Silty sand 26–28
Diamicton, gravelly sandy silty clay, 10YR 4/3 (brown), calcareous 28–49
Sand and gravel, fine to coarse sand with fine gravel, poor to moderately sorted 49–59
Sand and gravel, fine to coarse sand with fine gravel, predominately medium to coarse sand, moderately to well sorted 59–66
Sand and gravel coarse sand to medium gravel, moderately to poorly sorted subrounded grains 66–70
Silty clay, 7.5YR 4/2 (brown) to 7.5YR 3/2 (dark brown) organic matter, sandy zone from 78 to 79 feet and then becoming more 10YR 4/4 (dark yellowish brown) below 79 feet 70–86
Sand and gravel, fine sand to fine and gravel with coarse gravel, layers poor to moderately sorted 86–111
Sand and gravel, coarse to very coarse sand, moderately sorted, some organic matter 111–116
Sand and gravel, silty fine sand to coarse gravel predominantly coarse sand, moderately to well sorted, silt is 2.5Y 4/4 (olive-brown), leached 116–121
Silty clay, 2.5Y 5/2 (grayish brown) to 2.5Y 4/2 (dark grayish brown), leached organic matter 121–126
Sand and gravel, medium to very coarse sand and fine to coarse gravel predominately medium gravel, moderately to well sorted, subrounded grains 126–135
Diamicton, gravelly sandy silty clay, 10YR 4/3 (brown), calcareous 135–173
Sand and gravel, very fine sand to fine gravel, predominately coarse sand poorly sorted, with organic matter 173–187
Sand and gravel, fine sand to fine gravel, predominately coarse sand moderately sorted 187–205
Silty clay, 10YR 4/3 (brown), leached 205–208
Silty clayey gravelly sand with fine sand to medium gravel, 10YR 4/3 (brown), poorly sorted 208–217
Sandy silty clay, 2.5Y 5/4 (light olive-brown) to 2.5Y 4/4 (olive-brown) 217–221
Diamicton, 2.5Y 4/2 (dark grayish brown) 221–228
Sandy silty clay, 2.5Y 5/2 (grayish brown) to 2.5Y 5/4 (light olive-brown), leached, organic matter 228–236
Sand and gravel 236–254
Sandy silty clay with organic matter 254–262
Sand and gravel, fine sand to fine gravel, predominately fine to coarse sand, poorly to moderately sorted 262–277
Sand and gravel, same as above, although generally coarser 277–291
Sand and gravel, same as above, although more coarse sand to fine gravel well to moderately sorted 291–296
Sand and gravel, as above, mostly medium to coarse sand, moderately to poorly sorted, rounded to subrounded grains 296–315
Sand and gravel, coarse sand to fine gravel, predominately gravel, moderately to well sorted with some silty fine sand layers, 2.5Y 5/4 (light olive-brown) and organic matter 315–322
Dolomite, 2.5Y 5/2 (grayish brown) 322–332
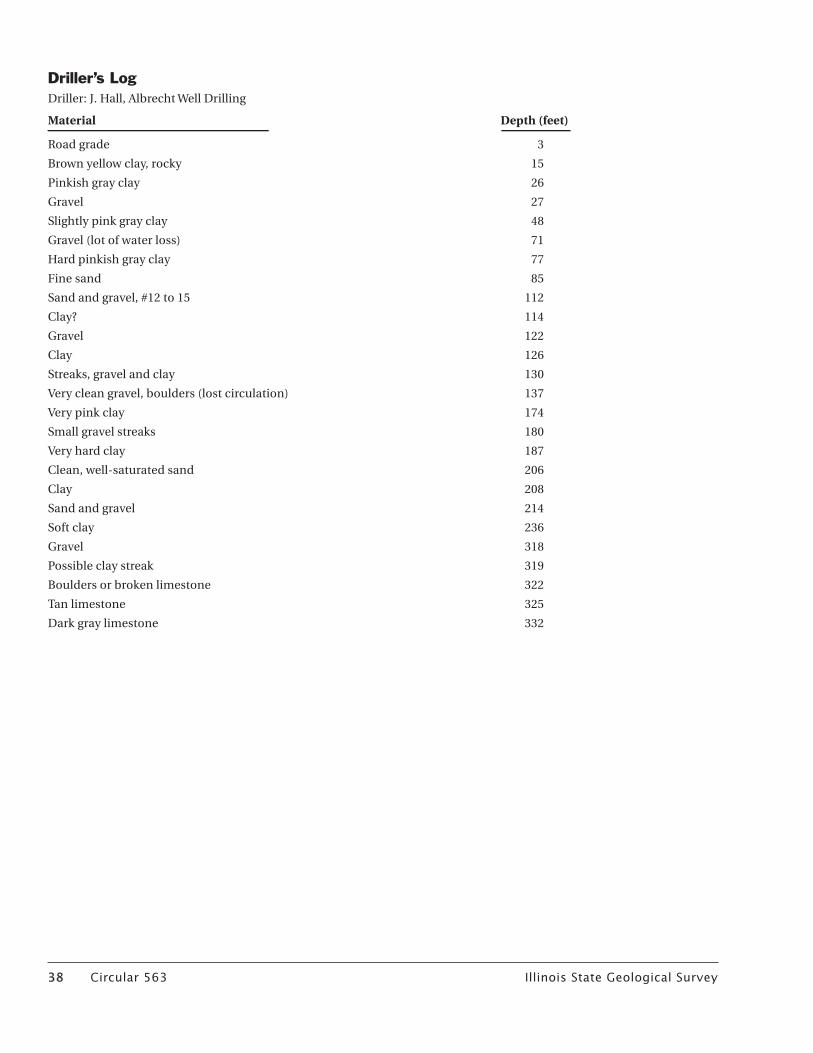
38 Circular 563 Illinois State Geological Survey Illinois State Geological Survey Circular 563 39
Driller’s LogDriller: J. Hall, Albrecht Well Drilling
Material Depth (feet)
Road grade 3
Brown yellow clay, rocky 15
Pinkish gray clay 26
Gravel 27
Slightly pink gray clay 48
Gravel (lot of water loss) 71
Hard pinkish gray clay 77
Fine sand 85
Sand and gravel, #12 to 15 112
Clay? 114
Gravel 122
Clay 126
Streaks, gravel and clay 130
Very clean gravel, boulders (lost circulation) 137
Very pink clay 174
Small gravel streaks 180
Very hard clay 187
Clean, well-saturated sand 206
Clay 208
Sand and gravel 214
Soft clay 236
Gravel 318
Possible clay streak 319
Boulders or broken limestone 322
Tan limestone 325
Dark gray limestone 332
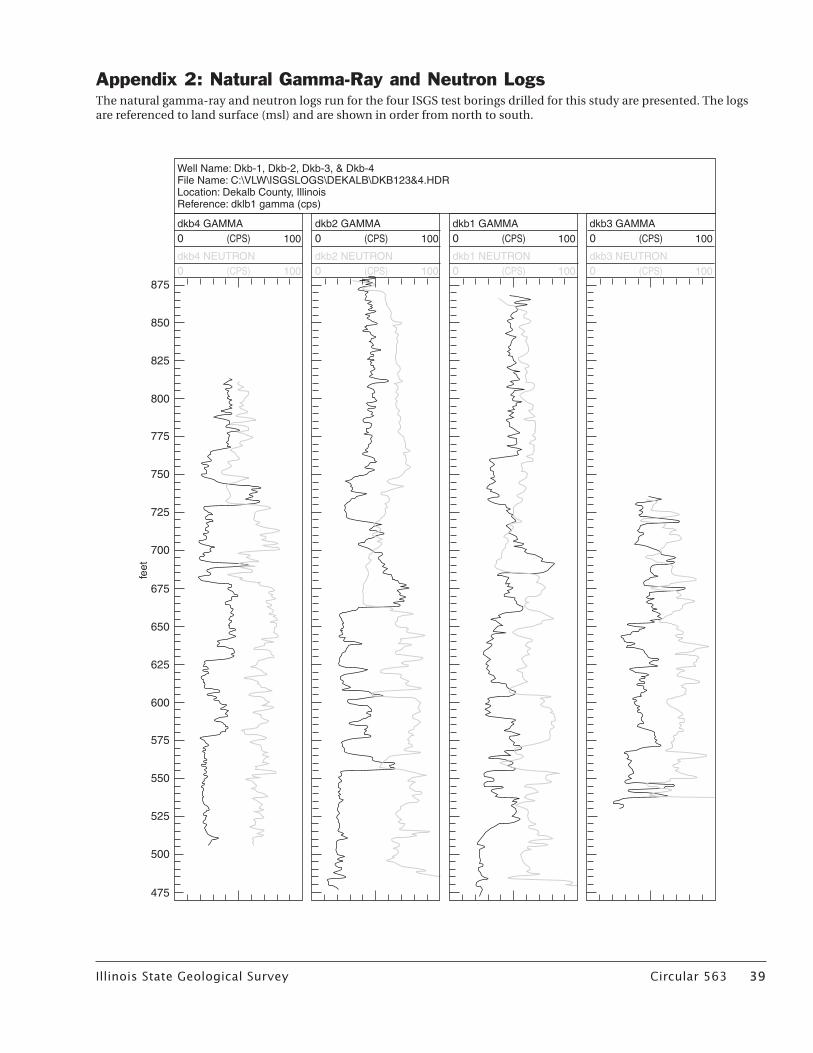
38 Circular 563 Illinois State Geological Survey Illinois State Geological Survey Circular 563 39
Appendix 2: Natural Gamma-Ray and Neutron LogsThe natural gamma-ray and neutron logs run for the four ISGS test borings drilled for this study are presented. The logs are referenced to land surface (msl) and are shown in order from north to south.
�����������
���
���
���
���
���
���
���
���
���
���
���
���
���
���
���
���
����
������������ ������������ ������������ ������������� ��������� ������������������
������������������ ���������� ���������� ����������� ��������� ������������������
��������������������������������������������������������������������������������������������������������������������������������������������������