Embed Size (px)
Citation preview
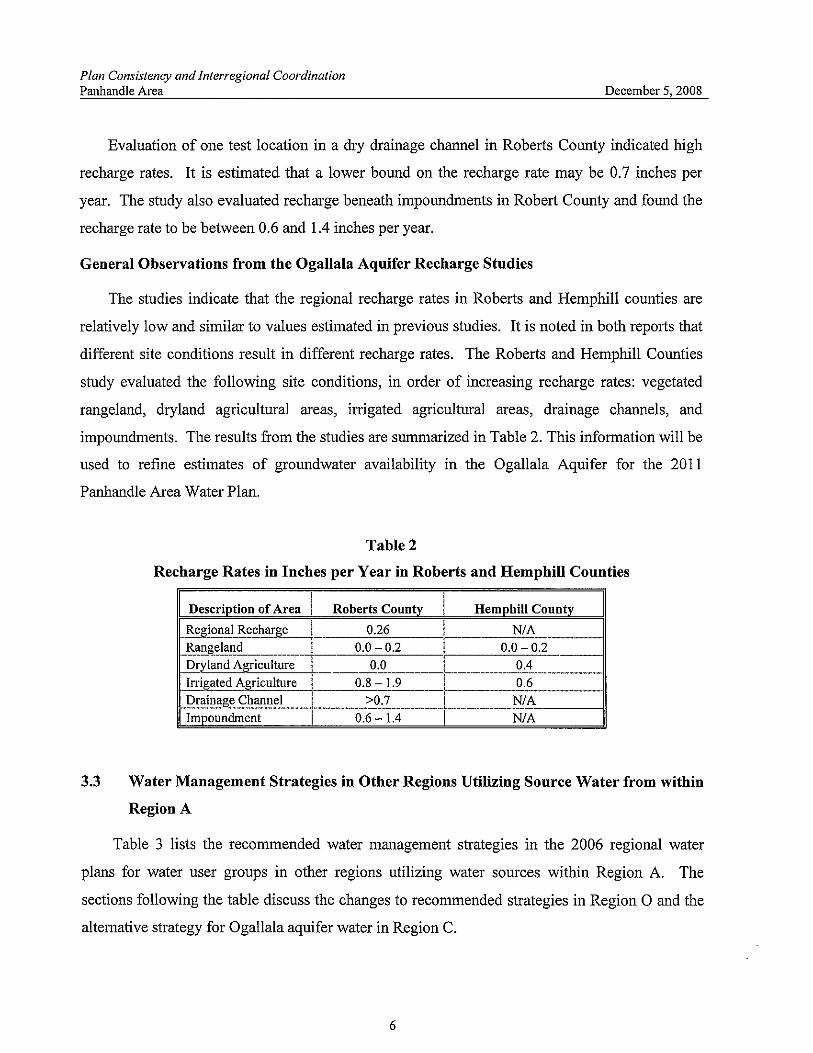
GROUNDWATER RECHARGE IN THE CENTRAL HIGH PLAINS OF TEXAS: ROBERTS ANDHEMPHILL COUNTIES
Robert C. Reedy" Sarah Davidson', Amy Crowell2,John Gates', Osama Akasheh', and Bridget R. Scanlon'
'Bureau of Economic Geology, Jackson School of Geosciences,The University of Texas at Austin, Austin, Texas
2Panhandle Groundwater Conservation District, White Deer, Texas
Funded by the Texas Water Development Board through the Panhandle Water Planning Group
TABLE OF CONTENTS
PURPOSE OF STUDY AND CORRELATION TO REGIONAL PLANNING .4
EXECUTIVE SUMMARY 6
1.0 INTRODUCTION 10
2.0 METHODS 112.1 Meteoric Chloride 11
2.1.1 Data Sources 132.2 Field Methods 14
2.2.1 Soil Cores 142.2.2 Electromagnetic Induction 142.2.3 Groundwater Tritium-Helium Age Dating 15
2.3 Laboratory Methods 162.4 Unsaturated Zone Modeling 17
3.0 RESULTS AND DISCUSSION 203.1 Recharge Estimates Based on Groundwater Chloride D~ta 203.2 Groundwater Tritium-Helium Age-Dating Results 223.3 Recharge Estimates Based on Unsaturated Zone Field Studies 23
3.3.1 Rangeland Setting 233.3.2 Dryland Setting 253.3.3 Irrigated Setting 263.3.4 Drainage Setting 283.3.5 Stock Impoundments 28
3.4 Recharge Estimates Based on Unsaturated Zone Modeling 293.4.1 Nonvegetated, Monolithic Sand Simulations 293.4.2 Nonvegetated, Texturally Variable Soil Simulations 303.4.3 Vegetated, Monolithic Sand Simulations 303.4.4 Vegetated, Texturally Variable Soil Simulations 31
4.0 Summary 31
5.0 Acknowledgments 33
6.0 References 34
7.0 Tables 38
8.0 Figures 47
9.0 Appendix A (Calculation of Recharge Rates) 71
10.0 Appendix B (Evaluation of Existing Ponds) 78
11.0 Appendix C (TWDB Comments Addressed) 81
2
LIST OF TABLES
Table 1. Borehole locations 38
Table 2. Tritium-helium sample results 38
Table 3. Borehole analysis results - physical measurements and recharge rates 39
Table 4. Borehole analysis results - chloride, nitrate-N, sulfate, fluoride .40
Table 5. UNSAT-H vegetation input parameters 41
Table 6. UNSAT-H soil physical parameters 42
Table 7. UNSAT-H simulation results 45
Table 8. UNSAT-H simulation results 46
LIST OF FIGURES
Figure 1. Borehole location map 47
Figure 2. Generalized land cover map 48
Figure 3. Mean annual precipitation map .49
Figure 4. Mean annual chloride deposition map 50
Figure 5. Groundwater chloride concentration and tritium-helium sample location map 51
Figure 6. Water table elevation map 52
Figure 7. Relationship between chloride in groundwater and well penetration factor 53
Figure 8. Soil clay content map 54
Figure 9. Surface elevation map 55
Figure 10. Surface slope map 56
Figure 11. Rangeland borehole water content, matric potential, and chloride profiles 57
Figure 12. Rangeland borehole water content, matric potential, and chloride profiles 59
Figure 13. Dryland borehole water content, matric potential, and chloride profiles 60
Figure 14. Irrigated borehole water content, matric potential, and chloride profiles 61
Figure 15. Drainage borehole water content, matric potential, and chloride profile 61
Figure 16. Impoundment borehole water content, matric potential, and chloride profiles 62
Figure 17. Rangeland borehole chloride, nitrate-N, sulfate, and fluoride profiles 63
Figure 18. Rangeland borehole chloride, nitrate-N, sulfate, and fluoride profiles 65
Figure 19. Dryland borehole chloride, nitrate-N, sulfate, and fluoride profiles 66
Figure 20. Irrigated borehole chloride, nitrate-N, sulfate, and fluoride profiles 67
Figure 21. Drainage borehole chloride, nitrate-N, sulfate, and fluoride profile 67
Figure 22. Impoundment borehole chloride, nitrate-N, sulfate, and fluoride profiles 68
Figure 23. Median apparent electrical conductivity results 69
Figure 24. Simulated annual water budget parameters for nonvegetated monolithic sand 69
Figure 25. Simulated drainage results summary for the different UNSAT-H models 70
3
Purpose of Study and Correlation toRegional Planning
Task 1.1 QuantitY Recharge Rates Using the Chloride Mass Balance Approach
Purpose:The spatial variability in natural groundwater recharge will be estimated using the chloride massbalance approach.
Relation to Regional Planning:By more precisely identifying the natural recharge rates in the study's focus area, the PanhandleWater Planning Group will be better able to design models that account for more preciserecharge rates. These models will then be used for more precise Managed AvailableGroundwater and Groundwater Availability Model numbers.
Location ofTask 1.1 in the Report:
A. Data Collection: Section 2.2 - Field MethodsSection 2.2.1 - Soil Cores
B. Field Investigation: Section 2.2 - Field MethodsSection 2.2.1 - Soil Cores
p.l4p.14
p.14p.14
C. Recharge Rates: Section 3.3 Recharge Estimates... p.23
D Existing Ponds: Section 3.2.5 Stock Impoundments p.28
Task 1.2 Numerical Modeling of Groundwater Recharge
Purpose:Unsaturated zone modeling will be conducted to estimate recharge in this region and to evaluatecontrols on groundwater recharge that would allow regionalization of point recharge estimatesfrom borehole data.
Relation to Regional Planning:Identifying recharge rates in areas of different land usage in Roberts and Hemphill Countiesprovides the Panhandle Water Planning Group with detailed data that will be useful inidentifying future water conservation and water management strategies. Rangeland, dryland,irrigated, and dry stream soils are all tested to ensure that a variety of land usage options areconsidered. The results of this study will affect regional water planning from both theperspective of recharge resources and recommended land use strategies.
4
Location o/Task 1.2 in the Report:
A. Data Collection: Section 2.4 - Unsaturated Zone...
B. Unsaturated Zone: Section 2.4 - Unsaturated Zone...
p.l7
p.l7
C. Recharge Value: Section 3.3 - Recharge Estimates... p.23
Task 1.3 Geochemical Studies
Purpose:Chemical, isotopic, and age-date data will be used to understand how water quality is likely tochanges as the aquifer is dewatered. The water quality info=ation assesses the potential forchanges in the quality of produced water as the aquifer declines and the influence of theunderlying bedrock becomes more important.
Relation to Regional Planning:In previous plans, the Panhandle Water Planning Group has identified that the management ofthe Ogallala Aquifer is the management of an ultimately finite resource. Task 1.3 will allow thePlanning Group to better understand how declining volume in the aquifer may affect waterquality. The impact that declining volume has on water quality may ultimately lead the PlanningGroup to consider alternative conservation strategies. It is highly important for regional plans toconsider not only water volume, but also water quality.
Location o/Task 1.3 in the Report:A. Field Investigation: Section 2.2.3 - Groundwater Dating p.15
Section 3.1 - Recharge Estimates... p.20Section 3.2 - Groundwater Tritium... p.22
Task 1.4 Plan Consistency and Interregional Coordination
Purpose:To conduct coordination activities with Region 0 regarding the findings of the Ogallala rechargestudy. The changed conditions for this area are the reduced availability from the CRMWAregarding total available yeild from the CRMWA system and refined groundwater availability.
Relation to Regional Planning:The Canadian River Municipal Water Authority provides municipal drinking water to 11 citiesthat lie in Region A and Region O. CRMWA has expanded into groundwater in Roberts Countyin order to continue providing services. The effects of this research will be seen in localities inRegion 0 as well as Region A. The 2011 Regional Plans will need to account for the findings ofthis research.
Location o/Task 1.4 in the Report:A. Supplemental document entitled "Plan Consistency and Interregional Coordination".
5
EXECUTIVE SUMMARY
Reliable estimates of recharge are important for assessing and managing groundwater
resources. Declining groundwater resources in the High Plains aquifer of Texas as a result of
large scale pumping make recharge estimation even more critical for this region.
The purpose of this study was to estimate groundwater recharge in the vicinity of Roberts
County. Three basic approaches were used to estimate recharge: (1) chloride mass balance in
groundwater, (2) chloride mass balance in the unsaturated zone, and (3) numerical modeling of
recharge in the unsaturated zone. Groundwater chloride concentrations were used to evaluate
regional recharge rates based on the chloride mass balance approach in Roberts County. A
limited number of groundwater well samples were analyzed for tritium-helium ages to
supplement the regional groundwater chloride mass balance analysis. The chloride mass
balance approach was also applied to the unsaturated zone to provide point recharge estimates
in different land use settings. A total of 19 boreholes were drilled from 2006 through 2008 in
different locations (14 in Roberts and 5 in Hemphill counties) to depths ranging from 18.5 to 88
ft (5.6 to 26.8 m). Natural rangeland represents the dominant land use in these counties and
nine boreholes were located in this setting. Two boreholes were located beneath dryland
agriculture and three boreholes beneath irrigated agriculture. One borehole was drilled in a dry
drainage channel and four boreholes were drilled adjacent to stock impoundments that pond
water in Roberts County. Soil samples were collected in the field for laboratory measurement of
soil physics (water content and matric potential head) and environmental tracers (chloride,
fluoride, nitrate, and sulfate). Groundwater recharge was estimated using the chloride mass
balance or chloride front displacement approach. Groundwater recharge in Roberts County was
also estimated using unsaturated zone modeling based on meteorological data from 1961
through 1990, representative online soils data from SSURGO, and representative vegetation
types. Sensitivity analyses were conducted to estimate maximum recharge based on bare sand
and to evaluate soil texture and vegetation controls on recharge.
Previous studies throughout the central High Plains estimated a regional recharge rate of
0.43 in/yr (11 mm/yr) based on groundwater chloride concentrations (Wood and Sanford, 1995).
This regional estimate was based on chloride concentrations in precipitation (0.58 mg/L) from
wet and dry deposition for 1 yr (1984-1985). Most of the recharge was attributed to focused
recharge beneath playas in the region. However, playa density in Roberts County is extremely
low, with all playas located in the southeastern part of the county where the Blackwater Draw
Formation is found. More detailed analysis of groundwater chloride concentrations in Roberts
6
County and surrounding counties was conducted in this study. Results show that there are
saline plumes in the southern part of Roberts and northern Gray counties and also along the
Canadian River in Roberts and Hemphiil counties. However, a region of low chloride
groundwater (S50 mg/L) in the central part of Roberts County that extends into Hemphill County
was used to provide a lower bound on recharge using the chloride mass balance method.
Chloride input was estimated to be 0.24 mg/L from 20 yr of data on wet deposition from the
National Atmospheric Deposition Program and estimates of dry deposition from chlorine-36
data. This vaiue of chloride input is considered more reliable than the previous estimate used by
Wood and Sanford (1995) which was based on only one year of data. The lower chloride input
results in lower regional recharge estimates by about 50% relative to those from Wood and
Sanford (1995). This study found a median recharge rate of 0.26 in/yr (6.6 mm/yr) for this
region in Roberts County based on groundwater chloride concentrations, with 90% of the log
normal recharge distribution between 0.13 and 0.60 in/yr (3.3 and 15.2 mm/yr). The highest
recharge rates, representing only about 2% of the Roberts County area, range from 0.67 to 0.91
in/yr (17 to 23 mm/yr) and are consistent with high recharge rates ("=0.67 in/yr; "=17 mm/yr)
estimated from an unsaturated zone profile sampled beneath a drainage in Roberts County.
These results indicate that stream drainages in Roberts County may be functioning similarly to
playas in other regions by focusing recharge to the Ogailala aquifer.
Results of tritium-helium age dating analysis indicate that a detectable component of young
water (S50 yr) is only present in two of four wells sampled. All weils are located within
presumably favorable areas as indicated by the regional groundwater chloride distribution
analysis (i.e. low-slope areas within lower-elevation reaches of the drainage network). The
results are consistent with the results from groundwater chloride analysis and indicate that the
volume of recent recharge has generaily not significantly impacted current groundwater storage.
The chloride mass balance approach applied to the unsaturated zone resulted in a range of
recharge estimates for different land use settings. Most of the profiles in rangeland settings (6
out of 9) are generally characterized by large chloride accumulations (peak chloride
concentrations 477 to 2,593 mg/L) corresponding to accumulation times ranging from 3,601 to
19,758 yr. These data indicate that there is essentially no recharge in these regions and that the
profiles have been drying out over these long time periods. Matric potentials are generally low in
these profiles, with mean matric potentials below the root zone ranging from -68 to -108 m.
These low matric potentials generaily support the lack of recharge from the chloride data. Two
of the remaining profiles (one in Roberts County and one in Hemphiil County) have much lower
chloride concentrations (mean 108 and 250 mg/L), indicating low, but measurable, recharge
7
rates of 0.11 and 0.14 in/yr (2.8 and 3.6 mm/yr). These boreholes are located along the breaks
near the Canadian River, where soils are coarser grained. Recharge rates could not be
estimated in the third profile because only cuttings, not cores, were collected. Matric potentials
were measured in two of the three profiles and are slightly higher than others, with mean values
of -38 and -67 m. Lack of recharge in most rangeland profiles is attributed to low permeability
soils and the ability of natural grasslands/shrublands to remove all infiltrated water through
evapotranspiration. Low recharge in two of the rangeland profiles is attributed to their location
along the Canadian breaks and associated coarser soil textures.
Conversion of rangeland to dryland agriculture did not increase recharge below the root
zone in a profile in Roberts County but did increase recharge in a profile in Hemphill County to
0.41 in/yr (10.4 mm/yr). The lack of increased recharge in the Roberts County dryland profile is
attributed to the low permeability soils (Pullman clay loam) in this region. Evidence of increased
recharge in the Hemphill County profile is provided by low chloride concentrations (mean 15
mg/L; peak 26 mg/L).
There is increased recharge under all of the irrigated sites. The chloride bulge has been
displaced to 32.2 ft (9.8 m) depth in an irrigated profile in Roberts County. This site has been
irrigated since the 1950s, -55 yr, resulting in a water velocity of 0.52 ft/yr (0.16 m/yr, assuming
a root zone of -3 ft, (1 m) and a recharge rate of 1.9 in/yr (48 mm/yr) based on an average
water content of 0.30 m3/m3. Recharge in the other irrigated profile in Roberts County is 2.2
in/yr (56 mm/yr), which is based on the chloride mass balance approach because a chloride
front could not be identified. The recharge rate is based on an irrigation application rate of 1.5
ft/yr (0.5 m/yr) and chloride concentration in irrigation water (26 mg/L; well 616651, 1992-2005).
The irrigated profile in Hemphill County is characterized by high chloride concentrations (mean
176 mg/L, peak 1005 mg/L) and high matric potentials (mean -6 m). There is also no
recognizable chloride front in this profile and an irrigation application rate of 1.5 ft/yr (0.5 m/yr)
and measured chloride concentration in a sample of the irrigation water (14.5 mg/L) results in an
estimated recharge rate of 4.5 in/yr (115 mm/yr) for this site.
One borehole was drilled in a dry drainage channel in Roberts County. Extremely low
chloride concentrations (mean 16 mg/L) and very high matric potentials (mean -2 m) indicate
high recharge rates. It is difficult to estimate recharge rates beneath the drainage because we
do not know the chloride input (runon rate and chloride concentration in runon). A lower bound
on the recharge rate of 0.68 in/yr (17 mm/yr) can be estimated by assuming no runon.
Assuming a runon depth of 2 ft/yr (0.6 m/yr) and chloride concentrations in runon water of 1
8
mg/L results in a recharge rate of 3.8 in/yr (96 mm/yr). Increasing runon and chloride in runon
would linearly increase calculated recharge rates.
Four boreholes were drilled beneath or adjacent to three stock impoundments that pond
water frequently. All profiles are characterized by low chloride concentrations and high matric
potentials throughout, indicating high recharge rates. Minimum recharge rates based on
precipitation and chloride in precipitation only ranged from 0.64 to 1.4 in/yr (16 to 36 mm/yr).
Assuming ponded depths of 2 ft/yr (0.6 m/yr) and chloride concentrations in ponded water of 1
mg/L results in recharge rates of 3.4 to 7.3 in/yr (86 to 185 mm/yr). Although recharge rates are
locally high, the areal extent of such ponds is < 1%; therefore, volumetric recharge rates are
low.
Unsaturated zone modeling using bare sand provides a maximum estimate of recharge
that is based on climatic forcing in Roberts County. Simulated mean (30-yr) annual recharge for
bare sand is high, 6.9 in/yr (174 mm/yr), representing 35% of mean (30-yr; 1961-1990) annual
precipitation. Simuiated mean (30-yr) annual, areally averaged recharge for Roberts County is
2.0 in/yr (52 mm/yr) for texturally variable soil profiles, representing 10% of mean annual
precipitation. This recharge rate is 3.4 times lower than that based on the monolithic sand
profile, indicating the importance of soil textural variability in controlling recharge. To assess the
impact of vegetation without the influence of soil textural variability, simulations of recharge
were conducted in vegetated, monolithic sands. Vegetation reduces simulated mean annual
recharge (0.18 in/yr, 4.5 mm/yr; 0.9% of mean annual precipitation) by a factor of 11.4 relative
to recharge for the nonvegetated sands. Texturally variable soils with vegetation are the most
realistic representation of actual conditions and should provide the most reliable recharge
estimates for the different regions. Simulated mean (30-yr) annual, areally averaged recharge is
low, 0.004 in/yr (0.1 mm/yr), and represents 0.02% of mean annual precipitation. However, this
recharge estimate does not incorporate the effects of stream drainages in Roberts County or
increased water input through drainage systems.
The regional recharge rate of 0.26 in/yr (6.6 mm/yr), based on groundwater chloride
concentrations, is probably the most reliable estimate for Roberts County and is similar to
previous regional estimates (0.24 in/yr, 6 mm/yr) for the central High Plains using chloride input
based on long-term data (20 yr from NADP). The groundwater chloride data indicate that stream
drainages in Roberts County and playas in the central High Plains may function similarly,
focusing recharge. Results from unsaturated zone sampling and modeling are consistent with
the regional recharge estimates that are based on groundwater chloride and indicate that there
is little recharge outside of stream drainages or stock impoundments in the region.
9
1.0 INTRODUCTION
Quantifying and understanding controls on groundwater recharge are important for
developing strategies to optimally manage groundwater resources. Groundwater resources are
critical in the High Plains in Texas because of large-scale depletion. The objective of this work
was to estimate recharge in Roberts and Hemphill counties in the central High Plains, using a
variety of approaches including chloride mass balance in groundwater and in the unsaturated
zone and unsaturated zone modeling. Previous studies of recharge in the central High Plains of
Texas provide a regional estimate of recharge of 0.43 in/yr (11 mm/yr) that is based on average
groundwater chloride concentration data iyVood and Sanford, 1995). Estimates of recharge
rates based on unsaturated zone sampling in Carson County range from 2.4 to 4.7 in/yr (60 to
120 mm/yr) beneath playas that are based on tritium concentrations and no recharge in
adjacent interplaya rangeland settings that are based on chloride concentrations (Scanlon and
Goldsmith, 1997). Similar recharge rates (3.0 in/yr; 77 mm/yr) were estimated beneath playas in
the southern High Plains on the basis of the distribution of bornb tritium (Wood and Sanford,
1995). Previous studies in the southern High Plains also show that recharge is related to land
use: in general, there is no recharge in interplaya rangeland settings, higher recharge beneath
dryland agriculture (median 1 in/yr, 24 mm/yr), and variable recharge beneath irrigated sites
(Scanlon et aI., 2005, 2007). Higher recharge beneath dryland agriculture is attributed to
shallower rooting depths of crops relative to perennial grasses and shrubs and to long winter
fallow periods when there is no vegetation (Scanlon et aI., 2007). Information is limited on
recharge beneath irrigated sites because specific data on irrigation water application rates and
chloride concentrations in irrigation water are generally not available. Tritium analyses in two
irrigated soil profiles in Cochran County resulted in recharge rates of 0.67 and 1.26 in/yr (17 and
32 mm/yr) (McMahon et aI., 2006).
This study focuses on recharge in the area of Roberts and Hemphill counties (Fig. 1). The
primary source of groundwater is the High Plains aquifer which consists primarily of the Ogallala
Formation and minor overlying alluvial sediments in this region (Fig. 1). The Blackwater Draw
Formation overlies Ogallala sediments in parts of extreme southern Roberts County and in
counties to the south and west. The dominant land use/land cover in Roberts County is
rangeland (91 %), which consists of grasslands (78%) and shrublands (22%) (Fig. 2). Cultivated
croplands represent 7% of the county area, consisting of dryland (75%) and irrigated (25%)
10
crops. Developed (urban) areas combined with all other land use categories (open water,
wetlands, forest, etc) represent the final 2%.
2.0 METHODS
Recharge is defined as addition of water to an aquifer, generally from precipitation that
infiltrates downward through the unsaturated zone. Unsaturated zone sample analysis results
provide estimates of downward water fluxes (drainage rates) below the root zone; however, in
many cases the water has not reached the water table. If climate, vegetation, and soil conditions
remain the same, we assume that the water fluxes calculated below the root zone (i.e. drainage
rates) will ultimately reach the aquifer and become groundwater recharge. In this report, the
term recharge refers to calculated drainage fluxes below the root zone that will reach the water
table, assuming that current climatic conditions prevail.
Recharge rates in this study are based on (1) the chloride mass balance approach applied
to groundwater and unsaturated zone sample measurements, (2) on the chloride front
displacement method applied to unsaturated zone sample measurements, and (3) on
unsaturated zone modeling results. Additional supporting information is provided by soil physical
parameters in the unsaturated zone and by non-invasive electromagnetic induction surveys.
The methods are described according to saturated zone studies that were based on
groundwater chloride concentrations, unsaturated zone field studies, and unsaturated zone
numerical modeling.
2.1 Meteoric Chloride
Chloride concentrations in groundwater or in unsaturated zone pore water have been widely
used to estimate recharge (Allison and Hughes, 1978; Scanlon, 1991, 2000; Phillips, 1994).
Precipitation contains low concentrations of chloride. Chloride in precipitation and dry fallout is
transported into the unsaturated zone with infiltrating water. Chloride concentrations increase
through the root zone as a result of evapotranspiration because chloride is nonvolatile and is not
removed by evaporation or by plant transpiration. Below the root zone, chloride concentrations
should remain constant if recharge rates have not varied over time. Qualitative estimates of
relative recharge rates can be determined using chloride concentrations in groundwater or
unsaturated zone pore water if precipitation and dry fallout are the only sources of chloride to
the subsurface. In this case, chloride concentrations are inversely related to recharge rates: low
chloride concentrations indicate high recharge rates because chloride is flushed out of the
system, whereas high chloride concentrations indicate low recharge rates because chloride
11
accumulates as a result of evapotranspiration. For example, low chloride concentrations
beneath playas in the central and southern High Plains indicate high recharge, whereas high
chloride concentrations in natural interplaya settings indicate low recharge (Scanlon and
Goldsmith, 1997; Scanlon et aI., 2007). The chloride mass balance (CMB) approach can be
applied to chloride concentrations in groundwater:
PClpPClp = RCIgw, R = -- (1)
Clgo,
which balances chloride input (precipitation, P, times the chloride concentration in
precipitation and dry fallout, C/p) with chloride output (recharge rate, R, times chloride
concentration in groundwater C/gw). The CMB approach can similarly be applied to unsaturated
zone pore water:
(2)PClp + ICI, = RCI""R = PClp + ICII
CI",
where chloride concentration in unsaturated zone pore water (Cluz) replaces Clgw and
includes an additional term to account for irrigation (I) and chloride concentration in irrigation
water (CI,) where applicable. The age of pore water at any depth in the unsaturated zone can
also be estimated by dividing cumulative total mass of chloride from the surface to that depth by
the chloride input rate.
Recharge rates can also be estimated using the chloride front displacement (CFD) method
at sites with insufficient data to apply the CMB approach (Walker et aI., 1991). Large chloride
bulges that accumulated under rangeland conditions are displaced downward by increased
recharge rates following land use conversion to cultivation (Scanlon et aI., 2005). The transition
from low chloride concentrations at shallower depths (typical of cultivated areas) to higher
chloride concentrations at greater depths (typical of rangeland areas) forms a chloride front at
sites where rangeland was converted to cultivated land. Recharge is estimated from the velocity
(v) of the (downward) chloride front displacement:
R=fJv=ez,-z,t2-t,
(3)
where eis average volumetric water content over the displacement depth interval and ZI and
Z2 are depths of the chloride front corresponding to times t1 and t2 related to new (dryland or
irrigated) and old (rangeland) land uses.
12
2.1.1 Data Sources
Average annual precipitation was estimated spatially by interpoiation of data from the
National Climate Data Center (NCDC) using the period-of-record means for 1,397 weather
stations in Texas and surrounding states (www.ncdc.noaa.gov). The period of record for all
stations ranges from 30 to 149 yr and from 41 to 74 yr for the 17 stations in the nine-county area
centered on Roberts County. Mean annual total precipitation in the nine-county area shows an
eastward to southeastward increasing trend ranging from -19.7 in/yr (500 mm/yr) in the west to
-23.6 in/yr (600 mm/yr) in the east, with values approaching 27.6 in/yr (700 mm/yr) near
Mclean in southeast Gray County (Fig. 3). Precipitation in Roberts County ranges from -20.9
in/yr (530 mm/yr) in the northwest to -23.2 in/yr (590 mm/yr) in the southeast and averages
about 22.4 in/yr (570 mm/yr).
Average annual net chloride input was estimated spatially from chloride concentrations in
precipitation measured by the National Atmospheric Deposition Program (NADP) at 190
monitoring locations in the US (http://nadp.sws.uiuc.edu/). Monitoring began at most sites in
1982. The closest monitoring location is approximately 70 mi NE of Roberts County at the
Goodwell Research Station in Texas County, OK. There are seven additional monitoring
locations within 200 mi of Roberts County. Chloride concentrations reported by NADP represent
wet deposition only and do not include dry deposition. To account for dry deposition, chloride
concentrations were increased by a factor of two, as suggested by previous work in this region
(Scanlon and Goldsmith, 1997). Resultant chloride concentrations exhibit a southeastward
increase in concentration ranging from 0.22 mg/l in Hansford County to 0.28 mg/l in Wheeler
County, and a mean of 0.24 mg/l in Roberts County (Fig. 4).
Groundwater chloride concentrations were obtained from the Texas Water Development
Board database (www.twdb.state.tx.us). A total of 422 analyses of groundwater chloride
concentrations representing samples from 1947 through 2006 (mean 1983) were used in the
analysis (Fig. 5).
Other information required for various aspects of the analysis and interpretation of recharge
in Roberts County included maps of the Ogallala water table elevations and aquifer base
elevations obtained from Houston et al. (2003), detailed soil clay content map (1.5-2.0 m depth)
compiled from county survey data from the State Soil Geographic (SSURGO) database
(http://soils.usda.gov/survey/geography/ssurgo/), and a digital elevation model (OEM) map of
ground surface elevations and other surface feature maps (http://www.tnris.state.tx.us/).
13
2.2 Field Methods
Results of the field study rely primarily on analytical results of soil and sub-soil core
samples. Noninvasive electromagnetic induction measurements were also obtained at many
borehole locations to evaluate local spatial variability at a given borehole location and for
comparison among borehole locations within and between different land use settings.
2.2.1 Soil Cores
Core samples were obtained at 19 locations in the central High Plains (Roberts and
Hemphill counties) using a track-mounted, direct push drilling rig (Model 6620DT, Geoprobe,
Salina, KS) without any drilling fluid (Fig. 1, Table 1). Boreholes are designated on the basis of
abbreviated county name, year sampled, and sequence number. For example, ROB07-02 is
Roberts County, 2007, borehole no. 2. Cores were obtained in different land use settings: nine
in rangeland (grassland/shrubland), two in nonirrigated (dryland) agriculture (cropland), three in
irrigated agriculture, one beneath a dry drainage channel, and four beneath stock
impoundments (Fig. 1). Rangeland sites are vegetated with grasses and sparse shrubs.
Irrigation began in the 1950s at both sites in Roberts County and in the 1970s at the Hemphill
irrigated site.
Continuous cores were obtained using core tubes (4.0 ft. [1.22 m] long, 1.1 inch [29 mm]
inside diameter) from the ground surface to depths ranging from 18.5 to 88 ft (5.6 to 26.8 m).
Core sample tubes were cut into various lengths, capped and sealed to prevent evaporative
loss, and kept in cold storage. Two boreholes were drilled in Roberts County using a
commercial drilling rig with air-rotary technology. Samples consisting of cuttings circulated to the
ground surface using forced air pressure were collected from these two boreholes. One of the
air-rotary boreholes was drilled at the same location as borehole ROB06-02 (Fig. 1) in an
attempt to obtain samples from greater depth. This air-rotary drilling approach could not drill
deeper than the Geoprobe; therefore, the air-rotary samples for this borehole were not
analyzed.
2.2.2 Electromagnetic Induction
Noninvasive measurements of near-surface apparent electrical conductivity (EG.) were
performed at 16 borehole locations using an EM31 instrument (Geonics, Mississaugua, ON).
The EM31 has a nominal depth of investigation of 20 ft (6.1 m) when operated in the vertical
dipole mode, as in this study. Survey measurements were obtained at nominal 10-ft (3-m)
intervals along transects up to 200-ft (61-m) in length at various compass orientations,
14
depending on site characteristics. Where possible, two transect lines were oriented at - 90°
centered on the borehole location. Instrument readings in the vertical dipole mode were
obtained at each point.
Electromagnetic (EM) induction instruments measure a depth-weighted average of the
electrical conductivity of the soil, termed apparent electrical conductivity (EGa). Apparent
electrical conductivity of the subsurface varies with clay content, water content, salinity, and
temperature. The theoretical basis for EM induction measurements was described by McNeill
(1992). Rhoades et al. (1989) developed a linear model to describe subsurface variations in EGa
that generally applies to solution conductivities s: 400 mS/m:
ECa =ECwBT+EC, (4)
where EGw is pore water conductivity, e is volumetric water content, ~ is tortuosity, and EGs is
surface conductance of the sediment (Rhoades et aI., 1976). This model applies when water
content is above a certain threshold value. Laboratory studies show that threshold water
contents range from 0.05 m3/m 3 for sand to 0.12 m3/m3 for clay (Rhoades et aI., 1976). Below
this threshold water content, EGw is 0 and EGa is controlled by surface conductance (EGs),
which is primarily determined by the cation exchange capacity of the clays. Measurements from
EM surveys conducted in west Texas, which were related to variations in soil texture, salinity,
and water flux in different regions, were useful in interpolating between borehole measurements
(Scanlon et aI., 1999). Temporal variability in water content was monitored using EM induction
calibrated using neutron probe monitoring at another site in west Texas (Reedy and Scanlon,
2003).
2.2.3 Groundwater Tritium-Helium Age Dating
The tritium-helium ('HIHe) age-dating method is reliable in providing ages for the
component of sampled groundwater that has recharged an aquifer following the onset of
atmospheric thermonuclear bomb testing during the 1950s and utilizes measurements of the
isotopic ratio of tritium, 3H, to that of its daughter product, 3He. Historical tracers or event
markers, such as bomb-pulse tritium have been used widely in the past to estimate recharge
(Egboka et aI., 1983; Robertson and Cherry, 1989). Tritium is used to trace water movement
because it is part of the water molecule. Tritium is a radioactive isotope of hydrogen with a half
life of 12.32 yr. Tritium occurs naturally in the atmosphere and enters the subsurface primarily
through precipitation. Tritium fallout increased as a result of atmospheric nuclear testing that
began in the early 1950s and peaked in 1963. The presence of bomb pulse tritium in
groundwater indicates that a component of the groundwater is young « - 50 yr old). Bomb-
15
(5)
pulse tritium concentrations have been greatly reduced as a result of radioactive decay;
therefore, the use of tritium to date groundwater is generally being replaced by the use of
3HJHe. Tritium and (tritiogenic) 3He combined behave as a non-decaying tracer and the ratio of
3H to 3He can be used to estimate the age of the groundwater (age being defined as the time
since water entered the saturated zone) by:
1I[1 3 He"" ]t =- - n + --;:--"'''--1, 3H
where A. is the decay constant (In 2//1/2; 0.05626), /112 is the 3H half life (12.32 yr), and 3Hetrit is
tritiogenic 3He. Use of this equation assumes that the system is closed (does not allow 3He to
escape) and is characterized by piston flow (no hydrodynamic dispersion). The method involves
determining the concentration of tritium in water as well as precise measurements of dissolved
atmospheric and noble gas concentrations, including N2, 3H, 4He, and 2°Ne to differentiate non
tritogenic helium sources, including the radioactive decay of UlTh present in sediments and
from excess air entrained during recharge.
Four wells, three located in Roberts County and one in Hutchinson County, were sampled
for 3HI'He age-dating in early March 2009. Wells were selected based on availability and on
location generally within or near lower elevation drainage areas. Samples were collected in 3/8
inch ID copper tubing approximately 0.5 m in length and were sealed under pressure from the
well pump. The samples were analyzed at the University of Utah Dissolved and Noble Gas
Laboratory.
2.3 Laboratory Methods
Chemical parameters included anions in water leached from 351 core samples (70 from
2006, 236 from 2007, and 45 from 2008) from the unsaturated zone. The primary anion of
interest in this study was chloride, which is used to estimate rate of water movement through the
unsaturated zone using the chloride mass balance approach. The pore water was also analyzed
for nitrate, sulfate, and fluoride. Approximately 40 mL of double deionized water (~18.2 MOhm)
was added to about 25 g of moist soil. The mixture was placed in a reciprocal shaker for 4 hr
and then centrifuged at 7,000 rpm for 20 minutes. The resulting supernatant was filtered to 0.2
).1m and was analyzed for anion concentrations using ion chromatography at the Bureau of
Economic Geology. Soil samples were then oven dried at 105°C for 48 hr to determine
gravimetric water content.
16
Anion concentrations in the supernatant were converted to pore water concentrations by
dividing by gravimetric water content and multiplying by density of pore water, assumed to be
1.00 Mg/m3. Concentrations are expressed as milligrams of ion per liter of pore water.
Soil sampies were also anaiyzed in the laboratory for pressure head to determine direction
of water flow in the soil. The term pressure head is generally equivalent to the term matric
potential, which refers to potential energy associated with the soil matrix. Matric potentiais 2:
26.2 ft (-8 m) were measured using tensiometers (Model T5, UMH, Munich), whereas matric
potentials 5-26.2 ft (-8 m) were measured using a dew-point potentiometer (Model WP4-T,
Decagon Devices Inc., Pullman, WA).
2.4 Unsaturated Zone Modeling
The method used to model the water balance of Roberts County is based on a study by
Keese et al. (2005). Unsaturated flow modeling is used to simulate drainage below the root
zone, which is equated to groundwater recharge. The code UNSAT-H (Version 3.0; Fayer,
2000) is a one-dimensional, finite difference code that simulates nonisothermal liquid flow and
vapor diffusion in response to meteorological forcing. Simulations focus on the water balance:
D=P-ET-Ro -/',S (6)
(7)
where 0 is deep drainage below the root zone, P is precipitation, ET is evapotranspiration, Ro is
surface runoff, and LIS is change in water storage. UNSAT-H simulates subsurface water flow
using Richards' equation:
8e =_ 8q =~((K(e)8H)-s=~((K(ef!!.--K(e»)-S(z,t)8t 8z 8z 8z 8z 8z
where e is volumetric water content, q is water flux, K is hydraulic conductivity, H is hydraulic
head, h is matric potential head, and S is a sink term used to describe removal of water by
plants.
Input data requirements for the model include meteorological forcing, vegetation
parameters, hydraulic parameters for different soil types, and initial conditions. Meteorological
data were obtained from the database in the GEM code (Hanson et aI., 1994). The 1961-1990
period was chosen because solar radiation data, needed for potential evapotranspiration
calculations, are available for this period from the National Solar Radiation Data Base (National
Renewable Energy Laboratory, 1992). Meteorological input to the model included daily
precipitation, daily average dew-point temperature and wind speed, total daily solar radiation,
and minimum and maximum daily temperatures. Meteorological data from the Amarillo
17
International Airport was used in this study because it is the location nearest to Roberts County
for which this information was available.
Distribution of vegetation types was obtained from a GIS coverage of vegetation in Texas
(McMahon et aI., 1984). Roberts County consisted of three different vegetation types:
shrub/grassland (shrub), cottonwood-hackberry-saltcedar brush/woods (brush), and crops. The
distribution of crops within Roberts County was determined from the National Agricultural
Statistics Survey (U.S. Department of Agriculture, variable); the dominant summer crop,
sorghum, was modeled. Vegetation parameters required for UNSAT-H include percent bare
area, planting and harvesting dates for crops, time series of leaf area index (LAI) and rooting
depth (RD), and root-length density (RLD). These parameters for shrubs and brush were
obtained from Keese et al. (2005) and were primarily determined from the literature. Information
on sorghum, including sowing and harvesting dates, rooting depth, and leaf area index were
obtained from Louis Baumhardt (USDA, Agricultural Research Service, Bushland, Texas, pers.
comm., 2008) and Thomas Marek (Texas A&M AgriLife Research and Extension Service,
Amarillo, Texas, pers. comm., 2008). Time series for LAI and root growth were specified on
particular days of the year and linearly interpolated. Root growth was simulated for crops only;
other plant types were modeled as perennial, with a constant rooting depth. The RLD function is
based on the assumption that normalized total root biomass is related directly to RLD (PrL) and
can be related to depth below the surface (z) by:
(8)
where a, b, and c are coefficients that optimize fit to normalized biomass data. Dominant
vegetation types that represented -70-80% of the area of each region were simulated.
The Soil Survey Geographic (SSURGO) database (version 2) at a scale of 1:24,000 (USDA,
1995) is available online and includes the following attributes: clay content, organic material, soil
water capacity, permeability, infiltration, drainage, slope, and soil water retention data at -10.8
and -492 ft (-3.3 and -150 m) matric potential head. Pedotransfer functions were used to
determine soil hydraulic properties using data from the SSURGO database. Rosetta software
uses neural network programming and a database of measured texture, water retention, and
saturated hydraulic conductivity to provide estimates of van Genuchten water-retention
parameters and saturated hydraulic conductivity for input to unsaturated flow models (Schaap et
al.,2001).
Simulations were run for 25 soil profiles that represent -80% of the Roberts County area.
Examination of results for all profiles showed that recharge rates could be categorized into
distinct groups, resulting in a more manageable number of representative profiles (4).
18
A soil-profile depth of 16 ft (5 m) was chosen for the simulations because rooting depths of
vegetation types used in this study are < 16 ft (5 m) deep. In addition, SSURGO soil textural
information is available only for the upper 6.6 ft (2 m). Texture in the 6.6 to 16 ft (2 to 5m) zone
was assumed equal to that of the lowest data available. Once water drains below the root zone,
there is little chance of it being drawn upward again. Thus, modeled drainage below the 16 ft (5
m) soil profile can be used as an estimate of groundwater recharge. Sensitivity of simulated
recharge to profile depth was evaluated.
In UNSAT-H, node spacing can be adjusted to decrease computing time (fewer nodes) or to
increase accuracy at input, output, and layer boundaries (more nodes). In monolithic profiles,
nodal spacing ranged from 0.08 in (2 mm) at the top and base of the profile and increased by a
factor of -1.2 with depth to a maximum value of 9.1 in (230 mm) within the profile. In layered
soil profiles, nodal spacing was also reduced near textural interfaces to a value of -0.8 in (20
mm).
UNSAT-H requires an initial matric potential profile for the soil column being modeled. Initial
conditions were set arbitrarily at a matric-potential head of -33 ft. (10m). The impact of initial
conditions on simulation results was evaluated by reinitializing simulations multiple times with
the final conditions of each run; however, rerunning simulations once was found to be sufficient
for minimizing the impact of initial conditions.
The lower boundary condition most appropriate for simulating unimpeded recharge is the
unit gradient lower boundary condition which corresponds to free drainage or gravitational flow.
The water balance for a 30-yr period (1961-1990) was simulated for Roberts County. To
assess the relative importance of different controls on groundwater recharge, four different
scenarios were simulated:
1. nonvegetated, monolithic sand
2. nonvegetated, texturally variable soil
3. vegetated, monolithic sand
4. vegetated, texturally variable soil
The simplest simulations of nonvegetated, monolithic sand were used to provide an upper
bound on recharge rates. Complex, texturally variable soil profiles were simulated without
vegetation to evaluate the impact of soil textural variability on recharge. Vegetation was added
to the monolithic and texturally variable soil profiles to determine its impact on simulated
recharge. The most realistic scenario is represented by vegetated, texturally variable soils.
Simulated recharge results are represented by a single temporal (30-yr) and spatial average
recharge value for each region, using GIS coverages to determine the area represented by
19
each vegetation type, soil type, or combination of vegetation and soil types to spatially weight 1
D results. Thirty-eight simulations were conducted for the final analysis.
3.0 RESULTS AND DISCUSSION
3.1 Recharge Estimates Based on Groundwater Chloride Data
Groundwater chloride concentrations were mapped to evaluate regional trends that may be
related to cross-formational flow of elevated salinity groundwater from formations underlying the
Ogallala (Fig. 5). The chloride concentration map was generated using local polynomial
methods in ArcMap GIS. Kriging methods, which used a directional variogram based on the
study area data set produced a map with very similar overall appearance, but failed to capture
subtle but significant features of the groundwater chloride spatial distribution in Roberts County.
Chloride plumes (defined arbitrarily as areas where chloride concentrations are;;:: 50 mg/L) are
found in several regions of the study area, with concentrations averaging -150 mg/L and
ranging up to 1580 mg/L. Plumes located near the southern boundary of Roberts County
(southern plume) and along the Canadian River in Roberts County (river plume) are significant
for this study. The presence of saline groundwater in the southern plume area was first reported
by local residents as early as 1926 (Long, 1961) and was mapped by McAdoo et al. (1964) and
Knowles et al. (1984). Mehta et al. (2000) determined that the shape of the southern plume had
not changed significantly since 1964, and was considered to exist in a quasi-steady state.
The mechanism of groundwater salinization in this region was speculated by Dutton (1989)
to be related to:
1) cross-formational discharge of brines formed by dissolution of underlying Permian
evaporites,
2) infiltration from brine pits associated with oil and gas pits, and/or
3) upward movement from poorly plugged oil and gas wells.
Mehta et al. (2000a) concluded that the geochemical signature of the plume water did not
support an oil-field origin because of differences in sulfate concentrations and degree of stable
isotope enrichment. Salinization was attributed to topographically driven flow of the Middle/Late
Wisonsinan (30-20 ka) recharged water mixed with salt-dissolution zone water in the upper part
of the underlying evaporite confining unit (Whitehorse Group) (Mehta et aI., 2000b). Cross
formational paleowater discharge is primarily controlled by aquifer geometry, and occurs along
the down gradient (northeast) side of the structurally high Amarillo Uplift and through
preferential flow paths such as fractures and joints created as a result of salt dissolution (Fig. 5).
20
The river plume results from upwelling of higher salinity paleowater along deep flow paths
through underlying formations that mixes with Ogallala water before discharging to the
Canadian River.
An analysis of recharge rates using the CMS approach was applied to the interpolated
groundwater chloride concentration distribution in Roberts County (Fig. 5). Only chloride values
:;; 50 mg/L (-74% of the county area) were included in the analysis and were assumed not to be
significantly influenced by plume water. Using a county-wide mean total precipitation rate of
22.4 in/yr (570 mm/yr) (Fig. 3) and an annual mean chloride concentration in precipitation of
0.24 mg/L (Fig. 4), results indicate a median recharge rate of 0.26 in/yr (6.6 mm/yr), with 90%
of the (log-normal) recharge rate distribution between 0.13 and 0.60 in/yr (3.2 and 15.2 mm/yr).
The highest recharge rates, representing only about 2% of the Roberts County area, range from
0.67 to 0.91 in/yr (17 to 23 mm/yr).
Interpretation of the groundwater chloride distribution in Roberts County requires an
integrated understanding of groundwater flow and surface hydrology. A map of water table
elevations indicates that groundwater flow in Roberts County is generally northwest in the south
part of the county, curving gradually northward to discharge along the Canadian River (Fig. 6).
Groundwater flow paths in Roberts County south of the Canadian River originate almost
completely in the region of the southern plume, yet the groundwater chloride concentrations
decrease in the central region of the county south of the river plume. The decrease in
concentration along flow paths in Roberts County could be caused by dilution resulting from
recharge and dispersion or it could simply be an artifact of sampling bias (I.e., groundwater
samples from wells that only partly penetrate the aquifer saturated thickness and thus sample
only shallower water potentially having lower salinity). Mehta et aI., (2000a) found that total
dissolved solids (TDS) increased with depth in a limited number of sampled wells. To test for
sampling bias due to stratification, a subset (49 points) of the Roberts County groundwater
sample data for which well depth information is available was used. Well depth was compared
to a base-of-aquifer elevation map (Houston et aI., 2003) and depth to water table
measurements from the TWDS database. A penetration factor, P" representing the apparent
percentage of aquifer sampled, was calculated for each well as
PJ
EWT-ERJV x 100% (8)EWT-EBA
where Ewr is water table elevation, EBW is bottom-of-well elevation, and EBA is base-of-aquifer
elevation. Values of P, were regressed on groundwater chloride concentrations (Fig. 7). Results
indicate that there is generally very poor correlation between P, and chloride (r = 0.36).
21
Eliminating questionable data points (10 wells with either < 10ft [3 m] of water or P, > 1) results
in a marginal increase in the correlation (r = 0.41). Although salinity stratification may occur
locally, evidence that salinity stratification is pervasive is not compelling, and groundwater
samples in Roberts County appear to be generally representative of spatial chloride
concentrations.
Spatial distribution of chloride concentrations was also compared with soil clay distribution
(Fig. 8). Two regions of elevated chloride concentration (-25 to 50 mg/L) extend as fingers
down-gradient and generally along flow lines away from the south plume; one extends generally
northward from south-central Roberts County and a second extends generally northeastward
from northeastern Gray County across Hemphill County (Figs. 5 and 8). These fingers coincide
generally with areas where clay content is higher than that of surrounding areas that also tend
to be where surface elevation is higher than surrounding areas (Fig. 9). Conversely, areas of
lower chloride concentrations tend to be centered near drainage areas, particularly in areas
where the drainage channels are wide with small «2%) slope (Fig. 10). This relationship is
obscured in the lowest drainage reaches by the river plume. Approximately 900 mi (1450 km) of
drainage channels are in Roberts County, as defined on USGS 7.5-min quadrangle maps (not
including the Canadian River). Lower reaches of major stream drainages south of the Canadian
river, where surface slopes are :;;2%, represent about 2.6% (24 mi2) of the county area.
Given the totality of evidence, a conceptual model of recharge in Roberts County can be
developed. Chloride concentrations in Ogallala groundwater are affected by cross-formational
flow from underlying units having elevated salinity, complicating application of the chloride mass
balance method. Apparent stability of the southern plume, presence of lower chloride
concentration groundwater down gradient from the southern plume, and lack of significant
evidence of sampling bias indicate that recharge must be occurring. Spatial distribution of
groundwater chloride concentrations down gradient from the southern plume indicates that
recharge is most likely focused primarily in the lower reaches of drainage areas where drainage
from steeper-sloped upper reaches of the drainage networks has coalesced and sufficient runoff
is focused to allow deep infiltration below the root zone. Lower reaches of the drainage
networks tend to have wider channels, coarser textured soils, and gentler slopes, all of which
would enhance recharge, relative to their upper reaches.
3.2 Groundwater Tritium-Helium Age-Dating Results
The results of the 3HI'He sample analysis indicate that only two of the four wells sampled
have a component of water that has recharged within the past 50 yr, while the remaining two
22
samples no component of water that is younger than 50 yr (Table 2). The Gill well (map
reference 4) displays the youngest component with an estimated age of about 30 yr and is
located in the lowest groundwater chloride concentration region in Roberts County beneath the
Red Deer Creek drainage in the southeast corner of the county (Fig. 5). The Duncan well (map
reference 3), located in eastern Hutchinson County, has a component of water with about a 50
yr age. Both the Pickens and Morton wells (map reference 1 and 2, respectively), located in
west-central Roberts County within the lower reaches of different drainages about 5 miles south
of the Canadian River, have no measureable component of water younger than 50 yr.
These results are generally consistent with groundwater chloride mass balance results in
that younger water tends to be associated with lower chloride concentrations (indicating higher
recharge rates) while older water tends to be associated with higher chloride concentrations
(indicating lower recharge rates). Results highlight that though the sampled wells are
presumably located in areas most favorable to recharge, that there is very little recent recharge.
3.3 Recharge Estimates Based on Unsaturated Zone Field Studies
3.3.1 Rangeland Setting
General soil texture information for different profiles was estimated from SSURGO data
(USDA-NRCS, 2007) (Fig.8). Most of the profile soils at the rangeland sites have moderate clay
contents (mean clay content in the upper 2 m of 25 to 33%) with the exception of HEM07-02,
located on the breaks near the Canadian River in Hemphill County which contains only 18%
clay (Table 3, Figs. 11 and 12). Rangeland profiles have variable water contents. Three of the 5
rangeland profiles in Roberts County for which measurements are available have high mean
water contents (0.20 to 0.24 m3tm3) whereas the other two profiles have low mean water
contents (0.06 to 0.09 m3tm3) (Table 3, Figs. 11 and 12). One of the profiles in Roberts County
was drilled with air rotary and only cuttings were available; therefore, water content or recharge
rates could not be calculated for this profile. Rangeland profiles in Hemphill County also have
variable water contents, ranging from 0.06 to 0.22 m3tma Mean water content below the root
zone in rangeland profiles is moderately correlated with SSURGO soil texture (r=0.58),
indicating that average surface soil clay content is a controlling factor in deeper profile water
content.
Apparent electrical conductivity (EGa) values measured using the EM 31 meter near
rangeland profiles are generally correlated with mean water contents (r=0.89). EGa varies with
water content, soil texture, salinity, and temperature. Relationships between EGa and water
23
content also reflect soil textural effect on water content and EGa. Generally low EGa values are
found in drier sediments that are coarser grained whereas higher EGa values are found in wetter
sediments that are associated with more clay-rich sediments.
Matric potentials are low in rangeland sites (mean -38 to -117 m). Variations in matric
potential do not seem to be related directly to water content variability.
Chloride concentrations in rangeland profiles are generally high (Table 3, Figs. 11 and 12).
Mean chloride concentrations in rangeland profiles range from 161 to 1,115 mg/L in profiles with
high water content (0.14 to 0.24 m3/m 3). These profiles generally have low chloride
concentrations in the upper 3 ft (1 m), with the exception of profile ROS07-07 which has low
chloride concentrations to a depth of 14.1 ft (4.3 m). Depth of chloride flushing in this profile may
reflect local runon, although this was not obvious from the local topography. Peak chloride
concentrations in profiles with high mean chloride concentrations range from 477 to 2593 mg/L
(6 to 24 ft; 1.8 to 7.3 m depth) (Table 3, Fig. 11). These large chloride accumulations require
3,747 to 19,758 yr to accumulate, indicating that soils in these settings have been drying out
over these time periods. There has been no recharge in these settings over these time periods.
Profiles with lower mean chloride concentrations (49 and 78 mg/L) correspond to lower mean
water contents (0.06 m3/m 3) and coarser textured soils near the Canadian breaks. Estimated
mean water fluxes below the root zone in these profiles range from 0.11 to 0.14 in/yr (2.8 to 3.6
mm/yr) (Table 3, Fig. 12). Higher water fluxes are attributed to generally coarser textured soils.
Concentrations of other ions, including nitrate, sulfate, and fluoride are variable (Table 4,
Figs. 17 and 18). Concentrations of nitrate-N are generally low (median 1.5 mg NOs-NIL; range
0.8 to 9.5). The only profile with moderately high nitrate-N concentrations is ROS06-02 with a
mean nitrate-N concentration of 9.5 mg/L and peak concentration of 32 mg NOs-NIL at 20.3 ft
(6.2 m) depth. Higher nitrate concentrations in this profile are attributed to low water contents
and coarse textured soils, because nitrate concentrations on a mass basis are low in this profile,
similar to those in other rangeland profiles.
Sulfate profiles are quite variable, with mean concentrations ranging from 174 to 3,647 mg/L
and peak concentrations of 459 to 11,738 mg/L. Peak sulfate concentrations are so high in
some profiles that they suggest a lithogenic source, such as gypsum and/or anhydrite. Lower
concentrations (peaks <1,000 mg/L) may be derived from precipitation and dry fallout, similar to
chloride. Correlations between sulfate and chloride are variable (r=0.48 to 0.90). High
correlations may reflect similar processes affecting the two ions, such as evapotranspirative
enrichment, regardless of the source. Peak chloride and sulfate peaks are also coincident in
some profiles (ROS07-06 and HEM07-04).
24
Fluoride profiles are variable, with mean concentrations from 3 to 129 mg/l and peak
concentrations that range from 16 to 459 mg/l at depths of 1.2 to 7.1 m. Fluoride peaks in most
profiles are found in the shallow subsurface (5 profiles :s; 1.8 m; 3 profiles 3.0, 3.7, and 7.1 m).
Fluoride may be derived partly from precipitation and dry fallout. Although information on
fluoride concentrations in precipitation is limited, existing data indicate that concentrations are
generally low (Edmunds and Smedley, 2005). Fluoride may also be derived from dissolution of
fluorite andlor apatite. Regardless of source, peak fluoride concentrations may be related to
evapotranspirative enrichment near the root zone. Profiles with deeper peaks may be related
primarily to a lithogenic source.
3.3.2 Dryland Setting
Only two boreholes were drilled in dryland agricultural settings, one in Roberts County and
one in Hemphill County. The Roberts County profile is in fine-grained sediments (mean clay
content 43%) whereas the profile in Hemphill County is in coarser textured soils (mean clay
content 29%) (Table 3, Fig. 13). The difference in mean water content below the root zone at
the two sites (Roberts County: 0.21 m3/m 3, Hemphill County: 0.10 m3/m 3
) reflects the difference
in soil texture. Apparent electrical conductivity (EGa) measured using the EM31 meter at the
Roberts site is moderately high (median 55 mS/m).
Matric potential profiles are generally low (-213 and -338 ft; -65 and -103 m). These values
are similar to those found in rangeland profiles.
Chloride profiles at the two dryland sites are quite different. High chloride concentrations in
the Roberts County site (mean 417 mg/l, peak 1,295 mg/l at 9.8 ft [3.0 m] depth) are similar to
the rangeland profiles and represent 10,867 yr of accumulation (Table 3, Fig. 13). This large
chloride accumulation represents long-term drying over this time period and indicates that there
has been no recharge in this region. The lack of impact of cultivation on recharge at this site
may reflect high clay content of the soils in this region. The profile in Hemphill County has low
chloride concentrations between the root zone and a depth of 18 ft (5.5 m) (mean 15 mg/l,
range 7 to 26 mg/l). Calculated mean water flux for this zone is 0.41 in/yr (10.4 mm/yr) (Table
3). The time represented by chloride in this section of the profile is 87 yr, which generally
corresponds to the time since cultivation began at this site (early 1900s). At depths <:18 ft (5.5
m) chloride concentrations increase to 152 mg/l, which may reflect buildup of chloride under
rangeland settings that is mobilized by higher water fluxes under dryland agriculture. The profile
is not sufficiently deep (31 ft, 9.4 m) to show much of the rangeland chloride.
25
Concentrations of nitrate, sulfate, and fiuoride are variable (Fig. 19). Concentrations of
nitrate-N are generaliy iow in both profiles beiow the root zone (mean 5.5 and 5.7 mg N03-NIl).
Highest nitrate-N concentrations in the Hemphili County profile are restricted to the root zone
(peak 133 mg N03-NIl, depth 0.08 m), which is accessibie to crop roots.
Suifate concentrations are high in the Roberts County dryland profile (peak 3,427 mg/l at
1.5 m depth) and much lower in the Hemphili County profile (peak 399 mg/l at 1.3 m depth).
These variations in sulfate concentrations are consistent with chloride concentrations, which are
also much higher in the Roberts County profile than in the Hemphili County profile. High sulfate
concentrations in the Hemphili County profile are found in the chloride flushed zone, indicating
that sulfate is much less readily mobilized by increased drainage beneath dryland agriculture
relative to chloride.
Fluoride concentrations are higher in the Hemphill County profile (mean 78 mg/l, peak 120
mg/l at 5.0 m depth) than in the Roberts County profile (mean 20 mg/l, peak 26 mg/l at 7.3 m).
Fluoride concentrations within the chloride flushed zone in Hemphill County indicate that
fluoride, like sulfate, has not been mobilized as effectively as chloride by the change in land use.
3.3.3 Irrigated Setting
A total of three boreholes were drilled in irrigated sites (two in Roberts County and one in
Hemphill County) (Fig. 1). Soil textures at the Roberts County profiles are 25 and 43% clay and
the Hemphili profile is much lower, with only 13% clay (Table 3). Mean water contents are low at
one of the irrigated sites in Roberts County (0.14 m3/m3) and at the Hemphill County irrigated
site (0.14 m3/m\ but are much higher at the other irrigated site in Roberts County (0.30 m3/m 3)
(Table 3, Fig. 14). Median EGa values measured using the EM31 meter vary with water content
and are much higher (76 mS/m) for the Roberts County profile, which has high water content
than for the other two irrigated profiles with lower water content (16 and 18 mS/m).
Matric potentials are uniformly high below the root zone in ali irrigated profiles, with mean
values ranging from -6 to -10 m, indicating wet conditions (Table 3, Fig. 14). Matric potential is a
much more accurate indicator of wet conditions than water content because soil water content
varies with soil texture.
Chloride profiles are variable in irrigated settings (Table 3, Fig. 14). Chloride concentrations
in the ROB06-01 profile are moderately high and variable with depth (mean 263 mg/l, range 69
to 527 mg/l). Estimated drainage for this site is 2.2 in/yr (56 mm/yr) using the chloride mass
balance approach (equation 2), with an irrigation application rate of 1.5 ft/yr (0.5 m/yr) (meter
no. 01-08-2010N; 2002-2004), and chloride concentration in irrigation water of 26 mg/l (weli
26
616651, 9 yr, 1992-2005) (Table 3). The chloride profile beneath the other irrigated site in
Roberts County (ROB07-02) has low concentrations in the upper 32 ft (9.8 m) (86 to 264 mg/L),
underlain by a zone of high chloride with a peak concentration of 1,140 mg/L at 44 ft (13.4 m)
depth (Fig. 6). The upper 32 ft (9.8 m) zone corresponds to the depth interval impacted by
irrigation return flow. High chloride concentrations below this zone are attributed to chloride
accumulation under previous rangeland conditions; this chloride bulge represents -8,750 yr of
accumulation. The profile is not deep enough to sample the entire chloride profile that
developed under rangeland conditions. Water flux can be calculated using the chloride front
displacement method (equation 2), which is based on downward displacement of the chloride
front from 3 ft (1 m, base of root zone in typical rangeland profiles) to 32 ft (9.8 m) (distance 29
ft, 8.8 m) over -55 yr irrigation time. This calculation results in a velocity of 0.53 ftIyr (0.16 m/yr)
and a recharge rate of 1.9 in/yr (48 mm/yr) when multiplied by the average water content of
0.30 m3/m 3 (Table 3). The irrigated profile in Hemphill County has high chloride concentrations
in the upper 12 ft (3.7 m) with peak chloride concentration of 1005 mg/L at a depth of 5 ft (1.5
m). High chloride concentrations in this zone are also associated with high sulfate
concentrations (peak 449 mg/L at 1.2 m depth) and high fluoride concentrations (peak 66 mg/L
at 1.8 m depth). Concentration of salts in this zone is attributed to evapotranspirative enrichment
of irrigation water. Estimated recharge for this site is 4.5 in/yr (115 mm/yr) using the chloride
mass balance approach (equation 2) and an irrigation application rate of 1.5 ft/yr (0.5 m/yr) and
chloride concentration of 14.5 mg/L measured in a sample of the irrigation water (Table 3).
Concentrations of nitrate, sulfate, and fluoride are variable (Table 4, Fig. 20). Concentrations
of nitrate-N are generally low in two profiles below the root zone (means 5.9 and 7.3 mg/L).
Much higher nitrate concentrations in ROB07-02 profile extend below the root zone (peak 174
mg IL, depth 1.8 m). A secondary bulge of nitrate near the base of the profile and associated
with the displaced chloride bulge may represent organic matter originally in the soil profile that
was mineralized and displaced downward following conversion from rangeland.
Sulfate concentrations are high in 2 of the 3 irrigated profiles (peak 449 mg/L at 1.2 m depth;
1,969 mg/L at 7.3 m depth) and low in the third profile, ROB06-01 (46 mg/L at 1.9 m depth.
Variations in peak sulfate concentrations generally follow variations in chloride concentrations.
However, the peak sulfate concentration in ROB07-02 is much shallower (7.3 m depth) than that
of the chloride peak (13.4 m depth), indicating that sulfate is not as readily mobilized by
increased drainage beneath irrigated sites as chloride. The difference in peak depths of chloride
and sulfate is not as great in the Hemphill County irrigated profile (0.6 m for sulfate and 0.9 m
for chloride).
27
Fluoride concentrations are moderately low in all profiles with peak concentrations ranging
from 22 mg/l (1.2 m depth) to 69 mg/l (4.3 m depth). Fluoride profiles do not seem to bear any
relation to chloride profiles as the highest peak fluoride concentration is found in the profile with
the lowest peak chloride concentration (ROB06-01). Fluoride does not seem to be mobilized
under increased drainage resulting from irrigation return flow.
3.3.4 Drainage Setting
One borehole was drilled in a dry drainage channel in Roberts County (Fig. 1). Soil texture
at the site is coarse with only 8% clay content in the upper 2 m (Table 3). Mean water content is
relatively high (0.17 m3/m 3) for such coarse soil and matric potential is also high (mean -2 m)
(Table 3, Fig. 15). Median EGa measured using the EM31 was low (15 mS/m) reflecting the
coarse soil texture. It is difficult to estimate recharge rates beneath the drainage because we do
not know the chloride input (runon rate and chloride concentration in runon). A lower bound on
the recharge rate of 0.67 in/yr (17 mm/yr) can be estimated by assuming no runon. Assuming a
runon rate of 2 ftlyr (600 mm/yr) and chloride concentrations in the runon water of 1 mg/l, the
estimated recharge rate is 3.8 in/yr (95 mm/yr). Increasing runon and chloride concentration in
runon would linearly increase calculated recharge rates.
Mean concentrations of nitrate-N (0.7 mg/l), sulfate (17 mg/l), and fluoride (5 mg/l), are
very low and concentration profiles are very uniform (Table 4, Fig. 21). These measurements,
along with the chloride profile, indicate that recharge at this site is occurring quickly enough to
prevent solutes from building up through evapotranspiration.
3.3.5 Stock Impoundments
Four boreholes were cored beneath or adjacent to stock impoundments in Roberts County
(Fig.1). Two boreholes were located in the same impoundment and offset by about 30 ft (9m),
with the second borehole being an attempt to obtain greater depth than the first. Both were
analyzed for all parameters except matric potential, for which measurements were made for
only one profile. Soil texture at the sites is representative of rangeland areas and ranges from
23 to 27% (Table 3). Mean water contents are moderate to high (0.17 to 0.26 m3/m 3) and matric
potentials are very high (mean -4.3 to -15.7 ft; -1.3 to -4.8 m) (Table 3, Fig. 16). Median EGa
measured using the EM31 was high (39 to 56 mS/m) reflecting combined clay and water
contents. As with the drainage setting location, it is difficult to estimate recharge rates beneath
the impoundments because we do not know the chloride input (ponding rate and chloride
concentration). lower bounds on recharge rates can be estimated by assuming no ponding and
a range from 0.64 to 1.4 in/yr (16 to 35 mm/yr). Assuming a ponding rate of 2 ftlyr (600 mm/yr)
28
and chloride concentrations in the ponded water of 1 mg/L, recharge rates range from 4.3 to 7.3
in/yr (87 to 186 mm/yr). Increasing ponding depth and chloride concentration in pond water
would linearly increase calculated recharge rates.
Mean nitrate-N concentrations below the root zone are generally high compared with most
rangeland sites and are comparable to cultivated sites (mean 1.3 to 9.8 mg/L) (Table 4, Fig. 22).
Peak nitrate-N concentrations below the root zone (12 to 53 mg/L, 1.2 to 6.3 m depth) also
follow this pattern, higher than rangeland and comparable to cultivated sites. The highest
nitrate-N concentrations in all impoundment profiles occur at the surface or within the root zone,
and range from 21 to 480 mg/L, reflecting the high deposition rate of cow manure at these
locations.
As with the drainage site profile, mean concentrations of sulfate and fluoride in the
impoundment profiles are generally low to very low and concentrations are generally uniform
with depth (Table 4, Fig. 22). These measurements, along with the chloride profiles, are similar
to stream drainage profile concentrations and indicate that recharge at these sites is also
occurring fast enough to prevent solutes from building up through evapotranspiration.
3.4 Recharge Estimates Based on Unsaturated Zone Modeling
Vegetation input parameters required for UNSAT-H simulations are shown in Table 5, and
soil water-retention parameters for soil profiles in Roberts County derived from SSURGO data
are shown in Table 6. Simulation results are represented for the four basic scenarios to assess
relative importance of climate, vegetation, and soils in controlling recharge (Tables 7 and 8).
Average final mass balance errors for each simulation ranged from -1.5 to 0.2 mm/yr, with
errors for most simulations <0.3 mm/yr. For simulation results with average drainage of >1
mm/yr, the average annual mass balance error was <5% of average annual drainage.
3.4.1 Nonvegetated. Monolithic Sand Simulations
Simulated mean (30-yr) annual recharge for bare sand is high, 6.8 in/yr (174 mm/yr),
representing 35% of mean (30-yr) annual precipitation. This recharge estimate provides an
upper bound on the actual recharge rate because vegetation and soil textural variability were
not included. In addition, simulated runoff from the 1-D model is zero. Lack of simulated runoff
was attributed to the high saturated hydraulic conductivity of the sand (9.4 in/hr, 0.24 m/hr)
relative to the pre-specified precipitation intensity (4 in/hr, 0.01 m/hr).
Temporal variability in mean annual recharge (coefficient of variation, CV: 0.16) is less than
that of precipitation (CV: 0.21, Table 7). Mean 30-yr annual potential ET, 82.5 in/yr (2096
29
mm/yr), is 6.5 times greater than simulated actual ET (12.7 in/yr, 323 mm/yr). The PET/AET
ratio decreases from 12.1 in the arid west of Texas to 2.9 in the humid east of Texas (Keese et
ai., 2005). In arid regions, most infiltrated water is returned to the atmosphere through
evaporation. Roberts County has a semi-arid climate shown by the tracking of precipitation and
evaporation (Fig. 24). The high correlation (1""=0.80) between evaporation and precipitation in
this region may be attributed to evaporation rarely being energy limited (high PET). There is
some lag between high precipitation and recharge, as shown by the moderate correlation
between annual precipitation and recharge (1""=0.54).
3.4.2 Nonvegetated, Texturally Variable Soil Simulations
Simulated mean (30-yr) annual, areally averaged recharge for Roberts County is 2.0 in/yr
(52 mm/yr) for nonvegetated, texturally variable soil profiles, representing 10% of mean annual
precipitation (Table 7). This recharge rate is 3.4 times lower than that based on the monolithic
sand profile, indicating the importance of soil textural variability in controlling recharge. Lower
recharge rates may reflect finer textured soils, or they may be related to reductions in recharge
caused by profile layering, both fine over coarse (capillary barrier effect) and coarse over fine
layering. Reductions in recharge in the texturally variable soil simulations correspond to
increased runoff, evaporation, or both.
Variations in simulated mean (30-yr) annual runoff generally reflect differences in soil
texture. Simulated runoff is positively correlated with mean clay content (1""=0.57) and negatively
correlated with mean sand content (1""=-0.49). Simulated recharge rates in clay-rich soils may
not accurately reflect actual recharge rates if preferential flow occurs in these settings because
this process is not included in the simulations.
3.4.3 Vegetated. Monolithic Sand Simulations
To assess the impact of vegetation, without the influence of soil textural variability, recharge
simulations were conducted for vegetated, monolithic sands (Table 7). Vegetation markedly
reduced simulated areally averaged mean annual recharge (0.18 in/yr, 4.5 mm/yr; 0.9% of
mean annual precipitation) by a factor of 11.4 relative to recharge for nonvegetated, texturally
variable soils.
Simulated runoff was zero for both nonvegetated and vegetated simulations. Vegetation
type also affects simulated recharge, as seen in the two orders of magnitude range in simulated
recharge for different vegetation types. Shrubs are generally more effective than crops in
reducing recharge because of greater rooting depth and longer growing season.
30
3.4.4 Vegetated, Texturally Variable Soil Simulations
Texturally variable soils with vegetation provide the most realistic representation of actual
conditions and should provide the most reliable recharge estimates for the different regions,
Simulated mean (30-yr) annual, areally averaged recharge is low, 0,004 in/yr (0,1 mm/yr), and
represents 0,02% of mean annual precipitation,
Vegetation markedly reduced recharge relative to that for nonvegetated, texturally variable
soils, The reduction factor was greater than 500 and reflects the enhanced ability of vegetation
to reduce recharge in this water-limited region,
Simulated runoff was higher in areas with higher clay content relative to lower clay content,
as expected, Simulated mean (30-yr) annual, areally averaged runoff is high, 2,9 in/yr (73
mm/yr), and is inconsistent with low runoff estimates based on measured stream gauge data
(1961-1990) used to develop a statewide water balance (Reed et aI., 1997), Discrepancies
between the two estimates can be attributed to predominantly internal drainage to ephemeral
lakes or playas and little runoff to gauged stream networks, Runoff is one of the most difficult
parameters to simulate because it depends on accurate representation of rainfall intensity and
hydraulic conductivity of surficial sediments that may be crusted, as shown by detailed
comparisons of simulated and measured runoff at a controlled field experiment (Scanlon et aI.,
2002),
Relative controls of different vegetation types in vegetated, texturally variable soil
simulations are similar to those for vegetated, monolithic sands-recharge rates are lower
beneath shrubs and brush than beneath crops (Fig, 25), However, all of the simulations beneath
texturally variable soils show extremely low recharge rates, Relative amounts of evaporation
and transpiration vary with vegetation type and soil texture, Transpiration is much greater than
evaporation for brush, irrespective of texture, Regardless of vegetation type, evaporation is
higher than transpiration in finer textured soils than in coarser textured soils, because finer
textured soils retain more water near the soil surface for longer periods and therefore allow
greater evaporation,
4.0 SUMMARY
A regional recharge rate of 0.26 in/yr (6,6 mm/yr) was estimated for central Roberts
County on the basis of a region of low chloride groundwater (:550 mg/l) in the central part of
Roberts County that extends into Hemphill County. Groundwater chloride concentrations cannot
be used in other regions because of saline plumes in the southern part of Roberts and northern
Gray counties and also along the Canadian River in Roberts and Hemphill counties,
31
Approximately 90% of the log-normal recharge distribution was found between 0.13 and 0.60
in/yr (3.2 and 15.2 mm/yr). Highest recharge rates, representing only about 2% of the Roberts
County area, range from 0.67 to 0.91 in/yr (17 to 23 mm/yr) and are consistent with high
recharge rates (2:0.67 in/yr; 2:17 mm/yr) estimated from an unsaturated zone profile sampled
beneath a stream drainage in Roberts County. These results indicate that stream drainages in
Roberts County may be functioning in ways similar to playas in other regions by focusing
recharge to the Ogallala aquifer. However, tritium-helium age dating of groundwater samples
from wells located within the stream drainage network indicates that there has been very little
recharge within the past 50 yr.
Unsaturated zone chloride profiles indicate that there is essentially no recharge beneath
most rangeland sites in Roberts and Hemphill Counties. Many rangeland profiles (6 out of 9) are
characterized by large chloride accumulations that required 3,601 to 19,758 yr to accumulate
and indicate that soils have been drying out over these time periods. The remaining rangeland
profiles (one in Roberts and one in Hemphill counties) have much lower chloride concentrations
(mean 49 to 78 mg/L) indicating low recharge rates of 0.11 and 0.14 in/yr (2.8 and 3.6 mm/yr)
attributed to coarser textured soils and location on the breaks near the Canadian River.
Recharge could not be estimated for one rangeland profile in Roberts County because only
cuttings could be collected with the air rotary drilling technique. Conversion from rangeland to
dryland agriculture did not increase recharge in the Roberts County profile because of fine
textured soils but did result in low recharge in the Hemphill County profile 0.41 in/yr (10.4
mm/yr). Irrigation increased recharge in all 3 irrigated profiles to values of 1.9, 2.2, and 4.5 in/yr
(48, 56, and 115 mm/yr), which is attributed to excess irrigation water leaching below the root
zone. Salts are accumUlating near the root zone in the Hemphill irrigated profile, which can be
attributed to deficit irrigation and evapotranspirative enrichment. A profile beneath a dry stream
drainage in Roberts County also showed significant recharge as evidenced by low chloride
concentrations; a minimum recharge of rate of 0.68 in/yr (17 mm/yr) was calculated for this site.
The actual recharge rate could not be estimated accurately because the runon amount and
chloride concentration in runon were not quantified. Similarly, 4 profiles beneath 3 stock
impoundments also showed significant (minimum) recharge rates ranging from 0.64 to 1.4 in/yr
(16 to 35 mm/yr), although actual recharge rates could not be estimated for the same lack of
chloride input data.
Unsaturated zone modeling using bare sand for Roberts County resulted in a maximum
estimate of recharge of 6.9 in/yr (174 mm/yr) representing 35% of mean annual precipitation
(30-yr; 1961-1990). Simulated mean (30-yr) annual, aerially averaged recharge for Roberts
32
County is 2 in/yr (52 mm/yr) for texturaily variable soil profiles, representing 10% of mean
annual precipitation. Vegetation reduces simulated mean annual recharge (0.18 in/yr; 4.5
mm/yr; 0.9% of mean annual precipitation) by a factor of 11.4 relative to recharge for the
nonvegetated sands. Texturaily variable soils with vegetation provide the most realistic
representation of actual conditions. Simulated mean (30-yr) annual, areaily averaged recharge
is low, 0.004 in/yr; 0.1 mm/yr, and represents 0.02% of mean annual precipitation. However, this
recharge estimate does not incorporate the effects of stream drainages in Roberts County or
increased water input through drainage systems.
The regional recharge rate of 0.26 in/yr (6.6 mm/yr) based on groundwater chloride
concentrations, probably the most reliable estimate for Roberts County, is similar to previous
regional estimates (0.24 in/yr, 6 mm/yr) for the central High Plains using chloride input based on
long-term data (20 yr from NADP). Groundwater chloride data indicate that stream drainages in
Roberts County may function like playas in the central High Plains, focusing recharge. Results
from unsaturated zone sampling and modeling are consistent with regional estimates based on
groundwater chloride and indicate that little recharge occurs outside stream drainages and stock
impoundments in the region.
5.0 ACKNOWLEDGMENTS
We are very grateful to the C. E. Wiiliams of the Panhandle Groundwater Conservation
District, Janet Guthrie of Hemphiil Groundwater Conservation District, Kent Satterwhite of the
Canadian River Municipal Water Authority, and the Texas Water Development Board, who
provided funding for this study, and Amy Croweil (Panhandle Groundwater Conservation
District) and Janet Guthrie (Hemphiil Groundwater Conservation District) for obtaining access to
properties for driiling and land use histories. We appreciate the cooperation of property owners
who willingly provided access to their properties for drilling. Publication authorized by the
Director, Bureau of Economic Geology.
33
6.0 REFERENCES
Allison, G. B., and M. W. Hughes. 1978. The use of environmental chloride and tritium to
estimate total recharge to an unconfined aquifer. Aus!. J. Soil Res. 16:181-195.
Ansley, R. J., W. A Dugas, M. L. Heuer, and B. A Kramp (2002), Bowen ratio/energy balance
and scaled leaf measurements of C02 flux over burned Prosopis savanna, Ecol. Applic.,
12(4), 948-961.
Canadell, J., R. B. Jackson, J. R. Ehleringer, H. A Mooney, O. E. Sala, and E.-D. Schulze
(1996), Maximum rooting depth of vegetation types at the global scale, Oecologia, 108, 583
595.
Dugas, W. A, M. L. Heuer, and H. S. Mayeux (1999), Carbon dioxide fluxes over
bermudagrass, native prairie, and sorghum, Agric. For. Meteorol., 93,121-139.
Dutton, A R., 1989, Hydrogeochemical processes involved in salt-dissolution zones, Texas
Panhandle, U.S.A., Hyrdrol. Process. 3, 75-89.
Egboka, B. C. E., Cherry, J. A, Farvolden, R. N., and Frind, E. 0.,1983, Migration of
contaminants in groundwater at a landfill: a case study. 3. Tritium as an indicator of
dispersion and recharge: J. Hydrol., v. 63, p. 51-80.
Edmunds, M., and P. L. Smedley (2005), Fluoride in natural waters, in Essentials of Medical
Geology, edited by O. Selinus, et aI., pp. 310-329, Elsevier, Amsterdam.
Fayer, M. J. (2000), UNSAT-H version 3.0: Unsaturated soil water and heat flow model, theory,
user manual, and examples, Rep. PNNL-13249, Pac. Northwest Natl. Lab., Richland, Wash.
Hanson, C. L., K. A Cumming, D. A Woolhiser, and C. W. Richardson (1994), Microcomputer
program for daily weather simulation, Publ. ARS-114, 38 pp., Agric. Res. Serv., U.S. Dep. Of
Agric., Washington, D. C.
Heitschmidt, R. K., R. J. Ansley, S. L. Dowhower, P. W. Jacoby, and D. L. Price (1998), Some
observations from the excavation of honey mesquite root systems, J. Range Management,
41(3),227-230.
Houston, N. A, C. A Garcia, E. W. Strom, 2003, Selected hydrogeologic datasets for the
Ogallala Aquifer, Texas. USGS Open File Rept. 03-296.
Howell, T. A, S. R. Evett, J. A Tolk, A. D. Schneider, and A D. Steiner (1996),
Evapotranspiration of Corn -- Southern High Plains, paper presented at Proceedings of the
International Conference Evapotranspiration and Irrigation Scheduling, American Society of
Agricultural Engineers, San Antonio, TX.
34
Jackson, R. B., J. Canadell, J. R. Ehleringer, H. A. Mooney, O. E. Sala, and E. D. Schuize
(1996), A globai anaiysis of root distributions for terrestrial biomes, Oecologia, 108(3),389
411.
Jackson, R. B., L. A. Moore, W. A. Hoffmann, W. T. Pockman, and C. R. Linder (1999),
Ecosystem rooting depth determined with caves and DNA, Proc. Nat!. Acad. Sci., 96,
11387-11392.
Keese, K. E., B. R. Scanlon, and R. C. Reedy (2005), Assessing controls on diffuse
groundwater recharge using unsaturated flow modeling, Water Resour. Res., 41, W06010,
doi: 10.1 029/2004WR003841.
Knowles, T., P. Nordstrom, W. B. Klemt, 1984, Evaluating the Ground-water Resources of the
High Plains of Texas, vol. 1, Texas Dept. of Water Resour. Rep. 288-1. 119pp.
Leij, F. J., W. J. Alves, M. T. van Genuchten, and J. R. Williams (1996), The UNSODA
unsaturated soil hydraulic database, User's Manual. Version 1.0, EPA/600/R-96/095,
National Risk Management Laboratory, Office of Research and Development, U. S.
Environmental Protection Agency, Cincinnati, Ohio.
Long, A. T., Jr., 1961, Geology and ground-water resources of Carson and part of Gray County,
Texas, progress report no. 1. Texas Board of Water Engineers Bull. 6102. 45pp.
McAdoo, G. D., A. R. Leggat, A. T. Long, 1964, Geology and Ground-water Resources of
Carson County and part of Gray County, Texas, progress report no. 2. Water Commission
Bull. 6402. 27pp.
McMahon, C. A., R. G. Frye, and K. L. Brown (1984), The vegetation types of Texas inclUding
cropland, Bull. 7000-120,40 pp., Texas Parks and Wildlife Dep., Austin.
McMahon, P. B., K. F. Dennehy, B. W. Bruce, J. K. Bohlke, R. L. Michel, J. J. Gurdak, and D. B.
Hurlbut. 2006. Storage and transit time of chemicals in thick unsaturated zones under
rangeland and irrigated cropland, High Plains, United States. Water Resources Research
42:doi: 10.1 029/2005WR004417.
McNeill, J. D. 1992. Rapid, accurate mapping of soil salinity by electromagnetic ground
conductivity meters. in G. C. Topp and W. D. Reynolds, editors. Advances in Measurement
of Soil Physical Properties-Bringing Theory into Practice. Soil Sci. Soc. Am. Spec. Pub!.
No. 30, Madison, Wisconsin, 209-229.
Mehta, S., Fryar, A. E., Banner, J. L., 2000a, Controls on the regional-scale salinization of the
Ogallala aquifer, Southern High Plains, Texas, USA, Appl. Geocem. 15.849-864. 2000b.
Mehta, S., Fryar, A. E., Brady, R. M., Morin, R. H., 2000b, Modeling regional salinization of the
Ogallala aquifer, Southern High Plains, TX, USA, Jour. of Hydrology, 238, 44-64. 2000b.
35
National Renewable Energy Laboratory (NREL) (1992), User's manual: National Solar Radiation
Data Base (1961-1990), Version 1.0, distributed by the National Climatic Data Center, var.
pag.
Phillips, F. M. 1994. Environmental tracers for water movement in desert soils of the American
Southwest. Soil Sci. Soc. Am. J. 58:14-24.
Reed, S. M., D. R Maidment, and J. Patoux (1997), Spatial water balance of Texas, Tech. Rep.
97-1, Cent. For Res. in Water Resour., Uni. of Tex. at Austin, Austin, Texas.
Reedy, R C., and B. R. Scanlon. 2003. Soil water content monitoring using electromagnetic
induction. J. Geotech. and Geoenvir. Engin.; 10.1061/ASCE1090-02412003129:111028, p.
1028-1039
Rhoades, J. D., N. A Manteghi, P. J. Shouse, and W. J. Alves. 1989. Soil electrical conductivity
and soil salinity-New formulations and calibrations. Soil Sci. Soc. Am. J., 53:433-439.
Rhoades, J. D., P. A C. Raats, and R J. Prather. 1976. Effects of liquid-phase electrical
conductivity, water content, and surface conductivity on bulk soil electrical conductivity. Soil
Sci. Soc. Am. J. 40:651-655.
Robertson, W. D., and Cherry, J. A, 1989, Tritium as an indicator of recharge and dispersion in
a groundwater system in Central Ontario: Water Resour. Res., v. 25, p. 1097-1109.
Scanlon, B. R 1991. Evaluation of moisture flux from chloride data in desert soils. J. Hydrol.
128:137-156.
Scanlon, B. R 2000. Uncertainties in estimating water fluxes and residence times using
environmental tracers in an arid unsaturated zone. Water Resour. Res. 36:395-409.
Scanlon, B. R, M. Christman, R C. Reedy, I. Porro, J. Simunek, and G. Flerchinger, 2002,
Intercode comparisons for simuiating water balance of surficial sediments in semiarid
regions. Water Resour. Res., 38(12), 1323, doi:10.1029/2001WR001233.
Scanlon, B. R, and R S. Goldsmith (1997), Field study of spatial variability in unsaturated flow
beneath and adjacent to playas, Water Resour. Res., 33(10), 2239-2252.
Scanlon, B. R, R P. Langford, and R. S. Goldsmith, 1999, Relationship between geomorphic
settings and unsaturated flow in an arid setting. Water Resour. Res. 35:983-999.
Scanlon, B. R, R C. Reedy, D. A Stonestrom, D. E. Prudic, and K. F. Dennehy. 2005. Impact
of land use and land cover change on groundwater recharge and quality in the southwestern
USA Global Change Biology 11:1577-1593.
Scanlon, B. R, R C. Reedy, and J. A Tachovsky. 2007. Semiarid unsaturated zone chloride
profiles-Archives of past land use change impacts on water resources in the southern High
Plains, United States, Water Resour. Res., 43:W06423, doi: 10.1 029/2006WR005769.
36
Schaap, M. G., F. J. Leij, and M. T. van Genuchten (2001), ROSETIA: A computer program for
estimating soil hydraulic parameters with hierarchical pedotransfer functions, J. Hydrol., 251,
163-176.
U.S. Department of Agriculture (USDA) (1995), Soil Survey Geographic Data Base, SSURGO,
Misc. Publ. 1527, Nat. Resour. Conserv. Serv., Washington, D. C.
U.S. Department of Agriculture-NRCS (United States Department of Agriculture National
Resources Conservation Service). 2007. Soil Survey Geographic (SSURGO) databases for
Roberts and Hemphill counties, Texas. GIS shape files and tabular datasets.
Vogelmann, J. E., S. M. Howard, L. Yang, C. R. Larson, B. K. Wylie, and N. van Driel. 2001.
Completion of the 1990s National Land Cover Data set for the conterminous United States
from Landsat Thematic Mapper data and ancillary data sources. Photogrammetric Engin.
and Remote Sensing 67:650-662.
Walker, G. R., I. D. Jolly, and P. G. Cook. 1991. A new chloride leaching approach to the
estimation of diffuse recharge following a change in land use. Journal of Hydrology 128:49
67.
Weaver, J. E. (1926), Root Development of Field Crops, 1 ed., 291 pp., McGraw-Hili Book
Company, Inc., New York.
Wood, W. w., and W. E. Sanford. 1995. Chemical and isotopic methods for quantifying ground
water recharge in a regional, semiarid environment. Ground Water 33:458-468.
37
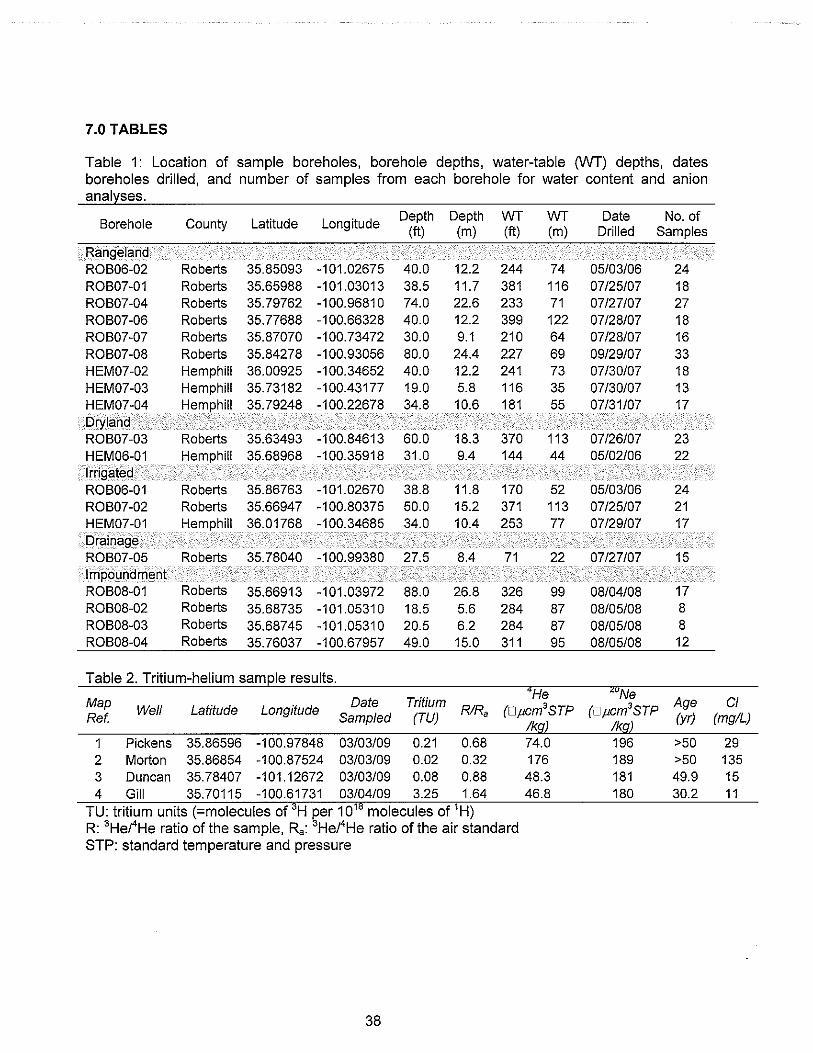
7.0 TABLES
Table 1: Location of sample boreholes, borehole depths, water-table ryvT) depths, datesboreholes drilled, and number of samples from each borehole for water content and anionanalyses.
Borehole County Latitude LongitudeDepth Depth WT WT Date No. of
(ft) (m) (ft) (m) Drilled Samples
ROB06-02 Roberts 35.85093 -101.02675 40.0 12.2 244 74 05/03/06 24ROB07-01 Roberts 35.65988 -101.03013 38.5 11.7 381 116 07/25/07 18ROB07-04 Roberts 35.79762 -100.96810 74.0 22.6 233 71 07/27/07 27ROB07-06 Roberts 35.77688 -100.66328 40.0 12.2 399 122 07/28/07 18ROB07-07 Roberts 35.87070 -100.73472 30.0 9.1 210 64 07/28/07 16ROB07-08 Roberts 35.84278 -100.93056 80.0 24.4 227 69 09/29/07 33HEM07-02 Hemphill 36.00925 -100.34652 40.0 12.2 241 73 07/30107 18HEM07-03 Hemphill 35.73182 -100.43177 19.0 5.8 116 35 07/30107 13HEM07-04 35.79248 -100.22678 34.8 10.6 181 55 07/31/07 17
ROB07-03 Roberts 35.63493 -100.84613 60.0 18.3 370 113 07/26/07 23HEM06-01 35.68968 -100.35918 31.0 9.4 144 44 05/02/06 22
ROB06-01 Roberts 35.86763 -101.02670 38.8 11.8 170 52 05/03/06 24ROB07-02 Roberts 35.66947 -100.80375 50.0 15.2 371 113 07/25/07 21HEM07-01 36.01768 -100.34685 34.0 10.4 253 77 07/29/07 17
ROB07-05 Roberts 35.78040 -100.99380 27.5 8.4 71 22 07/27/07 15
ROB08-01 Roberts 35.66913 -101.03972 88.0 26.8 326 99 08/04/08 17ROB08-02 Roberts 35.68735 -101.05310 18.5 5.6 284 87 08/05/08 8ROB08-03 Roberts 35.68745 -101.05310 20.5 6.2 284 87 08/05/08 8ROB08-04 Roberts 35.76037 -100.67957 49.0 15.0 311 95 08/05/08 12
Table 2. Tritium-helium sample results.
Map Date Tritium'He 20Ne
Age CIWell Latitude Longitude RlRa (Dpcm3STP (Dpcm3STPRef. Sampled (TV)
/kg) /kg)(yr) (mg/L)
1 Pickens 35.86596 -100.97848 03/03/09 0.21 0.68 74.0 196 >50 292 Morton 35.86854 -100.87524 03/03/09 0.02 0.32 176 189 >50 1353 Duncan 35.78407 -101.12672 03/03/09 0.08 0.88 48.3 181 49.9 154 Gill 35.70115 -100.61731 03/04/09 3.25 1.64 46.8 180 30.2 11
TU: tritium units (-molecules of 3H per 10'8 molecules of 'H)R: 3HetHe ratio of the sample, Ra: 3He/4He ratio of the air standardSTP: standard temperature and pressure
38
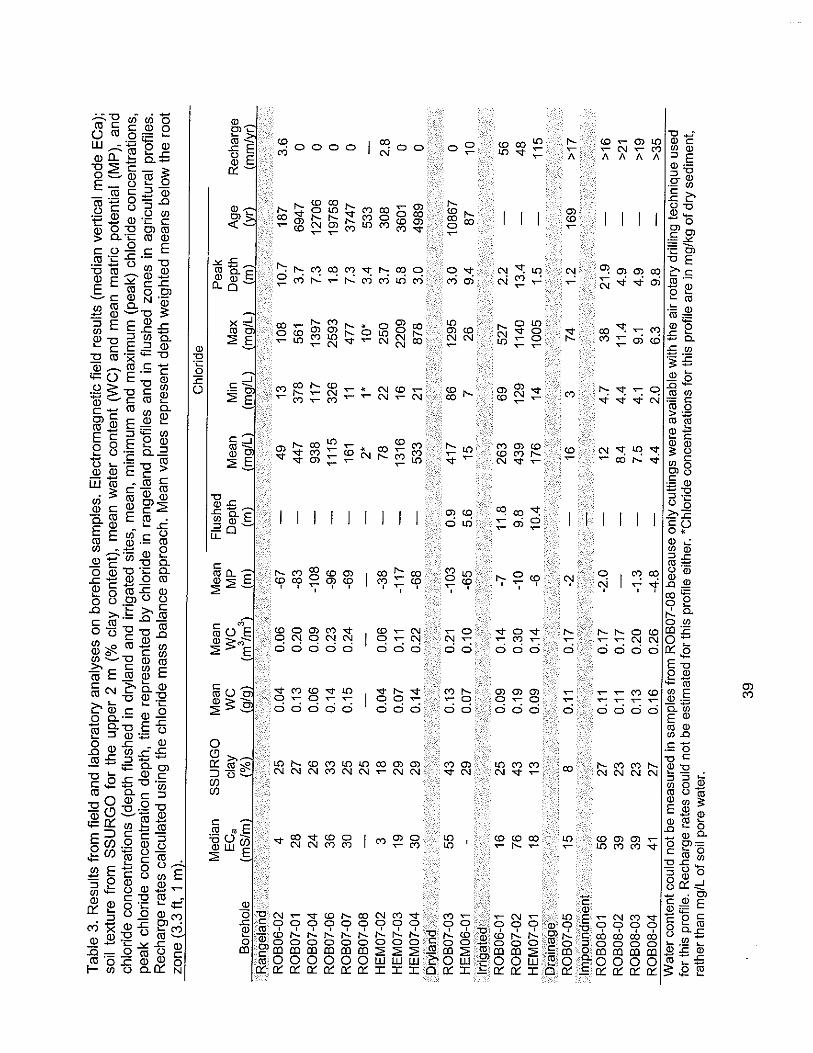
Table 3. Results from field and laboratory analyses on borehole samples. Electromagnetic field results (median vertical mode ECa);soil texture from SSURGO for the upper 2 m (% clay content), mean water content (WC) and mean matric potential (MP), andchloride concentrations (depth flushed in dryland and irrigated sites, mean, minimum and maximum (peak) chloride concentrations,peak chloride concentration depth, time represented by chloride in rangeland profiles and in flushed zones in agricultural profiles.Recharge rates calculated using the chloride mass balance approach. Mean values represent depth weighted means below the rootzone (3.3 ft, 1 m).
Chloride
Median SSURGO Mean Mean Mean Flushed PeakECa
ROB06-02 4 25 0.04 0.06 -67 - 49 13 108 10.7 187 3.6ROB07-01 28 27 0.13 0.20 -83 - 447 378 561 3.7 6947 0ROB07-04 24 26 0.06 0.09 -108 - 938 117 1397 7.3 12706 0ROB07-06 36 33 0.14 0.23 -96 - 1115 326 2593 1.8 19758 0ROB07-07 30 25 0.15 0.24 -69 - 161 11 477 7.3 3747 0ROB07-08 - 25 - - - - 2* 1* 10* 3.4 533HEM07-02 3 18 0.04 0.06 -38 - 78 22 250 3.7 308 2.8HEM07-03 19 29 0.07 0.11 -117 - 1316 16 2209 5.8 3601 0HEM07-04 30 29 0.14 0.22 -68 - 533 21 878 3.0 4989 0
ROB07-03 55 43 0.13 0.21 -103 0.9 417 86 1295 3.0 10867 0HEM06-01 29 0.07 0.10 -65 5.6 15 7 26 9.4 87 10
ROB06-01 16 25 0.09 0.14 -7 11.8 263 69 527 2.2 - 56ROB07-02 76 43 0.19 0.30 -10 9.8 439 129 1140 13.4 - 48HEM07-01 18 13 0.09 0.14 -6 10.4 176 14 1005 1.5 - 115
ROB07-05 15 8 0.11 0.17 -2 - 16 3 74 1.2 169 >17
ROB08-01 56 27 0.11 0.17 -2.0 - 12 4.7 38 21.9 - >16ROB08-02 39 23 0.11 0.17 - - 8.4 4.4 11.4 4.9 - >21ROB08-03 39 23 0.13 0.20 -1.3 - 7.5 4.1 9.1 4.9 - >19ROB08-04 41 27 0.16 0.26 -4.8 - 4.4 2.0 6.3 9.8 - >35Water content could not be measured in samples from ROB07-08 because only cuttings were available with the air rotary drilling technique usedfor this profile. Recharge rates could not be estimated for this profile either. *Chloride concentrations for this profile are in mg/kg of dry sediment,rather than mg/L of soil pore water.
39
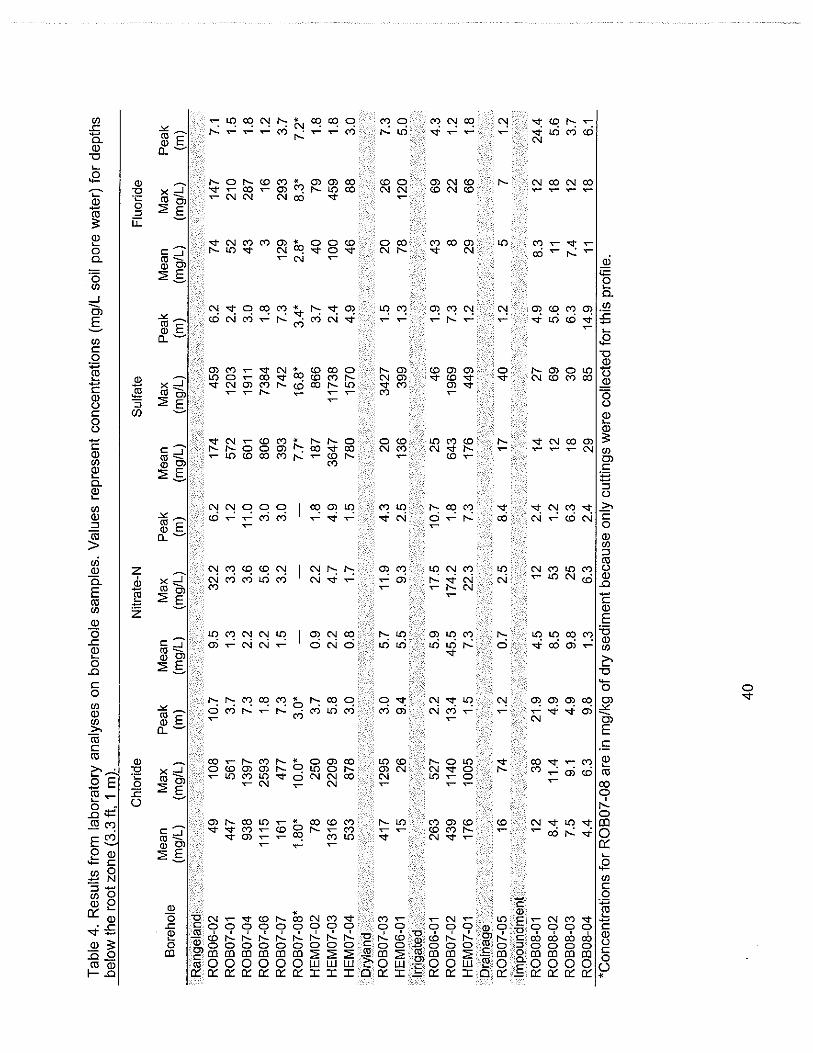
Table 4. Results from laboratory analyses on borehole samples. Values represent concentrations (mg/L soil pore water) for depthsbelow the root zone (3.3 ft, 1 m).
Chloride Nitrate-N Sulfate Fluoride
BoreholeMean Max Peak Mean Max Peak Mean Max Peak Mean Max Peak
ROB06-02 49 108 10.7 9.5 32.2 6.2 174 459 6.2 74 147 7.1ROB07-01 447 561 3.7 1.3 3.3 1.2 572 1203 2.4 52 210 1.5ROB07-04 938 1397 7.3 2.2 3.6 11.0 601 1911 3.0 43 287 1.8ROB07-06 1115 2593 1.8 2.2 5.6 3.0 806 7384 1.8 3 16 1.2ROB07-07 161 477 7.3 1.5 3.2 3.0 393 742 7.3 129 293 3.7ROB07-08* 1.80* 10.0* 3.0* - - - 7.7* 16.8* 3.4* 2.8* 8.3* 7.2*HEM07-02 78 250 3.7 0.9 2.2 1.8 187 866 3.7 40 79 1.8HEM07-03 1316 2209 5.8 2.2 4.7 4.9 3647 11738 2.4 100 459 1.8HEM07-04 533 878 3.0 0.8 1.7 1.5 780 1570 4.9 46 88 3.0
ROB07-03 417 1295 3.0 5.7 11.9 4.3 20 3427 1.5 20 26 7.3HEM06-01 15 26 9.4 5.5 9.3 399 1.3 5.0
ROB06-01 263 527 2.2 5.9 17.5 10.7 25 46 1.9 43 69 4.3ROB07-02 439 1140 13.4 45.5 174.2 1.8 643 1969 7.3 8 22 1.2HEM07-01 176 1005 1.5 7.3 22.3 7.3 176 449 1.2 29 66 1.8
ROB07-05 16 74 1.2 0.7 2.5 8.4 17 40 1.2 5 7 1.2
ROB08-01 12 38 21.9 4.5 12 2.4 14 27 4.9 8.3 12 24.4ROB08-02 8.4 11.4 4.9 8.5 53 1.2 12 69 5.6 11 18 5.6ROB08-03 7.5 9.1 4.9 9.8 25 6.3 18 30 6.3 7.4 12 3.7ROB08-04 4.4 6.3 9.8 1.3 6.3 2.4 29 85 14.9 11 18 6.1*Concentrations for ROBO?-08 are in mg/kg of dry sediment because only cuttings were collected for this profile.
40
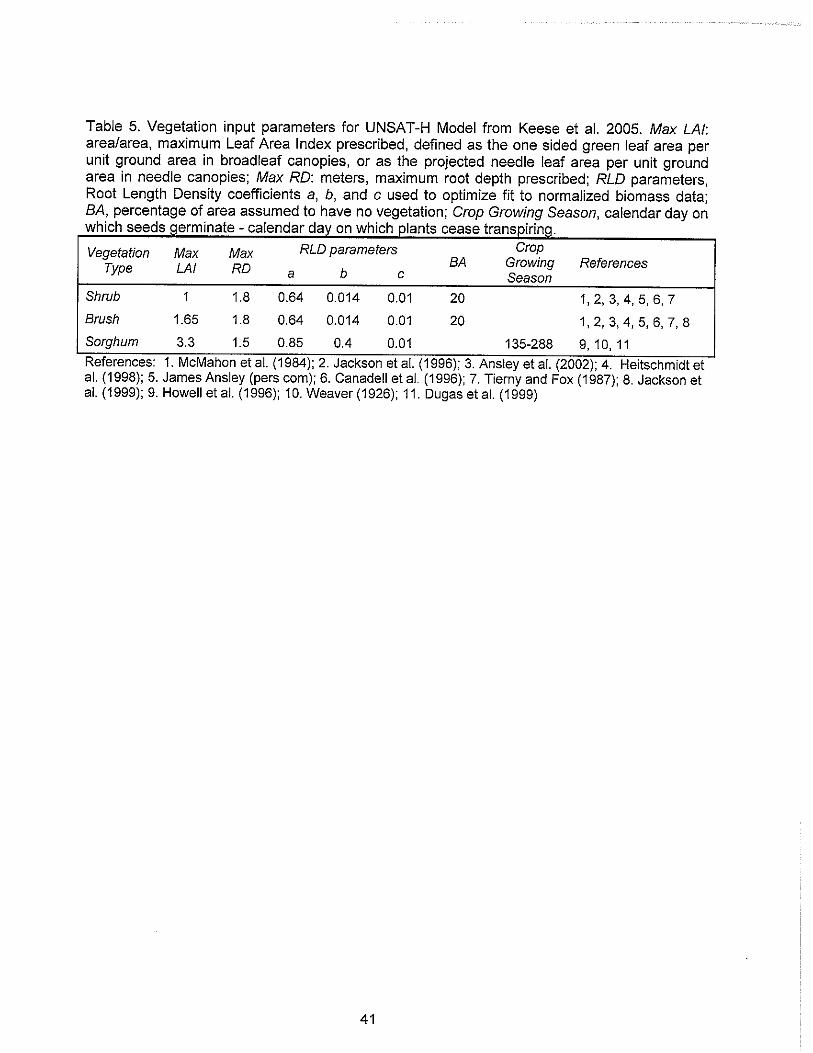
Table 5. Vegetation input parameters for UNSAT-H Model from Keese et al. 2005. Max LA/:area/area, maximum Leaf Area Index prescribed, defined as the one sided green leaf area perunit ground area in broadleaf canopies, or as the projected needle leaf area per unit groundarea in needle canopies; Max RD: meters, maximum root depth prescribed; RLD parameters,Root Length Density coefficients a, b, and c used to optimize fit to normalized biomass data;BA, percentage of area assumed to have no vegetation; Crop Growing Season, calendar day onwhich seeds germinate - calendar day on which plants cease transpiring.
Vegetation Max Max RLD parameters CropT LA/ R
D BA Growing Referencesype abc Season
Shrub 1 1.8 0.64 0.014 0.01 20 1,2,3,4,5,6,7
Brush 1.65 1.8 0.64 0.014 0.01 20 1,2,3,4,5,6,7,8
Sorghum 3.3 1.5 0.85 0.4 0.01 135-288 9, 10, 11References: 1. McMahon et al. (1984); 2. Jackson et al. (1996); 3. Ansley et al. (2002); 4. Heitschmidt etal. (1998); 5. James Ansley (pers com); 6. Canadell et al. (1996); 7. Tierny and Fox (1987); 8. Jackson etal. (1999); 9. Howell et al. (1996); 10. Weaver (1926); 11. Dugas et al. (1999)
41
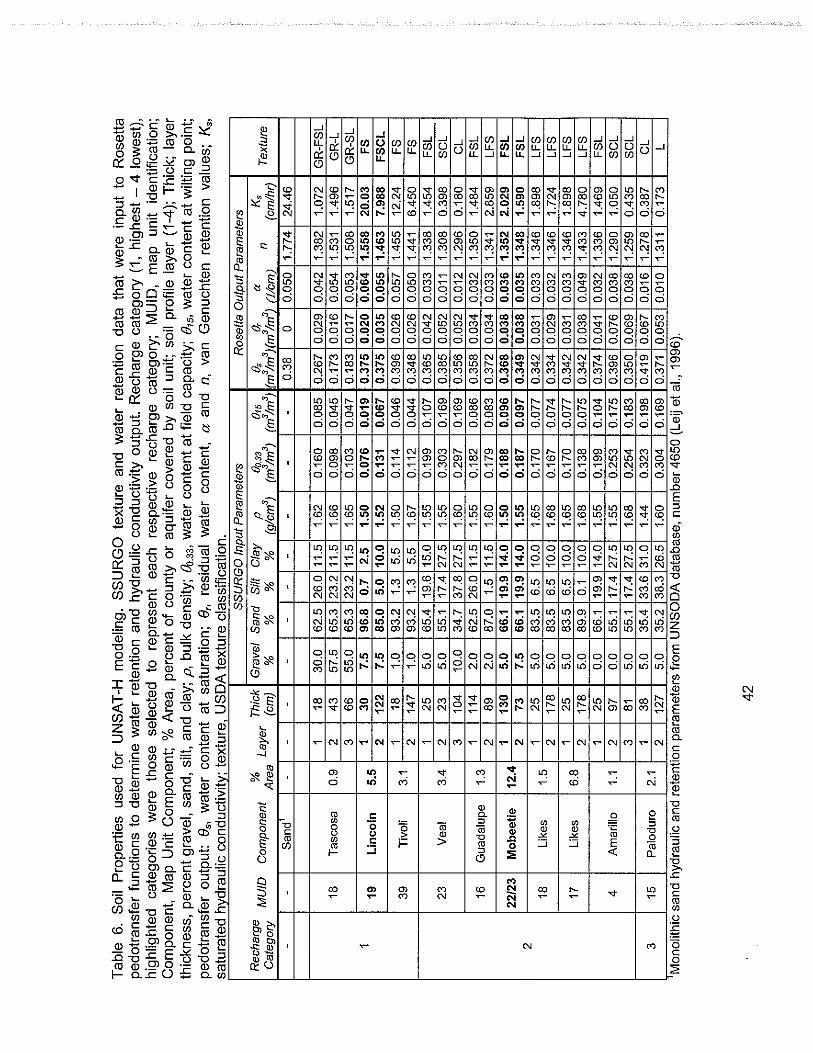
Table 6. Soil Properties used for UNSAT-H modeling. SSURGO texture and water retention data that were input to Rosettapedotransfer functions to determine water retention and hydraulic conductivity output. Recharge category (1, highest - 4 lowest),highlighted categories were those selected to represent each respective recharge category; MUID, map unit identification;Component, Map Unit Component; % Area, percent of county or aquifer covered by soil unit; soil profile layer (1-4); Thick; layerthickness, percent gravel, sand, silt, and clay; p, bulk density; ~.33, water content at field capacity; O,S, water content at wilting point;pedotransfer output: fJs , water content at saturation; fJr , residual water content, a and n, van Genuchten retention values; Ks,
ted hvdraulic conductivitv: texture, USDA texture c1assificaf- ,..... , ..SSURGO Input Parameters Rosetta Output Parameters
Recharge MUIDComponent A~a Layer ;~~f
Gravel Sand Sift Clay p 80.33 e,5 es er a K,Texture
Category % % % % (g/cm3) (m3/m3
) (m3/m3) (m3/m3)(m3/m3
) (f/em) n (em/hr)
- - Sand' - - - - - - - - - - 0.38 0 0.050 1.774 24.46
1 18 30.0 62.5 26.0 11.5 1.62 0.160 0.085 0.267 0.029 0.042 1.382 1.072 GR-FSl18 Tascosa 0.9 2 43 57.5 65.3 23.2 11.5 1.66 0.098 0.045 0.173 0.016 0.054 1.531 1.496 GR-l
3 66 55.0 65.3 23.2 11.5 1.65 0.103 0.047 0.183 0.017 0.053 1.508 1.517 GR-Sl1 19 Lincoln 5.5
1 30 7.5 96.8 0.7 2.5 1.50 0.076 0.019 0.375 0.020 0.064 1.558 20.03 FS2 122 7.5 85.0 5.0 10.0 1.52 0.131 0.067 0.375 0.035 0.055 1.463 7.988 FSCL
39 Tivoli 3.11 18 1.0 93.2 1.3 5.5 1.50 0.114 0.046 0.396 0.026 0.057 1.455 12.24 FS2 147 1.0 93.2 1.3 5.5 1.67 0.112 0.044 0.348 0.026 0.050 1.441 6.450 FS1 25 5.0 65.4 19.6 15.0 1.55 0.199 0.107 0.365 0.042 0.033 1.338 1.454 FSl
23 Veal 3.4 2 23 5.0 55.1 17.4 27.5 1.55 0.303 0.169 0.385 0.052 0.011 1.308 0.398 SCl3 104 10.0 34.7 37.8 27.5 1.60 0.297 0.169 0.356 0.052 0.012 1.296 0.180 Cl
16 Guadalupe 1.31 114 2.0 62.5 26.0 11.5 1.55 0.182 0.086 0.358 0.034 0.032 1.350 1.484 FSl2 89 2.0 87.0 1.5 11.5 1.60 0.179 0.083 0.372 0.034 0.033 1.341 2.859 lFS
22/23 Mobeetie 12.41 130 5.0 66.1 19.9 14.0 1.50 0.188 0.096 0.368 0.038 0.036 1.352 2.029 FSL2 73 7.5 66.1 19.9 14.0 1.55 0.187 0.097 0.349 0.038 0.035 1.348 1.590 FSL
21 25 5.0 83.5 6.5 10.0 1.65 0.170 0.077 0.342 0.031 0.033 1.346 1.898 lFS
18 Likes 1.52 178 5.0 83.5 6.5 10.0 1.68 0.167 0.074 0.334 0.029 0.032 1.346 1.724 lFS
17 Likes 6.81 25 5.0 83.5 6.5 10.0 1.65 0.170 0.077 0.342 0.031 0.033 1.346 1.898 lFS2 178 5.0 89.9 0.1 10.0 1.68 0.138 0.075 0.342 0.038 0.049 1.433 4.780 lFS1 25 0.0 66.1 19.9 14.0 1.55 0.199 0.104 0.374 0.041 0.032 1.336 1.469 FSl
4 Amarillo 1.1 2 97 0.0 55.1 17.4 27.5 1.55 0.253 0.175 0.396 0.076 0.038 1.290 1.050 SCl3 81 5.0 55.1 17.4 27.5 1.68 0.254 0.183 0.350 0.069 0.038 1.259 0.435 SCl
3 15 Paioduro 2.11 38 5.0 35.4 33.6 31.0 1.44 0.323 0.198 0.419 0.067 0.016 1.278 0.387 Cl2 127 5.0 35.2 38.3 26.5 1.60 0.304 0.169 0.371 0.053 0.010 1.311 0.173 l
Monolithic sand hydraulic and retention parameters from UNSODA database, number 4650 (leij et aI., 1996).
42
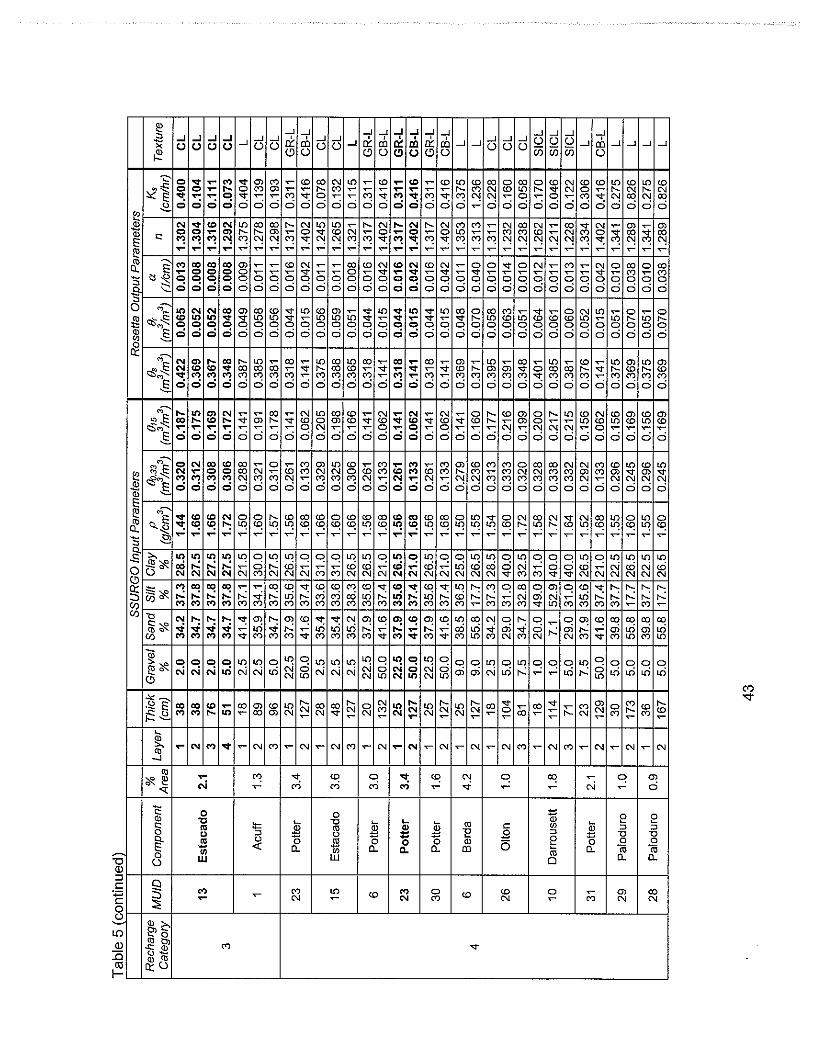
·~_.- - -_ ..~...~~~SSURGO Input Parameters Rosetta Oulput Parameters
RechargeMUID Component
% LayerThick Gravel Sand Silt Clay p 80.33 B'5 Bs B, a Ks Texture
Category Area (em) % % % % (g/cm3) (m3/m3
) (m3/m3) I (m3/m3
) (m3/m3) (1/em
n(em/hr)
1 38 2.0 34.2 37.3 28.5 1.44 0.320 0.187 0.422 0.065 0.013 1.302 0.400 CL
13 Estacado 2.1 2 38 2.0 34.7 37.8 27.5 1.66 0.312 0.175 0.369 0.052 0.008 1.304 0.104 CL3 76 2.0 34.7 37.8 27.5 1.66 0.308 0.169 0.367 0.052 0.008 1.316 0.111 CL
3 4 51 5.0 34.7 37.8 27.5 1.72 0.306 0.172 0.348 0.048 0.008 1.292 0.073 CL1 18 2.5 41.4 37.1 21.5 1.50 0.288 0.141 0.387 0.049 0.009 1.375 0.404 L
1 Acuff 1.3 2 89 2.5 35.9 34.1 30.0 1.60 0.321 0.191 0.385 0.058 0.011 1.278 0.139 CL3 96 5.0 34.7 37.8 27.5 1.57 0.310 0.178 0.381 0.056 0.011 1.298 0.193 CL
23 Potter 3.41 25 22.5 37.9 35.6 26.5 1.56 0.261 0.141 0.318 0.044 0.016 1.317 0.311 GR-L2 127 50.0 41.6 37.4 21.0 1.68 0.133 0.062 0.141 0.015 0.042 1.402 0.416 CB-L1 28 2.5 35.4 33.6 31.0 1.66 0.329 0.205 0.375 0.056 0.011 1.245 0.078 CL
15 Estacado 3.6 2 48 2.5 35.4 33.6 31.0 1.60 0.325 0.198 0.388 0.059 0.011 1.265 0.132 CL3 127 2.5 35.2 38.3 26.5 1.66 0.306 0.166 0.365 0.051 0.008 1.321 0.115 L
6 Potter 3.01 20 22.5 37.9 35.6 26.5 1.56 0.261 0.141 0.318 0.044 0.016 1.317 0.311 GR-L2 132 50.0 41.6 37.4 21.0 1.68 0.133 0.062 0.141 0.015 0.042 1.402 0.416 CB-L
23 Potter 3.41 25 22.5 37.9 35.6 26.5 1.56 0.261 0.141 0.318 0.044 0.016 1.317 0.311 GR-L2 127 50.0 41.6 37.4 21.0 1.68 0.133 0.062 0.141 0.015 0.042 1.402 0.416 CB-L
30 Potter 1.61 25 22.5 37.9 35.6 26.5 1.56 0.261 0.141 0.318 0.044 0.016 1.317 0.311 GR-L2 127 50.0 41.6 37.4 21.0 1.68 0.133 0.062 0.141 0.015 0.042 1.402 0.416 CB-L
6 Berda 4.21 25 9.0 38.5 36.5 25.0 1.50 0.279 0.141 0.369 0.048 0.011 1.353 0.375 L
4 2 127 9.0 55.8 17.7 26.5 1.55 0.236 0.160 0.371 0.070 0.040 1.313 1.236 L1 18 2.5 34.2 37.3 28.5 1.54 0.313 0.177 0.395 0.058 0.010 1.311 0.228 CL
26 Ollon 1.0 2 104 5.0 29.0 31.0 40.0 1.60 0.333 0.216 0.391 0.063 0.014 1.232 0.160 CL3 81 7.5 34.7 32.8 32.5 1.72 0.320 0.199 0.348 0.051 0.010 1.238 0.058 CL1 18 1.0 20.0 49.0 31.0 1.58 0.328 0.200 0.401 0.064 0.012 1.262 0.170 SICL
10 Darrousett 1.8 2 114 1.0 7.1 52.9 40.0 1.72 0.338 0.217 0.385 0.061 0.011 1.211 0.046 SICL3 71 5.0 29.0 31.0 40.0 1.64 0.332 0.215 0.381 0.060 0.013 1.228 0.122 SICL
31 Potter 2.1 1 23 7.5 37.9 35.6 26.5 1.52 0.292 0.156 0.376 0.052 0.011 1.334 0.306 L2 129 50.0 41.6 37.4 21.0 1.68 0.133 0.062 0.141 0.015 0.042 1.402 0.416 CB-L
29 Paloduro 1.01 30 5.0 39.8 37.7 22.5 1.55 0.296 0.156 0.375 0.051 0.010 1.341 0.275 L2 173 5.0 55.8 17.7 26.5 1.60 0.245 0.169 0.369 0.070 0.038 1.289 0.826 L
28 Paloduro 0.91 36 5.0 39.8 37.7 22.5 1.55 0.296 0.156 0.375 0.051 0.010 1.341 0.275 L2 167 5.0 55.8 17.7 26.5 1.60 0.245 0.169 0.369 0.070 0.038 1.289 0.826 L
43
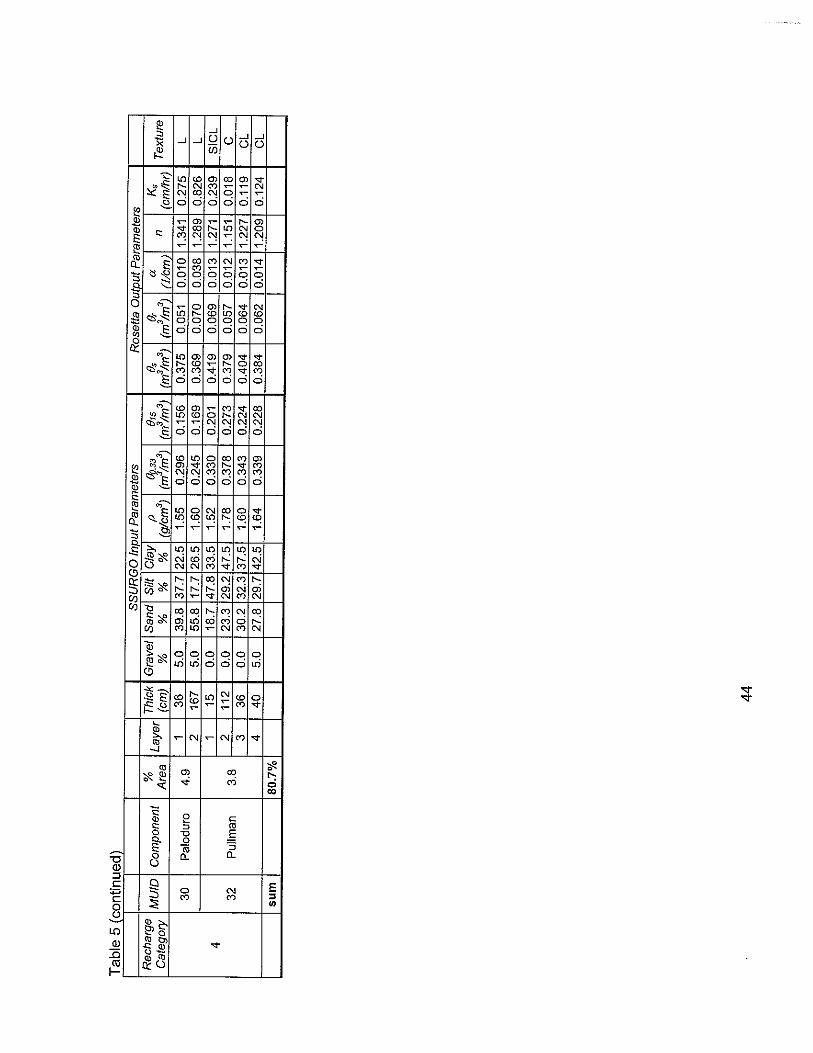
· _._.- - -_ .. - ... _--
SSURGO Input Parameters Rosetta Output ParametersRecharge MUID Component % Layer ThIck Gravel Sand Slit Clay p 80.33 0,5 Os 0, a Ks TextureCategory Area (em) % % % % Ilglcm3
) (m3Im3) (m3Im3
) Ilm3lm3) (m3Im3
) If/emn
(emlhr)
30 Paloduro 4.9 1 36 5.0 39.8 37.7 22.5 1.55 0.296 0.156 0.375 0.051 0.010 1.341 0.275 L2 167 5.0 55.8 17.7 26.5 1.60 0.245 0.169 0.369 0.070 0.038 1.289 0.826 L
41 15 0.0 18.7 47.8 33.5 1.52 0.330 0.201 0.419 0.069 0.013 1.271 0.239 SICL2 112 0.0 23.3 29.2 47.5 1.78 0.378 0.273 0.379 0.057 0.012 1.151 0.018 C32 Pullman 3.83 36 0.0 30.2 32.3 37.5 1.60 0.343 0.224 0.404 0.064 0.013 1.227 0.119 CL4 40 5.0 27.8 29.7 42.5 1.64 0.339 0.228 0.384 0.062 0.014 1.209 0.124 CL
sum 80.7%
44
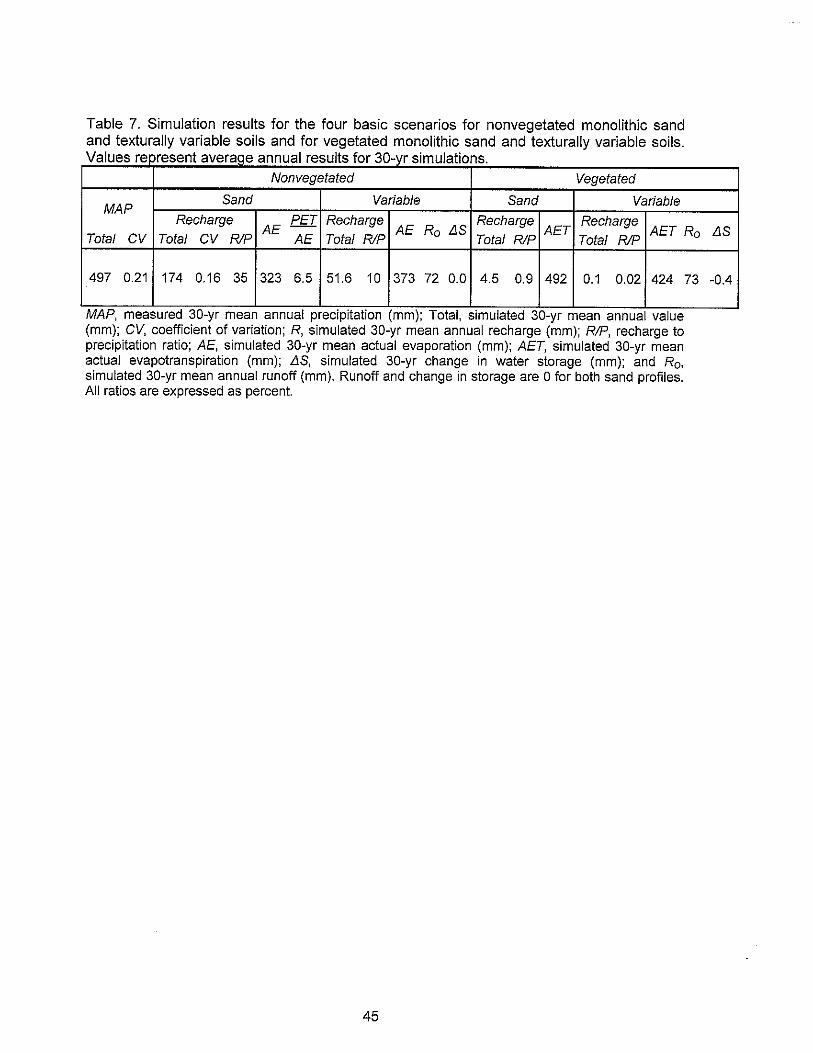
Table 7. Simulation results for the four basic scenarios for nonvegetated monolithic sandand texturally variable soils and for vegetated monolithic sand and texturally variable soils.V I I I f
MAP, measured 30-yr mean annual precipitation (mm), Total, simulated 30-yr mean annual value(mm); CV, coefficient of variation; R, simulated 30-yr mean annual recharge (mm); RIP, recharge toprecipitation ratio; AE, simulated 30-yr mean actual evaporation (mm); AET, simulated 30-yr meanactual evapotranspiration (mm); LIS, simulated 30-yr change in water storage (mm); and Ro,simulated 30-yr mean annual runoff (mm). Runoff and change in storage are 0 for both sand profiles.All ratios are expressed as percent.
a ues re :Jresent averaQe annua resu ts or 30-yr simulations.
Nonvegetated Vegetated
MAPSand Variable Sand Variable
RechargeAE
PET RechargeAE Ro LIS
RechargeAET
RechargeAET Ro LIS
Total CV Total CV RIP AE Total RIP Total RIP Total RIP
497 0.21 174 0.16 35 323 6.5 51.6 10 373 72 0.0 4.5 0.9 492 0.1 0.02 424 73 -0.4
..
45
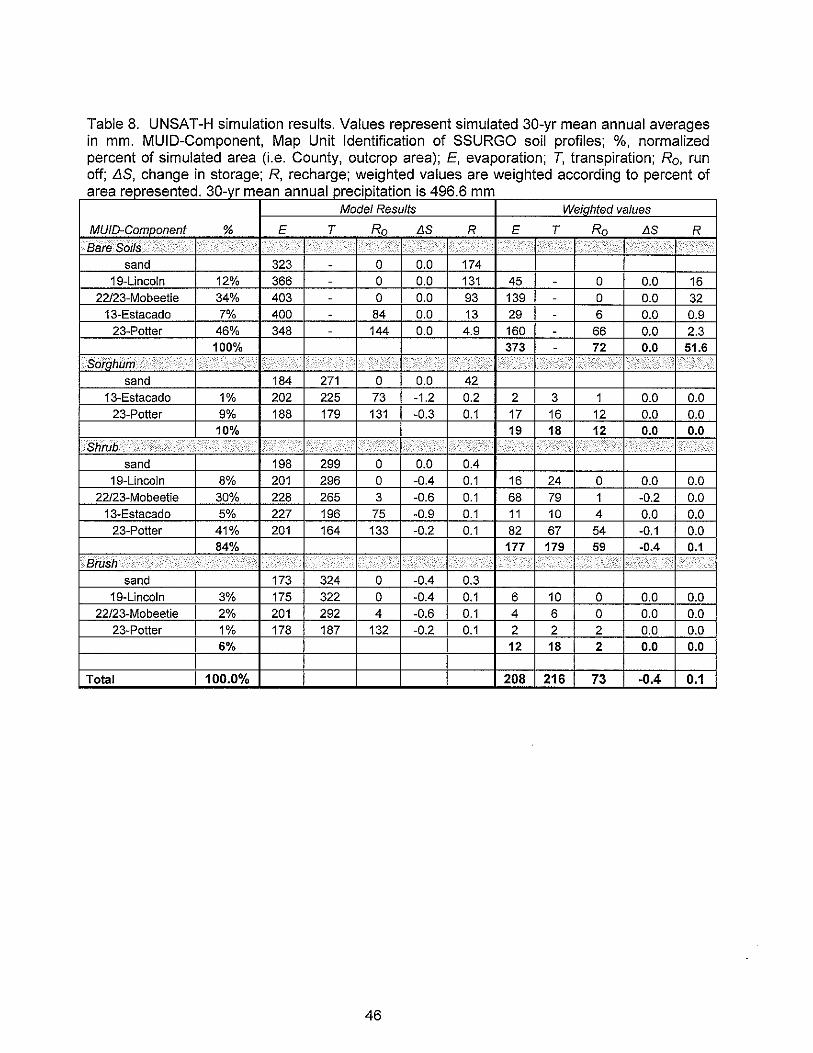
Table 8. UNSAT-H simulation results. Values represent simulated 30-yr mean annual averagesin mm. MUID-Component, Map Unit Identification of SSURGO soil profiles; 'Yo, normalizedpercent of simulated area (i.e. County, outcrop area); E, evaporation; T, transpiration; Ro, runoff; LIS, change in storage; R, recharge; weighted values are weighted according to percent of
d 30 I' . 4966area represente -yr mean annua precIPitation IS mmModel Results Weiahted values
MUID-Comoonent % E T Ro LIS R E T Ro LIS R
Bare Soils
sand 323 - a 0.0 17419-Lincoln 12% 366 - a 0.0 131 45 - a 0.0 16
22/23-Mobeetie 34% 403 - a 0.0 93 139 - a 0.0 3213-Estacado 7% 400 - 84 0.0 13 29 - 6 0.0 0.9
23-Potter 46% 348 - 144 0.0 4.9 160 - 66 0.0 2.3100% 373 - 72 0.0 51.6
sand 184 271 0 0.0 4213-Estacado 1% 202 225 73 -1.2 0.2 2 3 1 0.0 0.0
23-Potter 9% 188 179 131 -0.3 0.1 17 16 12 0.0 0.010% 19 18 12 0.0 0.0
Shrub
sand 198 299 a 0.0 0.419-Lincoln 8% 201 296 a -0.4 0.1 16 24 a 0.0 0.0
22/23-Mobeetie 30% 228 265 3 -0.6 0.1 68 79 1 -0.2 0.013-Estacado 5% 227 196 75 -0.9 0.1 11 10 4 0.0 0.0
23-Potter 41% 201 164 133 -0.2 0.1 82 67 54 -0.1 0.084% 177 179 59 -0.4 0.1
Brush
sand 173 324 a -0.4 0.319-Lincoln 3% 175 322 a -0.4 0.1 6 10 a 0.0 0.0
22/23-Mobeetie 2% 201 292 4 -0.6 0.1 4 6 a 0.0 0.023-Potter 1% 178 187 132 -0.2 0.1 2 2 2 0.0 0.0
6% 12 18 2 0.0 0.0
Total 100.0% 208 216 73 -0.4 0.1
46
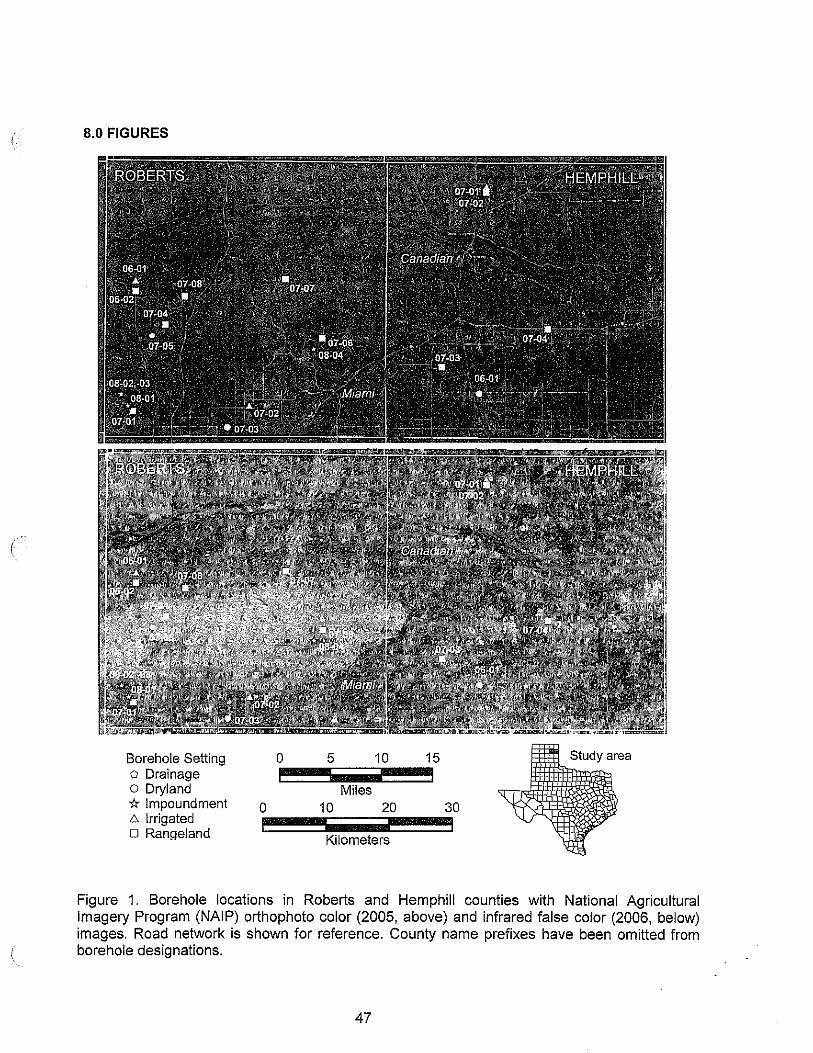
8.0 FIGURES
Borehole Setting 0 5 10 15o Drainage I io Dryland Miles1< Impoundment 0 10 20 30to, Irrigated i Io Ran>leland Kilometers
Figure 1. Borehole locations in Roberts and Hemphill counties with National AgriculturalImagery Program (NAIP) orthophoto color (2005, above) and infrared false color (2006, below)images. Road network is shown for reference. County name prefixes have been omitted fromborehole designations.
47
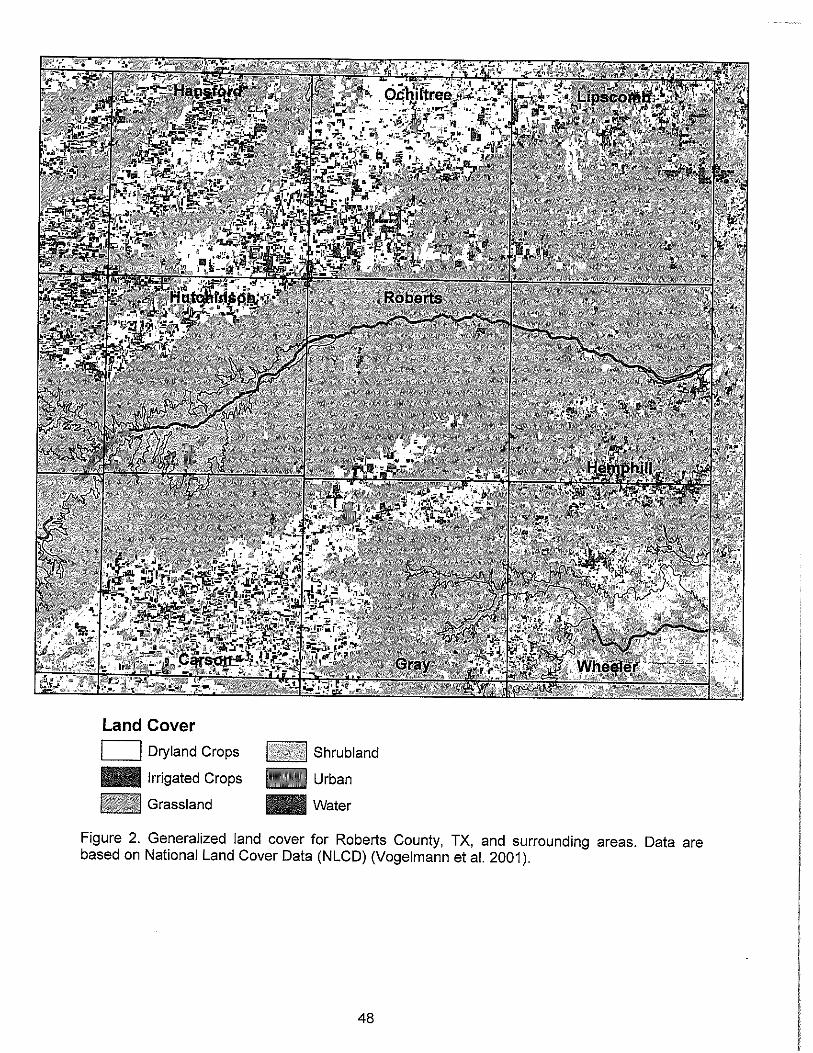
Land Cover
o Dryland Crops
III Irrigated Crops
Grassland
Shrubland
III Urban
III Water
Figure 2. Generalized land cover for Roberts County, TX, and surroundingbased on National Land Cover Data (NLCD) (Vogelmann et al. 2001).
48
areas. Data are
II
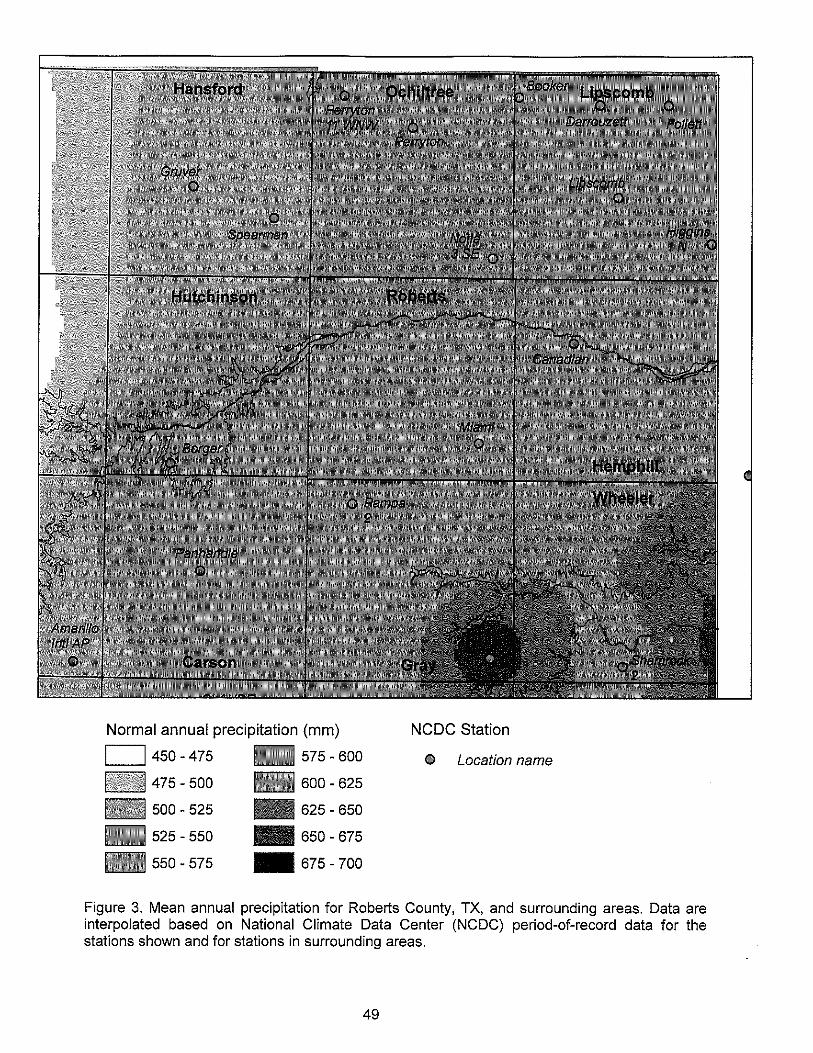
Normal annual precipitation (mm)
o 450 - 475 IE 575 - 600
475 - 500 IE 600 - 625
500 - 525 IE 625 - 650
IE 525 - 550 _ 650 - 675
IE 550 - 575 _ 675 - 700
NCDC Station
It Location name
Figure 3. Mean annual precipitation for Roberts County, TX, and surrounding areas. Data areinterpolated based on National Climate Data Center (NCDC) period-of-record data for thestations shown and for stations in surrounding areas.
49
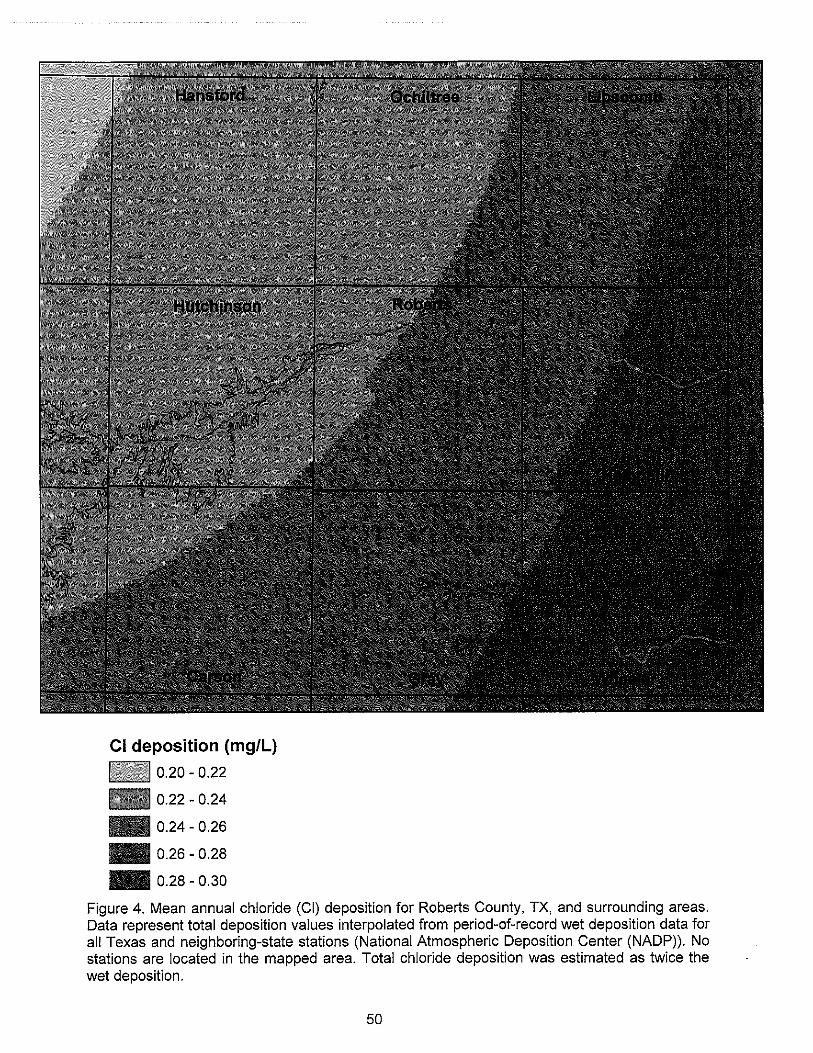
CI deposition (mg/L)
0.20 - 0.22
.. 0.22-0.24
.. 0.24-0.26
.. 0.26-0.28
_ 0.28-0.30
Figure 4. Mean annual chloride (CI) deposition for Roberts County, TX, and surrounding areas.Data represent total deposition values interpolated from period-of-record wet deposition data forall Texas and neighboring-state stations (National Atmospheric Deposition Center (NADP)). Nostations are located in the mapped area. Total chloride deposition was estimated as twice thewet deposition.
50
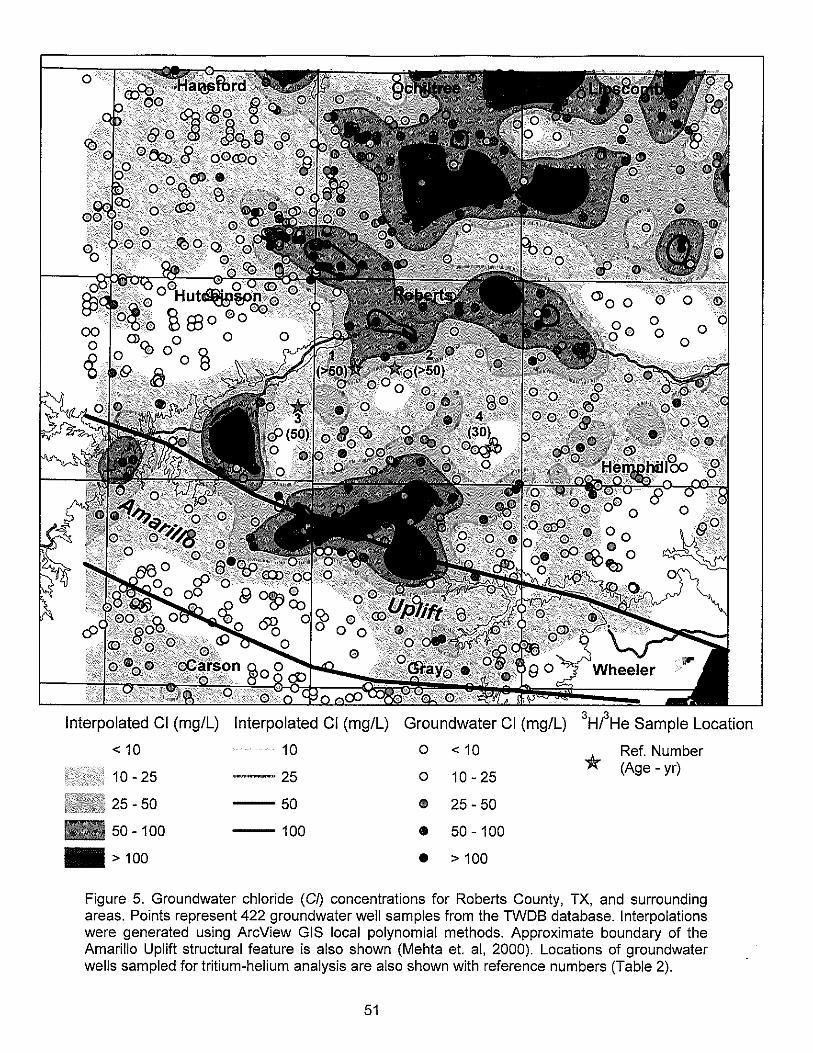
cP
Interpolated CI (mg/L) Interpolated CI (mg/L) Groundwater CI (mg/L) 3HrHe Sample Location
< 10 10 0 < 10
*Ref. Number(Age - yr)
10 - 25 25 @ 10 - 25
25 - 50 50 • 25 - 50
.. 50-100 100 • 50 - 100
_>100 • > 100
Figure 5. Groundwater chloride (CD concentrations for Roberts County, TX, and surroundingareas. Points represent 422 groundwater well samples from the TWDB database. Interpolationswere generated using ArcView GIS local polynomial methods. Approximate boundary of theAmarillo Uplift structural feature is also shown (Mehta et. ai, 2000). Locations of groundwaterwells sampled for tritium-helium analysis are also shown with reference numbers (Table 2).
51
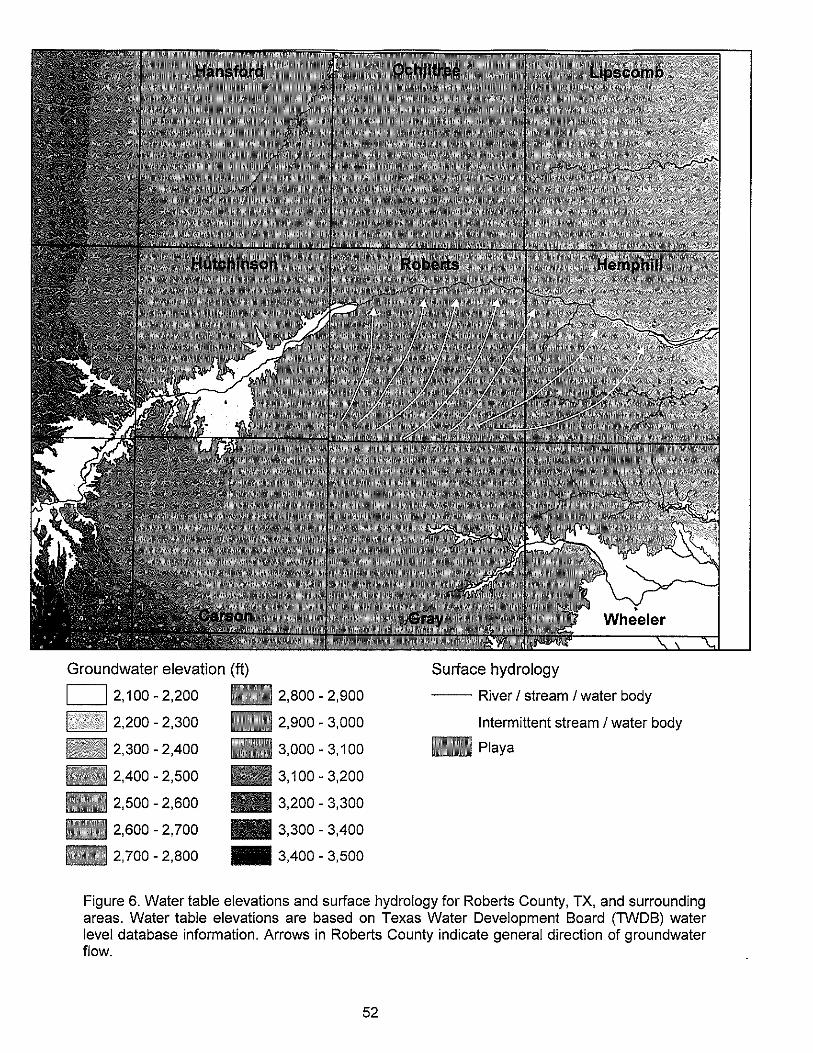
Groundwater elevation (tt)
02,100-2,200 2,800-2,900
~""" 2,200 - 2,300 2,900 - 3,000
2,300 - 2,400 3,000 - 3,100
2,400 - 2,500 3,100 - 3,200
... 2,500 - 2,600 _ 3,200 - 3,300
... 2,600 - 2,700 _ 3,300 - 3,400
2,700 - 2,800 _ 3,400 - 3,500
Surface hydrology
-- River I stream I water body
Intermittent stream I water body
_ Playa
Figure 6. Water table elevations and surface hydrology for Roberts County, TX, and surroundingareas. Water table elevations are based on Texas Water Development Board (TWDB) waterlevel database information. Arrows in Roberts County indicate general direction of groundwaterflow.
52
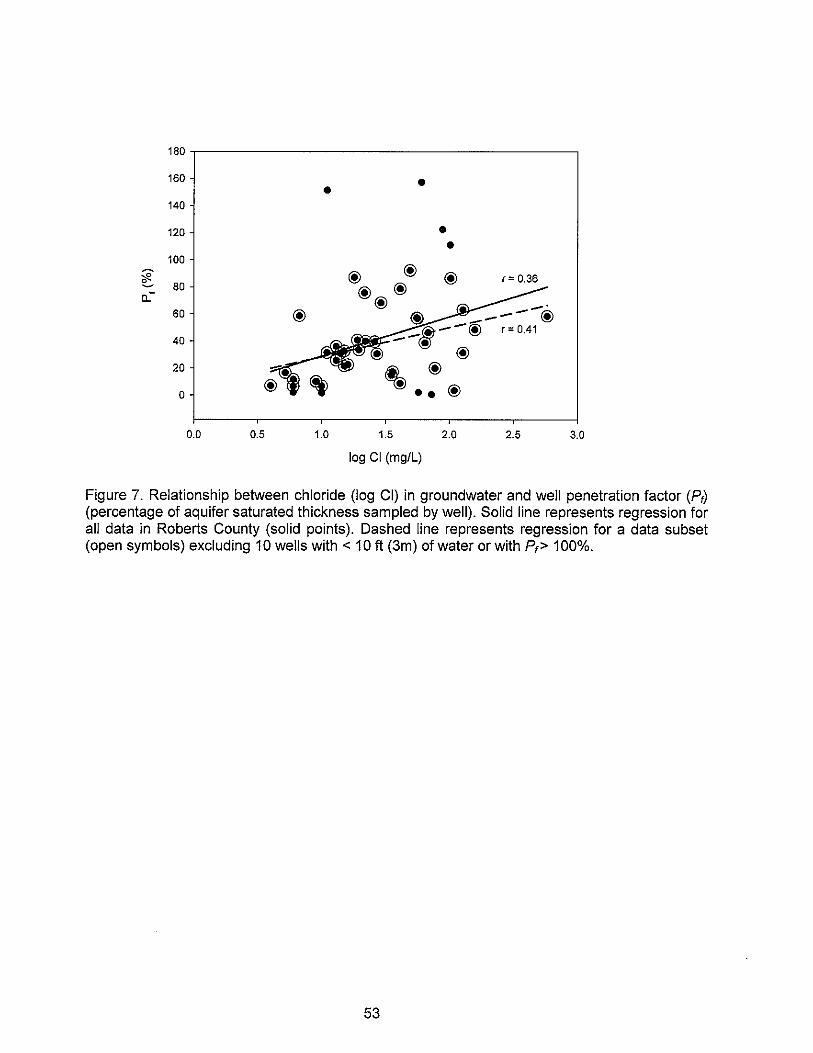
180
160 ••140
120 ••100
~
@ @@~ ,= 0.36
80@@
@cL -'60 @ @ ---- @
,--@ ,=0.4140 --.
• @20 ~ @
@0 ••
0.0 0.5 1.0 1.5 2.0 2.5 3.0
log CI (mg/L)
Figure 7. Relationship between chloride (log CI) in groundwater and well penetration factor (P,)(percentage of aquifer saturated thickness sampled by well). Solid line represents regression forall data in Roberts County (solid points). Dashed line represents regression for a data subset(open symbols) excluding 10 wells with < 10 ft (3m) of water or with p,> 100%.
53
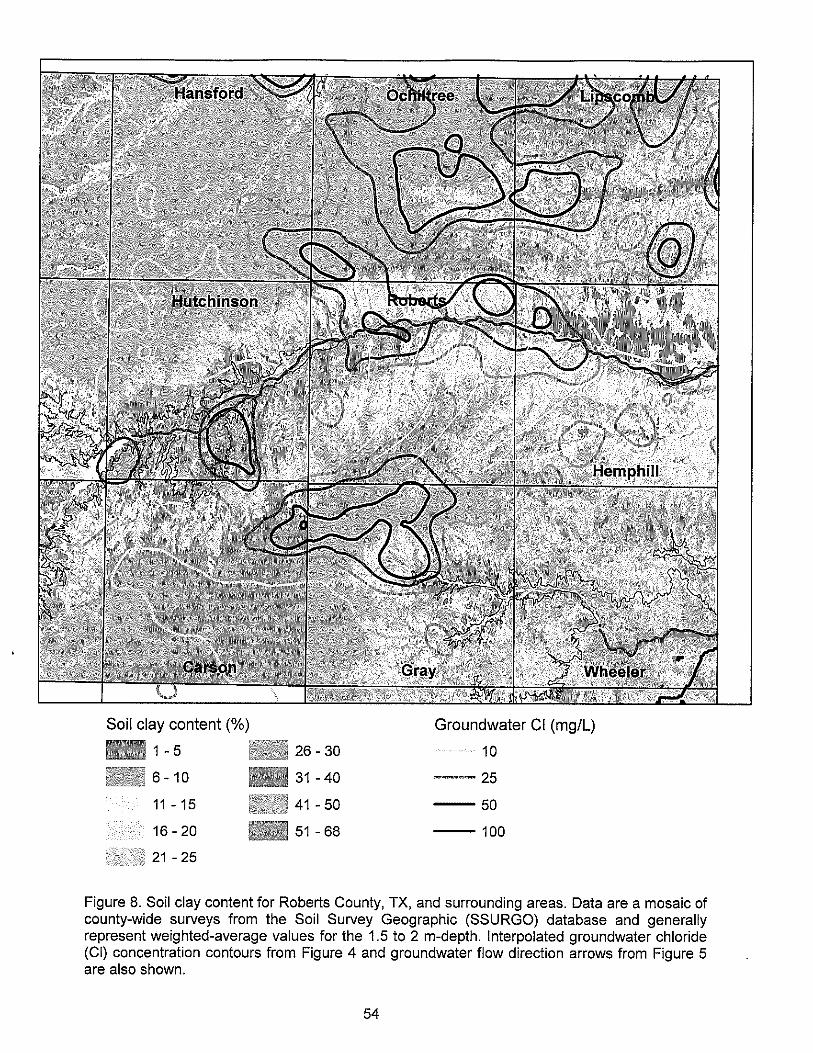
Soil clay content (%)
1 - 5
6 -10
11 - 15
16 - 20
21 - 25
26 - 30
31 - 40
41 - 50
51 - 68
Groundwater CI (mg/L)
10
--25
--50
--100
Figure 8. Soil clay content for Roberts County, TX, and surrounding areas. Data are a mosaic ofcounty-wide surveys from the Soil Survey Geographic (SSURGO) database and generallyrepresent weighted-average values for the 1.5 to 2 m-depth. Interpolated groundwater chloride(CI) concentration contours from Figure 4 and groundwater flow direction arrows from Figure 5are also shown.
54
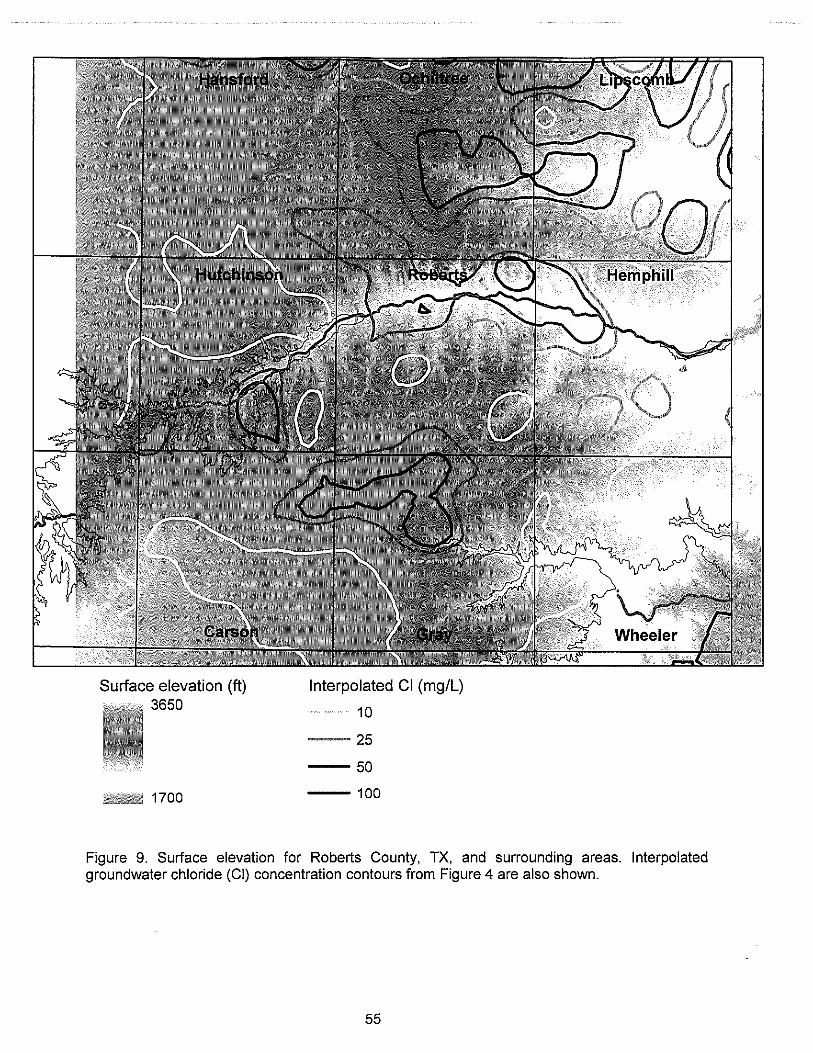
Surface elevation (tt)3650
__ 1700
Interpolated CI (mg/L)
10
~~25
--50
--100
Figure 9. Surface elevation for Roberts County, TX, and surrounding areas. Interpolatedgroundwater chloride (CI) concentration contours from Figure 4 are also shown.
55
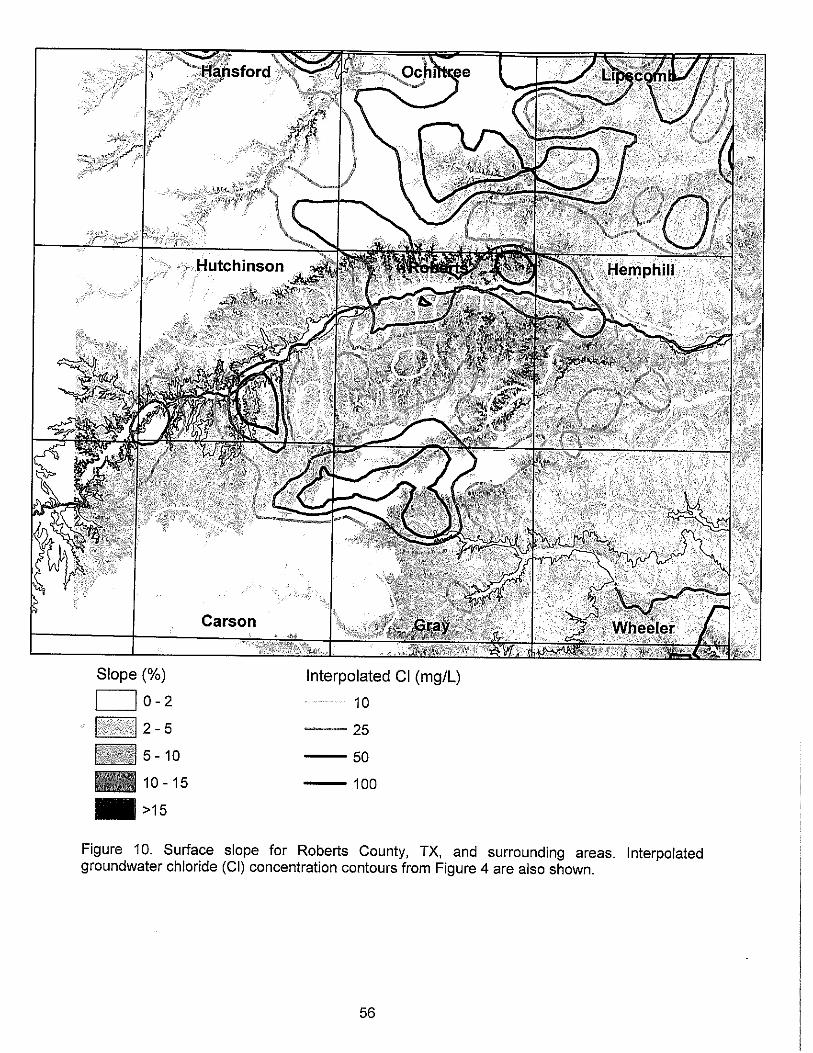
Slope (%)
00-2
'------' 2 - 5
5 -10
l1li10-15
_>15
Carson
Interpolated CI (mg/L)
10
--25
--50
--100
Figure 10. Surface slope for Roberts County, TX, and surrounding areas. Interpolatedgroundwater chloride (CI) concentration contours from Figure 4 are also shown.
56
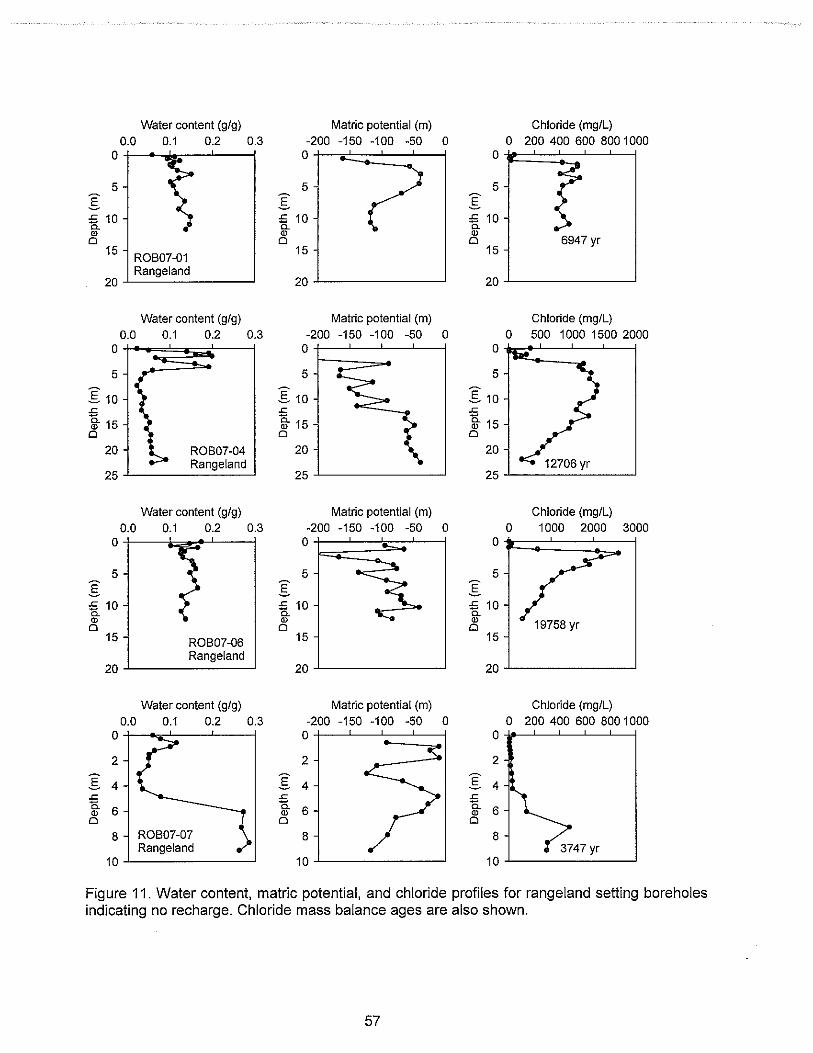
Water content (gig) Matric potential (m) Chloride (mglL)0.0 0.1 0.2 0.3 -200 -150 -100 -50 0 0 200 400 600 800 1000
0 0
?0
5 5 5E E ..s£ 10 £ 10 £ 10a. a. a.Q) Q) Q)
0 0 0 6947 yr15 ROB07-01
15 15
Rangeland20 20 20
Water content (gig) Matric potential (m) Chloride (mgIL)0.0 0.1 0.2 0.3 -200 -150 -100 -50 0 0 500 1000 1500 2000
0,
0 0
5 or 5 5
E 10 ~ E 10 E 10£
~.c £
i} 15 g. 15 i} 150 0 0
20 ! ROB07-04 20 20Rangeland
2525 25
Water content (gig) Matric potential (m) Chloride (mglL)0.0 0.1 0.2 0.3 -200 -150 -100 -50 0 0 1000 2000 3000
0 0 0
55 5E E ..s£ 10 £ 10 £ 10a. a. a.Q) Q) Q)
19758 yr0 0 015 ROB07-06 15 15
Rangeland20 20 20
Water content (gig) Matric potential (m) Chioride (mglL)0.0 0.1 0.2 0.3 -200 -150 -100 -50 0 0 2004006008001000
0 0 0
2 2 2
E 4 E 4 E 4.c .c .c15. 6 15. 6 15. 6Q) Q) Q)
0 0 0
8 ROB07-07 8 8Rangeland 3747 yr
10 10 10
Figure 11. Water content, matric potential, and chloride profiles for rangeland setting boreholesindicating no recharge. Chloride mass balance ages are also shown.
57
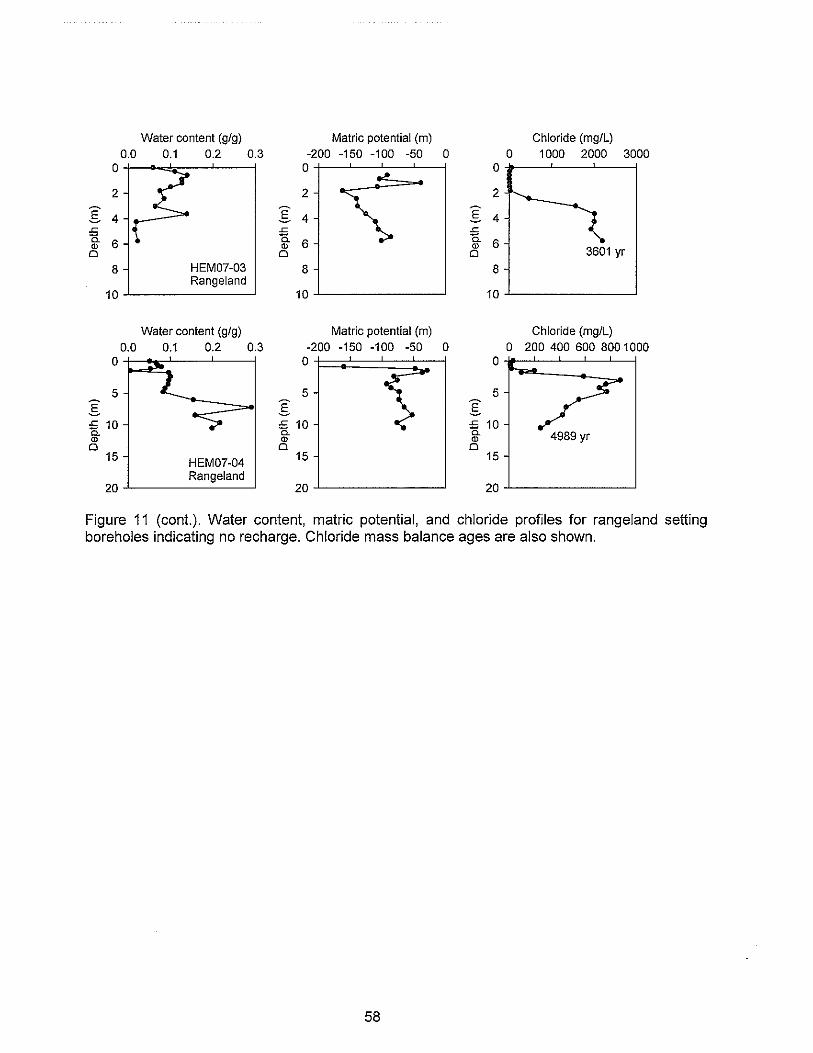
Water content (gig) Matric potential (m) Chioride (mg/L)0.0 0.1 0.2 0.3 -200 -150 -100 -50 0 0 1000 2000 3000
0 0 0
2 2 -
~2
.s 4 E 4 .s 4£; .c .cc. 6 15. 6 15. 6Q) Q) Q)
3601 yr0 0 0
8 HEM07-03 8 8Rangeland
10 10 10
Water content (gig) Matrlc potential (m) Chloride (mg/L)0.0 0.1 0.2 0.3 -200 -150 -100 -50 0 0 200 400 600 800 1000
0 0 0
5 5 5E E E£; 10 £; 10 £; 10c. c. c. 4989 yrQ) Q) Q)
0 0 015 HEM07-04
15 15
Rangeland20 20 20
Figure 11 (cont.). Water content, matric potential, and chloride profiles for rangeland settingboreholes indicating no recharge. Chloride mass balance ages are also shown.
58
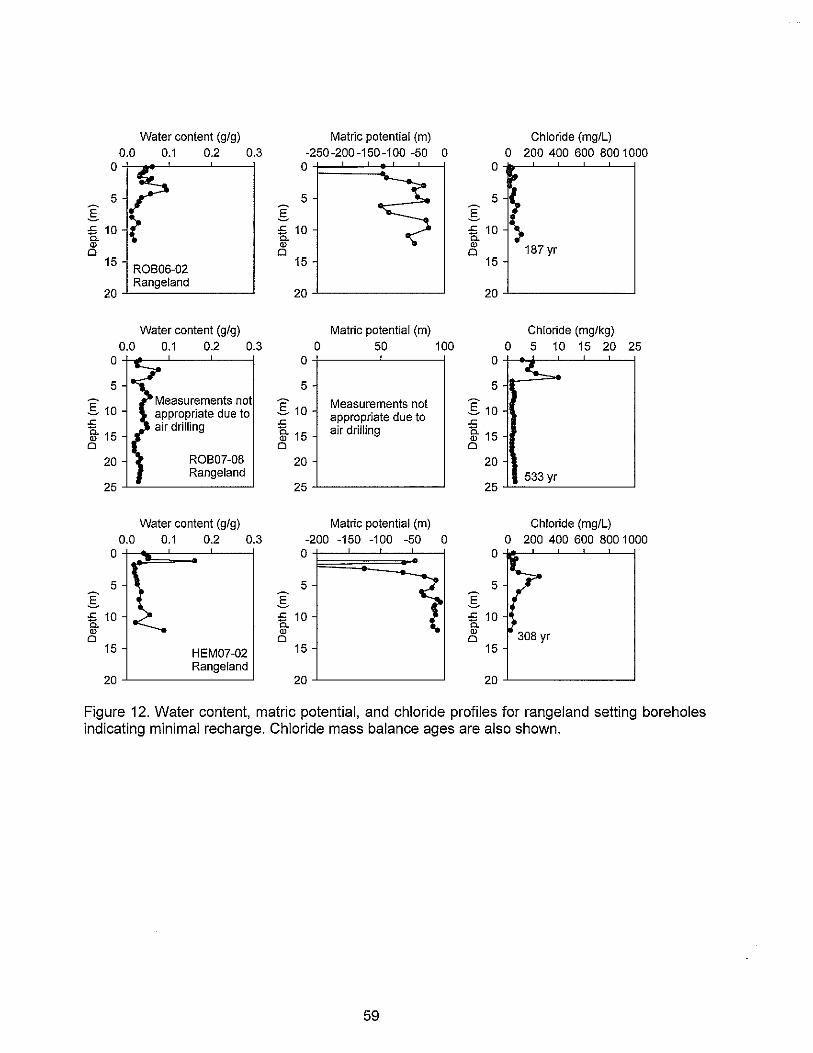
Water content (gig) Matric potential (m) Chloride (mg/L)0.0 0.1 0.2 0.3 -250 -200 -150 -1 00 -50 0 0 2004006008001000
0 0 0,
•5 5 5 ItE E E
'" 10 '" 10 '" 10 :-"- "- "-Q) Q) Q)
0 0 0 187 yr15
ROB06-0215 15
Rangeland20 20 20
Water content (gig) Matric potentiai (m) Chloride (mg/kg)0.0 0.1 0.2 0.3 0 50 100 0 5 10 15 20 25
0 0,
0~
5 5 5
E 10Measurements not
oS 10Measurements not oS 10appropriate due to appropriate due to.c air drilling '" '"g. 15 i} 15 air drilling i} 15
0 0 0
20 ROB07-08 20 20Rangeland 533 yr
25 25 25
Water content (gig) Matric potential (m) Chloride (mg/L)0.0 0.1 0.2 0.3 -200 -150 -100 -50 0 0 200 400 600 800 1000
0 0 0
5 5 5E E oS'" 10 '" 10 '" 10"- "- "-Q) Q) Q)
308 yr0 0 015 HEM07-02 15 15
Rangeland20 20 20
Figure 12. Water content, matric potential, and chloride profiles for rangeland selling boreholesindicating minimal recharge. Chloride mass balance ages are also shown.
59
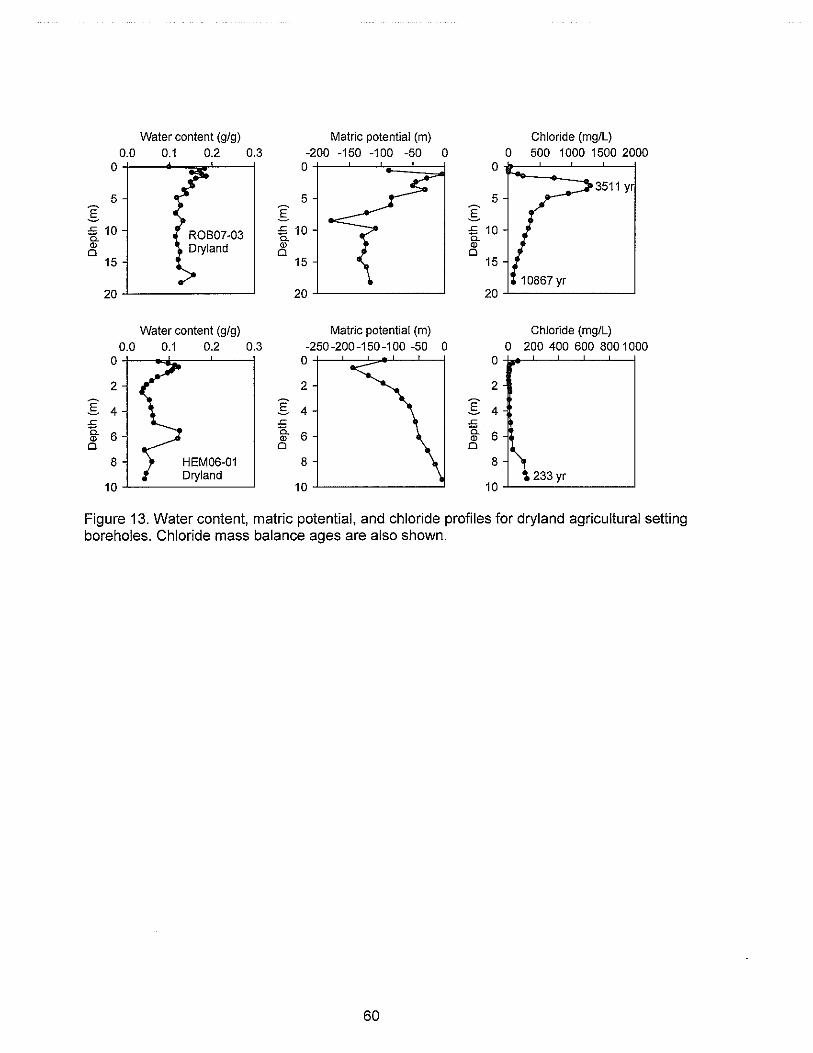
Water content (gig) Matric potential (m) Chloride (mg/L)0.0 0.1 0.2 0.3 -200 -150 -100 -50 0 0 500 1000 1500 2000
0 0 0
3511 Y5 5 5
E E E,s 10 ROB07-03 ,s 10 ,s 10a. a. a.
" Dryland " "0 0 015 15 15
20 20 20
Water content (gig) Matric potential (m) Chloride (mg/L)0.0 0.1 0.2 0.3 -250 -200 -150 -1 00 -50 0 0 200 400 600 800 1000
0 0 0,
2 2 2
E 4 S 4 E 4,s "" ,sa. 6 a. 6 a. 6 -" " "0 0 0
8 HEM06-01 8 8-\Dryland 233 yr
10 10 10
Figure 13. Water content, matric potential, and chloride profiles for dryland agricultural settingboreholes. Chloride mass balance ages are also shown.
60
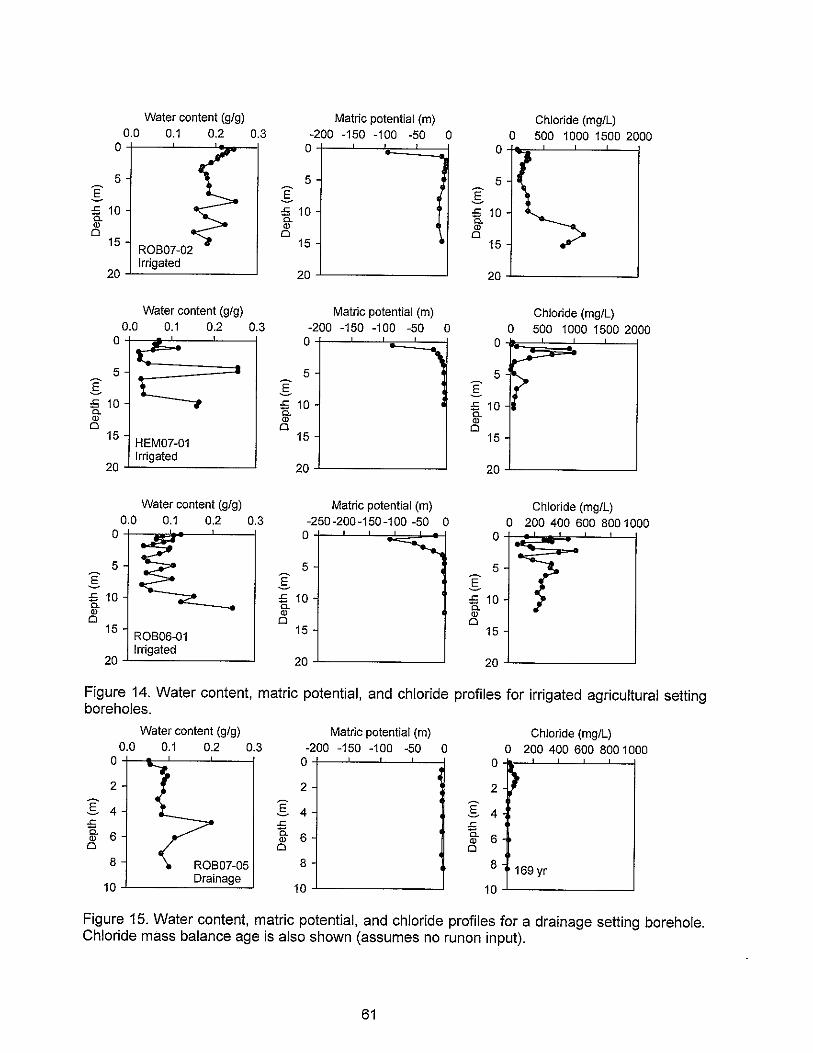
Water content (gig) Matric potential (m) Chioride (mg/L)0.0 0.1 0.2 0.3 -200 -150 -100 -50 0 0 500 1000 1500 2000
0 0,
0
5 5 - 5E E .s£; 10 £; 10 £; 10a. a. a.Q) Q) Q)
0 0 015
ROB07-0215 15
20Irrigated
20 20
Water content (gig) Matric potentiai (m) Chloride (mg/L)0.0 0.1 0.2 0.3 -200 -150 -100 -50 0 0 500 1000 1500 2000
0 0 0
I: , ,......5 5 5
~.s t E E:S 10 ...., £; 10 £ 10a. a. a.Q) Q) Q)
0 0 015
HEM07-0115 15
Irrigated20 20 20
Water content (gig) Matric potential (m) Chioride (mg/L)0.0 0.1 0.2 0.3 -250-200-150-100 -50 0 0 200 400 600 800 1000
0 0 0
5 5 5
.s E E£; 10 £; 10 £; 10a. a. a.Q) Q) Q)
0 0 015
ROB06-0115 15
Irrigated20 20 20
Figure 14. Water content, matric potential, and chloride profiles for irrigated agricultural settingboreholes.
Water content (gig) Matric potential (m) Chioride (mg/L)0.0 0.1 0.2 0.3 -200 -150 -100 -50 0 0 200 400 600 800 1000
0 0 0
• )2 2 2
E 4 .s 4 E 4 ;.<:: .<:: £;15. 6 15. 6 a. 6Q) Q) Q)
0 0 0
8 ROB07-05 8 8 169 yr
10Drainage
10 10
Figure 15. Water content, matric potential, and chloride profiles for a drainage setting borehole.Chloride mass balance age is also shown (assumes no runon input).
61
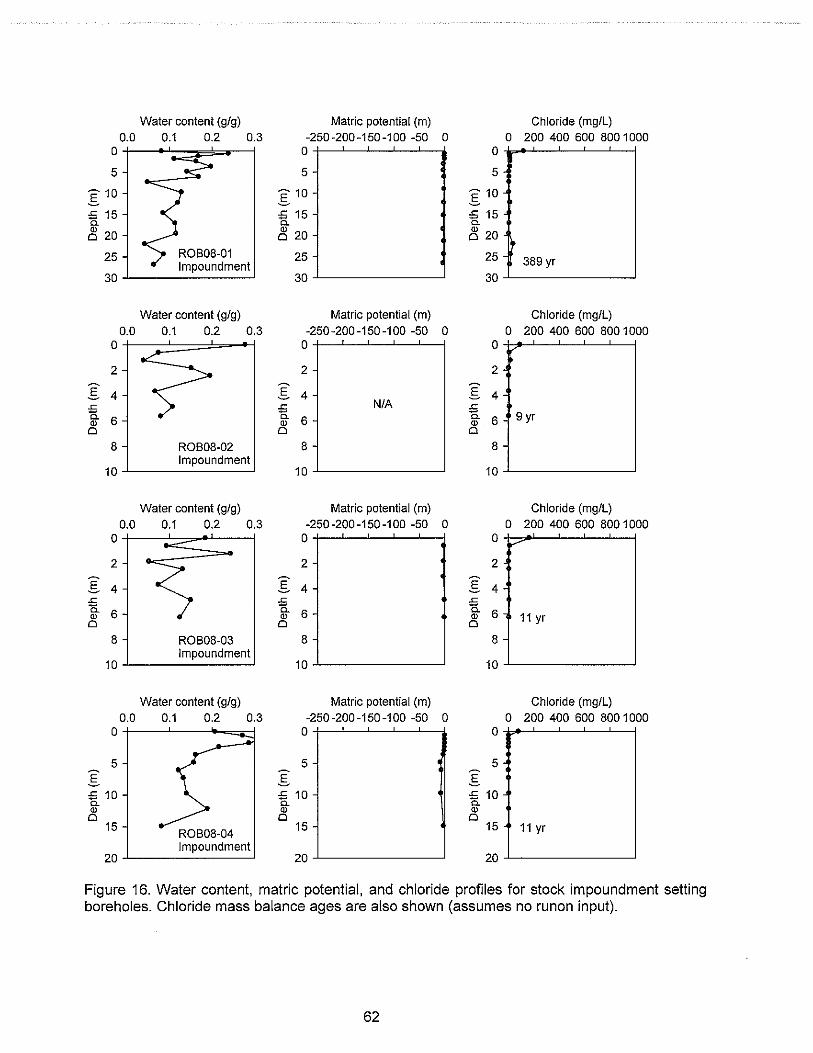
Water content (gig) Matric potential (m) Chloride (mg/L)0.0 0.1 0.2 0.3 -250 -200 -150 -1 00 -50 0 0 200 400 600 800 1000
0 0 0
5 5 5
-10 ~ 10 E 10"oS oS£ 15 :5 15 :S 150. 0. 0.
~ 20 ~ 20 ~ 20If
25 ROB08-01 25 25 389 yrImpoundment30 30 30
Water content (gig) Matric potential (m) Chloride (mg/L)0.0 0.1 0.2 0.3 -250 -200 -150 -1 00 -50 0 0 200 400 600 800 1000
0 0 0
2 2 2
E 4 oS 4 E 4.c
~N/A
~15. 6 6 6 9 yr" " "0 0 0
8 ROB08-02 8 8 -Impoundment
10 10 10
Water content (gig) Matric potentiai (m) Chloride (mg/L)0.0 0.1 0.2 0.3 -250 -200 -150 -1 00 -50 0 0 200 400 600 800 1000
0 0 0V
2 2 2
E 4 E 4 E 4.c
~ ~15. 6 6 6" " " 11 yr0 0 0
8 ROB08-03 8 8 -Impoundment
10 10 10
Water content (gig) Matric potential (m) Chloride (mg/L)0.0 0.1 0.2 0.3 -250 -200 -150 -1 00 -50 0 0 200 400 600 800 1000
0 0 0
5 5 5E E E
£ 10 £ 10 £ 100. 0. 0.
" " "0 0 015
ROB08-0415 15 11 yr
impoundment20 20 20
Figure 16. Water content, matric potential, and chloride profiles for stock impoundment settingboreholes. Chloride mass balance ages are also shown (assumes no runon input).
62
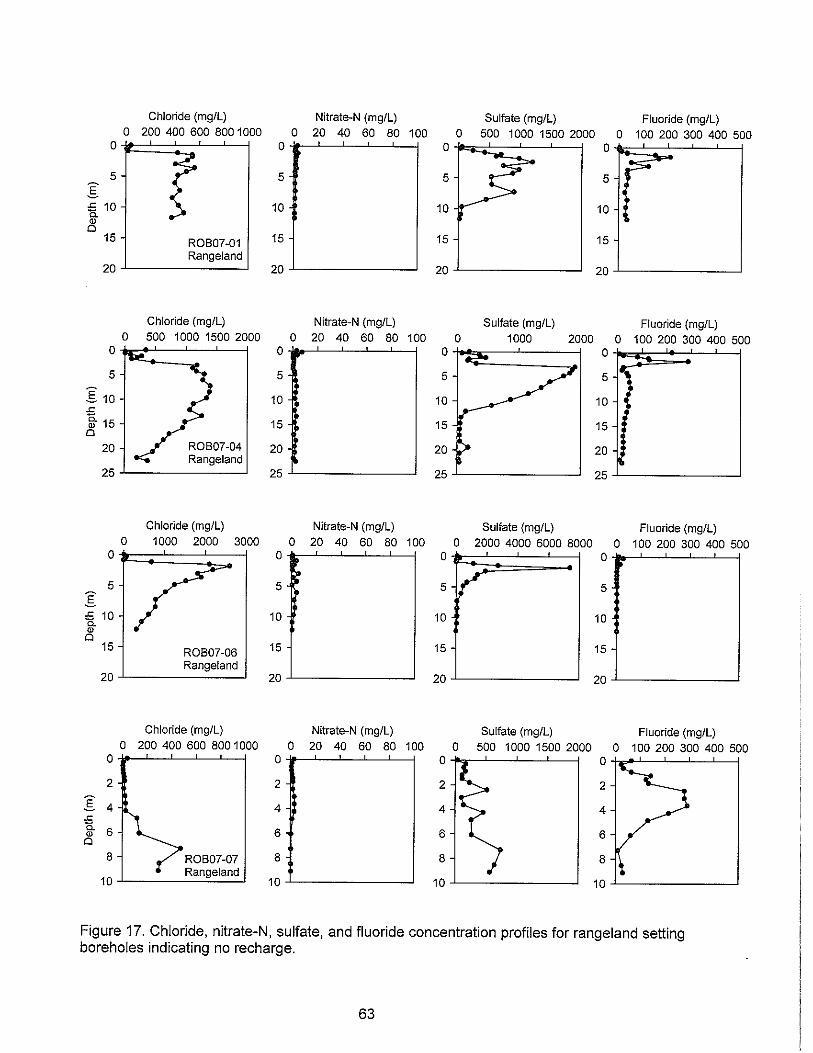
Chloride (mgIL) Nitrate-N (mgIL) Suifate (mgIL) Fluoride (mgIL)0 2004006008001000 0 20 40 60 80 100 0 500 1000 1500 2000 0 100 200 300 400 500
0 0 0 0,
• ~5 5 5 5
E
£ 10 10 10 10c-O>0
15 ROB07-01 15 15 15
Rangeiand20 20 20 20
Chioride (mgIL) Nitrate-N (mgIL) Sulfate (mgIL) Fluoride (mgIL)0 500 1000 1500 2000 0 20 40 60 80 100 0 1000 2000 0 100 200 300 400 500
0 0,
0 0,
5 5 5 5 I~
E 10 10 10 10£~ 15 15 15 150
20 ROB07-04 20 20 20Rangeland
25 25 25 25
Chloride (mgIL) Nitrate-N (mgIL) Sulfate (mglL) Fluoride (mglL)0 1000 2000 3000 0 20 40 60 80 100 0 2000 4000 6000 8000 0 100 200 300 400 500
0 0 0 0
~ r5 5 5 5E
£ 10 10 10 10c-O>0
15 ROB07-06 15 15 15
Rangeland20 20 20 20
Chloride (mgIL) Nitrate-N (mglL) Sulfate (mgIL) Fluoride (mglL)0 200 400 600 800 1000 0 20 40 60 80 100 500 1000 1500 2000 100 200 300 400 500
0 0
2 2 2 2
E 4 4 4 4£c- 6 6 6 60>0
8 ROB07-07 8 8 8
10Rangeland
10 10 10
Figure 17. Chloride, nitrate-N, sulfate, and fluoride concentration profiles for rangeland settingboreholes indicating no recharge.
63
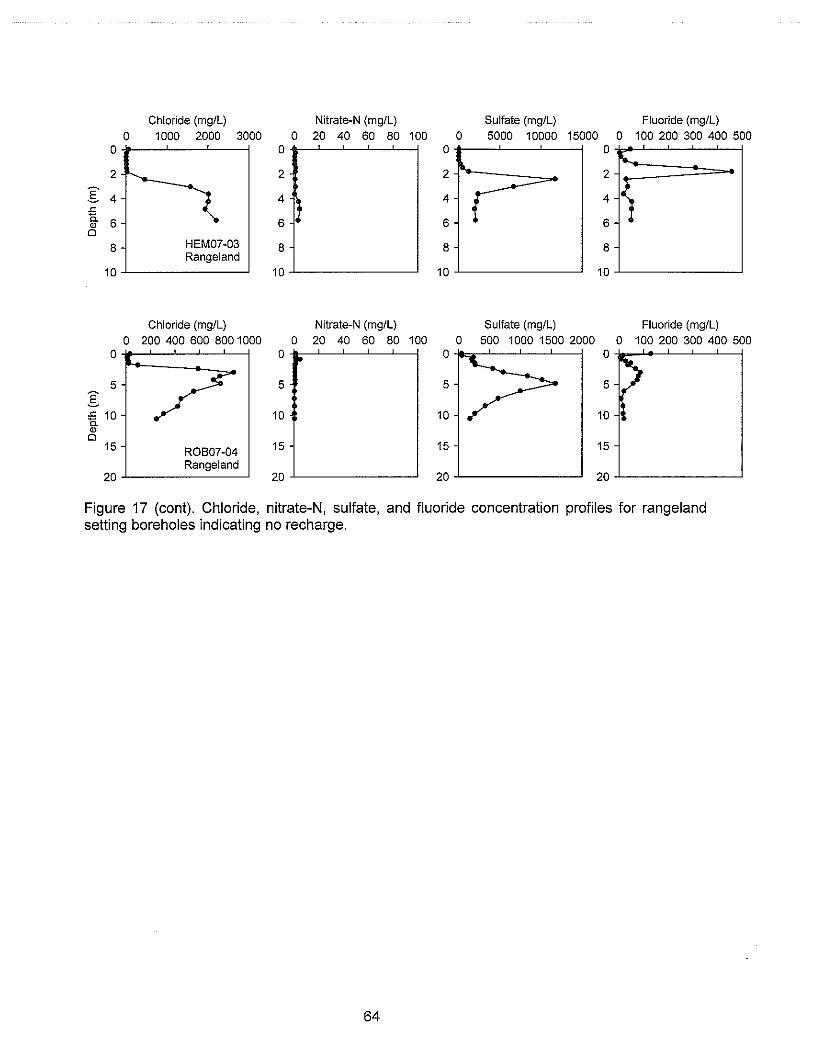
Chloride (mg/L) Nitrate-N (mg/L) Sulfate (mg/L) Fluoride (mg/L)
0 1000 2000 3000 0 20 40 60 80 100 0 5000 10000 15000 0 100 200 300 400 5000 0 0 0
,....
2 2 2 2 -
E )4 4 4 4£; ,Co 6 6 6 6QlCl
8 HEM07-03 8 8 8Rangeland
10 10 10 10
Chloride (mg/L) Nitrate-N (mg/L) Sulfate (mg/L) Fluoride (mg/L)0 200 400 600 800 1000 0 20 40 60 80 100 500 1000 1500 2000 100 200 300 400 500
0 0
5 5 5 5E£; 10 10 10 10CoQlCl
15 ROB07-04 15 15 15
Rangeland20 20 20 20
Figure 17 (cont). Chloride, nitrate-N, sulfate, and fluoride concentration profiles for rangelandsetting boreholes indicating no recharge.
64
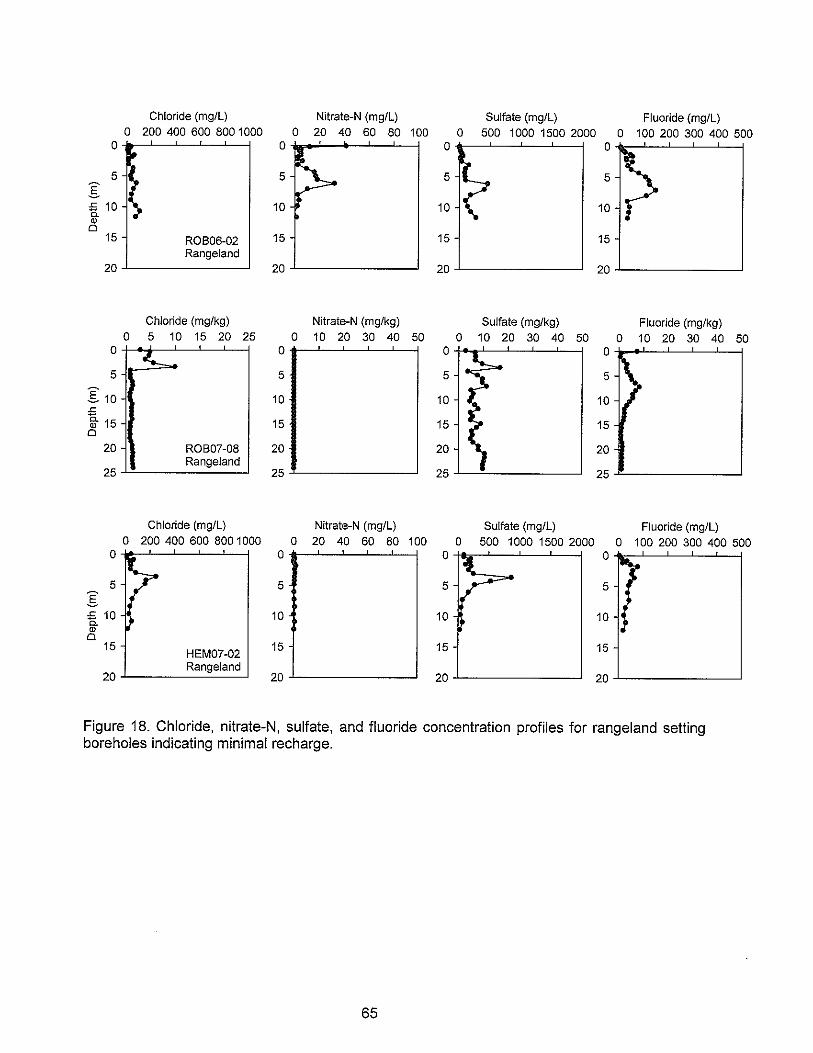
Chloride (mg/L) Nitrate-N (mg/L) Sulfate (mg/L) Fluoride (mg/L)0 2004006008001000 20 40 60 80 100 0 500 1000 1500 2000 100 200 300 400 500
0 0•5 I- 5 5 5
&.s 10 I) 10 10 10c-O>
015 ROB06-02 15 15 15
Rangeland20 20 20 20
Chloride (mg/kg) Nitrate-N (mg/kg) Sulfate (mg/kg) Fluoride (mg/kg)0 5 10 15 20 25 0 10 20 30 40 50 10 20 30 40 50 10 20 30 40 50
0, ,
0,
~5 5 5 5
E 10 10 10 10.sij} 15 15 15 150
20 ROB07-08 20 20 20Rangeland
25 25 25 25
Chloride (mg/L) Nitrate-N (mg/L) Sulfate (mg/L) Fluoride (mg/L)0 200 400 600 800 1000 0 20 40 60 80 100 500 1000 1500 2000 0 100 200 300 400 500
0 0 0 -r5 5 5 5
E
:S 10 10 10 10c-O>0
15HEM07-02
15 15 15
Rangeland20 2020 20
Figure 18. Chloride, nitrate-N, sulfate, and fluoride concentration profiles for rangeland settingboreholes indicating minimal recharge.
65
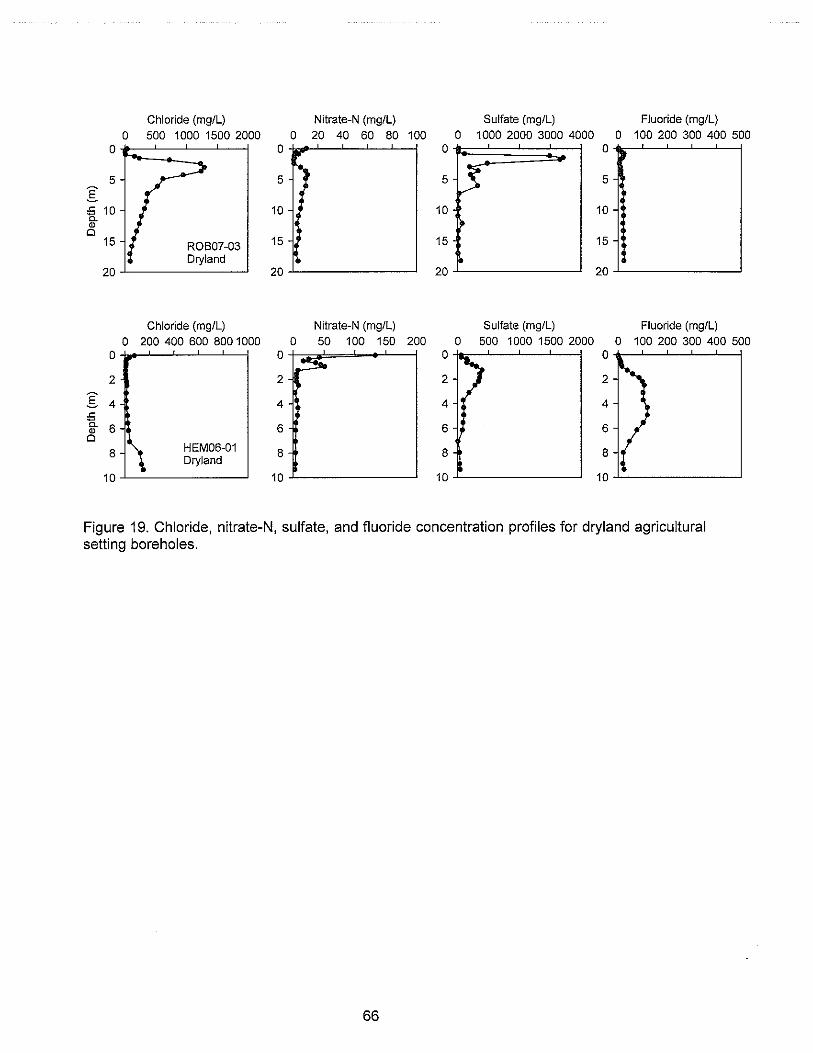
Chloride (mg/L) Nitrate-N (mg/L) Sulfate (mg/L) Fluoride (mg/L)
0 500 1000 1500 2000 0 20 40 60 80 100 0 1000 2000 3000 4000 0 100 200 300 400 5000 0 ..- 0 0
') J5 5 5 5E
,:S 10 10 10 100- j>QlCl
15 ROB07-03 15 15 15
Dryland20 20 20 20
Chloride (mg/L) Nitrate-N (mg/L) Sulfate (mg/L) Fluoride (mg/L)0 2004006008001000 0 50 100 150 200 500 1000 1500 2000 100 200 300 400 500
0 0
>2 2~
2 2
E 4 4 4 4,50- 6- 6 6 6QlCl
8-"'\HEM06-01 8 8 8Dryland
10 10 10 10
Figure 19. Chloride, nitrate-N, sulfate, and fluoride concentration profiles for dryland agriculturalsetting boreholes.
66
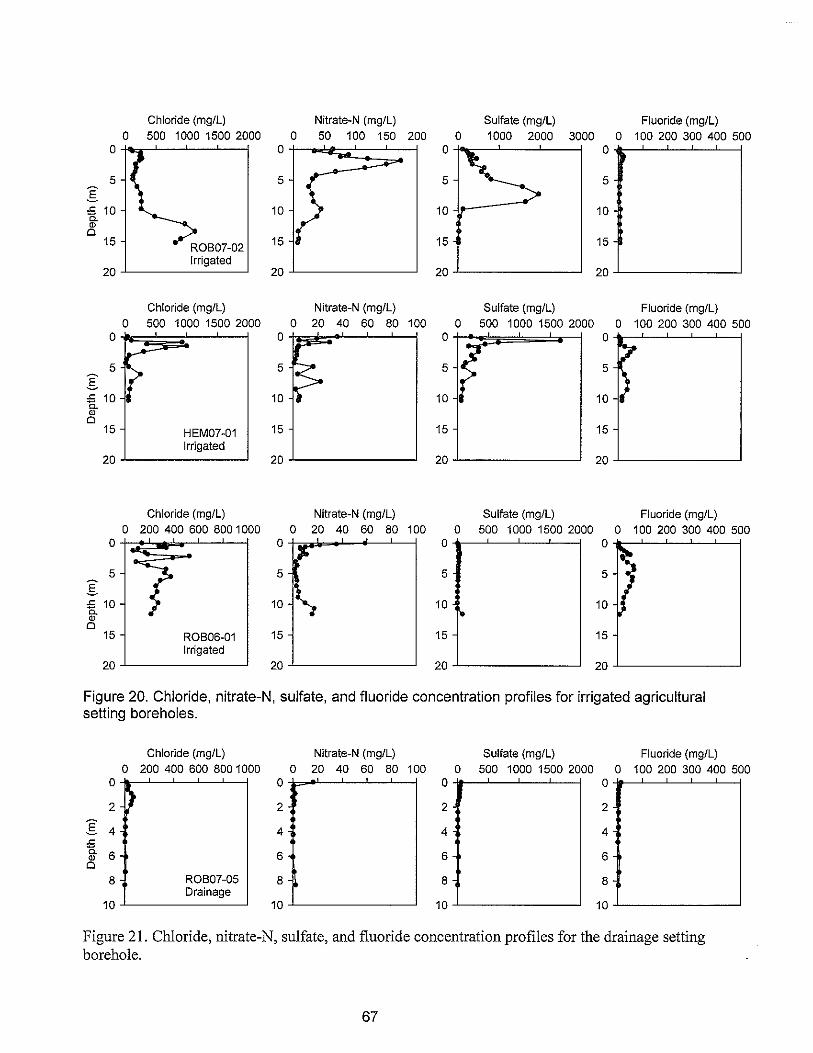
Chloride (mg/L) Nitrate-N (mg/L) Sulfate (mg/L) Fluoride (mg/L)500 1000 1500 2000 0 50 100 150 200 1000 2000 3000 0 100 200 300 400 500
0 0
5 5 5 5E£; 10 10 10 10c-
"015 ROB07-02 15 15 15
Irrigated20 20 20 20
Chloride (mg/L) Nitrate-N (mg/L) Sulfate (mg/L) Fluoride (mg/L)0 500 1000 1500 2000 0 20 40 60 80 100 500 1000 1500 2000 100 200 300 400 500
0 0
r-5 ( 5 5 5
E£; 10 10 10 10c-
"015 HEM07-01 15 15 15
Irrigated20 20 20 20
Chioride (mg/L) Nitrate-N (mg/L) Sulfate (mg/L) Fluoride (mg/L)0 200 400 600 800 1000 0 20 40 60 80 100 0 500 1000 1500 2000 100 200 300 400 500
0 0 r 0
5 5 5 5E !£; 10 10 10 • 10c-"0
15 ROB06-01 15 15 15Irrigated
20 20 20 20
Figure 20. Chloride, nitrate-N, sulfate, and fluoride concentration profiles for irrigated agriculturalsetting boreholes.
Chloride (mg/L) Nitrate-N (mg/L) Sulfate (mg/L) Fluoride (mg/L)0 2004006008001000 0 20 40 60 80 100 0 500 1000 1500 2000 0 100 200 300 400 500
0 0 0 0
2 ) 2 2 2
E 4 4 4 4£;c- 6 6 6 6"0
8 ROB07-05 8 8 8Drainage
10 10 10 10
Figure 21. Chloride, nitrate-N, sulfate, and fluoride concentration profiles for the drainage settingborehole.
67
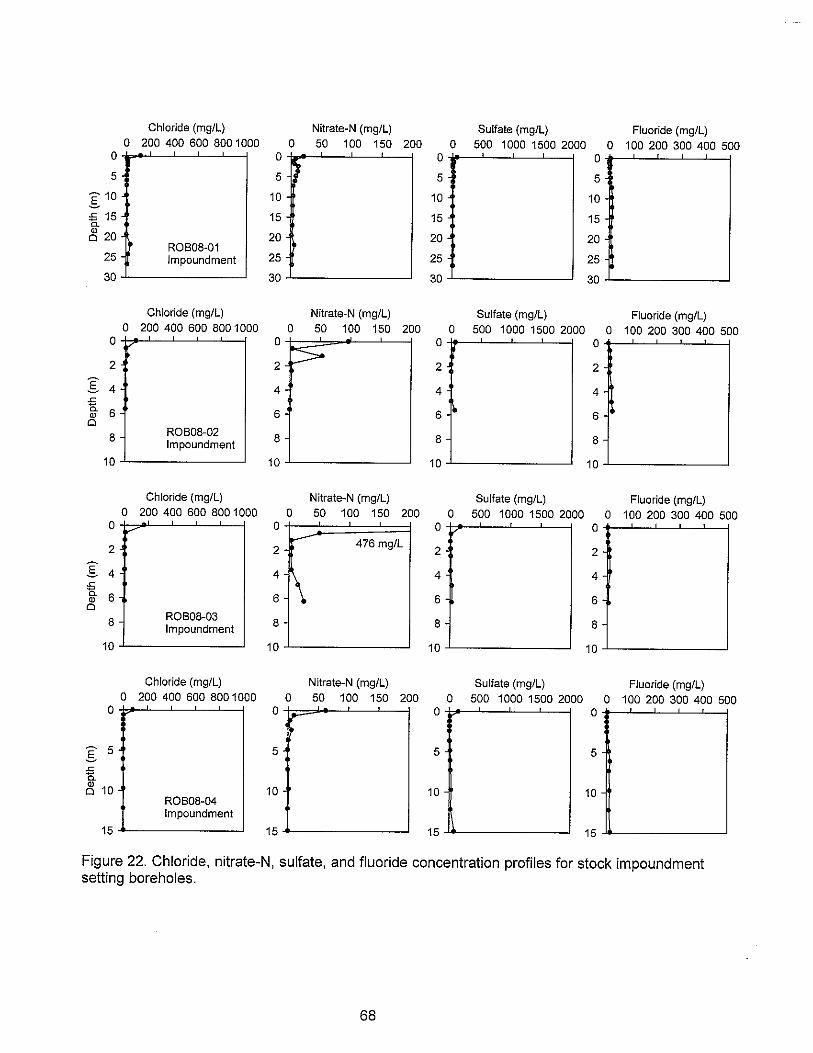
Chloride (mg/L) Nilrale-N (mg/L) Suifale (mg/L) Fluoride (mg/L)0 200 400 600 800 1000 0 50 100 150 200 0 500 1000 1500 2000 0 100 200 300 400 500
0 0)
0 0
5 5 5 5
-10 10 10 10.s:5 15 15 15 15"-~ 20
"
20 20 20ROB08-01
25 Impoundment 25 25 25
30 30 30 30
Chioride (mg/L) Nilrale-N (mg/L) Suifale (mg/L) Fluoride (mg/L)0 200 400 600 800 1000 0 50 100 150 200 0 500 1000 1500 2000 0 100 200 300 400 500
0 0 0 0
2 2 P. 2 2
E 4 4 4 4
~ 6 6 6 I- 6 •"08 ROB08-02 8 8 8Impoundment
10 10 10 10
Chloride (mg/L) Nilrale-N (mg/L) Sulfale (mg/L) Fluoride (mg/L)0 200 400 600 800 1000 0 50 100 150 200 0 500 1000 1500 2000 0 100 200 300 400 500
0 V- 0 0 0........ 476 mg/L
2 2 2 2
E 4 4 4 4.c15. 6 6 6 6"0
8 ROB08-03 8 8 8Impoundment
10 10 10 10
Chloride (mg/L) Nilrale-N (mg/L) Sulfale (mg/L) Fiuoride (mg/L)0 200 400 600 800 1000 0 50 100 150 200 0 500 1000 1500 2000 0 100 200 300 400 500
0,
0 0 0Ir~
.s 5 5 5 5
~~ 10 10 10 10
ROB08-04Impoundment
15 15 15 15
Figure 22. Chloride, nitrate-N, sulfate, and fluoride concentration profiles for stock impoundmentsetting boreholes.
68
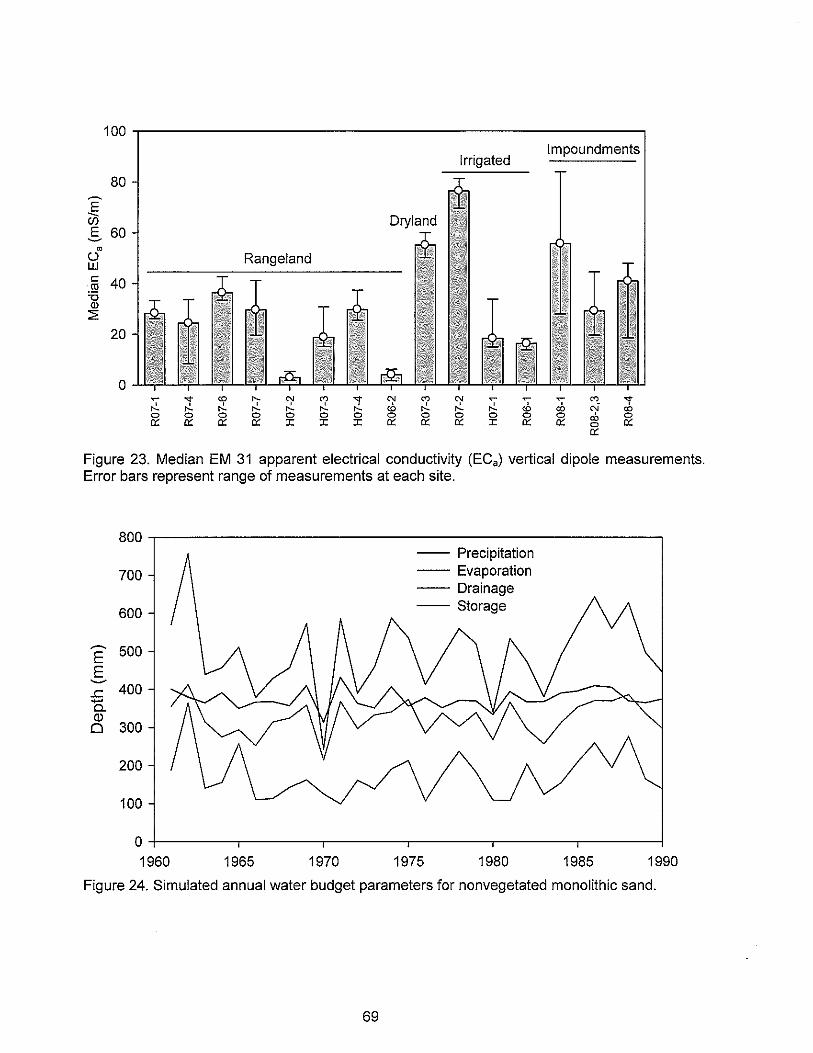
100 -.----------------------------,Impoundments
Irrigated
0~ ;! co !'- N '" ;! N '" N ~ ~ ~ '" 'f,.c ,.c ,.c ,.c ,.c <b
, ,.c ,.c <b ro ~!'- co0 0 0 0 0 0 0 0 0 0 0 0 0 co 0cr: cr: cr: cr: I I I cr: cr: cr: I cr: cr: 0 cr:
cr:
20
80~
~E 60~
moW
.~ 40"0Ql~
Figure 23. Median EM 31 apparent electrical conductivity (ECa) vertical dipole measurements.Error bars represent range of measurements at each site.
-- Precipitation-- Evaporation-- Drainage-- Storage
800
700
600
~ 500EE~
400.s::.....c..CD0 300
200
100
01960 1965 1970 1975 1980 1985 1990
Figure 24. Simulated annual water budget parameters for nonvegetated monolithic sand.
69
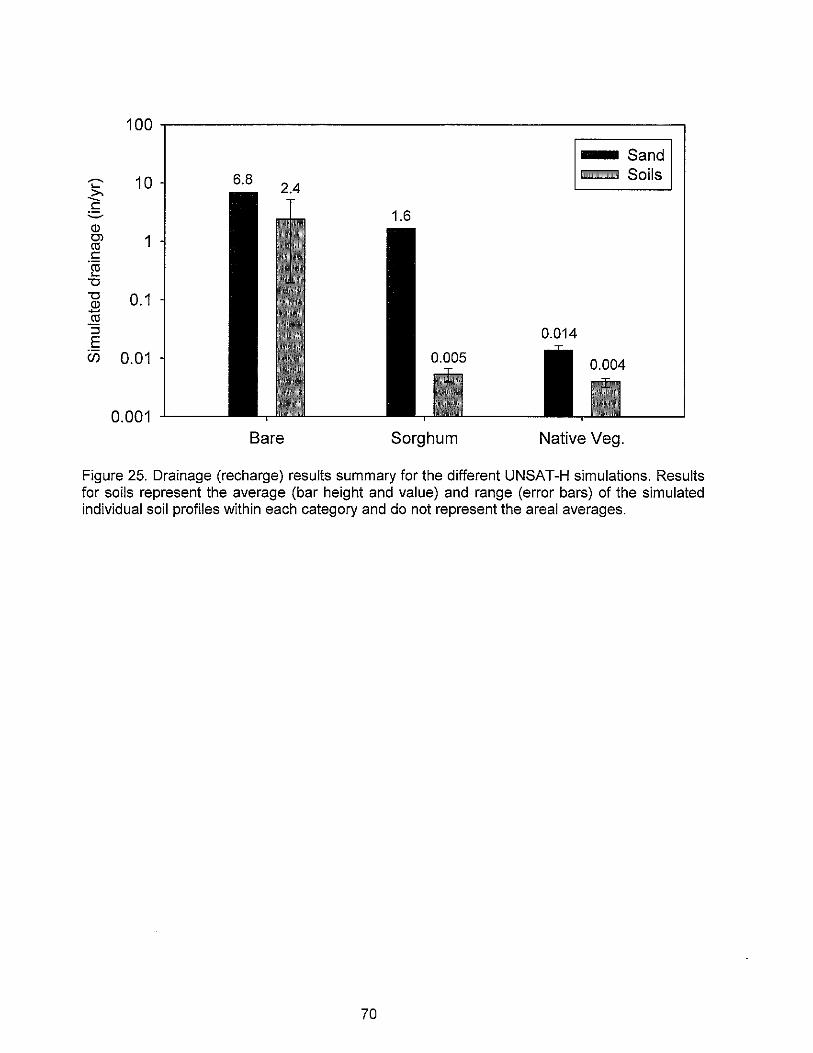
0.001
100 - Sand~ 10 6.8 - Soils~
>--c~ 1.6OJOJ 1coc'cu~
'0'0 0.1OJ-~::J 0.014E(j) 0.01
Bare Sorghum Native Veg.
Figure 25. Drainage (recharge) results summary for the different UNSAT-H simulations. Resultsfor soils represent the average (bar height and value) and range (error bars) of the simulatedindividual soil profiles within each category and do not represent the areal averages.
70
APPENDIX A:
Technical Memorandum
Calculation of Recharge Rates
Robert C. Reedy1, Sarah Davidsonl, Amy CroweU2
,
John Gates1, Osama Akasheh1, and Bridget R. Scanlon l
Bureau of Economic Geology, University of Texas at Austin
Executive Summary
The purpose of this study was to estimate groundwater recharge in the vicinity of RobertsCounty using the chloride mass balance applied to soil samples from the unsaturated zone toprovide point recharge estimates in different land use settings. A total of 18 boreholes weredrilled from 2006 through 2008 in different locations (13 in Roberts and 5 in Hemphill counties)to depths ranging from 19 to 74 ft (5.8 to 22.6 m). Natural rangeland represents the dominantland use in these counties and nine boreholes were located in this setting. Two boreholes werelocated beneath dryland agriculture and three boreholes beneath irrigated agriculture. Oneborehole was drilled in a dry drainage channel and three boreholes were drilled adjacent to stockimpoundments that pond water in Roberts County. Soil samples were collected in the field forlaboratory measurement of soil physics (water content and matric potential head) andenvironmental tracers (chloride, fluoride, nitrate, and sulfate).
The chloride mass balance approach applied to the unsaturated zone resulted in a range ofrecharge estimates for different land use settings. Most of the profiles in rangeland settings (6 outof 9) are generally characterized by large chloride accumulations (peak chloride concentrations477 to 2,593 mg/L) corresponding to accumulation times ranging from 3,601 to 19,758 yr. Thesedata indicate that there is essentially no recharge in these regions and that the profiles have beendrying out over these long time periods. Matric potentials are generally low in these profiles,with mean matric potentials below the root zone ranging from -68 to -108 m. These low matricpotentials generally support the lack of recharge from the chloride data. Two of the remainingprofiles (one in Roberts County and one in Hemphill County) have much lower chlorideconcentrations (mean 108 and 250 mg/L), indicating low, but measurable, recharge rates of 0.11and 0.14 in/yr (2.8 and 3.6 mm/yr). These boreholes are located along the breaks near theCanadian River, where soils are coarser grained. Recharge rates could not be estimated in thethird profile because only cuttings, not cores, were collected. Matric potentials were measured intwo of the three profiles and are slightly higher than others, with mean values of -38 and -67 m.Lack of recharge in most rangeland profiles is attributed to low permeability soils and the abilityof natural grasslands/shrublands to remove all infiltrated water through evapotranspiration. Lowrecharge in two of the rangeland profiles is attributed to their location along the Canadian breaksand associated coarser soil textures.
Conversion of rangeland to dryland agriculture did not increase recharge below the root zonein a profile in Roberts County but did increase recharge in a profile in Hemphill County to 0.41in/yr (10.4 mm/yr). The lack of increased recharge in the Roberts County dryland profile isattributed to the low permeability soils (Pullman clay loam) in this region. Evidence of increased
71
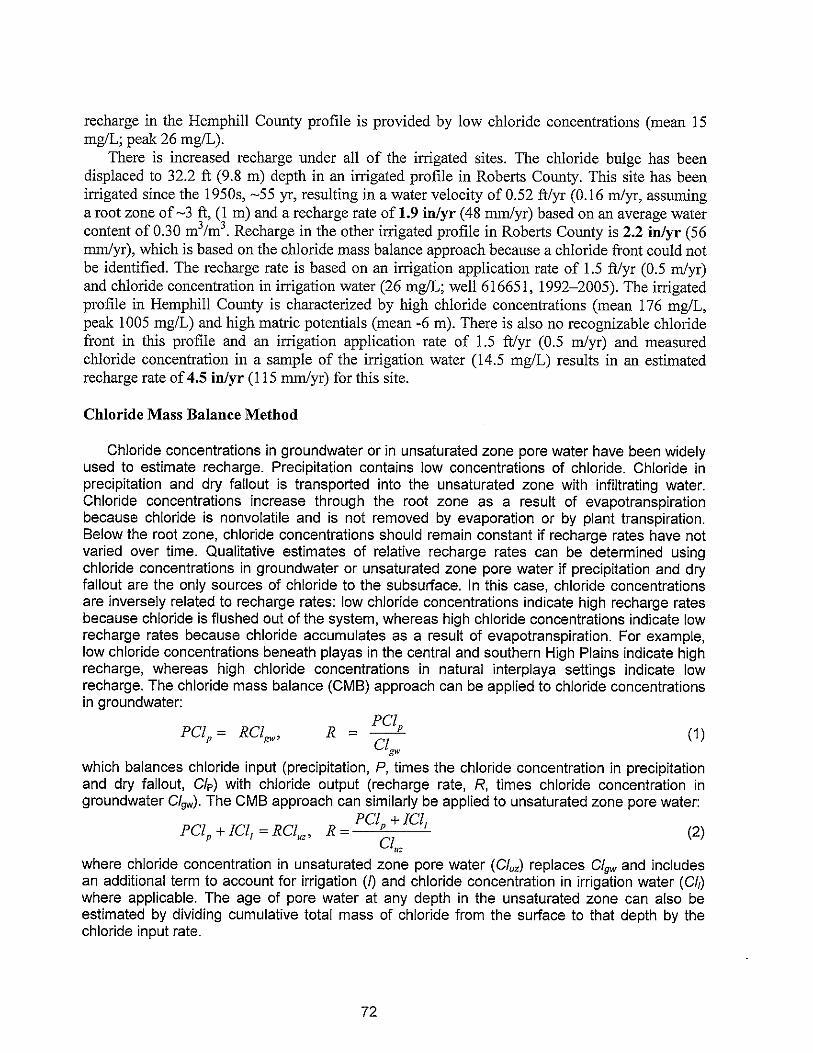
recharge in the Hemphill County profile is provided by low chloride concentrations (mean 15mglL; peak 26 mglL).
There is increased recharge under all of the irrigated sites. The chloride bulge has beendisplaced to 32.2 ft (9.8 m) depth in an irrigated profile in Roberts County. This site has beenirrigated since the 1950s, ~55 yr, resulting in a water velocity of 0.52 ft/yr (0.16 rn/yr, assuminga root zone of~3 ft, (1 m) and a recharge rate of 1.9 in/yr (48 mrn/yr) based on an average watercontent of 0.30 m3/m3
. Recharge in the other irrigated profile in Roberts County is 2.2 in/yr (56mrn/yr), which is based on the chloride mass balance approach because a chloride front could notbe identified. The recharge rate is based on an irrigation application rate of 1.5 ft/yr (0.5 rn/yr)and chloride concentration in irrigation water (26 mglL; well 616651, 1992-2005). The irrigatedprofile in Hemphill County is characterized by high chloride concentrations (mean 176 mglL,peak 1005 mg/L) and high matric potentials (mean -6 m). There is also no recognizable chloridefront in this profile and an irrigation application rate of 1.5 ft/yr (0.5 rn/yr) and measuredchloride concentration in a sample of the irrigation water (14.5 mg/L) results in an estimatedrecharge rate of 4.5 in/yr (115 mrn/yr) for this site.
Chloride Mass Balance Method
Chloride concentrations in groundwater or in unsaturated zone pore water have been widelyused to estimate recharge. Precipitation contains low concentrations of chloride. Chloride inprecipitation and dry fallout is transported into the unsaturated zone with infiltrating water.Chloride concentrations increase through the root zone as a result of evapotranspirationbecause chloride is nonvolatile and is not removed by evaporation or by plant transpiration.Below the root zone, chloride concentrations should remain constant if recharge rates have notvaried over time. Qualitative estimates of relative recharge rates can be determined usingchloride concentrations in groundwater or unsaturated zone pore water if precipitation and dryfallout are the only sources of chloride to the subsurface. In this case, chloride concentrationsare inversely related to recharge rates: low chloride concentrations indicate high recharge ratesbecause chloride is flushed out of the system, whereas high chloride concentrations indicate lowrecharge rates because chloride accumulates as a result of evapotranspiration. For example,low chloride concentrations beneath playas in the central and southern High Plains indicate highrecharge, whereas high chloride concentrations in natural interplaya settings indicate lowrecharge. The chloride mass balance (CMB) approach can be applied to chloride concentrationsin groundwater:
(2)
(1)PClp = RCIgw, R = PClpCIgw
which balances chloride input (precipitation, P, times the chloride concentration in precipitationand dry fallout, G/p ) with chloride output (recharge rate, R, times chloride concentration ingroundwater G/gw). The CMB approach can similarly be applied to unsaturated zone pore water:
PClp + ICIIPClp + ICII = RCI"" R
CI",where chloride concentration in unsaturated zone pore water (Gluz) replaces Gigwand includesan additional term to account for irrigation (I) and chloride concentration in irrigation water (GI,)where applicable. The age of pore water at any depth in the unsaturated zone can also beestimated by dividing cumulative total mass of chloride from the surface to that depth by thechloride input rate.
72
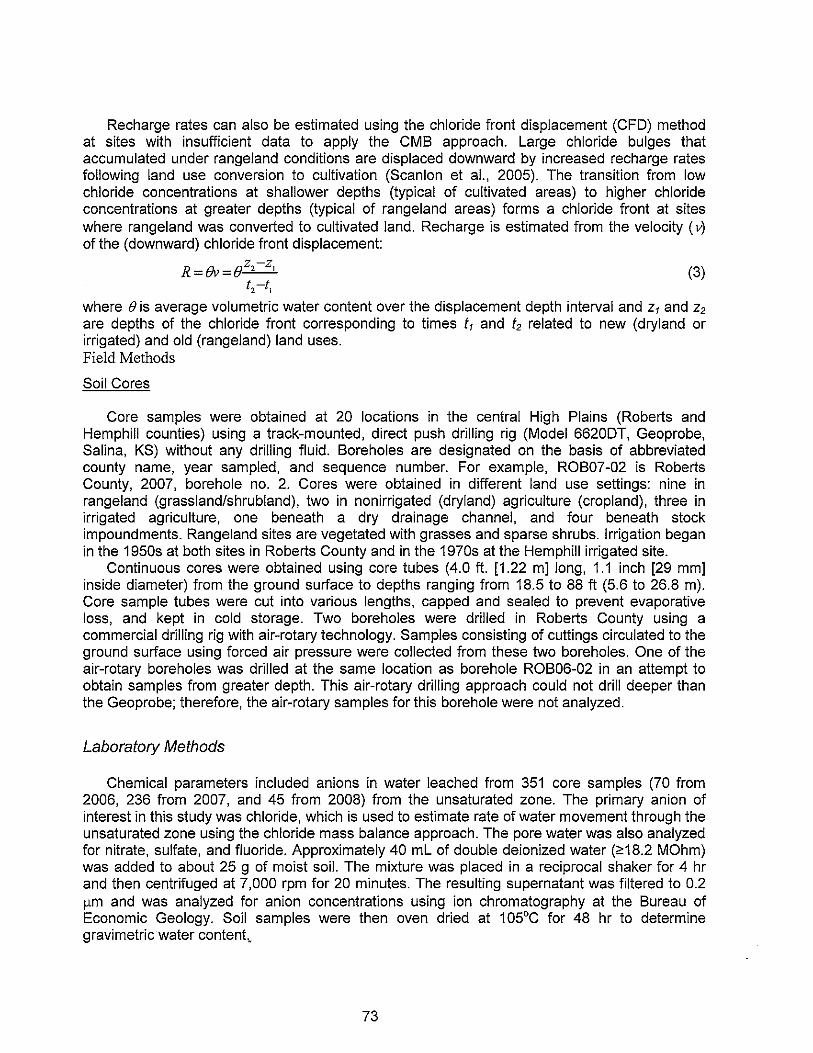
Recharge rates can also be estimated using the chloride front displacement (CFD) methodat sites with insufficient data to apply the CMB approach. Large chloride bulges thataccumulated under rangeland conditions are displaced downward by increased recharge ratesfollowing land use conversion to cultivation (Scanlon et aI., 2005). The transition from lowchloride concentrations at shallower depths (typical of cultivated areas) to higher chlorideconcentrations at greater depths (typical of rangeland areas) forms a chloride front at siteswhere rangeland was converted to cultivated land. Recharge is estimated from the velocity (v)of the (downward) chloride front displacement:
R=Bv=Bz2 - Z, (3)
(2-('
where B is average volumetric water content over the displacement depth interval and 2, and 22
are depths of the chloride front corresponding to times t, and t2 related to new (dryland orirrigated) and old (rangeland) land uses.Field Methods
Soil Cores
Core samples were obtained at 20 locations in the central High Plains (Roberts andHemphill counties) using a track-mounted, direct push drilling rig (Model 6620DT, Geoprobe,Salina, KS) without any drilling fluid. Boreholes are designated on the basis of abbreviatedcounty name, year sampled, and sequence number. For example, ROB07-02 is RobertsCounty, 2007, borehole no. 2. Cores were obtained in different land use settings: nine inrangeland (grassland/shrubland), two in nonirrigated (dryland) agriculture (cropland), three inirrigated agriculture, one beneath a dry drainage channel, and four beneath stockimpoundments. Rangeland sites are vegetated with grasses and sparse shrubs. Irrigation beganin the 1950s at both sites in Roberts County and in the 1970s at the Hemphill irrigated site.
Continuous cores were obtained using core tubes (4.0 ft. [1.22 m] long, 1.1 inch [29 mm]inside diameter) from the ground surface to depths ranging from 18.5 to 88 ft (5.6 to 26.8 m).Core sample tubes were cut into various lengths, capped and sealed to prevent evaporativeloss, and kept in cold storage. Two boreholes were drilled in Roberts County using acommercial drilling rig with air-rotary technology. Samples consisting of cuttings circulated to theground surface using forced air pressure were collected from these two boreholes. One of theair-rotary boreholes was drilled at the same location as borehole ROB06-02 in an attempt toobtain samples from greater depth. This air-rotary drilling approach could not drill deeper thanthe Geoprobe; therefore, the air-rotary samples for this borehole were not analyzed.
Laboratory Methods
Chemical parameters included anions in water leached from 351 core samples (70 from2006, 236 from 2007, and 45 from 2008) from the unsaturated zone. The primary anion ofinterest in this study was chloride, which is used to estimate rate of water movement through theunsaturated zone using the chloride mass balance approach. The pore water was also analyzedfor nitrate, sulfate, and fluoride. Approximately 40 mL of double deionized water (<:18.2 MOhm)was added to about 25 g of moist soil. The mixture was placed in a reciprocal shaker for 4 hrand then centrifuged at 7,000 rpm for 20 minutes. The resulting supernatant was filtered to 0.2flm and was analyzed for anion concentrations using ion chromatography at the Bureau ofEconomic Geology. Soil samples were then oven dried at 105°C for 48 hr to determinegravimetric water content,
73
Anion concentrations in the supernatant were converted to pore water concentrations bydividing by gravimetric water content and multiplying by density of pore water, assumed to be1.00 Mgtm3
. Concentrations are expressed as milligrams of ion per liter of pore water.
Soil samples were also analyzed in the laboratory for pressure head to determine directionof water flow in the soil. The term pressure head is generally equivalent to the term matricpotential, which refers to potential energy associated with the soil matrix. Matric potentials ~
26.2 ft (-8 m) were measured using tensiometers (Model T5, UMH, Munich), whereas matricpotentials $-26.2 ft (-8 m) were measured using a dew-point potentiometer (Model WP4-T,Decagon Devices Inc., Pullman, WA).
Results and Discussion
RESULTS
Recharge Estimates Based on Unsaturated Zone Field Studies
Rangeland Setting
General soil texture information for different profiles was estimated from SSURGO data(USDA-NRCS, 2007). Most of the profile soils at the rangeland sites have moderate claycontents (mean clay content in the upper 2 m of 25 to 33%) with the exception of HEM07-02,located on the breaks near the Canadian River in Hemphill County which contains only 18%clay. Rangeland profiles have variable water contents. Three of the 5 rangeland profiles inRoberts County for which measurements are available have high mean water contents (0.20 to0.24 m3tm3
) whereas the other two profiles have low mean water contents (0.06 to 0.09 m3tm\One of the profiles in Roberts County was drilled with air rotary and only cuttings were available;therefore, water content or recharge rates could not be calculated for this profile. Rangelandprofiles in Hemphill County also have variable water contents, ranging from 0.06 to 0.22 m3tm"Mean water content below the root zone in rangeland profiles is moderately correlated withSSURGO soil texture (r=0.58), indicating that average surface soil clay content is a controllingfactor in deeper profile water content.
Apparent electrical conductivity (EGa) values measured using the EM 31 meter nearrangeland profiles are generally correlated with mean water contents (r=0.89). EGa varies withwater content, soil texture, salinity, and temperature. Relationships between EGa and watercontent also reflect soil textural effect on water content and EGa. Generally low EGa values arefound in drier sediments that are coarser grained whereas higher EGa values are found in wettersediments that are associated with more clay-rich sediments.
Matric potentials are low in rangeland sites (mean -38 to -117 m). Variations in matricpotential do not seem to be related directly to water content variability.
Chloride concentrations in rangeland profiles are generally high. Mean chlorideconcentrations in rangeland profiles range from 161 to 1,115 mgtL in profiles with high watercontent (0.14 to 0.24 m3tm3
). These profiles generally have low chloride concentrations in theupper 3 ft (1 m), with the exception of profile ROS07-07 which has low chloride concentrationsto a depth of 14.1 ft (4.3 m). Depth of chloride flushing in this profile may reflect local runon,although this was not obvious from the local topography. Peak chloride concentrations inprofiles with high mean chloride concentrations range from 477 to 2593 mg/L (6 to 24 ft; 1.8 to7.3 m depth). These large chloride accumulations require 3,747 to 19,758 yr to accumulate,indicating that soils in these settings have been drying out over these time periods. There hasbeen no recharge in these settings over these time periods. Profiles with lower mean chlorideconcentrations (49 and 78 mgtL) correspond to lower mean water contents (0.06 m3tm3
) andcoarser textured soils near the Canadian breaks. Estimated mean water fluxes below the root
74
zone in these profiles range from 0.11 to 0.14 in/yr (2.8 to 3.6 mm/yr). Higher water fluxes areattributed to generally coarser textured soils.
Concentrations of other ions, including nitrate, sulfate, and fluoride are variable.Concentrations of nitrate-N are generally low (median 1.5 mg NOTN/L; range 0.8 to 9.5). Theonly profile with moderately high nitrate-N concentrations is ROB06-02 with a mean nitrate-Nconcentration of 9.5 mg/L and peak concentration of 32 mg N03-N/L at 20.3 ft (6.2 m) depth.Higher nitrate concentrations in this profile are attributed to low water contents and coarsetextured soils, because nitrate concentrations on a mass basis are low in this profile, similar tothose in other rangeland profiles.
Sulfate profiles are quite variable, with mean concentrations ranging from 174 to 3,647 mg/Land peak concentrations of 459 to 11,738 mg/L. Peak sulfate concentrations are so high insome profiles that they suggest a lithogenic source, such as gypsum and/or anhydrite. Lowerconcentrations (peaks <1,000 mg/L) may be derived from precipitation and dry fallout, similar tochloride. Correlations between sulfate and chloride are variable (r=0.48 to 0.90). Highcorrelations may reflect similar processes affecting the two ions, such as evapotranspirativeenrichment, regardless of the source. Peak chloride and sulfate peaks are also coincident insome profiles (ROB07-06 and HEM07-04).
Fluoride profiles are variable, with mean concentrations from 3 to 129 mg/L and peakconcentrations that range from 16 to 459 mg/L at depths of 1.2 to 7.1 m. Fluoride peaks in mostprofiles are found in the shallow subsurface (5 profiles $ 1.8 m; 3 profiles 3.0, 3.7, and 7.1 m).Fluoride may be derived partly from precipitation and dry fallout. Although information onfluoride concentrations in precipitation is limited, existing data indicate that concentrations aregenerally low. Fluoride may also be derived from dissolution of fluorite and/or apatite.Regardless of source, peak fluoride concentrations may be related to evapotranspirativeenrichment near the root zone. Profiles with deeper peaks may be related primarily to alithogenic source.
Dryland Setting
Only two boreholes were drilled in dryland agricultural settings, one in Roberts County andone in Hemphill County. The Roberts County profile is in fine-grained sediments (mean claycontent 43%) whereas the profile in Hemphill County is in coarser textured soils (mean claycontent 29%). The difference in mean water content below the root zone at the two sites(Roberts County: 0.21 m3/m3
, Hemphill County: 0.10 m3/m3) reflects the difference in soil
texture. Apparent electrical conductivity (ECa) measured using the EM31 meter at the Robertssite is moderately high (median 55 mS/m).
Matric potential profiles are generally low (-213 and -338 ft; -65 and -103 m). These valuesare similar to those found in rangeland profiles.
Chloride profiles at the two dryland sites are quite different. High chloride concentrations inthe Roberts County site (mean 417 mg/L, peak 1,295 mg/L at 9.8 ft [3.0 m] depth) are similar tothe rangeland profiles and represent 10,867 yr of accumulation. This large chlorideaccumulation represents long-term drying over this time period and indicates that there hasbeen no recharge in this region. The lack of impact of cultivation on recharge at this site mayreflect high clay content of the soils in this region. The profile in Hemphill County has lowchloride concentrations between the root zone and a depth of 18 ft (5.5 m) (mean 15 mg/L,range 7 to 26 mg/L). Calculated mean water flux for this zone is 0.41 in/yr (10.4 mm/yr). Thetime represented by chloride in this section of the profile is 87 yr, which generally correspondsto the time since cultivation began at this site (early 1900s). At depths ~18 ft (5.5 m) chlorideconcentrations increase to 152 mg/L, which may reflect buildup of chloride under rangelandsettings that is mobilized by higher water fluxes under dryland agriculture. The profile is notsufficiently deep (31 ft, 9.4 m) to show much of the rangeland chloride.
75