Embed Size (px)
Citation preview
1
2
Group highlights Third quarter 2021 In the following, the figures in brackets indicate the amount or percentage for the corresponding period last year.
Third quarter
Group • Profit/(loss) before tax expense: NOK 2,022.0 million
(2,048.4)
• Earnings per share: NOK 2.99 (3.10)
General Insurance • Earned premiums: NOK 7,516.1 million (6,949.0)
• Underwriting result: NOK 1,804.0 million (1,512.3)
• Combined ratio: 76.0 (78.2)
• Cost ratio: 13.6 (13.9)
• Financial result: NOK 207.5 million (550.6)
Year-to-date
Group • Profit/(loss) before tax expense: NOK 5,949.3 million
(4,028.1)
• Earnings per share: NOK 9.31 (6.05)
General Insurance • Earned premiums: NOK 21,664.8 million (20,284.8)
• Underwriting result: NOK 4,370.9 million (3,913.8)
• Combined ratio: 79.8 (80.7)
• Cost ratio: 14.1 (14.5)
• Financial result: NOK 1,565.7 million (189.8)
Declared dividend
• Special dividend: NOK 2,000 million, corresponding to NOK 4.00 per share
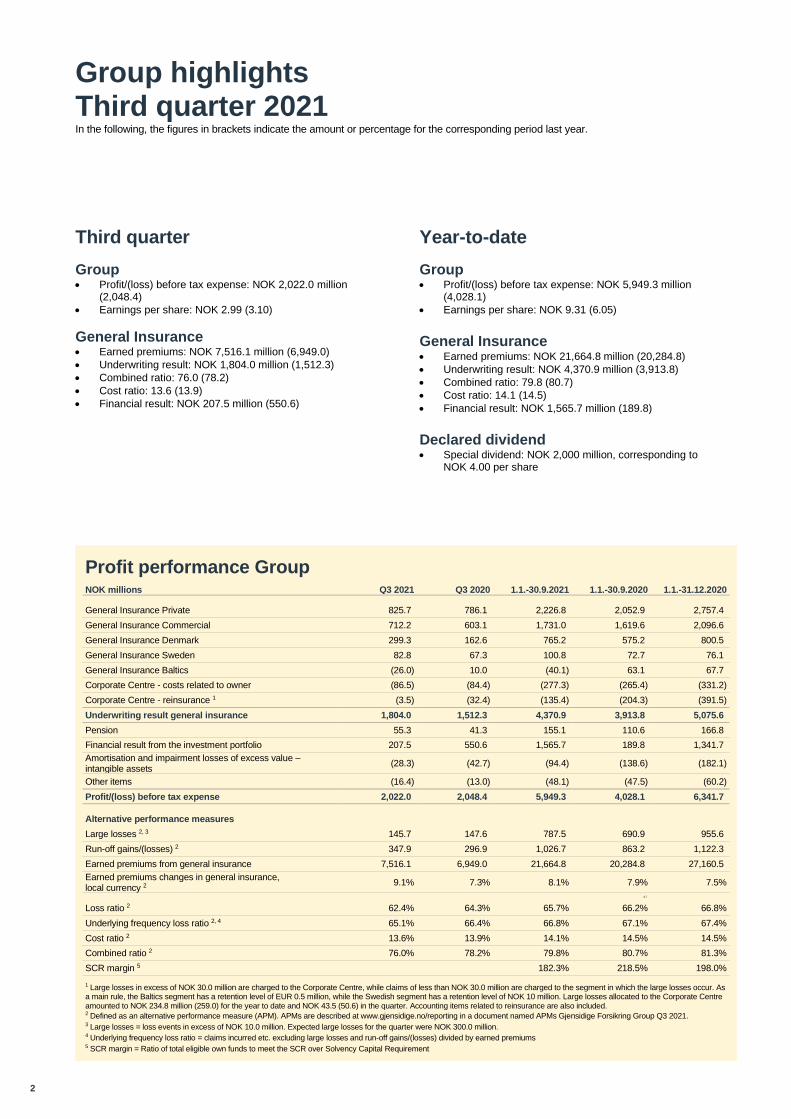
Profit performance Group NOK millions Q3 2021 Q3 2020 1.1.-30.9.2021 1.1.-30.9.2020 1.1.-31.12.2020
General Insurance Private 825.7 786.1 2,226.8 2,052.9 2,757.4
General Insurance Commercial 712.2 603.1 1,731.0 1,619.6 2,096.6
General Insurance Denmark 299.3 162.6 765.2 575.2 800.5
General Insurance Sweden 82.8 67.3 100.8 72.7 76.1
General Insurance Baltics (26.0) 10.0 (40.1) 63.1 67.7
Corporate Centre - costs related to owner (86.5) (84.4) (277.3) (265.4) (331.2)
Corporate Centre - reinsurance 1 (3.5) (32.4) (135.4) (204.3) (391.5)
Underwriting result general insurance 1,804.0 1,512.3 4,370.9 3,913.8 5,075.6
Pension 55.3 41.3 155.1 110.6 166.8
Financial result from the investment portfolio 207.5 550.6 1,565.7 189.8 1,341.7
Amortisation and impairment losses of excess value – intangible assets
(28.3) (42.7) (94.4) (138.6) (182.1)
Other items (16.4) (13.0) (48.1) (47.5) (60.2)
Profit/(loss) before tax expense 2,022.0 2,048.4 5,949.3 4,028.1 6,341.7
Alternative performance measures
Large losses 2, 3 145.7 147.6 787.5 690.9 955.6
Run-off gains/(losses) 2 347.9 296.9 1,026.7 863.2 1,122.3
Earned premiums from general insurance 7,516.1 6,949.0 21,664.8 20,284.8 27,160.5
Earned premiums changes in general insurance, local currency 2
9.1% 7.3% 8.1% 7.9% 7.5%
0.7
Loss ratio 2 62.4% 64.3% 65.7% 66.2% 66.8%
Underlying frequency loss ratio 2, 4 65.1% 66.4% 66.8% 67.1% 67.4%
Cost ratio 2 13.6% 13.9% 14.1% 14.5% 14.5%
Combined ratio 2 76.0% 78.2% 79.8% 80.7% 81.3%
SCR margin 5 182.3% 218.5% 198.0%
1 Large losses in excess of NOK 30.0 million are charged to the Corporate Centre, while claims of less than NOK 30.0 million are charged to the segment in which the large losses occur. As a main rule, the Baltics segment has a retention level of EUR 0.5 million, while the Swedish segment has a retention level of NOK 10 million. Large losses allocated to the Corporate Centre amounted to NOK 234.8 million (259.0) for the year to date and NOK 43.5 (50.6) in the quarter. Accounting items related to reinsurance are also included. 2 Defined as an alternative performance measure (APM). APMs are described at www.gjensidige.no/reporting in a document named APMs Gjensidige Forsikring Group Q3 2021. 3 Large losses = loss events in excess of NOK 10.0 million. Expected large losses for the quarter were NOK 300.0 million. 4 Underlying frequency loss ratio = claims incurred etc. excluding large losses and run-off gains/(losses) divided by earned premiums 5 SCR margin = Ratio of total eligible own funds to meet the SCR over Solvency Capital Requirement
3
Very solid third-quarter result
Strong operations, effective pricing measures, good risk selection and stringent cost control resulted in a record-high third-quarter underwriting result. The return on financial assets was moderate, reflecting market conditions. Gjensidige’s outlook remains promising. The Board has decided to distribute a special dividend of NOK 4.00 per share.
Group profit performance
Development during the quarter Gjensidige Forsikring Group recorded a profit before tax
expense of NOK 2,022.0 million (2,048.4) for the quarter.
The income tax expense amounted to NOK 526.9 million
(497.7), resulting in an effective tax rate of 26.1 per cent (24.3).
The effective tax rate was impacted by realised and unrealised
gains and losses on equity investments in the EEA.
The profit after tax expense was NOK 1,495.1 million (1,550.6)
and the corresponding earnings per share were NOK 2.99
(3.10).
The profit from general insurance operations measured by the
underwriting result was NOK 1,804.0 million (1,512.3),
corresponding to a combined ratio of 76.0 (78.2). The main
contributors to the improvement were Commercial and
Denmark.
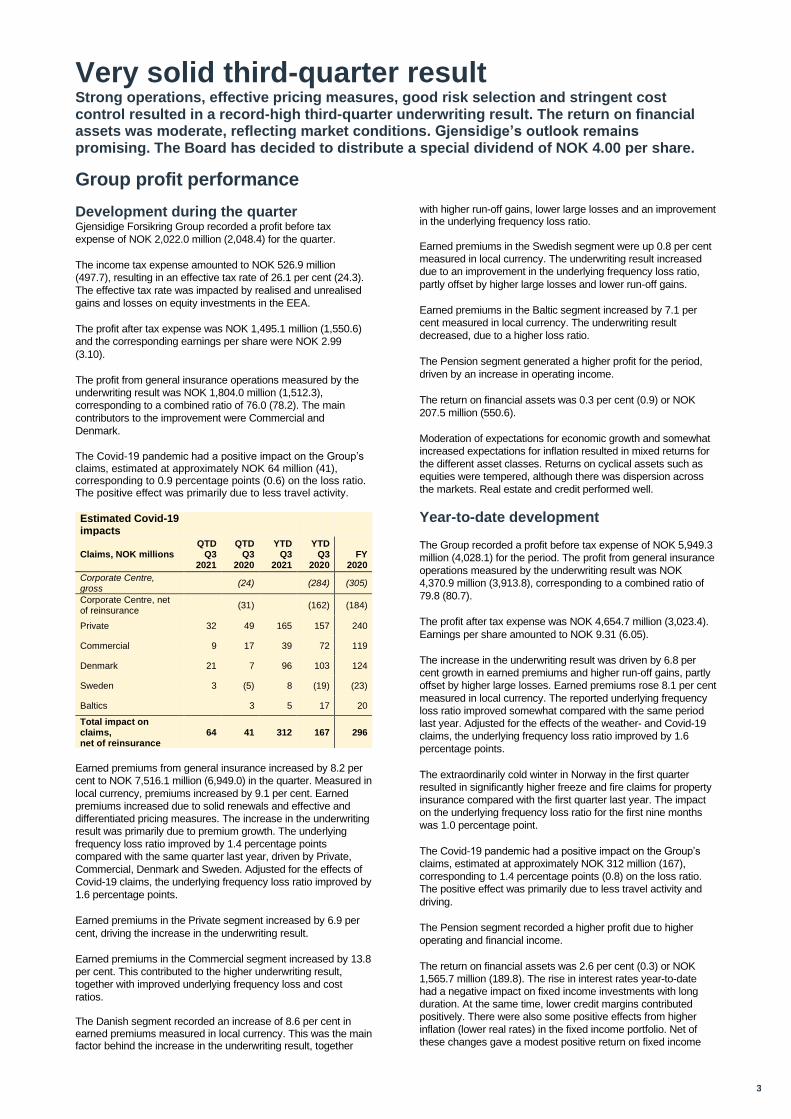
The Covid-19 pandemic had a positive impact on the Group’s claims, estimated at approximately NOK 64 million (41), corresponding to 0.9 percentage points (0.6) on the loss ratio. The positive effect was primarily due to less travel activity.
Earned premiums from general insurance increased by 8.2 per
cent to NOK 7,516.1 million (6,949.0) in the quarter. Measured in
local currency, premiums increased by 9.1 per cent. Earned
premiums increased due to solid renewals and effective and
differentiated pricing measures. The increase in the underwriting
result was primarily due to premium growth. The underlying
frequency loss ratio improved by 1.4 percentage points
compared with the same quarter last year, driven by Private,
Commercial, Denmark and Sweden. Adjusted for the effects of
Covid-19 claims, the underlying frequency loss ratio improved by
1.6 percentage points.
Earned premiums in the Private segment increased by 6.9 per
cent, driving the increase in the underwriting result.
Earned premiums in the Commercial segment increased by 13.8
per cent. This contributed to the higher underwriting result,
together with improved underlying frequency loss and cost
ratios. The Danish segment recorded an increase of 8.6 per cent in earned premiums measured in local currency. This was the main factor behind the increase in the underwriting result, together
with higher run-off gains, lower large losses and an improvement in the underlying frequency loss ratio.
Earned premiums in the Swedish segment were up 0.8 per cent
measured in local currency. The underwriting result increased
due to an improvement in the underlying frequency loss ratio,
partly offset by higher large losses and lower run-off gains.
Earned premiums in the Baltic segment increased by 7.1 per
cent measured in local currency. The underwriting result
decreased, due to a higher loss ratio.
The Pension segment generated a higher profit for the period,
driven by an increase in operating income.
The return on financial assets was 0.3 per cent (0.9) or NOK
207.5 million (550.6).
Moderation of expectations for economic growth and somewhat
increased expectations for inflation resulted in mixed returns for
the different asset classes. Returns on cyclical assets such as
equities were tempered, although there was dispersion across
the markets. Real estate and credit performed well.
Year-to-date development
The Group recorded a profit before tax expense of NOK 5,949.3
million (4,028.1) for the period. The profit from general insurance
operations measured by the underwriting result was NOK
4,370.9 million (3,913.8), corresponding to a combined ratio of
79.8 (80.7).
The profit after tax expense was NOK 4,654.7 million (3,023.4).
Earnings per share amounted to NOK 9.31 (6.05).
The increase in the underwriting result was driven by 6.8 per
cent growth in earned premiums and higher run-off gains, partly
offset by higher large losses. Earned premiums rose 8.1 per cent
measured in local currency. The reported underlying frequency
loss ratio improved somewhat compared with the same period
last year. Adjusted for the effects of the weather- and Covid-19
claims, the underlying frequency loss ratio improved by 1.6
percentage points.
The extraordinarily cold winter in Norway in the first quarter
resulted in significantly higher freeze and fire claims for property
insurance compared with the first quarter last year. The impact
on the underlying frequency loss ratio for the first nine months
was 1.0 percentage point.
The Covid-19 pandemic had a positive impact on the Group’s
claims, estimated at approximately NOK 312 million (167),
corresponding to 1.4 percentage points (0.8) on the loss ratio.
The positive effect was primarily due to less travel activity and
driving.
The Pension segment recorded a higher profit due to higher
operating and financial income.
The return on financial assets was 2.6 per cent (0.3) or NOK
1,565.7 million (189.8). The rise in interest rates year-to-date
had a negative impact on fixed income investments with long
duration. At the same time, lower credit margins contributed
positively. There were also some positive effects from higher
inflation (lower real rates) in the fixed income portfolio. Net of
these changes gave a modest positive return on fixed income
Estimated Covid-19 impacts
Claims, NOK millions QTD
Q3 2021
QTD Q3
2020
YTD Q3
2021
YTD Q3
2020
FY
2020
Corporate Centre, gross
(24) (284) (305)
Corporate Centre, net of reinsurance
(31) (162) (184)
Private 32 49 165 157 240
Commercial 9 17 39 72 119
Denmark 21 7 96 103 124
Sweden 3 (5) 8 (19) (23)
Baltics 3 5 17 20
Total impact on claims, net of reinsurance
64 41 312 167 296
4
securities for the period. An improved outlook for economic
recovery supported returns on fixed income securities with credit
exposure, equities, commodities and real estate.
Equity and capital position The Group’s equity amounted to NOK 25,014.7 million
(23,655.5) at the end of the period. The annualised return on
equity for the year to date was 26.9 per cent (15.3). The
solvency margins at the end of the quarter were:
• Approved Partial Internal Model1: 182 per cent
• Own Partial Internal Model2: 220 per cent
The solvency margins are calculated net of the NOK 2,000
million kroner in special dividend decided by the Board.
The Group has a robust solvency position and Gjensidige
believes that the Covid-19 pandemic will not have an impact on
the Group’s ability to continue as a going concern.
Gjensidige has an ‘A’ rating from Standard & Poor’s.
Other NEM Forsikring A/S in Denmark The acquisition of NEM Forsikring A/S in Denmark was completed in October 2021.
Operational targets Gjensidige has selected a set of operational targets for 2022 to support the Group’s delivery on financial targets. The operational targets are centred around digitalisation, process optimisation, automation and simplification. Taken together, they underpin the goal of being the most customer-oriented general insurance company within the Group’s geographies. Progress towards 2022 is good, with all metrics showing improvement since the targets were set in 2018.
Metric Status Q3 2021
Target 2022
Customer satisfaction 79 >78, Group
Customer retention
91% >90%, Norway
79% >85%, outside Norway
Sales effectiveness +23% +10%, Group
Automated tariffs 55% 100%, Group
Digital claims reporting 80% 80%, Norway
Claims straight-through processing
21% 64%, Norway
Claims cost NOK 630 million
Reduce by NOK 500 million, Group
Customer satisfaction (CSI) will contribute to increased customer retention. This requires good value propositions to customers, customer-friendly solutions and efficient claims settlements. Through more relevant data and lower acquisition costs, customer retention enhances our ability to provide our customers with valuable products and services, more correct
1 Regulatory approved partial internal model
pricing and increased competitiveness. It requires customer orientation, efficient processes and good customer solutions. Sales efficiency measures sales generated by each krone invested in distribution. Increased sales efficiency requires more digital sales, more analytical CRM and an optimal channel mix. Automated tariffs contribute to quicker updating of tariffs, resulting in more correct pricing at all times. This requires increased analytics capacity, standardisation and the automation of pricing processes, as well as advanced business intelligence / data warehouse capabilities. Digital claims reporting and straight-through claims processing contribute to good customer experiences, cost efficiency and lower carbon intensity. This requires standardisation, digital claims forms and advanced algorithms. Claims cost reduction is based on better control of repair methods and choice of suppliers, reduced fraud and more automated processes. Sustainable development
Gjensidige’s sustainability targets focus on three areas where
the Group can really make a difference: a safer society, reduced
carbon intensity and socially responsible investments, which
also support the Group’s financial targets. For a more detailed
description, see the Integrated Annual Report for 2020. Below
are a few examples of recent results and operational initiatives.
• Gjensidige has lifted the damage threshold for
condemnation of vehicles by 20 per cent to 80 per cent of
the vehicles’ replacement value. This is now a new industry
standard in Norway. The aim is to reduce waste and the
climate footprint in claims processes, simplify the process
and reduce the time taken for claims settlements.
• Gjensidige’s “People Way Project” in Denmark, which
focuses on increasing competence in sustainability among
our largest suppliers, has proven successful, leading to
higher customer and employee satisfaction as well as lower
repair costs.
• Gjensidige’s service “Helsehjelp 24/7” has been expanded with digital psychologist therapy. The service is available for all private customers in Norway.
• Mental health among the young is an important area for Gjensidige. The Group has established a common project together with Gjensidigestiftelsen, which will over the next 3 to 5 years will work on implementing measures to improve life skills. Within Gjensidige, the project is initiating several initiatives, most recently added by an agreement to support two Norwegian organisations, MOT and Ungt Entreprenørskap, which have strong bases in primary schools.
Development in EU regulations relating to sustainability,
particularly the EU taxonomy, are continuously monitored.
Preparations are being made to report according to the
taxonomy from 2022. To meet the taxonomy criteria, a task force
project has been established to facilitate amendments of product
design and services, tariffs and damage prevention initiatives.
The transformation will be carried out in a customer-oriented
manner, and in close collaboration with academic partners. The
Group has already started transforming some products, with
several pilots in co-operation with among others one of the
largest tyre dealership chains in Norway, the Norwegian School
of Economics and the Institute of Transport Economics.
2 Partial internal model with own calibration
5
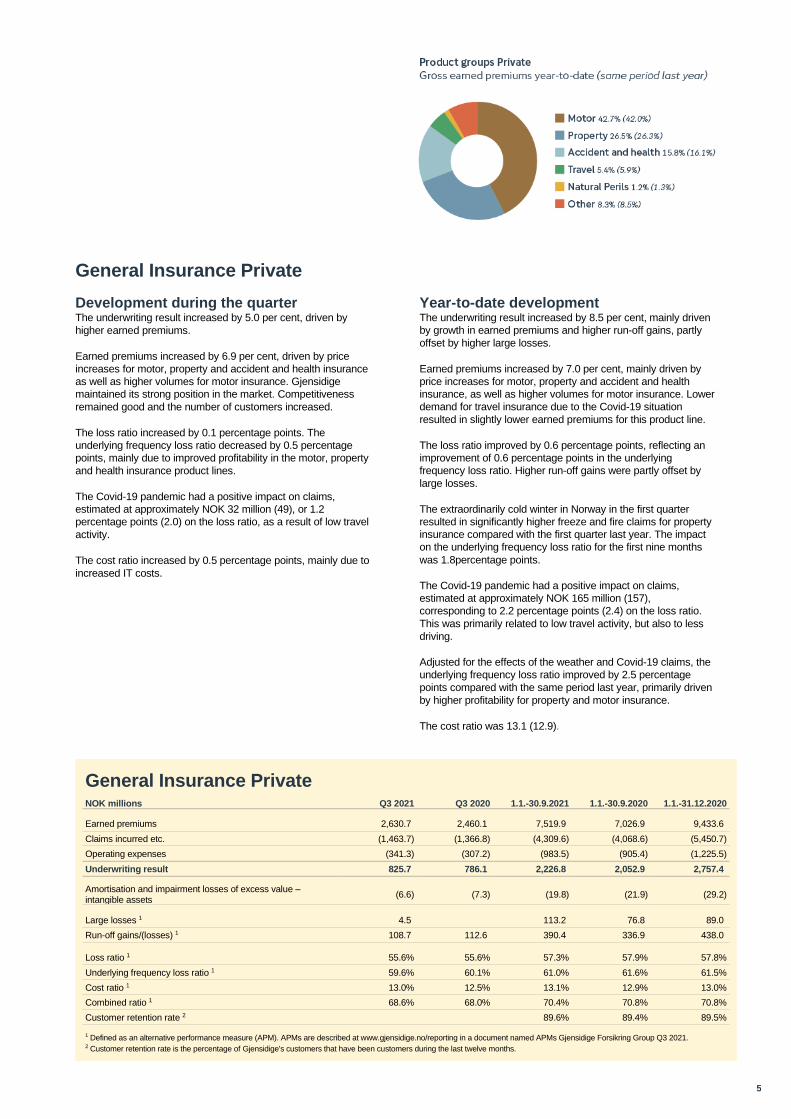
General Insurance Private
Development during the quarter The underwriting result increased by 5.0 per cent, driven by
higher earned premiums.
Earned premiums increased by 6.9 per cent, driven by price
increases for motor, property and accident and health insurance
as well as higher volumes for motor insurance. Gjensidige
maintained its strong position in the market. Competitiveness
remained good and the number of customers increased.
The loss ratio increased by 0.1 percentage points. The
underlying frequency loss ratio decreased by 0.5 percentage
points, mainly due to improved profitability in the motor, property
and health insurance product lines.
The Covid-19 pandemic had a positive impact on claims,
estimated at approximately NOK 32 million (49), or 1.2
percentage points (2.0) on the loss ratio, as a result of low travel
activity.
The cost ratio increased by 0.5 percentage points, mainly due to
increased IT costs.
Year-to-date development The underwriting result increased by 8.5 per cent, mainly driven
by growth in earned premiums and higher run-off gains, partly
offset by higher large losses.
Earned premiums increased by 7.0 per cent, mainly driven by
price increases for motor, property and accident and health
insurance, as well as higher volumes for motor insurance. Lower
demand for travel insurance due to the Covid-19 situation
resulted in slightly lower earned premiums for this product line.
The loss ratio improved by 0.6 percentage points, reflecting an
improvement of 0.6 percentage points in the underlying
frequency loss ratio. Higher run-off gains were partly offset by
large losses.
The extraordinarily cold winter in Norway in the first quarter
resulted in significantly higher freeze and fire claims for property
insurance compared with the first quarter last year. The impact
on the underlying frequency loss ratio for the first nine months
was 1.8percentage points.
The Covid-19 pandemic had a positive impact on claims,
estimated at approximately NOK 165 million (157),
corresponding to 2.2 percentage points (2.4) on the loss ratio.
This was primarily related to low travel activity, but also to less
driving.
Adjusted for the effects of the weather and Covid-19 claims, the
underlying frequency loss ratio improved by 2.5 percentage
points compared with the same period last year, primarily driven
by higher profitability for property and motor insurance.
The cost ratio was 13.1 (12.9).
General Insurance Private NOK millions Q3 2021 Q3 2020 1.1.-30.9.2021 1.1.-30.9.2020 1.1.-31.12.2020
Earned premiums 2,630.7 2,460.1 7,519.9 7,026.9 9,433.6
Claims incurred etc. (1,463.7) (1,366.8) (4,309.6) (4,068.6) (5,450.7)
Operating expenses (341.3) (307.2) (983.5) (905.4) (1,225.5)
Underwriting result 825.7 786.1 2,226.8 2,052.9 2,757.4
Amortisation and impairment losses of excess value – intangible assets
(6.6) (7.3) (19.8) (21.9) (29.2)
Large losses 1 4.5 113.2 76.8 89.0
Run-off gains/(losses) 1 108.7 112.6 390.4 336.9 438.0
Loss ratio 1 55.6% 55.6% 57.3% 57.9% 57.8%
Underlying frequency loss ratio 1 59.6% 60.1% 61.0% 61.6% 61.5%
Cost ratio 1 13.0% 12.5% 13.1% 12.9% 13.0%
Combined ratio 1 68.6% 68.0% 70.4% 70.8% 70.8%
Customer retention rate 2 89.6% 89.4% 89.5%
1 Defined as an alternative performance measure (APM). APMs are described at www.gjensidige.no/reporting in a document named APMs Gjensidige Forsikring Group Q3 2021. 2 Customer retention rate is the percentage of Gjensidige's customers that have been customers during the last twelve months.
6
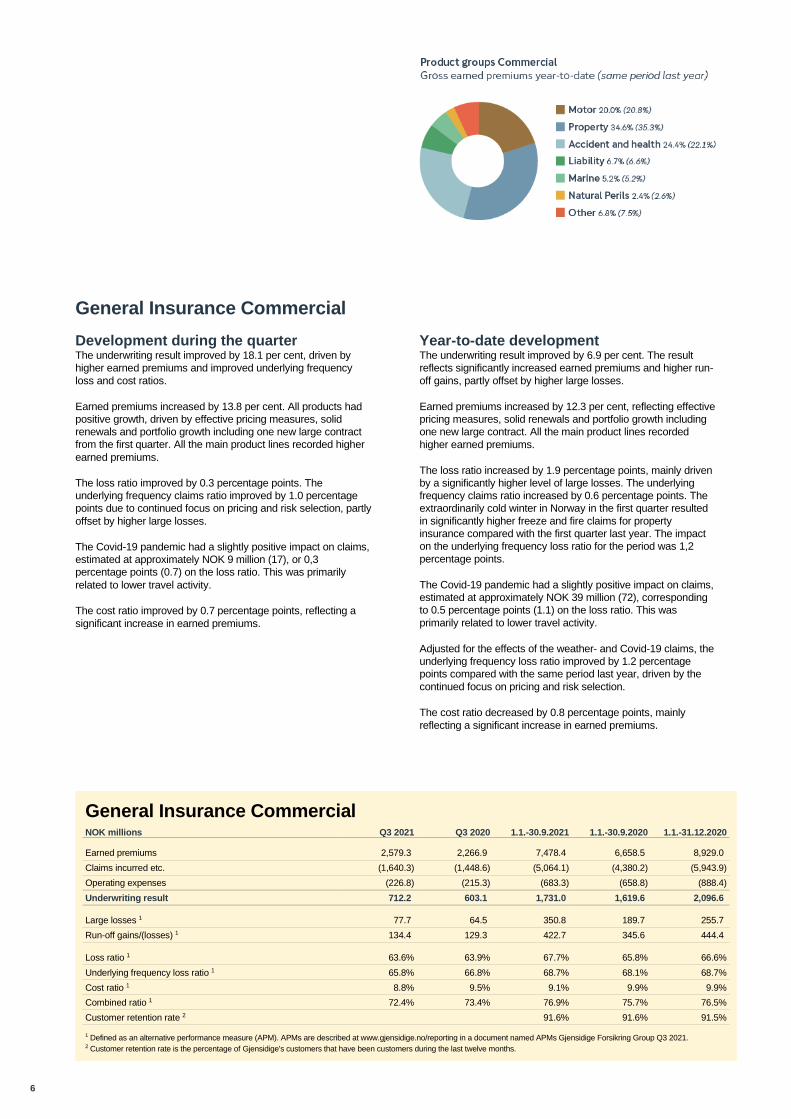
General Insurance Commercial
Development during the quarter The underwriting result improved by 18.1 per cent, driven by
higher earned premiums and improved underlying frequency
loss and cost ratios.
Earned premiums increased by 13.8 per cent. All products had
positive growth, driven by effective pricing measures, solid
renewals and portfolio growth including one new large contract
from the first quarter. All the main product lines recorded higher
earned premiums.
The loss ratio improved by 0.3 percentage points. The
underlying frequency claims ratio improved by 1.0 percentage
points due to continued focus on pricing and risk selection, partly
offset by higher large losses.
The Covid-19 pandemic had a slightly positive impact on claims,
estimated at approximately NOK 9 million (17), or 0,3
percentage points (0.7) on the loss ratio. This was primarily
related to lower travel activity.
The cost ratio improved by 0.7 percentage points, reflecting a
significant increase in earned premiums.
Year-to-date development The underwriting result improved by 6.9 per cent. The result
reflects significantly increased earned premiums and higher run-
off gains, partly offset by higher large losses.
Earned premiums increased by 12.3 per cent, reflecting effective
pricing measures, solid renewals and portfolio growth including
one new large contract. All the main product lines recorded
higher earned premiums.
The loss ratio increased by 1.9 percentage points, mainly driven
by a significantly higher level of large losses. The underlying
frequency claims ratio increased by 0.6 percentage points. The
extraordinarily cold winter in Norway in the first quarter resulted
in significantly higher freeze and fire claims for property
insurance compared with the first quarter last year. The impact
on the underlying frequency loss ratio for the period was 1,2
percentage points.
The Covid-19 pandemic had a slightly positive impact on claims,
estimated at approximately NOK 39 million (72), corresponding
to 0.5 percentage points (1.1) on the loss ratio. This was
primarily related to lower travel activity.
Adjusted for the effects of the weather- and Covid-19 claims, the
underlying frequency loss ratio improved by 1.2 percentage
points compared with the same period last year, driven by the
continued focus on pricing and risk selection.
The cost ratio decreased by 0.8 percentage points, mainly
reflecting a significant increase in earned premiums.
General Insurance Commercial NOK millions Q3 2021 Q3 2020 1.1.-30.9.2021 1.1.-30.9.2020 1.1.-31.12.2020
Earned premiums 2,579.3 2,266.9 7,478.4 6,658.5 8,929.0
Claims incurred etc. (1,640.3) (1,448.6) (5,064.1) (4,380.2) (5,943.9)
Operating expenses (226.8) (215.3) (683.3) (658.8) (888.4)
Underwriting result 712.2 603.1 1,731.0 1,619.6 2,096.6
Large losses 1 77.7 64.5 350.8 189.7 255.7
Run-off gains/(losses) 1 134.4 129.3 422.7 345.6 444.4
Loss ratio 1 63.6% 63.9% 67.7% 65.8% 66.6%
Underlying frequency loss ratio 1 65.8% 66.8% 68.7% 68.1% 68.7%
Cost ratio 1 8.8% 9.5% 9.1% 9.9% 9.9%
Combined ratio 1 72.4% 73.4% 76.9% 75.7% 76.5%
Customer retention rate 2 91.6% 91.6% 91.5%
1 Defined as an alternative performance measure (APM). APMs are described at www.gjensidige.no/reporting in a document named APMs Gjensidige Forsikring Group Q3 2021. 2 Customer retention rate is the percentage of Gjensidige's customers that have been customers during the last twelve months.
7
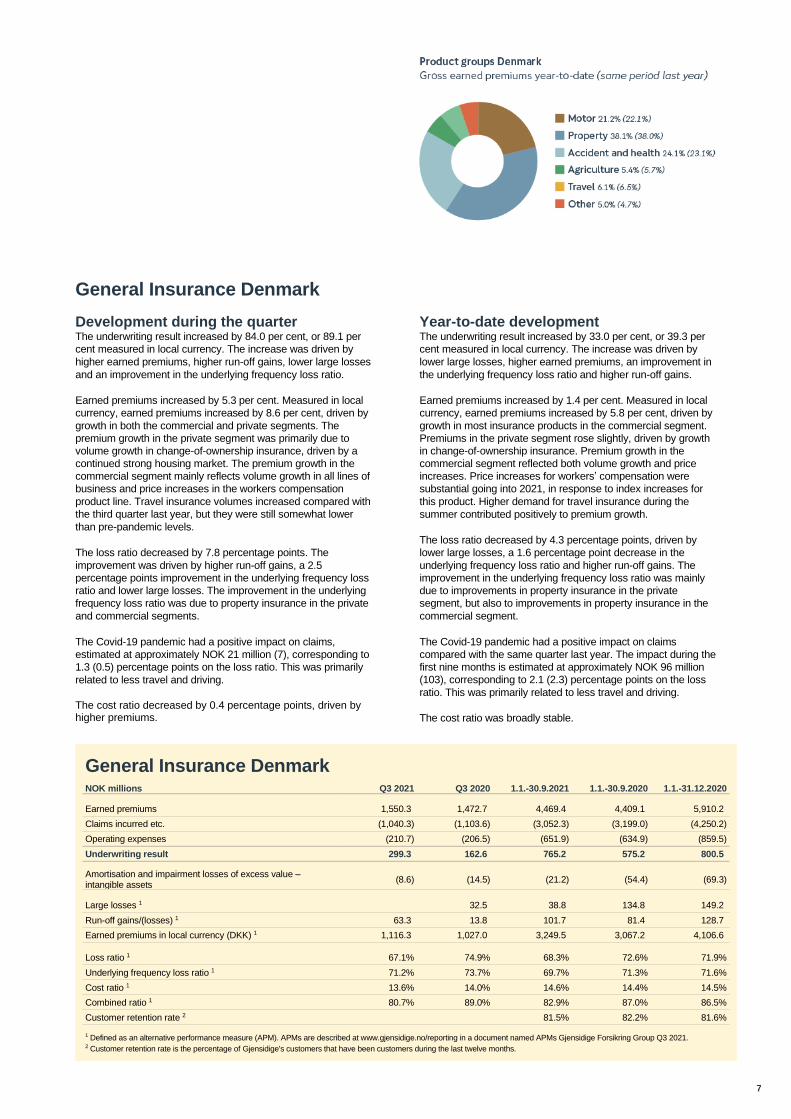
General Insurance Denmark
Development during the quarter The underwriting result increased by 84.0 per cent, or 89.1 per
cent measured in local currency. The increase was driven by
higher earned premiums, higher run-off gains, lower large losses
and an improvement in the underlying frequency loss ratio.
Earned premiums increased by 5.3 per cent. Measured in local
currency, earned premiums increased by 8.6 per cent, driven by
growth in both the commercial and private segments. The
premium growth in the private segment was primarily due to
volume growth in change-of-ownership insurance, driven by a
continued strong housing market. The premium growth in the
commercial segment mainly reflects volume growth in all lines of
business and price increases in the workers compensation
product line. Travel insurance volumes increased compared with
the third quarter last year, but they were still somewhat lower
than pre-pandemic levels.
The loss ratio decreased by 7.8 percentage points. The
improvement was driven by higher run-off gains, a 2.5
percentage points improvement in the underlying frequency loss
ratio and lower large losses. The improvement in the underlying
frequency loss ratio was due to property insurance in the private
and commercial segments.
The Covid-19 pandemic had a positive impact on claims,
estimated at approximately NOK 21 million (7), corresponding to
1.3 (0.5) percentage points on the loss ratio. This was primarily
related to less travel and driving.
The cost ratio decreased by 0.4 percentage points, driven by higher premiums.
Year-to-date development The underwriting result increased by 33.0 per cent, or 39.3 per
cent measured in local currency. The increase was driven by
lower large losses, higher earned premiums, an improvement in
the underlying frequency loss ratio and higher run-off gains.
Earned premiums increased by 1.4 per cent. Measured in local
currency, earned premiums increased by 5.8 per cent, driven by
growth in most insurance products in the commercial segment.
Premiums in the private segment rose slightly, driven by growth
in change-of-ownership insurance. Premium growth in the
commercial segment reflected both volume growth and price
increases. Price increases for workers’ compensation were
substantial going into 2021, in response to index increases for
this product. Higher demand for travel insurance during the
summer contributed positively to premium growth.
The loss ratio decreased by 4.3 percentage points, driven by
lower large losses, a 1.6 percentage point decrease in the
underlying frequency loss ratio and higher run-off gains. The
improvement in the underlying frequency loss ratio was mainly
due to improvements in property insurance in the private
segment, but also to improvements in property insurance in the
commercial segment.
The Covid-19 pandemic had a positive impact on claims
compared with the same quarter last year. The impact during the
first nine months is estimated at approximately NOK 96 million
(103), corresponding to 2.1 (2.3) percentage points on the loss
ratio. This was primarily related to less travel and driving.
The cost ratio was broadly stable.
General Insurance Denmark NOK millions Q3 2021 Q3 2020 1.1.-30.9.2021 1.1.-30.9.2020 1.1.-31.12.2020
Earned premiums 1,550.3 1,472.7 4,469.4 4,409.1 5,910.2
Claims incurred etc. (1,040.3) (1,103.6) (3,052.3) (3,199.0) (4,250.2)
Operating expenses (210.7) (206.5) (651.9) (634.9) (859.5)
Underwriting result 299.3 162.6 765.2 575.2 800.5
Amortisation and impairment losses of excess value – intangible assets
(8.6) (14.5) (21.2) (54.4) (69.3)
Large losses 1 32.5 38.8 134.8 149.2
Run-off gains/(losses) 1 63.3 13.8 101.7 81.4 128.7
Earned premiums in local currency (DKK) 1 1,116.3 1,027.0 3,249.5 3,067.2 4,106.6
Loss ratio 1 67.1% 74.9% 68.3% 72.6% 71.9%
Underlying frequency loss ratio 1 71.2% 73.7% 69.7% 71.3% 71.6%
Cost ratio 1 13.6% 14.0% 14.6% 14.4% 14.5%
Combined ratio 1 80.7% 89.0% 82.9% 87.0% 86.5%
Customer retention rate 2 81.5% 82.2% 81.6%
1 Defined as an alternative performance measure (APM). APMs are described at www.gjensidige.no/reporting in a document named APMs Gjensidige Forsikring Group Q3 2021. 2 Customer retention rate is the percentage of Gjensidige's customers that have been customers during the last twelve months.
8
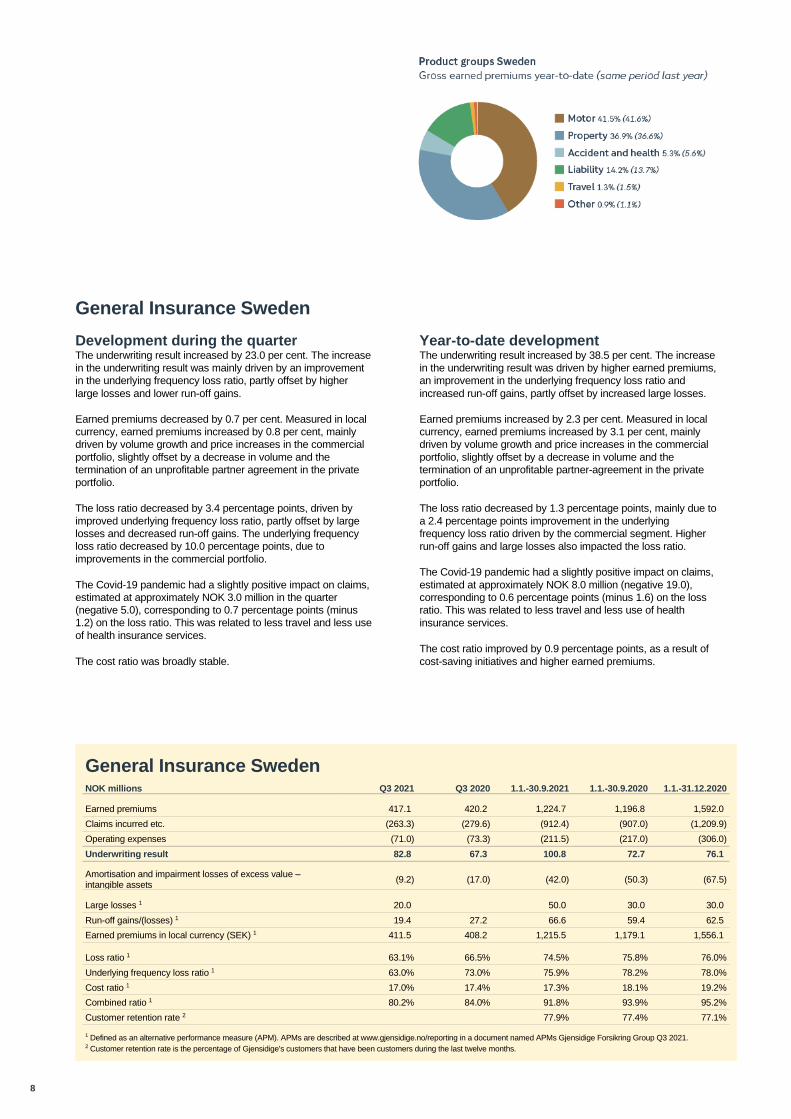
General Insurance Sweden
Development during the quarter The underwriting result increased by 23.0 per cent. The increase
in the underwriting result was mainly driven by an improvement
in the underlying frequency loss ratio, partly offset by higher
large losses and lower run-off gains.
Earned premiums decreased by 0.7 per cent. Measured in local
currency, earned premiums increased by 0.8 per cent, mainly
driven by volume growth and price increases in the commercial
portfolio, slightly offset by a decrease in volume and the
termination of an unprofitable partner agreement in the private
portfolio.
The loss ratio decreased by 3.4 percentage points, driven by
improved underlying frequency loss ratio, partly offset by large
losses and decreased run-off gains. The underlying frequency
loss ratio decreased by 10.0 percentage points, due to
improvements in the commercial portfolio.
The Covid-19 pandemic had a slightly positive impact on claims,
estimated at approximately NOK 3.0 million in the quarter
(negative 5.0), corresponding to 0.7 percentage points (minus
1.2) on the loss ratio. This was related to less travel and less use
of health insurance services.
The cost ratio was broadly stable.
Year-to-date development The underwriting result increased by 38.5 per cent. The increase
in the underwriting result was driven by higher earned premiums,
an improvement in the underlying frequency loss ratio and
increased run-off gains, partly offset by increased large losses.
Earned premiums increased by 2.3 per cent. Measured in local
currency, earned premiums increased by 3.1 per cent, mainly
driven by volume growth and price increases in the commercial
portfolio, slightly offset by a decrease in volume and the
termination of an unprofitable partner-agreement in the private
portfolio.
The loss ratio decreased by 1.3 percentage points, mainly due to
a 2.4 percentage points improvement in the underlying
frequency loss ratio driven by the commercial segment. Higher
run-off gains and large losses also impacted the loss ratio.
The Covid-19 pandemic had a slightly positive impact on claims,
estimated at approximately NOK 8.0 million (negative 19.0),
corresponding to 0.6 percentage points (minus 1.6) on the loss
ratio. This was related to less travel and less use of health
insurance services.
The cost ratio improved by 0.9 percentage points, as a result of
cost-saving initiatives and higher earned premiums.
General Insurance Sweden NOK millions Q3 2021 Q3 2020 1.1.-30.9.2021 1.1.-30.9.2020 1.1.-31.12.2020
Earned premiums 417.1 420.2 1,224.7 1,196.8 1,592.0
Claims incurred etc. (263.3) (279.6) (912.4) (907.0) (1,209.9)
Operating expenses (71.0) (73.3) (211.5) (217.0) (306.0)
Underwriting result 82.8 67.3 100.8 72.7 76.1
Amortisation and impairment losses of excess value – intangible assets
(9.2) (17.0) (42.0) (50.3) (67.5)
Large losses 1 20.0 50.0 30.0 30.0
Run-off gains/(losses) 1 19.4 27.2 66.6 59.4 62.5
Earned premiums in local currency (SEK) 1 411.5 408.2 1,215.5 1,179.1 1,556.1
Loss ratio 1 63.1% 66.5% 74.5% 75.8% 76.0%
Underlying frequency loss ratio 1 63.0% 73.0% 75.9% 78.2% 78.0%
Cost ratio 1 17.0% 17.4% 17.3% 18.1% 19.2%
Combined ratio 1 80.2% 84.0% 91.8% 93.9% 95.2%
Customer retention rate 2 77.9% 77.4% 77.1%
1 Defined as an alternative performance measure (APM). APMs are described at www.gjensidige.no/reporting in a document named APMs Gjensidige Forsikring Group Q3 2021. 2 Customer retention rate is the percentage of Gjensidige's customers that have been customers during the last twelve months.
9
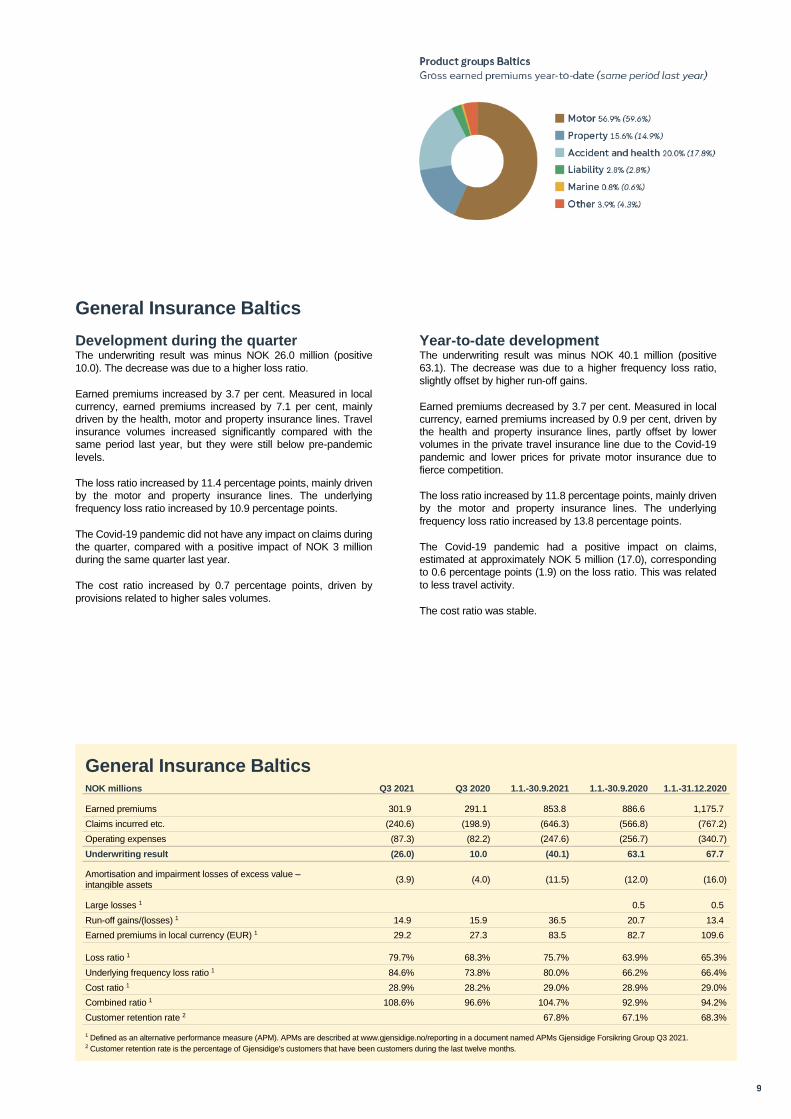
General Insurance Baltics
Development during the quarter The underwriting result was minus NOK 26.0 million (positive
10.0). The decrease was due to a higher loss ratio.
Earned premiums increased by 3.7 per cent. Measured in local
currency, earned premiums increased by 7.1 per cent, mainly
driven by the health, motor and property insurance lines. Travel
insurance volumes increased significantly compared with the
same period last year, but they were still below pre-pandemic
levels.
The loss ratio increased by 11.4 percentage points, mainly driven
by the motor and property insurance lines. The underlying
frequency loss ratio increased by 10.9 percentage points.
The Covid-19 pandemic did not have any impact on claims during
the quarter, compared with a positive impact of NOK 3 million
during the same quarter last year.
The cost ratio increased by 0.7 percentage points, driven by
provisions related to higher sales volumes.
Year-to-date development The underwriting result was minus NOK 40.1 million (positive
63.1). The decrease was due to a higher frequency loss ratio,
slightly offset by higher run-off gains.
Earned premiums decreased by 3.7 per cent. Measured in local
currency, earned premiums increased by 0.9 per cent, driven by
the health and property insurance lines, partly offset by lower
volumes in the private travel insurance line due to the Covid-19
pandemic and lower prices for private motor insurance due to
fierce competition.
The loss ratio increased by 11.8 percentage points, mainly driven
by the motor and property insurance lines. The underlying
frequency loss ratio increased by 13.8 percentage points.
The Covid-19 pandemic had a positive impact on claims,
estimated at approximately NOK 5 million (17.0), corresponding
to 0.6 percentage points (1.9) on the loss ratio. This was related
to less travel activity.
The cost ratio was stable.
General Insurance Baltics NOK millions Q3 2021 Q3 2020 1.1.-30.9.2021 1.1.-30.9.2020 1.1.-31.12.2020
Earned premiums 301.9 291.1 853.8 886.6 1,175.7
Claims incurred etc. (240.6) (198.9) (646.3) (566.8) (767.2)
Operating expenses (87.3) (82.2) (247.6) (256.7) (340.7)
Underwriting result (26.0) 10.0 (40.1) 63.1 67.7
Amortisation and impairment losses of excess value – intangible assets
(3.9) (4.0) (11.5) (12.0) (16.0)
Large losses 1 0.5 0.5
Run-off gains/(losses) 1 14.9 15.9 36.5 20.7 13.4
Earned premiums in local currency (EUR) 1 29.2 27.3 83.5 82.7 109.6
Loss ratio 1 79.7% 68.3% 75.7% 63.9% 65.3%
Underlying frequency loss ratio 1 84.6% 73.8% 80.0% 66.2% 66.4%
Cost ratio 1 28.9% 28.2% 29.0% 28.9% 29.0%
Combined ratio 1 108.6% 96.6% 104.7% 92.9% 94.2%
Customer retention rate 2 67.8% 67.1% 68.3%
1 Defined as an alternative performance measure (APM). APMs are described at www.gjensidige.no/reporting in a document named APMs Gjensidige Forsikring Group Q3 2021. 2 Customer retention rate is the percentage of Gjensidige's customers that have been customers during the last twelve months.
10
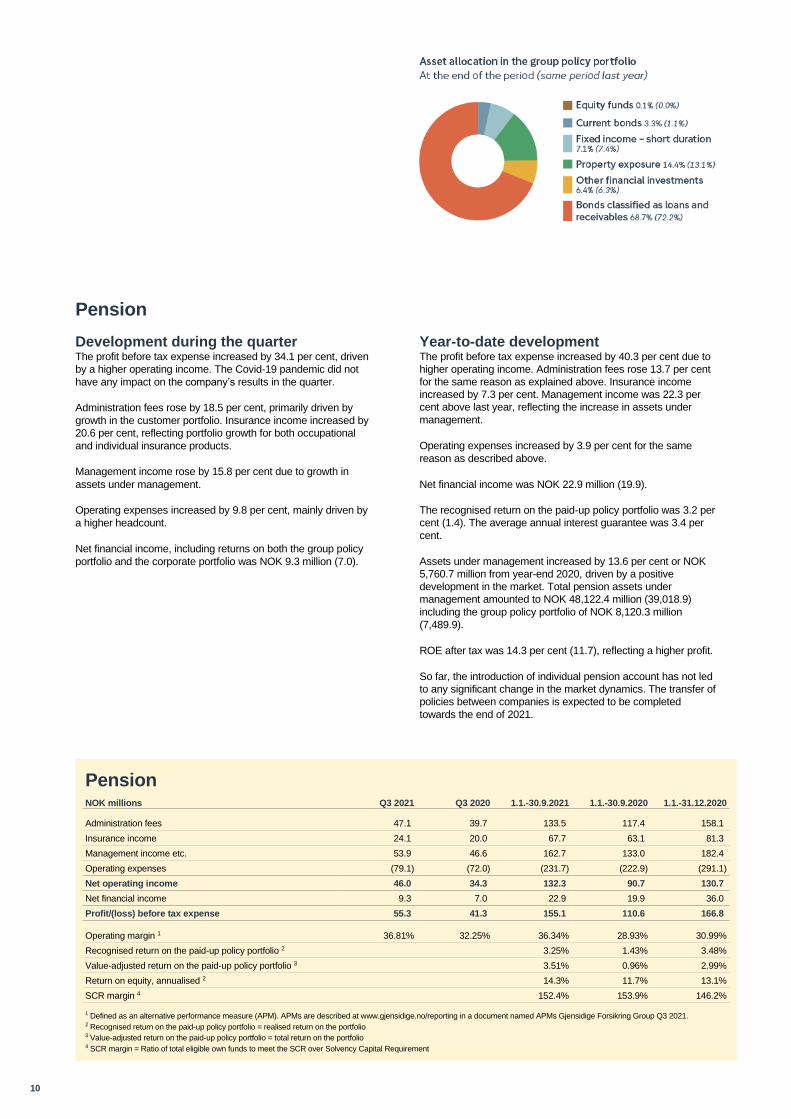
Pension
Development during the quarter The profit before tax expense increased by 34.1 per cent, driven
by a higher operating income. The Covid-19 pandemic did not
have any impact on the company’s results in the quarter.
Administration fees rose by 18.5 per cent, primarily driven by
growth in the customer portfolio. Insurance income increased by
20.6 per cent, reflecting portfolio growth for both occupational
and individual insurance products.
Management income rose by 15.8 per cent due to growth in
assets under management.
Operating expenses increased by 9.8 per cent, mainly driven by
a higher headcount.
Net financial income, including returns on both the group policy
portfolio and the corporate portfolio was NOK 9.3 million (7.0).
Year-to-date development The profit before tax expense increased by 40.3 per cent due to
higher operating income. Administration fees rose 13.7 per cent
for the same reason as explained above. Insurance income
increased by 7.3 per cent. Management income was 22.3 per
cent above last year, reflecting the increase in assets under
management.
Operating expenses increased by 3.9 per cent for the same
reason as described above.
Net financial income was NOK 22.9 million (19.9).
The recognised return on the paid-up policy portfolio was 3.2 per
cent (1.4). The average annual interest guarantee was 3.4 per
cent.
Assets under management increased by 13.6 per cent or NOK
5,760.7 million from year-end 2020, driven by a positive
development in the market. Total pension assets under
management amounted to NOK 48,122.4 million (39,018.9)
including the group policy portfolio of NOK 8,120.3 million
(7,489.9).
ROE after tax was 14.3 per cent (11.7), reflecting a higher profit.
So far, the introduction of individual pension account has not led
to any significant change in the market dynamics. The transfer of
policies between companies is expected to be completed
towards the end of 2021.
Pension NOK millions Q3 2021 Q3 2020 1.1.-30.9.2021 1.1.-30.9.2020 1.1.-31.12.2020
Administration fees 47.1 39.7 133.5 117.4 158.1
Insurance income 24.1 20.0 67.7 63.1 81.3
Management income etc. 53.9 46.6 162.7 133.0 182.4
Operating expenses (79.1) (72.0) (231.7) (222.9) (291.1)
Net operating income 46.0 34.3 132.3 90.7 130.7
Net financial income 9.3 7.0 22.9 19.9 36.0
Profit/(loss) before tax expense 55.3 41.3 155.1 110.6 166.8
Operating margin 1 36.81% 32.25% 36.34% 28.93% 30.99%
Recognised return on the paid-up policy portfolio 2 3.25% 1.43% 3.48%
Value-adjusted return on the paid-up policy portfolio 3 3.51% 0.96% 2.99%
Return on equity, annualised 2 14.3% 11.7% 13.1%
SCR margin 4 152.4% 153.9% 146.2%
1 Defined as an alternative performance measure (APM). APMs are described at www.gjensidige.no/reporting in a document named APMs Gjensidige Forsikring Group Q3 2021. 2 Recognised return on the paid-up policy portfolio = realised return on the portfolio 3 Value-adjusted return on the paid-up policy portfolio = total return on the portfolio 4 SCR margin = Ratio of total eligible own funds to meet the SCR over Solvency Capital Requirement
11
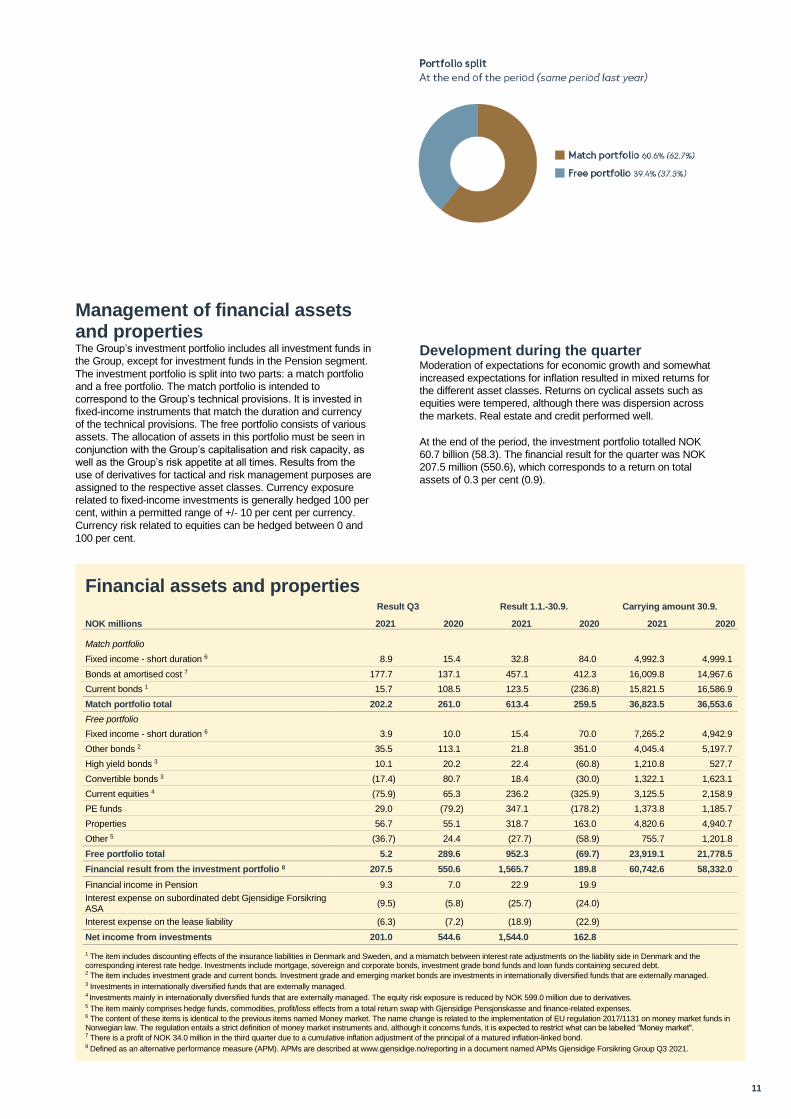
Management of financial assets and properties The Group’s investment portfolio includes all investment funds in
the Group, except for investment funds in the Pension segment.
The investment portfolio is split into two parts: a match portfolio
and a free portfolio. The match portfolio is intended to
correspond to the Group’s technical provisions. It is invested in
fixed-income instruments that match the duration and currency
of the technical provisions. The free portfolio consists of various
assets. The allocation of assets in this portfolio must be seen in
conjunction with the Group’s capitalisation and risk capacity, as
well as the Group’s risk appetite at all times. Results from the
use of derivatives for tactical and risk management purposes are
assigned to the respective asset classes. Currency exposure
related to fixed-income investments is generally hedged 100 per
cent, within a permitted range of +/- 10 per cent per currency.
Currency risk related to equities can be hedged between 0 and
100 per cent.
Development during the quarter Moderation of expectations for economic growth and somewhat
increased expectations for inflation resulted in mixed returns for
the different asset classes. Returns on cyclical assets such as
equities were tempered, although there was dispersion across
the markets. Real estate and credit performed well.
At the end of the period, the investment portfolio totalled NOK
60.7 billion (58.3). The financial result for the quarter was NOK
207.5 million (550.6), which corresponds to a return on total
assets of 0.3 per cent (0.9).
Financial assets and properties Result Q3 Result 1.1.-30.9. Carrying amount 30.9.
NOK millions 2021 2020 2021 2020 2021 2020
Match portfolio
Fixed income - short duration 6 8.9 15.4 32.8 84.0 4,992.3 4,999.1
Bonds at amortised cost 7 177.7 137.1 457.1 412.3 16,009.8 14,967.6
Current bonds 1 15.7 108.5 123.5 (236.8) 15,821.5 16,586.9
Match portfolio total 202.2 261.0 613.4 259.5 36,823.5 36,553.6
Free portfolio
Fixed income - short duration 6 3.9 10.0 15.4 70.0 7,265.2 4,942.9
Other bonds 2 35.5 113.1 21.8 351.0 4,045.4 5,197.7
High yield bonds 3 10.1 20.2 22.4 (60.8) 1,210.8 527.7
Convertible bonds 3 (17.4) 80.7 18.4 (30.0) 1,322.1 1,623.1
Current equities 4 (75.9) 65.3 236.2 (325.9) 3,125.5 2,158.9
PE funds 29.0 (79.2) 347.1 (178.2) 1,373.8 1,185.7
Properties 56.7 55.1 318.7 163.0 4,820.6 4,940.7
Other 5 (36.7) 24.4 (27.7) (58.9) 755.7 1,201.8
Free portfolio total 5.2 289.6 952.3 (69.7) 23,919.1 21,778.5
Financial result from the investment portfolio 8 207.5 550.6 1,565.7 189.8 60,742.6 58,332.0
Financial income in Pension 9.3 7.0 22.9 19.9
Interest expense on subordinated debt Gjensidige Forsikring ASA
(9.5) (5.8) (25.7) (24.0)
Interest expense on the lease liability (6.3) (7.2) (18.9) (22.9)
Net income from investments 201.0 544.6 1,544.0 162.8
1 The item includes discounting effects of the insurance liabilities in Denmark and Sweden, and a mismatch between interest rate adjustments on the liability side in Denmark and the corresponding interest rate hedge. Investments include mortgage, sovereign and corporate bonds, investment grade bond funds and loan funds containing secured debt. 2 The item includes investment grade and current bonds. Investment grade and emerging market bonds are investments in internationally diversified funds that are externally managed. 3 Investments in internationally diversified funds that are externally managed. 4 Investments mainly in internationally diversified funds that are externally managed. The equity risk exposure is reduced by NOK 599.0 million due to derivatives. 5 The item mainly comprises hedge funds, commodities, profit/loss effects from a total return swap with Gjensidige Pensjonskasse and finance-related expenses. 6 The content of these items is identical to the previous items named Money market. The name change is related to the implementation of EU regulation 2017/1131 on money market funds in Norwegian law. The regulation entails a strict definition of money market instruments and, although it concerns funds, it is expected to restrict what can be labelled “Money market". 7 There is a profit of NOK 34.0 million in the third quarter due to a cumulative inflation adjustment of the principal of a matured inflation-linked bond. 8 Defined as an alternative performance measure (APM). APMs are described at www.gjensidige.no/reporting in a document named APMs Gjensidige Forsikring Group Q3 2021.
12
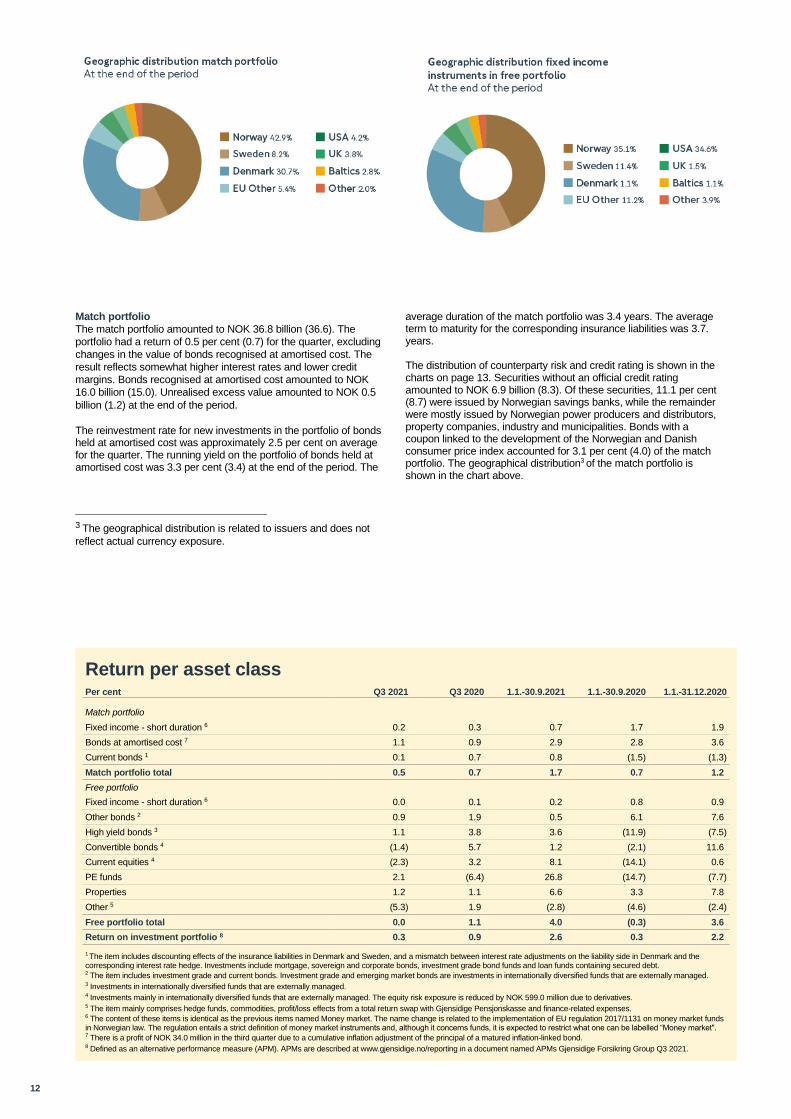
Match portfolio
The match portfolio amounted to NOK 36.8 billion (36.6). The
portfolio had a return of 0.5 per cent (0.7) for the quarter, excluding
changes in the value of bonds recognised at amortised cost. The
result reflects somewhat higher interest rates and lower credit
margins. Bonds recognised at amortised cost amounted to NOK
16.0 billion (15.0). Unrealised excess value amounted to NOK 0.5
billion (1.2) at the end of the period.
The reinvestment rate for new investments in the portfolio of bonds held at amortised cost was approximately 2.5 per cent on average for the quarter. The running yield on the portfolio of bonds held at amortised cost was 3.3 per cent (3.4) at the end of the period. The
3 The geographical distribution is related to issuers and does not
reflect actual currency exposure.
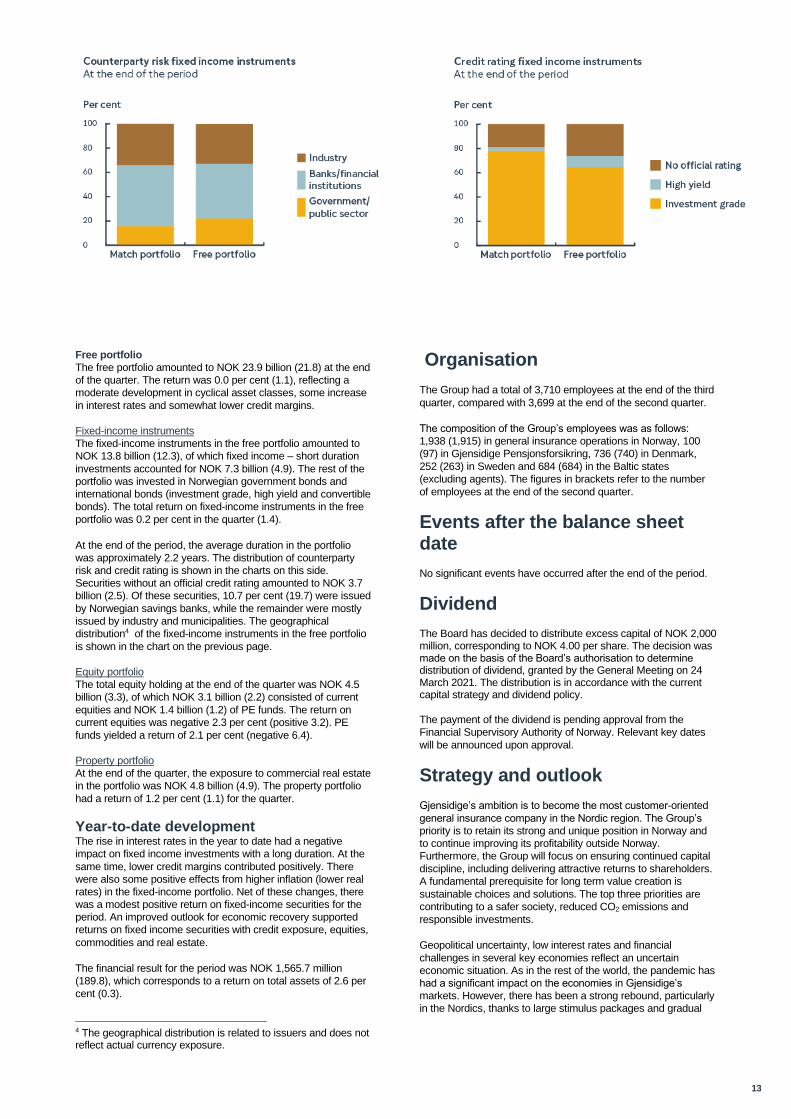
average duration of the match portfolio was 3.4 years. The average term to maturity for the corresponding insurance liabilities was 3.7. years. The distribution of counterparty risk and credit rating is shown in the charts on page 13. Securities without an official credit rating amounted to NOK 6.9 billion (8.3). Of these securities, 11.1 per cent (8.7) were issued by Norwegian savings banks, while the remainder were mostly issued by Norwegian power producers and distributors, property companies, industry and municipalities. Bonds with a coupon linked to the development of the Norwegian and Danish consumer price index accounted for 3.1 per cent (4.0) of the match portfolio. The geographical distribution3 of the match portfolio is shown in the chart above.
Return per asset class Per cent Q3 2021 Q3 2020 1.1.-30.9.2021 1.1.-30.9.2020 1.1.-31.12.2020
Match portfolio
Fixed income - short duration 6 0.2 0.3 0.7 1.7 1.9
Bonds at amortised cost 7 1.1 0.9 2.9 2.8 3.6
Current bonds 1 0.1 0.7 0.8 (1.5) (1.3)
Match portfolio total 0.5 0.7 1.7 0.7 1.2
Free portfolio
Fixed income - short duration 6 0.0 0.1 0.2 0.8 0.9
Other bonds 2 0.9 1.9 0.5 6.1 7.6
High yield bonds 3 1.1 3.8 3.6 (11.9) (7.5)
Convertible bonds 4 (1.4) 5.7 1.2 (2.1) 11.6
Current equities 4 (2.3) 3.2 8.1 (14.1) 0.6
PE funds 2.1 (6.4) 26.8 (14.7) (7.7)
Properties 1.2 1.1 6.6 3.3 7.8
Other 5 (5.3) 1.9 (2.8) (4.6) (2.4)
Free portfolio total 0.0 1.1 4.0 (0.3) 3.6
Return on investment portfolio 8 0.3 0.9 2.6 0.3 2.2
1 The item includes discounting effects of the insurance liabilities in Denmark and Sweden, and a mismatch between interest rate adjustments on the liability side in Denmark and the corresponding interest rate hedge. Investments include mortgage, sovereign and corporate bonds, investment grade bond funds and loan funds containing secured debt.
2 The item includes investment grade and current bonds. Investment grade and emerging market bonds are investments in internationally diversified funds that are externally managed.
3 Investments in internationally diversified funds that are externally managed.
4 Investments mainly in internationally diversified funds that are externally managed. The equity risk exposure is reduced by NOK 599.0 million due to derivatives.
5 The item mainly comprises hedge funds, commodities, profit/loss effects from a total return swap with Gjensidige Pensjonskasse and finance-related expenses.
6 The content of these items is identical as the previous items named Money market. The name change is related to the implementation of EU regulation 2017/1131 on money market funds in Norwegian law. The regulation entails a strict definition of money market instruments and, although it concerns funds, it is expected to restrict what one can be labelled “Money market". 7 There is a profit of NOK 34.0 million in the third quarter due to a cumulative inflation adjustment of the principal of a matured inflation-linked bond. 8 Defined as an alternative performance measure (APM). APMs are described at www.gjensidige.no/reporting in a document named APMs Gjensidige Forsikring Group Q3 2021.
13
Free portfolio
The free portfolio amounted to NOK 23.9 billion (21.8) at the end
of the quarter. The return was 0.0 per cent (1.1), reflecting a
moderate development in cyclical asset classes, some increase
in interest rates and somewhat lower credit margins.
Fixed-income instruments
The fixed-income instruments in the free portfolio amounted to
NOK 13.8 billion (12.3), of which fixed income – short duration
investments accounted for NOK 7.3 billion (4.9). The rest of the
portfolio was invested in Norwegian government bonds and
international bonds (investment grade, high yield and convertible
bonds). The total return on fixed-income instruments in the free
portfolio was 0.2 per cent in the quarter (1.4).
At the end of the period, the average duration in the portfolio
was approximately 2.2 years. The distribution of counterparty
risk and credit rating is shown in the charts on this side.
Securities without an official credit rating amounted to NOK 3.7
billion (2.5). Of these securities, 10.7 per cent (19.7) were issued
by Norwegian savings banks, while the remainder were mostly
issued by industry and municipalities. The geographical
distribution4 of the fixed-income instruments in the free portfolio
is shown in the chart on the previous page.
Equity portfolio
The total equity holding at the end of the quarter was NOK 4.5
billion (3.3), of which NOK 3.1 billion (2.2) consisted of current
equities and NOK 1.4 billion (1.2) of PE funds. The return on
current equities was negative 2.3 per cent (positive 3.2). PE
funds yielded a return of 2.1 per cent (negative 6.4).
Property portfolio
At the end of the quarter, the exposure to commercial real estate
in the portfolio was NOK 4.8 billion (4.9). The property portfolio
had a return of 1.2 per cent (1.1) for the quarter.
Year-to-date development The rise in interest rates in the year to date had a negative
impact on fixed income investments with a long duration. At the
same time, lower credit margins contributed positively. There
were also some positive effects from higher inflation (lower real
rates) in the fixed-income portfolio. Net of these changes, there
was a modest positive return on fixed-income securities for the
period. An improved outlook for economic recovery supported
returns on fixed income securities with credit exposure, equities,
commodities and real estate.
The financial result for the period was NOK 1,565.7 million
(189.8), which corresponds to a return on total assets of 2.6 per
cent (0.3).
4 The geographical distribution is related to issuers and does not reflect actual currency exposure.
Organisation
The Group had a total of 3,710 employees at the end of the third
quarter, compared with 3,699 at the end of the second quarter.
The composition of the Group’s employees was as follows:
1,938 (1,915) in general insurance operations in Norway, 100
(97) in Gjensidige Pensjonsforsikring, 736 (740) in Denmark,
252 (263) in Sweden and 684 (684) in the Baltic states
(excluding agents). The figures in brackets refer to the number
of employees at the end of the second quarter.
Events after the balance sheet date
No significant events have occurred after the end of the period.
Dividend
The Board has decided to distribute excess capital of NOK 2,000 million, corresponding to NOK 4.00 per share. The decision was made on the basis of the Board’s authorisation to determine distribution of dividend, granted by the General Meeting on 24 March 2021. The distribution is in accordance with the current capital strategy and dividend policy.
The payment of the dividend is pending approval from the
Financial Supervisory Authority of Norway. Relevant key dates
will be announced upon approval.
Strategy and outlook
Gjensidige’s ambition is to become the most customer-oriented
general insurance company in the Nordic region. The Group’s
priority is to retain its strong and unique position in Norway and
to continue improving its profitability outside Norway.
Furthermore, the Group will focus on ensuring continued capital
discipline, including delivering attractive returns to shareholders.
A fundamental prerequisite for long term value creation is
sustainable choices and solutions. The top three priorities are
contributing to a safer society, reduced CO2 emissions and
responsible investments.
Geopolitical uncertainty, low interest rates and financial
challenges in several key economies reflect an uncertain
economic situation. As in the rest of the world, the pandemic has
had a significant impact on the economies in Gjensidige’s
markets. However, there has been a strong rebound, particularly
in the Nordics, thanks to large stimulus packages and gradual
14
easing of restrictions. Although there is still uncertainty, the
forecast for economic activity in Gjensidige’s markets is very
encouraging. The risk of pressure on insurance volumes in the
wake of the pandemic is thus significantly lower than initially
expected.
Organic growth is expected to be in line with nominal GDP
growth in Gjensidige’s market areas in the Nordic and Baltic
countries over time. On the Group level, near term growth is
expected to be higher. In addition, profitable growth will be
achieved by pursuing a disciplined acquisition strategy, as has
been done successfully in the past.
Staying ahead of claims inflation is key to maintaining good
profitability and has a high priority in Gjensidige. Claims inflation
experienced during the third quarter were in line with normal
expectations. Given a situation of potential supply shortages and
high demand for many products, Gjensidige is vigilantly
monitoring developments in the relevant markets for signs that
inflation might increase beyond the current expectation.
Gjensidige will continue to put through necessary price
increases as a response.
The Covid-19 pandemic has had a limited impact on
Gjensidige’s insurance operations. Overall, the pandemic has
had a positive impact on claims costs. Restrictions have
gradually been lifted, following the roll out of vaccination
programmes. Hence, we expect activity in our markets and
claims to continue the gradual return to more normal levels.
In the next few years, it is expected that Gjensidige’s business
model and the type of market participants will broadly stay the
same. Gjensidige has different positions and preconditions for
further growth and development in the different segments and
geographies. Best practices will be implemented across
segments and borders where this is natural and expedient.
Profitability will be prioritised over growth.
A key strategic priority in the next few years is maintaining and
cultivating the direct customer relationship. Gjensidige aims to
achieve greater relevance and create sales opportunities by
offering customers a broader value proposition than ever before
– in terms of both services and products, alone or in partnership
with other providers. The goal is to become an even better and
more relevant partner for customers – a problem-solver with a
stronger focus on claims prevention – thereby further
strengthening the customer relationship.
Continued investments in technology and data are key to
reducing costs and achieving enhanced functionality and
flexibility. This is necessary to enable more flexible partner
integration and product modularity. The launch of next-
generation tariffs, CRM and investments in a new core system
and IT infrastructure are important in order to succeed in
becoming an analytics-driven company. This will result in better
customer experiences and more efficient operations and create
sufficient capacity for innovation. Gjensidige has launched its
new core IT system for Private Denmark and will gradually
implement it in other parts of the Danish operations and other
geographies. The investment is expected to be handled within
the current cost ratio target.
Gjensidige has a robust investment strategy, although returns
are sensitive to market conditions.
The Group has high capital buffers in relation to internal risk
models, statutory solvency requirements and its target rating.
The Board considers the Group’s capital situation and financial
strength to be very strong.
There is always considerable uncertainty associated with the
assessment of future developments. However, the Board
remains confident in Gjensidige’s ability to deliver solid earnings-
and dividend growth over time.
Oslo, 19 October 2021
The Board of Gjensidige Forsikring ASA
Gisele Marchand
Chair of the Board
Eivind Elnan
Board member
Ellen Kristin Enger
Board member
Vibeke Krag
Board member
Sebastian B.G. Kristiansen
Board member
Tor Magne Lønnum
Board member
Hilde M. Nafstad
Board member
Ruben Pettersen
Board member
Terje Seljeseth
Board member
Gunnar Robert Sellæg
Board member
Helge Leiro Baastad
CEO
The Group’s annual financial and solvency targets
through 2022 are as follows:
• A combined ratio of between 86 and 89 per cent
(undiscounted)
• Corresponding to 90 to 93 per cent given zero
run-off gains
• Average annual run-off gains of approximately
NOK 1 billion are still expected through 2022
• A cost ratio <15 per cent
• A solvency margin based on the Partial Internal
Model of between 150 and 200 per cent
• To support an ‘A’ rating, stable regular
dividends over time, financial flexibility for
smaller acquisitions and organic growth not
financed through retained earnings, as well as
providing a buffer for regulatory changes.
• Return on equity after tax > 20 per cent
• Corresponding to > 16 per cent excluding run-
off gains
These are financial targets and should not be regarded as guidance for any specific
quarter or year. Unexpected circumstances relating to the weather, the proportion of
large losses and run-off gains or losses could contribute to a combined ratio that is
above or below the annual target range.

15
16
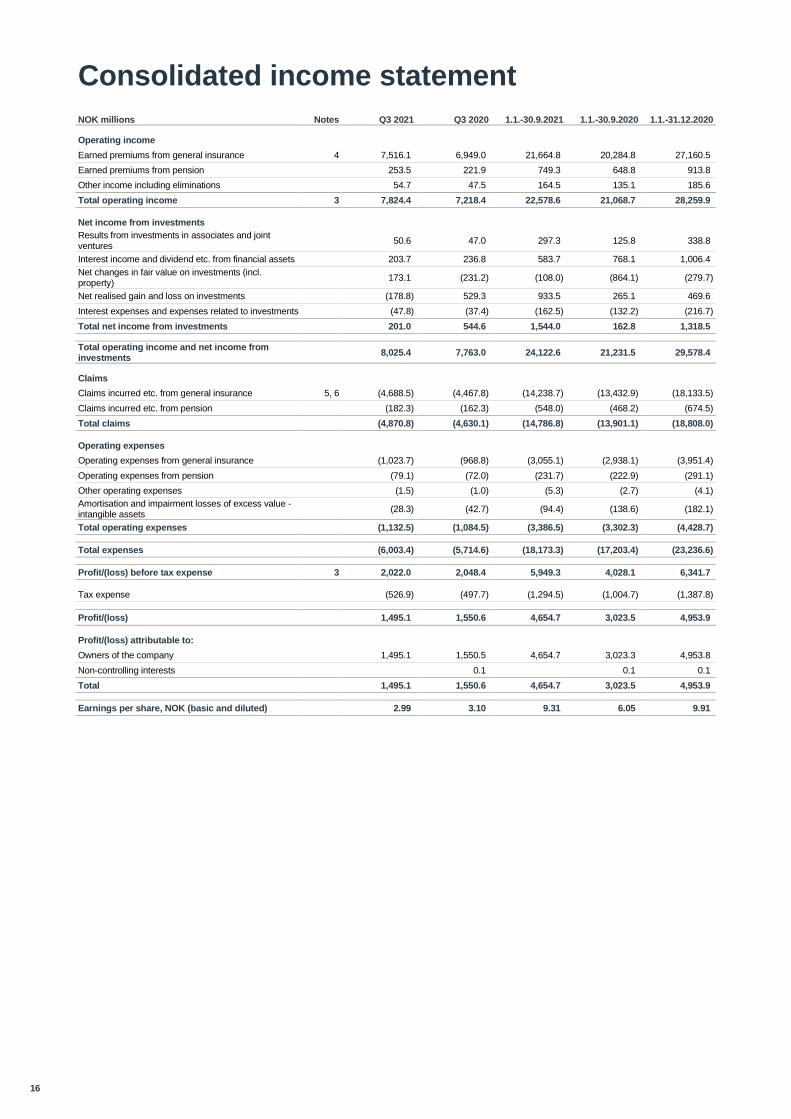
Consolidated income statement
NOK millions Notes Q3 2021 Q3 2020 1.1.-30.9.2021 1.1.-30.9.2020 1.1.-31.12.2020
Operating income
Earned premiums from general insurance 4 7,516.1 6,949.0 21,664.8 20,284.8 27,160.5
Earned premiums from pension 253.5 221.9 749.3 648.8 913.8
Other income including eliminations 54.7 47.5 164.5 135.1 185.6
Total operating income 3 7,824.4 7,218.4 22,578.6 21,068.7 28,259.9
Net income from investments
Results from investments in associates and joint ventures
50.6 47.0 297.3 125.8 338.8
Interest income and dividend etc. from financial assets 203.7 236.8 583.7 768.1 1,006.4
Net changes in fair value on investments (incl. property)
173.1 (231.2) (108.0) (864.1) (279.7)
Net realised gain and loss on investments (178.8) 529.3 933.5 265.1 469.6
Interest expenses and expenses related to investments (47.8) (37.4) (162.5) (132.2) (216.7)
Total net income from investments 201.0 544.6 1,544.0 162.8 1,318.5
Total operating income and net income from investments
8,025.4 7,763.0 24,122.6 21,231.5 29,578.4
Claims
Claims incurred etc. from general insurance 5, 6 (4,688.5) (4,467.8) (14,238.7) (13,432.9) (18,133.5)
Claims incurred etc. from pension (182.3) (162.3) (548.0) (468.2) (674.5)
Total claims (4,870.8) (4,630.1) (14,786.8) (13,901.1) (18,808.0)
Operating expenses
Operating expenses from general insurance (1,023.7) (968.8) (3,055.1) (2,938.1) (3,951.4)
Operating expenses from pension (79.1) (72.0) (231.7) (222.9) (291.1)
Other operating expenses (1.5) (1.0) (5.3) (2.7) (4.1)
Amortisation and impairment losses of excess value - intangible assets
(28.3) (42.7) (94.4) (138.6) (182.1)
Total operating expenses (1,132.5) (1,084.5) (3,386.5) (3,302.3) (4,428.7)
Total expenses (6,003.4) (5,714.6) (18,173.3) (17,203.4) (23,236.6)
Profit/(loss) before tax expense 3 2,022.0 2,048.4 5,949.3 4,028.1 6,341.7
Tax expense (526.9) (497.7) (1,294.5) (1,004.7) (1,387.8)
Profit/(loss) 1,495.1 1,550.6 4,654.7 3,023.5 4,953.9
Profit/(loss) attributable to:
Owners of the company 1,495.1 1,550.5 4,654.7 3,023.3 4,953.8
Non-controlling interests 0.1 0.1 0.1
Total 1,495.1 1,550.6 4,654.7 3,023.5 4,953.9
Earnings per share, NOK (basic and diluted) 2.99 3.10 9.31 6.05 9.91
17
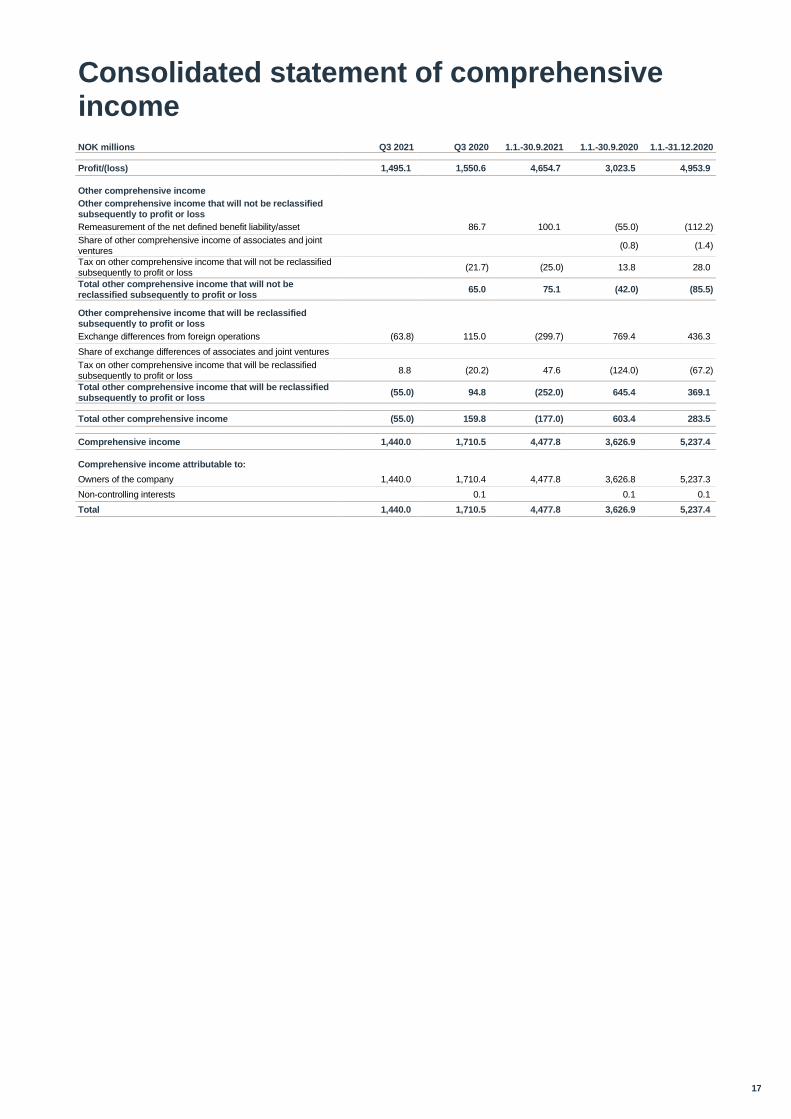
Consolidated statement of comprehensive income
NOK millions Q3 2021 Q3 2020 1.1.-30.9.2021 1.1.-30.9.2020 1.1.-31.12.2020
Profit/(loss) 1,495.1 1,550.6 4,654.7 3,023.5 4,953.9
Other comprehensive income
Other comprehensive income that will not be reclassified subsequently to profit or loss
Remeasurement of the net defined benefit liability/asset 86.7 100.1 (55.0) (112.2)
Share of other comprehensive income of associates and joint ventures
(0.8) (1.4)
Tax on other comprehensive income that will not be reclassified subsequently to profit or loss
(21.7) (25.0) 13.8 28.0
Total other comprehensive income that will not be reclassified subsequently to profit or loss
65.0 75.1 (42.0) (85.5)
Other comprehensive income that will be reclassified subsequently to profit or loss
Exchange differences from foreign operations (63.8) 115.0 (299.7) 769.4 436.3
Share of exchange differences of associates and joint ventures
Tax on other comprehensive income that will be reclassified subsequently to profit or loss
8.8 (20.2) 47.6 (124.0) (67.2)
Total other comprehensive income that will be reclassified subsequently to profit or loss
(55.0) 94.8 (252.0) 645.4 369.1
Total other comprehensive income (55.0) 159.8 (177.0) 603.4 283.5
Comprehensive income 1,440.0 1,710.5 4,477.8 3,626.9 5,237.4
Comprehensive income attributable to:
Owners of the company 1,440.0 1,710.4 4,477.8 3,626.8 5,237.3
Non-controlling interests 0.1 0.1 0.1
Total 1,440.0 1,710.5 4,477.8 3,626.9 5,237.4
18
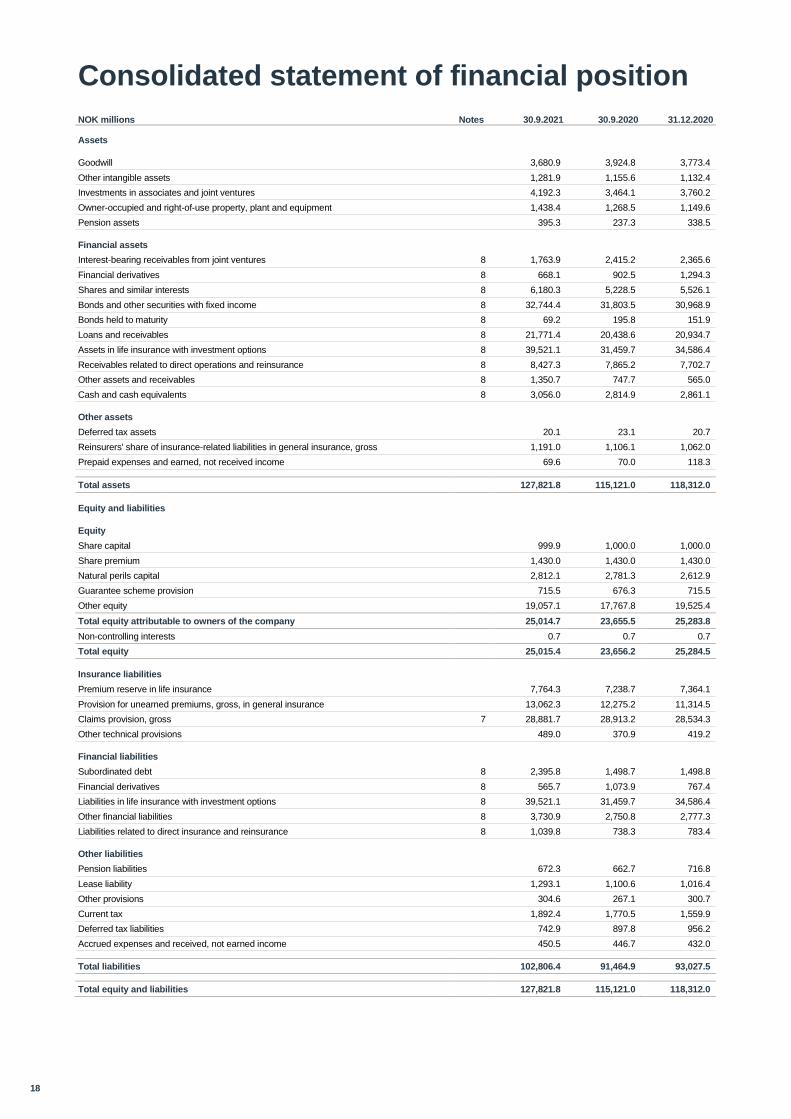
Consolidated statement of financial position
NOK millions Notes 30.9.2021 30.9.2020 31.12.2020
Assets
Goodwill 3,680.9 3,924.8 3,773.4
Other intangible assets 1,281.9 1,155.6 1,132.4
Investments in associates and joint ventures 4,192.3 3,464.1 3,760.2
Owner-occupied and right-of-use property, plant and equipment 1,438.4 1,268.5 1,149.6
Pension assets 395.3 237.3 338.5
Financial assets
Interest-bearing receivables from joint ventures 8 1,763.9 2,415.2 2,365.6
Financial derivatives 8 668.1 902.5 1,294.3
Shares and similar interests 8 6,180.3 5,228.5 5,526.1
Bonds and other securities with fixed income 8 32,744.4 31,803.5 30,968.9
Bonds held to maturity 8 69.2 195.8 151.9
Loans and receivables 8 21,771.4 20,438.6 20,934.7
Assets in life insurance with investment options 8 39,521.1 31,459.7 34,586.4
Receivables related to direct operations and reinsurance 8 8,427.3 7,865.2 7,702.7
Other assets and receivables 8 1,350.7 747.7 565.0
Cash and cash equivalents 8 3,056.0 2,814.9 2,861.1
Other assets
Deferred tax assets 20.1 23.1 20.7
Reinsurers' share of insurance-related liabilities in general insurance, gross 1,191.0 1,106.1 1,062.0
Prepaid expenses and earned, not received income 69.6 70.0 118.3
Total assets 127,821.8 115,121.0 118,312.0
Equity and liabilities
Equity
Share capital 999.9 1,000.0 1,000.0
Share premium 1,430.0 1,430.0 1,430.0
Natural perils capital 2,812.1 2,781.3 2,612.9
Guarantee scheme provision 715.5 676.3 715.5
Other equity 19,057.1 17,767.8 19,525.4
Total equity attributable to owners of the company 25,014.7 23,655.5 25,283.8
Non-controlling interests 0.7 0.7 0.7
Total equity 25,015.4 23,656.2 25,284.5
Insurance liabilities
Premium reserve in life insurance 7,764.3 7,238.7 7,364.1
Provision for unearned premiums, gross, in general insurance 13,062.3 12,275.2 11,314.5
Claims provision, gross 7 28,881.7 28,913.2 28,534.3
Other technical provisions 489.0 370.9 419.2
Financial liabilities
Subordinated debt 8 2,395.8 1,498.7 1,498.8
Financial derivatives 8 565.7 1,073.9 767.4
Liabilities in life insurance with investment options 8 39,521.1 31,459.7 34,586.4
Other financial liabilities 8 3,730.9 2,750.8 2,777.3
Liabilities related to direct insurance and reinsurance 8 1,039.8 738.3 783.4
Other liabilities
Pension liabilities 672.3 662.7 716.8
Lease liability 1,293.1 1,100.6 1,016.4
Other provisions 304.6 267.1 300.7
Current tax 1,892.4 1,770.5 1,559.9
Deferred tax liabilities 742.9 897.8 956.2
Accrued expenses and received, not earned income 450.5 446.7 432.0
Total liabilities 102,806.4 91,464.9 93,027.5
Total equity and liabilities 127,821.8 115,121.0 118,312.0
19
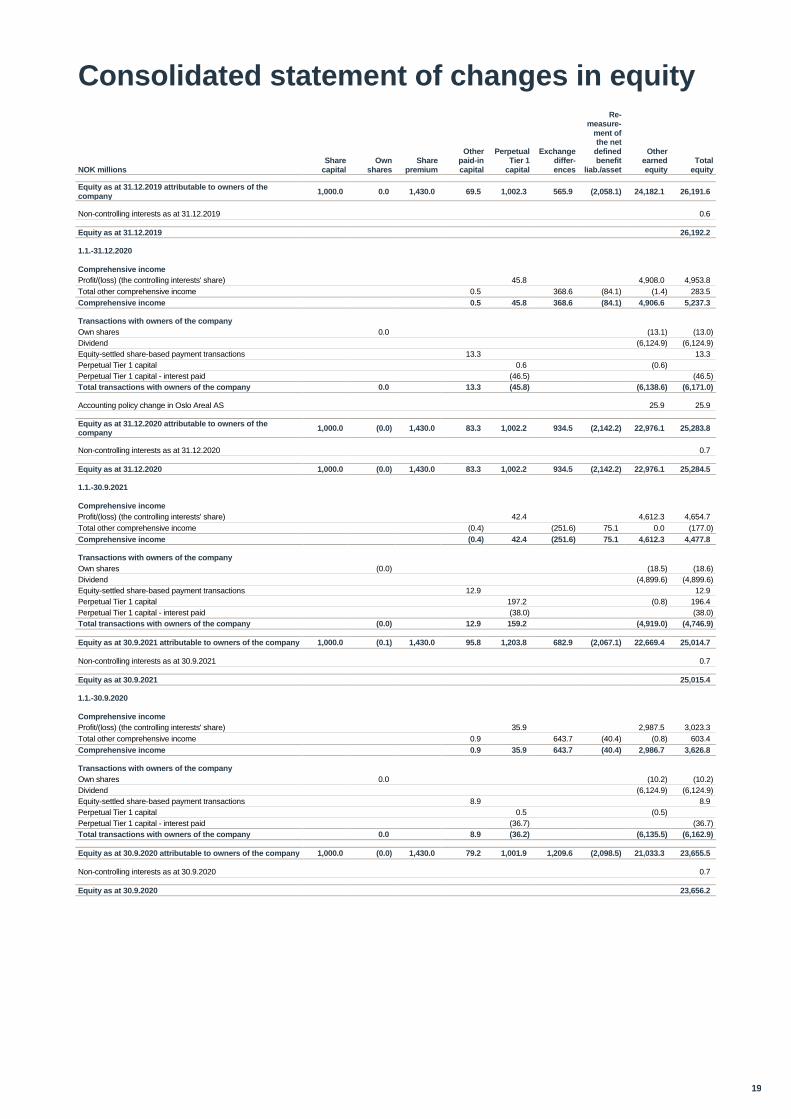
Consolidated statement of changes in equity
NOK millions Share
capital Own
shares Share
premium
Other paid-in capital
Perpetual Tier 1
capital
Exchange differ-ences
Re- measure-
ment of the net
defined benefit
liab./asset
Other earned equity
Total equity
Equity as at 31.12.2019 attributable to owners of the company
1,000.0 0.0 1,430.0 69.5 1,002.3 565.9 (2,058.1) 24,182.1 26,191.6
Non-controlling interests as at 31.12.2019 0.6
Equity as at 31.12.2019 26,192.2
1.1.-31.12.2020
Comprehensive income
Profit/(loss) (the controlling interests' share) 45.8 4,908.0 4,953.8
Total other comprehensive income 0.5 368.6 (84.1) (1.4) 283.5
Comprehensive income 0.5 45.8 368.6 (84.1) 4,906.6 5,237.3
Transactions with owners of the company
Own shares 0.0 (13.1) (13.0)
Dividend (6,124.9) (6,124.9)
Equity-settled share-based payment transactions 13.3 13.3
Perpetual Tier 1 capital 0.6 (0.6)
Perpetual Tier 1 capital - interest paid (46.5) (46.5)
Total transactions with owners of the company 0.0 13.3 (45.8) (6,138.6) (6,171.0)
Accounting policy change in Oslo Areal AS 25.9 25.9
Equity as at 31.12.2020 attributable to owners of the company
1,000.0 (0.0) 1,430.0 83.3 1,002.2 934.5 (2,142.2) 22,976.1 25,283.8
Non-controlling interests as at 31.12.2020 0.7
Equity as at 31.12.2020 1,000.0 (0.0) 1,430.0 83.3 1,002.2 934.5 (2,142.2) 22,976.1 25,284.5
1.1.-30.9.2021
Comprehensive income
Profit/(loss) (the controlling interests' share) 42.4 4,612.3 4,654.7
Total other comprehensive income (0.4) (251.6) 75.1 0.0 (177.0)
Comprehensive income (0.4) 42.4 (251.6) 75.1 4,612.3 4,477.8
Transactions with owners of the company
Own shares (0.0) (18.5) (18.6)
Dividend (4,899.6) (4,899.6)
Equity-settled share-based payment transactions 12.9 12.9
Perpetual Tier 1 capital 197.2 (0.8) 196.4
Perpetual Tier 1 capital - interest paid (38.0) (38.0)
Total transactions with owners of the company (0.0) 12.9 159.2 (4,919.0) (4,746.9)
Equity as at 30.9.2021 attributable to owners of the company 1,000.0 (0.1) 1,430.0 95.8 1,203.8 682.9 (2,067.1) 22,669.4 25,014.7
Non-controlling interests as at 30.9.2021 0.7
Equity as at 30.9.2021 25,015.4
1.1.-30.9.2020
Comprehensive income
Profit/(loss) (the controlling interests' share) 35.9 2,987.5 3,023.3
Total other comprehensive income 0.9 643.7 (40.4) (0.8) 603.4
Comprehensive income 0.9 35.9 643.7 (40.4) 2,986.7 3,626.8
Transactions with owners of the company
Own shares 0.0 (10.2) (10.2)
Dividend (6,124.9) (6,124.9)
Equity-settled share-based payment transactions 8.9 8.9
Perpetual Tier 1 capital 0.5 (0.5)
Perpetual Tier 1 capital - interest paid (36.7) (36.7)
Total transactions with owners of the company 0.0 8.9 (36.2) (6,135.5) (6,162.9)
Equity as at 30.9.2020 attributable to owners of the company 1,000.0 (0.0) 1,430.0 79.2 1,001.9 1,209.6 (2,098.5) 21,033.3 23,655.5
Non-controlling interests as at 30.9.2020 0.7
Equity as at 30.9.2020 23,656.2
20
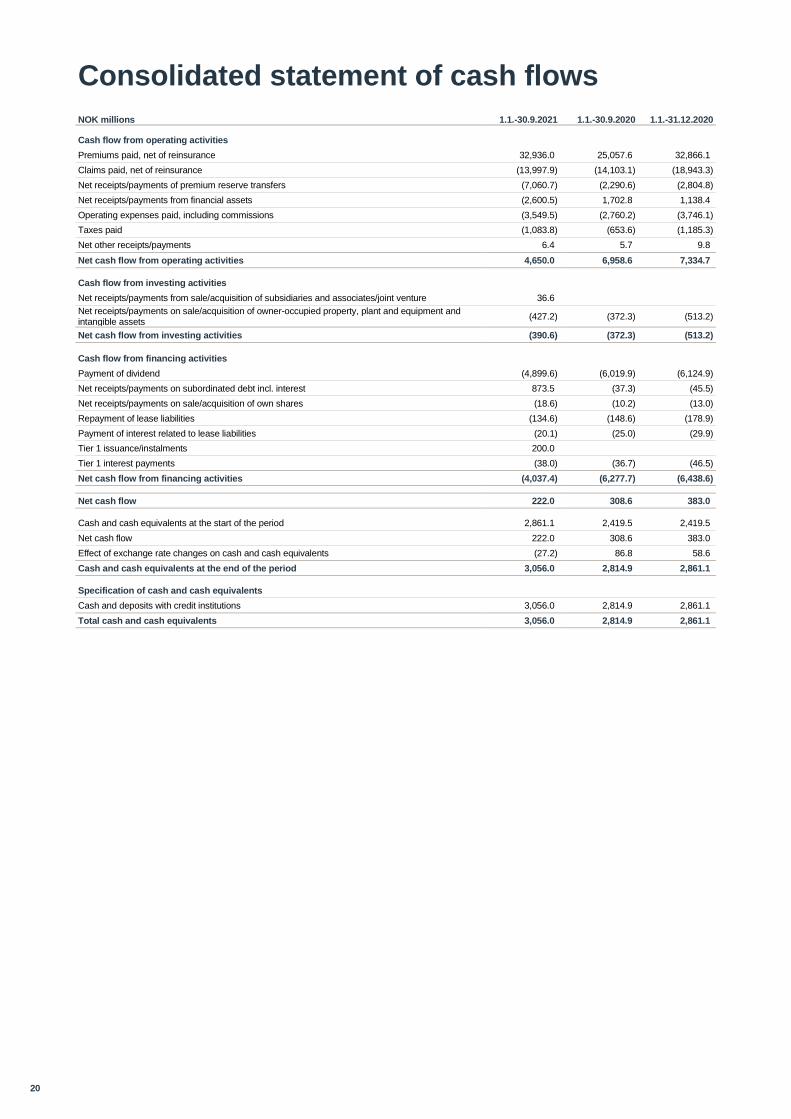
Consolidated statement of cash flows
NOK millions 1.1.-30.9.2021 1.1.-30.9.2020 1.1.-31.12.2020
Cash flow from operating activities
Premiums paid, net of reinsurance 32,936.0 25,057.6 32,866.1
Claims paid, net of reinsurance (13,997.9) (14,103.1) (18,943.3)
Net receipts/payments of premium reserve transfers (7,060.7) (2,290.6) (2,804.8)
Net receipts/payments from financial assets (2,600.5) 1,702.8 1,138.4
Operating expenses paid, including commissions (3,549.5) (2,760.2) (3,746.1)
Taxes paid (1,083.8) (653.6) (1,185.3)
Net other receipts/payments 6.4 5.7 9.8
Net cash flow from operating activities 4,650.0 6,958.6 7,334.7
Cash flow from investing activities
Net receipts/payments from sale/acquisition of subsidiaries and associates/joint venture 36.6
Net receipts/payments on sale/acquisition of owner-occupied property, plant and equipment and intangible assets
(427.2) (372.3) (513.2)
Net cash flow from investing activities (390.6) (372.3) (513.2)
Cash flow from financing activities
Payment of dividend (4,899.6) (6,019.9) (6,124.9)
Net receipts/payments on subordinated debt incl. interest 873.5 (37.3) (45.5)
Net receipts/payments on sale/acquisition of own shares (18.6) (10.2) (13.0)
Repayment of lease liabilities (134.6) (148.6) (178.9)
Payment of interest related to lease liabilities (20.1) (25.0) (29.9)
Tier 1 issuance/instalments 200.0
Tier 1 interest payments (38.0) (36.7) (46.5)
Net cash flow from financing activities (4,037.4) (6,277.7) (6,438.6)
Net cash flow 222.0 308.6 383.0
Cash and cash equivalents at the start of the period 2,861.1 2,419.5 2,419.5
Net cash flow 222.0 308.6 383.0
Effect of exchange rate changes on cash and cash equivalents (27.2) 86.8 58.6
Cash and cash equivalents at the end of the period 3,056.0 2,814.9 2,861.1
Specification of cash and cash equivalents
Cash and deposits with credit institutions 3,056.0 2,814.9 2,861.1
Total cash and cash equivalents 3,056.0 2,814.9 2,861.1
21
Notes
1. Accounting policies
The consolidated financial statements as of the third quarter of
2021, concluded on 30 September 2021, comprise Gjensidige
Forsikring ASA and its subsidiaries (collectively referred to as
the Group) and the Group’s holdings in associated companies.
Except for the changes described below, the accounting policies
applied in the interim report is the same as those used in the
annual report for 2020.
The consolidated financial statements as of the third quarter of
2021 have been prepared in accordance with IFRS and IAS 34
Interim Financial Reporting. The interim report does not include
all the information required in a complete annual report and
should be read in conjunction with the annual report for 2020.
New standards and interpretations not yet adopted A number of new standards, changes to standards and
interpretations have been issued for financial years beginning
after 1 January 2021. They have not been applied when
preparing these consolidated financial statements. Those that
may be relevant to Gjensidige are mentioned below. Gjensidige
does not plan early implementation of these standards.
IFRS 9 Financial instruments (2014) in the insurance operations
IFRS 9 addresses the accounting for financial instruments and is
effective for annual periods beginning on or after 1 January
2018. The standard introduces new requirements for the
classification and measurement of financial assets, including a
new expected loss model for the recognition of impairment
losses, and changed requirements for hedge accounting.
IFRS 9 contains three primary measurement categories for
financial assets: amortised cost, fair value through other
comprehensive income, and fair value through profit or loss.
Financial assets will be classified either at amortised cost, at fair
value through other comprehensive income, or at fair value
through profit or loss, depending on how they are managed and
which contractual cash flow properties they have. IFRS 9
introduces a new requirement regarding financial liabilities
earmarked at fair value where changes in fair value that can be
attributed to the liabilities' credit risk are presented in other
comprehensive income rather than over profit or loss.
Amendments to IFRS 4 Applying IFRS 9 Financial Instruments with IFRS 4 Insurance Contracts (2016)
The amendments to IFRS 4 permit entities that predominantly
undertake insurance activities the option to defer the effective
date of IFRS 9 until 1 January 2021. The effect of such a
deferral is that the entities concerned may continue to report
under the existing standard, IAS 39 Financial Instruments. In
addition, the insurance sector of a financial conglomerate is
allowed to defer the application of IFRS 9 until 1 January 2021,
where all of the following conditions are met:
• no financial instruments are transferred between the
insurance sector and any other sector of the financial
conglomerate other than financial instruments that are
measured at fair value with changes in fair value
recognised through the profit of loss account by both
sectors involved in such transfers;
• the financial conglomerate states in the consolidated
financial statements which insurance entities in the group
are applying IAS 39;
• disclosures requested by IFRS 7 are provided separately
for the insurance sector applying IAS 39 and for the rest of
the group applying IFRS 9.
Gjensidige is a financial conglomerate which primarily operates
insurance business and has therefore decided to make use of
this exception. The IFRS 9 will be effective 1 January 2023, at
the same date as IFRS 17.
IFRS 17 Insurance Contracts (2017)
IFRS 17 establishes principles for the recognition, measurement,
presentation and disclosure of insurance contracts issued. IFRS
17 is a complex standard that includes some fundamental
differences to current accounting for liability measurement and
profit recognition. Insurance contracts will be recognised at a
risk-adjusted present value of the future cash flows plus an
amount representing the unearned profit in the group of
contracts (the contractual service margin). If a group of contracts
is or become loss-making, the loss will be recognised
immediately. Insurance revenue, insurance service expenses
and insurance finance income or expenses will be presented
separately. IFRS 17 is effective from 1 January 2023. The
standard is expected to have an effect on the group’s financial
statements, significantly changing the measurement and
presentation of income and expenses.
Based on our preliminary assessments and based on
Gjensidige’s current operations, other amendments to standards
and interpretation statements will not have a significant effect.
The preparation of interim accounts involves the application of
assessments, estimates and assumptions that affect the use of
accounting policies and the amounts recognised for assets and
liabilities, revenues and expenses. The actual results may
deviate from these estimates. The most material assessments
involved in applying the Group’s accounting policies and the
most important sources of uncertainty in the estimates are the
same regarding preparing the interim report as in the annual
report for 2019.
Comparable figures are based on IFRS. All amounts are shown
in NOK millions unless otherwise indicated. Due to rounding-off
differences, figures and percentages may not exactly add up to
the exact total figures.
Notes are presented on a Group level. Separate notes for
Gjensidige Forsikring ASA (GF ASA) are not presented as GF
ASA is the material part of the Group and therefore the notes for
the Group give a sufficient presentation of both the Group and
GF ASA.
A complete or limited audit of the interim report has not been
carried out.
22
2. Seasonal variations
For some insurance products, seasonal premiums are used.
This is because the incidence of claims is not evenly distributed
throughout the year but follows a stable seasonal pattern.
Normally, premium income (earned premiums) is accrued evenly
over the period of insurance, but for products with a seasonal
pattern, premium income must also be allocated according to the
incidence of claims. Gjensidige Forsikring has a seasonal
premium for the following products: pleasure craft, snowmobiles
and motorcycles. For example, for motorcycles, earned
premiums for the period from April to September amount to a full
85 per cent of the annual premiums.
Another consequence of a seasonal premium is that if the
customer cancels the insurance contract before the renewal
date, only the portion of the seasonal premium is refunded for
which the Company did not bear any risk. For motorcycle
insurance taken out on 1 April, but cancelled on 1 October, the
policyholder will only be refunded 15 per cent of the annual
premium, even though the insurance was in effect only for six
months.
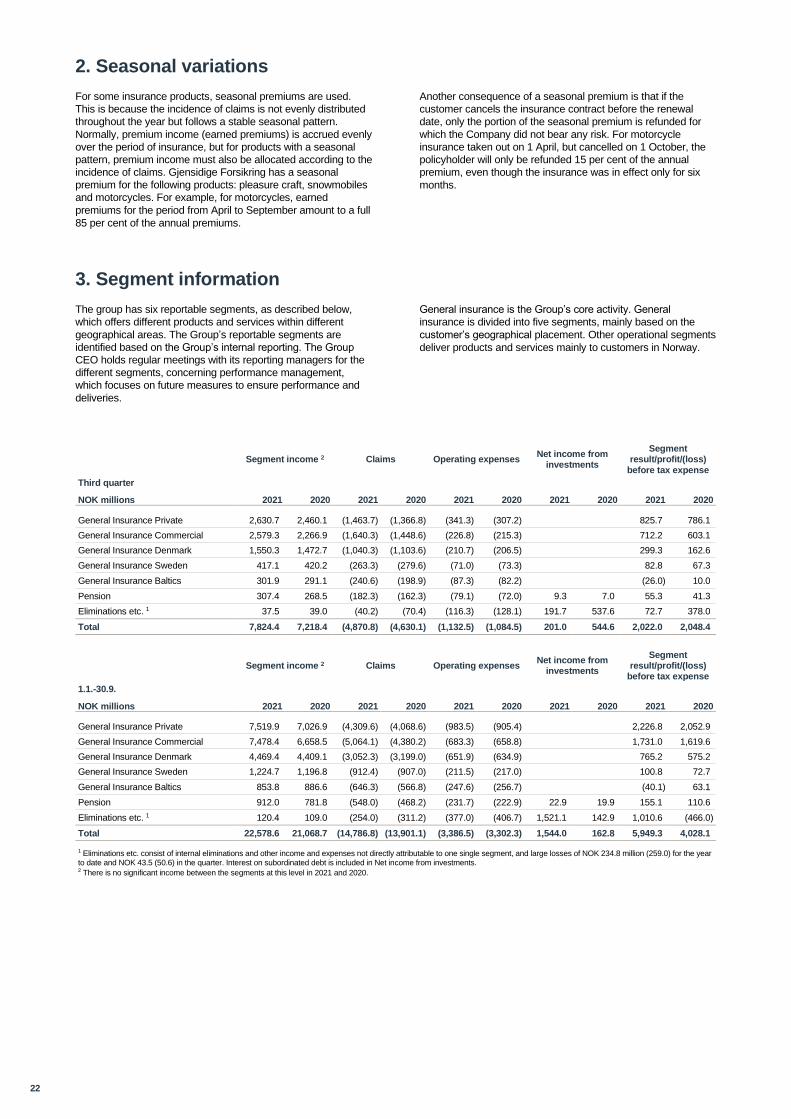
3. Segment information
The group has six reportable segments, as described below,
which offers different products and services within different
geographical areas. The Group’s reportable segments are
identified based on the Group’s internal reporting. The Group
CEO holds regular meetings with its reporting managers for the
different segments, concerning performance management,
which focuses on future measures to ensure performance and
deliveries.
General insurance is the Group’s core activity. General
insurance is divided into five segments, mainly based on the
customer’s geographical placement. Other operational segments
deliver products and services mainly to customers in Norway.
Segment income 2 Claims Operating expenses Net income from
investments
Segment result/profit/(loss)
before tax expense
Third quarter
NOK millions 2021 2020 2021 2020 2021 2020 2021 2020 2021 2020
General Insurance Private 2,630.7 2,460.1 (1,463.7) (1,366.8) (341.3) (307.2) 825.7 786.1
General Insurance Commercial 2,579.3 2,266.9 (1,640.3) (1,448.6) (226.8) (215.3) 712.2 603.1
General Insurance Denmark 1,550.3 1,472.7 (1,040.3) (1,103.6) (210.7) (206.5) 299.3 162.6
General Insurance Sweden 417.1 420.2 (263.3) (279.6) (71.0) (73.3) 82.8 67.3
General Insurance Baltics 301.9 291.1 (240.6) (198.9) (87.3) (82.2) (26.0) 10.0
Pension 307.4 268.5 (182.3) (162.3) (79.1) (72.0) 9.3 7.0 55.3 41.3
Eliminations etc. 1 37.5 39.0 (40.2) (70.4) (116.3) (128.1) 191.7 537.6 72.7 378.0
Total 7,824.4 7,218.4 (4,870.8) (4,630.1) (1,132.5) (1,084.5) 201.0 544.6 2,022.0 2,048.4
Segment income 2 Claims Operating expenses Net income from
investments
Segment result/profit/(loss)
before tax expense
1.1.-30.9.
NOK millions 2021 2020 2021 2020 2021 2020 2021 2020 2021 2020
General Insurance Private 7,519.9 7,026.9 (4,309.6) (4,068.6) (983.5) (905.4) 2,226.8 2,052.9
General Insurance Commercial 7,478.4 6,658.5 (5,064.1) (4,380.2) (683.3) (658.8) 1,731.0 1,619.6
General Insurance Denmark 4,469.4 4,409.1 (3,052.3) (3,199.0) (651.9) (634.9) 765.2 575.2
General Insurance Sweden 1,224.7 1,196.8 (912.4) (907.0) (211.5) (217.0) 100.8 72.7
General Insurance Baltics 853.8 886.6 (646.3) (566.8) (247.6) (256.7) (40.1) 63.1
Pension 912.0 781.8 (548.0) (468.2) (231.7) (222.9) 22.9 19.9 155.1 110.6
Eliminations etc. 1 120.4 109.0 (254.0) (311.2) (377.0) (406.7) 1,521.1 142.9 1,010.6 (466.0)
Total 22,578.6 21,068.7 (14,786.8) (13,901.1) (3,386.5) (3,302.3) 1,544.0 162.8 5,949.3 4,028.1
1 Eliminations etc. consist of internal eliminations and other income and expenses not directly attributable to one single segment, and large losses of NOK 234.8 million (259.0) for the year to date and NOK 43.5 (50.6) in the quarter. Interest on subordinated debt is included in Net income from investments. 2 There is no significant income between the segments at this level in 2021 and 2020.
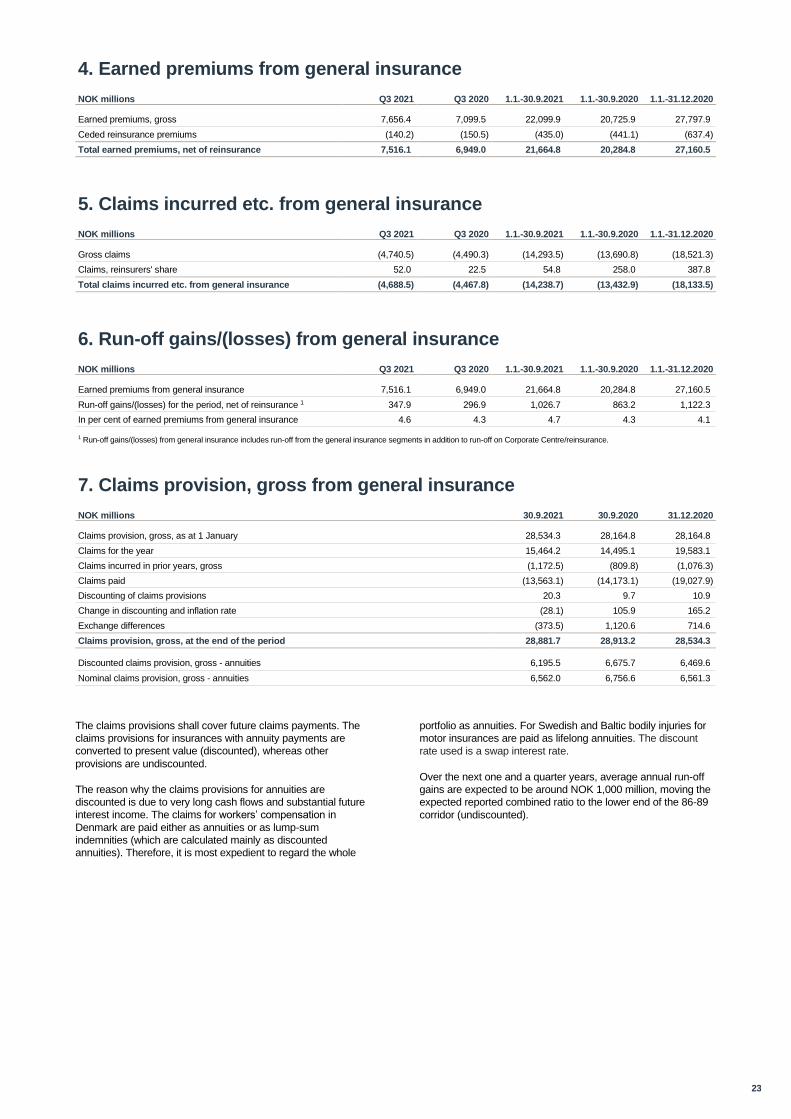
23
4. Earned premiums from general insurance
NOK millions Q3 2021 Q3 2020 1.1.-30.9.2021 1.1.-30.9.2020 1.1.-31.12.2020
Earned premiums, gross 7,656.4 7,099.5 22,099.9 20,725.9 27,797.9
Ceded reinsurance premiums (140.2) (150.5) (435.0) (441.1) (637.4)
Total earned premiums, net of reinsurance 7,516.1 6,949.0 21,664.8 20,284.8 27,160.5
5. Claims incurred etc. from general insurance
NOK millions Q3 2021 Q3 2020 1.1.-30.9.2021 1.1.-30.9.2020 1.1.-31.12.2020
Gross claims (4,740.5) (4,490.3) (14,293.5) (13,690.8) (18,521.3)
Claims, reinsurers' share 52.0 22.5 54.8 258.0 387.8
Total claims incurred etc. from general insurance (4,688.5) (4,467.8) (14,238.7) (13,432.9) (18,133.5)
6. Run-off gains/(losses) from general insurance
NOK millions Q3 2021 Q3 2020 1.1.-30.9.2021 1.1.-30.9.2020 1.1.-31.12.2020
Earned premiums from general insurance 7,516.1 6,949.0 21,664.8 20,284.8 27,160.5
Run-off gains/(losses) for the period, net of reinsurance 1 347.9 296.9 1,026.7 863.2 1,122.3
In per cent of earned premiums from general insurance 4.6 4.3 4.7 4.3 4.1
1 Run-off gains/(losses) from general insurance includes run-off from the general insurance segments in addition to run-off on Corporate Centre/reinsurance.
7. Claims provision, gross from general insurance
NOK millions 30.9.2021 30.9.2020 31.12.2020
Claims provision, gross, as at 1 January 28,534.3 28,164.8 28,164.8
Claims for the year 15,464.2 14,495.1 19,583.1
Claims incurred in prior years, gross (1,172.5) (809.8) (1,076.3)
Claims paid (13,563.1) (14,173.1) (19,027.9)
Discounting of claims provisions 20.3 9.7 10.9
Change in discounting and inflation rate (28.1) 105.9 165.2
Exchange differences (373.5) 1,120.6 714.6
Claims provision, gross, at the end of the period 28,881.7 28,913.2 28,534.3
Discounted claims provision, gross - annuities 6,195.5 6,675.7 6,469.6
Nominal claims provision, gross - annuities 6,562.0 6,756.6 6,561.3
The claims provisions shall cover future claims payments. The
claims provisions for insurances with annuity payments are
converted to present value (discounted), whereas other
provisions are undiscounted.
The reason why the claims provisions for annuities are
discounted is due to very long cash flows and substantial future
interest income. The claims for workers’ compensation in
Denmark are paid either as annuities or as lump-sum
indemnities (which are calculated mainly as discounted
annuities). Therefore, it is most expedient to regard the whole
portfolio as annuities. For Swedish and Baltic bodily injuries for
motor insurances are paid as lifelong annuities. The discount
rate used is a swap interest rate.
Over the next one and a quarter years, average annual run-off
gains are expected to be around NOK 1,000 million, moving the
expected reported combined ratio to the lower end of the 86-89
corridor (undiscounted).
24
8. Financial assets and liabilities
Fair value Financial assets and liabilities measured at fair value are carried
at the amount each asset/liability can be settled to in an orderly
transaction between market participants at the measurements
date at the prevailing market conditions.
Different valuation techniques and methods are used to estimate
fair value depending on the type of financial instruments and to
which extent they are traded in active markets. Instruments are
classified in their entirety in one of three valuation levels in a
hierarchy based on the lowest level input that is significant to the
fair value measurement in its entirety.
The different valuation levels and which financial assets/liabilities
that are included in the respective levels are accounted for
below.
Quoted prices in active markets
Quoted prices in active markets are considered the best
estimate of an asset/liability’s fair value. A financial asset/liability
is considered valued based on quoted prices in active markets if
fair value is estimated based on easily and regularly available
prices and these prices represent actual and regularly occurring
transactions at arm’s length principle. Financial assets/liabilities
valued based on quoted prices in active markets are classified
as level one in the valuation hierarchy.
The following financial assets are classified as level one in the
valuation hierarchy
• Listed shares
• Norwegian government/government backed bonds and other fixed income securities
• Exchange traded funds Valuation based on observable market data
When quoted prices in active markets are not available, the fair
value of financial assets/liabilities is preferably estimated based
on valuation techniques which are based on observable market
data.
A financial asset/liability is considered valued based on
observable market data if fair value is estimated with reference
to prices that are not quoted but are observable either directly
(as prices) or indirectly (derived from prices).
The following financial assets/liabilities are classified as level two
in the valuation hierarchy
• Currency derivatives, equity options and forward rate agreements, in which fair value is derived from the value of underlying instruments. These derivatives are valued using common valuation techniques for derivatives (option pricing models etc.).
• Equity funds, bond funds, hedge funds and combination funds, in which fair value is estimated based on the fair value of the underlying investments of the funds.
• Bonds, certificates or index bonds that are unlisted, or that are listed but where transactions are not occurring regularly. The unlisted instruments in this category are valued based on observable yield curves and estimated credit spreads where applicable.
• Listed subordinated debt where transactions are not occurring regularly.
Valuation based on non-observable market data
When neither quoted prices in active markets nor observable
market data is available, the fair value of financial
assets/liabilities is estimated based on valuation techniques
which are based on non-observable market data.
A financial asset/liability is considered valued based on non-
observable market data if fair value is estimated without being
based on quoted prices in active markets or observable market
data. Financial assets/liabilities valued based on non-observable
market data are classified as level three in the valuation
hierarchy.
The following financial assets are classified as level three in the
valuation hierarchy
• Unlisted private equity investments. The private equity investments that are not organised as funds are valued using cash flow analysis, price multiples and recent market transactions. The private equity investments that are organised as funds are valued based on NAV (Net Asset Value) as reported by the administrators in accordance with IPEV guidelines (International Private Equity and Venture Capital Valuation. Because of late reporting from the funds, the NAV from the previous quarterly reporting is used in estimating fair value. The NAV is then assessed for discretionary adjustments based on objective events since the last reporting date. Objective events may be the development in underlying values of listed companies since the last reporting, changes in regulations or substantial market movements.
• Loan funds containing secured debt and real estate funds. The funds are valued based on reported NAV values as reported by the fund administrators. Because of late reporting from the funds, the NAV values from the previous quarterly reporting are used in estimating fair value.
The valuation process for financial assets classified as level three
In consultation with the Investment Performance and Risk
Measurement department, the Chief Investment Officer decides
which valuation models will be used when valuing financial
assets classified as level three in the valuation hierarchy. The
models are evaluated as required. The fair value and results of
the investments and compliance with the stipulated limits are
reported weekly to the Chief Financial Officer and Chief
Executive Officer, and monthly to the Board.
Sensitivity financial assets level three Shares and similar interests (mainly unlisted private equity
investments, loan funds and real estate funds), as well as bonds
and other fixed-income securities are included in level three in
the valuation hierarchy. General market downturns or a
worsening of the outlook can affect expectations of future cash
flows or the applied multiples, which in turn will lead to a
reduction in value of shares and similar interests. Bonds and
other fixed-income securities primarily have interest rate and
credit risk as a result of changes in the yield curve or losses due
to unexpected default on Gjensidige’s debtors. However, the
sensitivity to changes in the yield curve is reduced through
hedging using interest rate swaps classified as level 2.
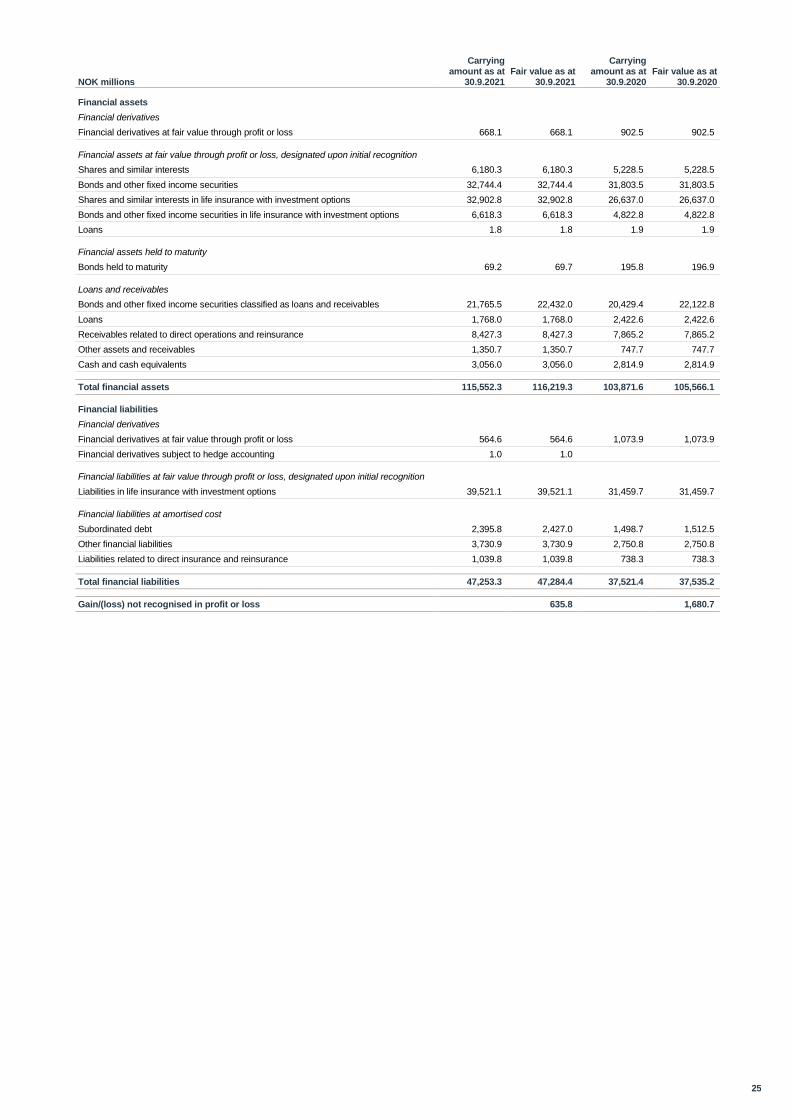
25
NOK millions
Carrying amount as at
30.9.2021 Fair value as at
30.9.2021
Carrying amount as at
30.9.2020 Fair value as at
30.9.2020
Financial assets
Financial derivatives
Financial derivatives at fair value through profit or loss 668.1 668.1 902.5 902.5
Financial assets at fair value through profit or loss, designated upon initial recognition
Shares and similar interests 6,180.3 6,180.3 5,228.5 5,228.5
Bonds and other fixed income securities 32,744.4 32,744.4 31,803.5 31,803.5
Shares and similar interests in life insurance with investment options 32,902.8 32,902.8 26,637.0 26,637.0
Bonds and other fixed income securities in life insurance with investment options 6,618.3 6,618.3 4,822.8 4,822.8
Loans 1.8 1.8 1.9 1.9
Financial assets held to maturity
Bonds held to maturity 69.2 69.7 195.8 196.9
Loans and receivables
Bonds and other fixed income securities classified as loans and receivables 21,765.5 22,432.0 20,429.4 22,122.8
Loans 1,768.0 1,768.0 2,422.6 2,422.6
Receivables related to direct operations and reinsurance 8,427.3 8,427.3 7,865.2 7,865.2
Other assets and receivables 1,350.7 1,350.7 747.7 747.7
Cash and cash equivalents 3,056.0 3,056.0 2,814.9 2,814.9
Total financial assets 115,552.3 116,219.3 103,871.6 105,566.1
Financial liabilities
Financial derivatives
Financial derivatives at fair value through profit or loss 564.6 564.6 1,073.9 1,073.9
Financial derivatives subject to hedge accounting 1.0 1.0
Financial liabilities at fair value through profit or loss, designated upon initial recognition
Liabilities in life insurance with investment options 39,521.1 39,521.1 31,459.7 31,459.7
Financial liabilities at amortised cost
Subordinated debt 2,395.8 2,427.0 1,498.7 1,512.5
Other financial liabilities 3,730.9 3,730.9 2,750.8 2,750.8
Liabilities related to direct insurance and reinsurance 1,039.8 1,039.8 738.3 738.3
Total financial liabilities 47,253.3 47,284.4 37,521.4 37,535.2
Gain/(loss) not recognised in profit or loss 635.8 1,680.7
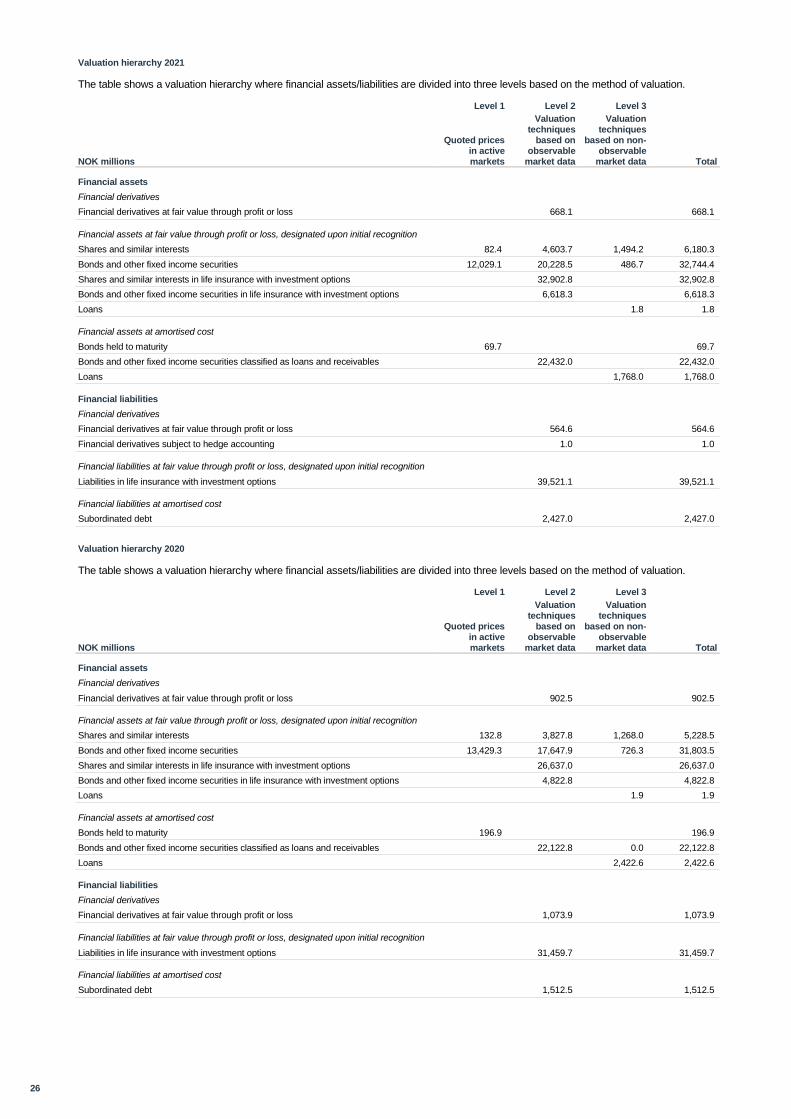
26
Valuation hierarchy 2021
The table shows a valuation hierarchy where financial assets/liabilities are divided into three levels based on the method of valuation.
Level 1 Level 2 Level 3
NOK millions
Quoted prices in active markets
Valuation techniques
based on observable
market data
Valuation techniques
based on non-observable
market data Total
Financial assets
Financial derivatives
Financial derivatives at fair value through profit or loss 668.1 668.1
Financial assets at fair value through profit or loss, designated upon initial recognition
Shares and similar interests 82.4 4,603.7 1,494.2 6,180.3
Bonds and other fixed income securities 12,029.1 20,228.5 486.7 32,744.4
Shares and similar interests in life insurance with investment options 32,902.8 32,902.8
Bonds and other fixed income securities in life insurance with investment options 6,618.3 6,618.3
Loans 1.8 1.8
Financial assets at amortised cost
Bonds held to maturity 69.7 69.7
Bonds and other fixed income securities classified as loans and receivables 22,432.0 22,432.0
Loans 1,768.0 1,768.0
Financial liabilities
Financial derivatives
Financial derivatives at fair value through profit or loss 564.6 564.6
Financial derivatives subject to hedge accounting 1.0 1.0
Financial liabilities at fair value through profit or loss, designated upon initial recognition
Liabilities in life insurance with investment options 39,521.1 39,521.1
Financial liabilities at amortised cost
Subordinated debt 2,427.0 2,427.0
Valuation hierarchy 2020
The table shows a valuation hierarchy where financial assets/liabilities are divided into three levels based on the method of valuation.
Level 1 Level 2 Level 3
NOK millions
Quoted prices in active markets
Valuation techniques
based on observable
market data
Valuation techniques
based on non-observable
market data Total
Financial assets
Financial derivatives
Financial derivatives at fair value through profit or loss 902.5 902.5
Financial assets at fair value through profit or loss, designated upon initial recognition
Shares and similar interests 132.8 3,827.8 1,268.0 5,228.5
Bonds and other fixed income securities 13,429.3 17,647.9 726.3 31,803.5
Shares and similar interests in life insurance with investment options 26,637.0 26,637.0
Bonds and other fixed income securities in life insurance with investment options 4,822.8 4,822.8
Loans 1.9 1.9
Financial assets at amortised cost
Bonds held to maturity 196.9 196.9
Bonds and other fixed income securities classified as loans and receivables 22,122.8 0.0 22,122.8
Loans 2,422.6 2,422.6
Financial liabilities
Financial derivatives
Financial derivatives at fair value through profit or loss 1,073.9 1,073.9
Financial liabilities at fair value through profit or loss, designated upon initial recognition
Liabilities in life insurance with investment options 31,459.7 31,459.7
Financial liabilities at amortised cost
Subordinated debt 1,512.5 1,512.5
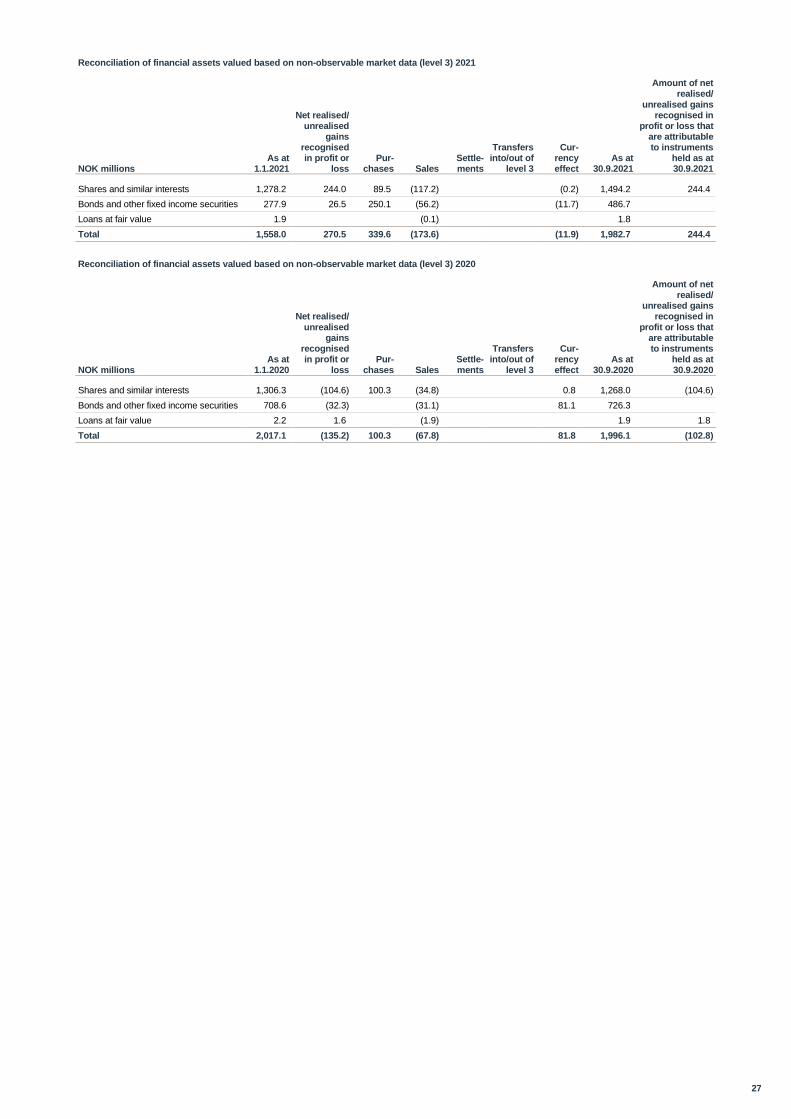
27
Reconciliation of financial assets valued based on non-observable market data (level 3) 2021
NOK millions As at
1.1.2021
Net realised/ unrealised
gains recognised in profit or
loss Pur-
chases Sales Settle- ments
Transfers into/out of
level 3
Cur-rency effect
As at 30.9.2021
Amount of net realised/
unrealised gains recognised in
profit or loss that are attributable to instruments
held as at 30.9.2021
Shares and similar interests 1,278.2 244.0 89.5 (117.2) (0.2) 1,494.2 244.4
Bonds and other fixed income securities 277.9 26.5 250.1 (56.2) (11.7) 486.7
Loans at fair value 1.9 (0.1) 1.8
Total 1,558.0 270.5 339.6 (173.6) (11.9) 1,982.7 244.4
Reconciliation of financial assets valued based on non-observable market data (level 3) 2020
NOK millions As at
1.1.2020
Net realised/ unrealised
gains recognised in profit or
loss Pur-
chases Sales Settle- ments
Transfers into/out of
level 3
Cur-rency effect
As at 30.9.2020
Amount of net realised/
unrealised gains recognised in
profit or loss that are attributable to instruments
held as at 30.9.2020
Shares and similar interests 1,306.3 (104.6) 100.3 (34.8) 0.8 1,268.0 (104.6)
Bonds and other fixed income securities 708.6 (32.3) (31.1) 81.1 726.3
Loans at fair value 2.2 1.6 (1.9) 1.9 1.8
Total 2,017.1 (135.2) 100.3 (67.8) 81.8 1,996.1 (102.8)
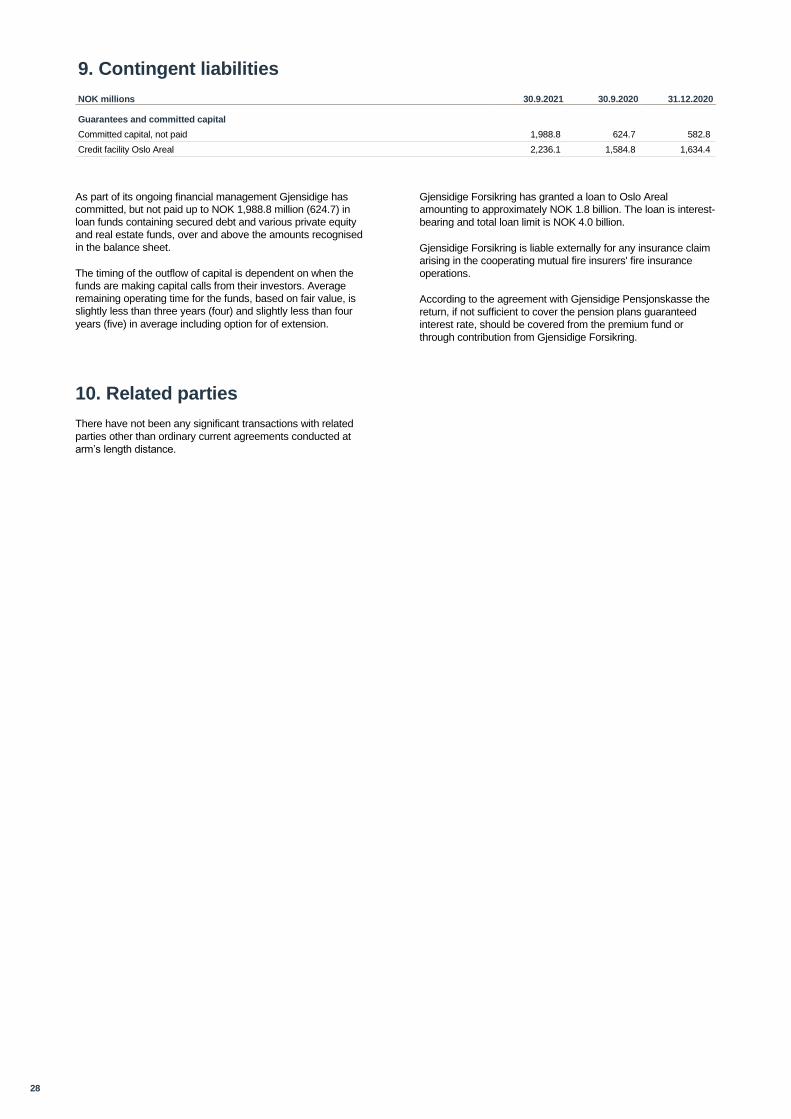
28
9. Contingent liabilities
NOK millions 30.9.2021 30.9.2020 31.12.2020
Guarantees and committed capital
Committed capital, not paid 1,988.8 624.7 582.8
Credit facility Oslo Areal 2,236.1 1,584.8 1,634.4
As part of its ongoing financial management Gjensidige has
committed, but not paid up to NOK 1,988.8 million (624.7) in
loan funds containing secured debt and various private equity
and real estate funds, over and above the amounts recognised
in the balance sheet.
The timing of the outflow of capital is dependent on when the
funds are making capital calls from their investors. Average
remaining operating time for the funds, based on fair value, is
slightly less than three years (four) and slightly less than four
years (five) in average including option for of extension.
Gjensidige Forsikring has granted a loan to Oslo Areal
amounting to approximately NOK 1.8 billion. The loan is interest-
bearing and total loan limit is NOK 4.0 billion.
Gjensidige Forsikring is liable externally for any insurance claim
arising in the cooperating mutual fire insurers' fire insurance
operations.
According to the agreement with Gjensidige Pensjonskasse the
return, if not sufficient to cover the pension plans guaranteed
interest rate, should be covered from the premium fund or
through contribution from Gjensidige Forsikring.
10. Related parties
There have not been any significant transactions with related
parties other than ordinary current agreements conducted at
arm’s length distance.
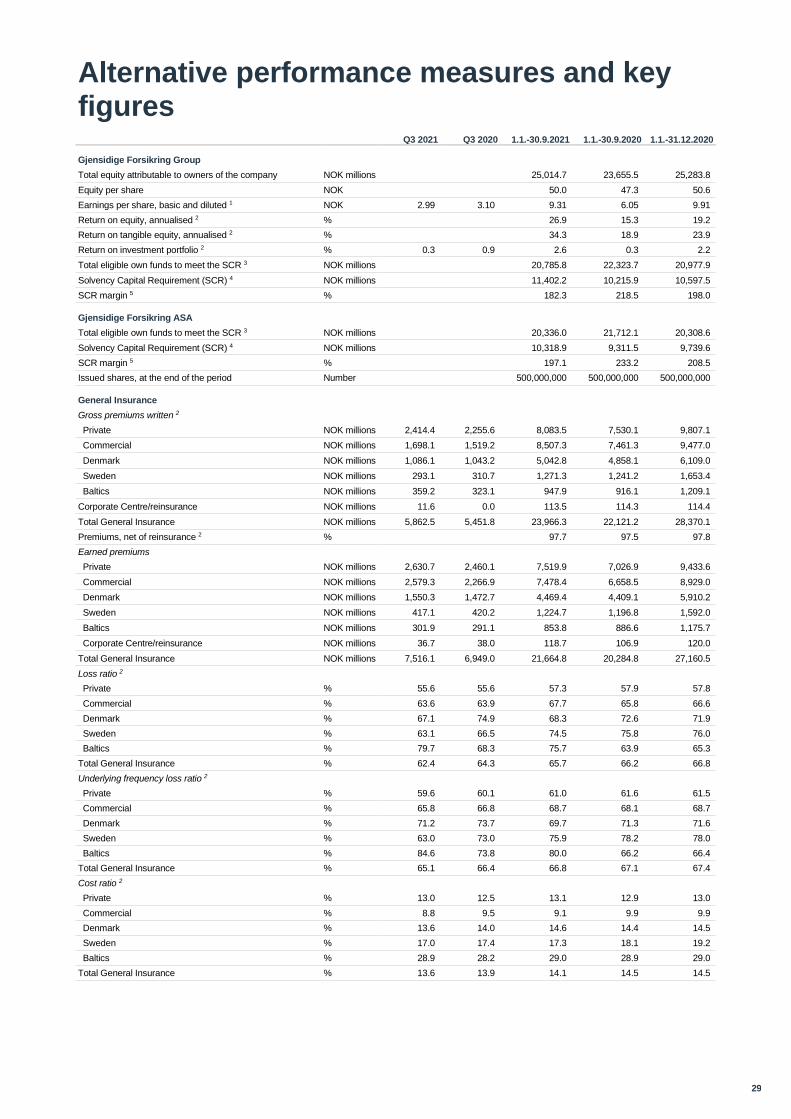
29
Alternative performance measures and key figures
Q3 2021 Q3 2020 1.1.-30.9.2021 1.1.-30.9.2020 1.1.-31.12.2020
Gjensidige Forsikring Group
Total equity attributable to owners of the company NOK millions 25,014.7 23,655.5 25,283.8
Equity per share NOK 50.0 47.3 50.6
Earnings per share, basic and diluted 1 NOK 2.99 3.10 9.31 6.05 9.91
Return on equity, annualised 2 % 26.9 15.3 19.2
Return on tangible equity, annualised 2 % 34.3 18.9 23.9
Return on investment portfolio 2 % 0.3 0.9 2.6 0.3 2.2
Total eligible own funds to meet the SCR 3 NOK millions 20,785.8 22,323.7 20,977.9
Solvency Capital Requirement (SCR) 4 NOK millions 11,402.2 10,215.9 10,597.5
SCR margin 5 % 182.3 218.5 198.0
Gjensidige Forsikring ASA
Total eligible own funds to meet the SCR 3 NOK millions 20,336.0 21,712.1 20,308.6
Solvency Capital Requirement (SCR) 4 NOK millions 10,318.9 9,311.5 9,739.6
SCR margin 5 % 197.1 233.2 208.5
Issued shares, at the end of the period Number 500,000,000 500,000,000 500,000,000
General Insurance
Gross premiums written 2
Private NOK millions 2,414.4 2,255.6 8,083.5 7,530.1 9,807.1
Commercial NOK millions 1,698.1 1,519.2 8,507.3 7,461.3 9,477.0
Denmark NOK millions 1,086.1 1,043.2 5,042.8 4,858.1 6,109.0
Sweden NOK millions 293.1 310.7 1,271.3 1,241.2 1,653.4
Baltics NOK millions 359.2 323.1 947.9 916.1 1,209.1
Corporate Centre/reinsurance NOK millions 11.6 0.0 113.5 114.3 114.4
Total General Insurance NOK millions 5,862.5 5,451.8 23,966.3 22,121.2 28,370.1
Premiums, net of reinsurance 2 % 97.7 97.5 97.8
Earned premiums
Private NOK millions 2,630.7 2,460.1 7,519.9 7,026.9 9,433.6
Commercial NOK millions 2,579.3 2,266.9 7,478.4 6,658.5 8,929.0
Denmark NOK millions 1,550.3 1,472.7 4,469.4 4,409.1 5,910.2
Sweden NOK millions 417.1 420.2 1,224.7 1,196.8 1,592.0
Baltics NOK millions 301.9 291.1 853.8 886.6 1,175.7
Corporate Centre/reinsurance NOK millions 36.7 38.0 118.7 106.9 120.0
Total General Insurance NOK millions 7,516.1 6,949.0 21,664.8 20,284.8 27,160.5
Loss ratio 2
Private % 55.6 55.6 57.3 57.9 57.8
Commercial % 63.6 63.9 67.7 65.8 66.6
Denmark % 67.1 74.9 68.3 72.6 71.9
Sweden % 63.1 66.5 74.5 75.8 76.0
Baltics % 79.7 68.3 75.7 63.9 65.3
Total General Insurance % 62.4 64.3 65.7 66.2 66.8
Underlying frequency loss ratio 2
Private % 59.6 60.1 61.0 61.6 61.5
Commercial % 65.8 66.8 68.7 68.1 68.7
Denmark % 71.2 73.7 69.7 71.3 71.6
Sweden % 63.0 73.0 75.9 78.2 78.0
Baltics % 84.6 73.8 80.0 66.2 66.4
Total General Insurance % 65.1 66.4 66.8 67.1 67.4
Cost ratio 2
Private % 13.0 12.5 13.1 12.9 13.0
Commercial % 8.8 9.5 9.1 9.9 9.9
Denmark % 13.6 14.0 14.6 14.4 14.5
Sweden % 17.0 17.4 17.3 18.1 19.2
Baltics % 28.9 28.2 29.0 28.9 29.0
Total General Insurance % 13.6 13.9 14.1 14.5 14.5
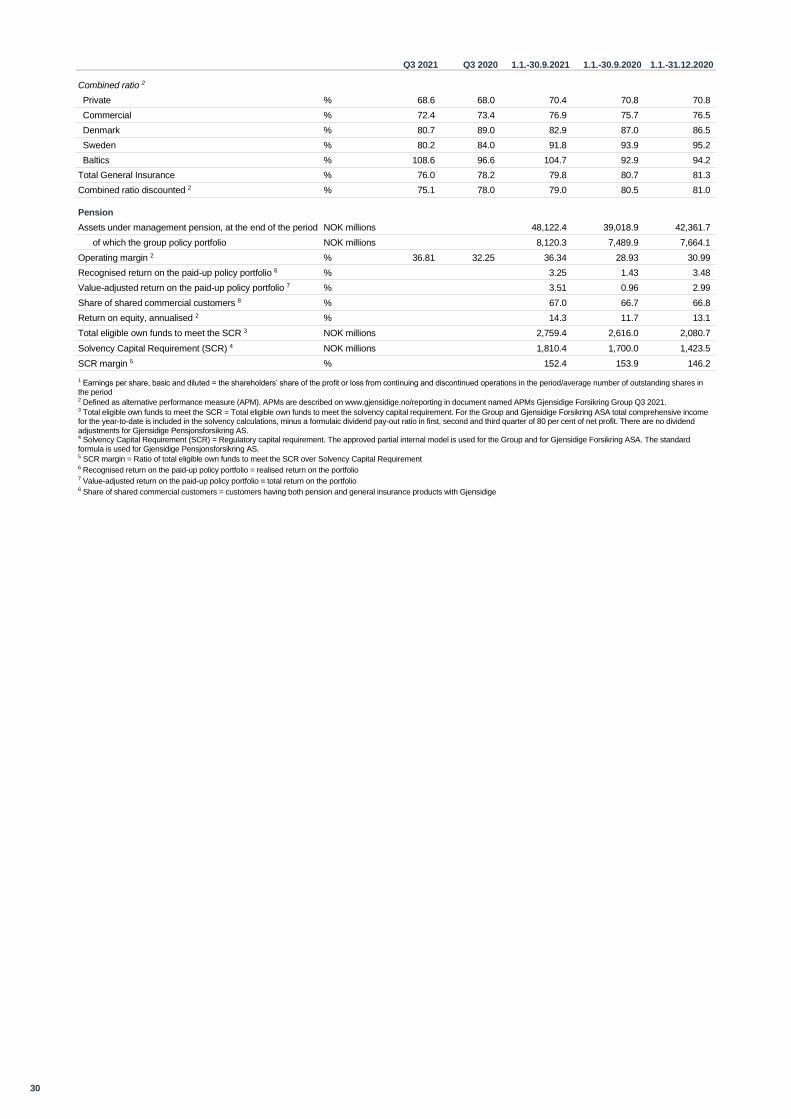
30
Q3 2021 Q3 2020 1.1.-30.9.2021 1.1.-30.9.2020 1.1.-31.12.2020
Combined ratio 2
Private % 68.6 68.0 70.4 70.8 70.8
Commercial % 72.4 73.4 76.9 75.7 76.5
Denmark % 80.7 89.0 82.9 87.0 86.5
Sweden % 80.2 84.0 91.8 93.9 95.2
Baltics % 108.6 96.6 104.7 92.9 94.2
Total General Insurance % 76.0 78.2 79.8 80.7 81.3
Combined ratio discounted 2 % 75.1 78.0 79.0 80.5 81.0
Pension
Assets under management pension, at the end of the period NOK millions 48,122.4 39,018.9 42,361.7
of which the group policy portfolio NOK millions 8,120.3 7,489.9 7,664.1
Operating margin 2 % 36.81 32.25 36.34 28.93 30.99
Recognised return on the paid-up policy portfolio 6 % 3.25 1.43 3.48
Value-adjusted return on the paid-up policy portfolio 7 % 3.51 0.96 2.99
Share of shared commercial customers 8 % 67.0 66.7 66.8
Return on equity, annualised 2 % 14.3 11.7 13.1
Total eligible own funds to meet the SCR 3 NOK millions 2,759.4 2,616.0 2,080.7
Solvency Capital Requirement (SCR) 4 NOK millions 1,810.4 1,700.0 1,423.5
SCR margin 5 % 152.4 153.9 146.2
1 Earnings per share, basic and diluted = the shareholders’ share of the profit or loss from continuing and discontinued operations in the period/average number of outstanding shares in the period
2 Defined as alternative performance measure (APM). APMs are described on www.gjensidige.no/reporting in document named APMs Gjensidige Forsikring Group Q3 2021.
3 Total eligible own funds to meet the SCR = Total eligible own funds to meet the solvency capital requirement. For the Group and Gjensidige Forsikring ASA total comprehensive income for the year-to-date is included in the solvency calculations, minus a formulaic dividend pay-out ratio in first, second and third quarter of 80 per cent of net profit. There are no dividend adjustments for Gjensidige Pensjonsforsikring AS. 4 Solvency Capital Requirement (SCR) = Regulatory capital requirement. The approved partial internal model is used for the Group and for Gjensidige Forsikring ASA. The standard formula is used for Gjensidige Pensjonsforsikring AS.
5 SCR margin = Ratio of total eligible own funds to meet the SCR over Solvency Capital Requirement
6 Recognised return on the paid-up policy portfolio = realised return on the portfolio
7 Value-adjusted return on the paid-up policy portfolio = total return on the portfolio
8 Share of shared commercial customers = customers having both pension and general insurance products with Gjensidige
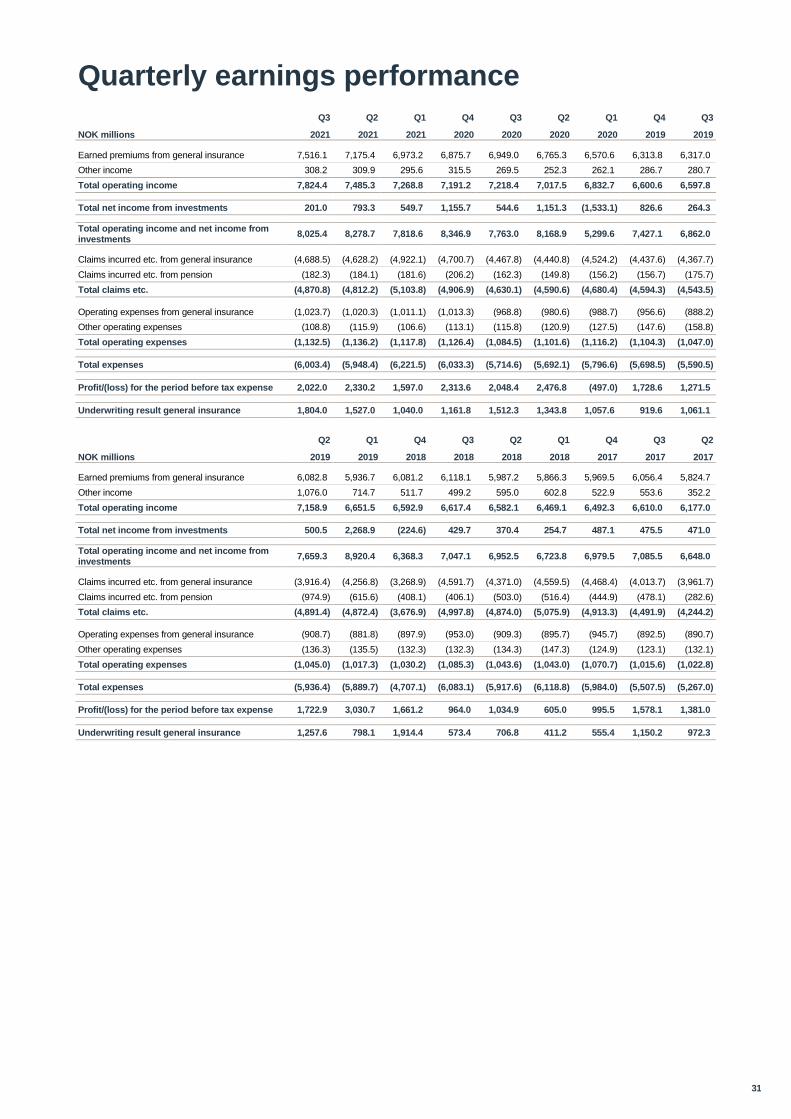
31
Quarterly earnings performance
Q3 Q2 Q1 Q4 Q3 Q2 Q1 Q4 Q3
NOK millions 2021 2021 2021 2020 2020 2020 2020 2019 2019
Earned premiums from general insurance 7,516.1 7,175.4 6,973.2 6,875.7 6,949.0 6,765.3 6,570.6 6,313.8 6,317.0
Other income 308.2 309.9 295.6 315.5 269.5 252.3 262.1 286.7 280.7
Total operating income 7,824.4 7,485.3 7,268.8 7,191.2 7,218.4 7,017.5 6,832.7 6,600.6 6,597.8
Total net income from investments 201.0 793.3 549.7 1,155.7 544.6 1,151.3 (1,533.1) 826.6 264.3
Total operating income and net income from investments
8,025.4 8,278.7 7,818.6 8,346.9 7,763.0 8,168.9 5,299.6 7,427.1 6,862.0
Claims incurred etc. from general insurance (4,688.5) (4,628.2) (4,922.1) (4,700.7) (4,467.8) (4,440.8) (4,524.2) (4,437.6) (4,367.7)
Claims incurred etc. from pension (182.3) (184.1) (181.6) (206.2) (162.3) (149.8) (156.2) (156.7) (175.7)
Total claims etc. (4,870.8) (4,812.2) (5,103.8) (4,906.9) (4,630.1) (4,590.6) (4,680.4) (4,594.3) (4,543.5)
Operating expenses from general insurance (1,023.7) (1,020.3) (1,011.1) (1,013.3) (968.8) (980.6) (988.7) (956.6) (888.2)
Other operating expenses (108.8) (115.9) (106.6) (113.1) (115.8) (120.9) (127.5) (147.6) (158.8)
Total operating expenses (1,132.5) (1,136.2) (1,117.8) (1,126.4) (1,084.5) (1,101.6) (1,116.2) (1,104.3) (1,047.0)
Total expenses (6,003.4) (5,948.4) (6,221.5) (6,033.3) (5,714.6) (5,692.1) (5,796.6) (5,698.5) (5,590.5)
Profit/(loss) for the period before tax expense 2,022.0 2,330.2 1,597.0 2,313.6 2,048.4 2,476.8 (497.0) 1,728.6 1,271.5
Underwriting result general insurance 1,804.0 1,527.0 1,040.0 1,161.8 1,512.3 1,343.8 1,057.6 919.6 1,061.1
Q2 Q1 Q4 Q3 Q2 Q1 Q4 Q3 Q2
NOK millions 2019 2019 2018 2018 2018 2018 2017 2017 2017
Earned premiums from general insurance 6,082.8 5,936.7 6,081.2 6,118.1 5,987.2 5,866.3 5,969.5 6,056.4 5,824.7
Other income 1,076.0 714.7 511.7 499.2 595.0 602.8 522.9 553.6 352.2
Total operating income 7,158.9 6,651.5 6,592.9 6,617.4 6,582.1 6,469.1 6,492.3 6,610.0 6,177.0
Total net income from investments 500.5 2,268.9 (224.6) 429.7 370.4 254.7 487.1 475.5 471.0
Total operating income and net income from investments
7,659.3 8,920.4 6,368.3 7,047.1 6,952.5 6,723.8 6,979.5 7,085.5 6,648.0
Claims incurred etc. from general insurance (3,916.4) (4,256.8) (3,268.9) (4,591.7) (4,371.0) (4,559.5) (4,468.4) (4,013.7) (3,961.7)
Claims incurred etc. from pension (974.9) (615.6) (408.1) (406.1) (503.0) (516.4) (444.9) (478.1) (282.6)
Total claims etc. (4,891.4) (4,872.4) (3,676.9) (4,997.8) (4,874.0) (5,075.9) (4,913.3) (4,491.9) (4,244.2)
Operating expenses from general insurance (908.7) (881.8) (897.9) (953.0) (909.3) (895.7) (945.7) (892.5) (890.7)
Other operating expenses (136.3) (135.5) (132.3) (132.3) (134.3) (147.3) (124.9) (123.1) (132.1)
Total operating expenses (1,045.0) (1,017.3) (1,030.2) (1,085.3) (1,043.6) (1,043.0) (1,070.7) (1,015.6) (1,022.8)
Total expenses (5,936.4) (5,889.7) (4,707.1) (6,083.1) (5,917.6) (6,118.8) (5,984.0) (5,507.5) (5,267.0)
Profit/(loss) for the period before tax expense 1,722.9 3,030.7 1,661.2 964.0 1,034.9 605.0 995.5 1,578.1 1,381.0
Underwriting result general insurance 1,257.6 798.1 1,914.4 573.4 706.8 411.2 555.4 1,150.2 972.3
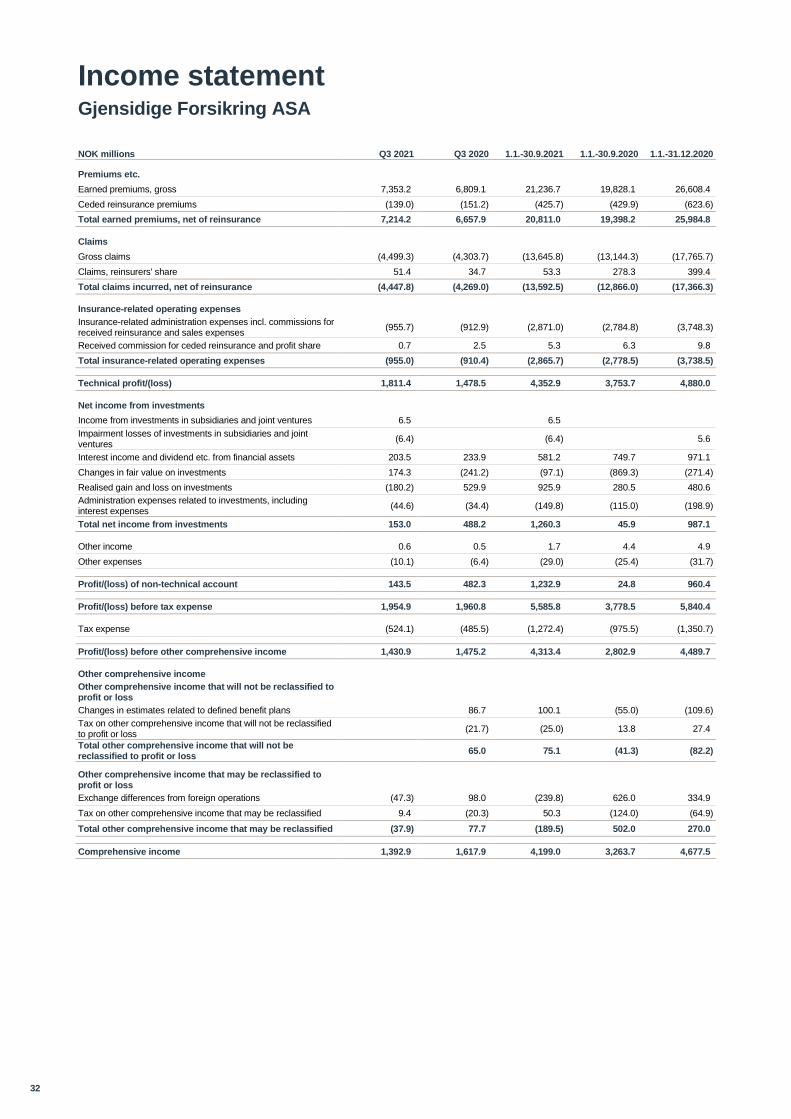
32
Income statement Gjensidige Forsikring ASA
NOK millions Q3 2021 Q3 2020 1.1.-30.9.2021 1.1.-30.9.2020 1.1.-31.12.2020
Premiums etc.
Earned premiums, gross 7,353.2 6,809.1 21,236.7 19,828.1 26,608.4
Ceded reinsurance premiums (139.0) (151.2) (425.7) (429.9) (623.6)
Total earned premiums, net of reinsurance 7,214.2 6,657.9 20,811.0 19,398.2 25,984.8
Claims
Gross claims (4,499.3) (4,303.7) (13,645.8) (13,144.3) (17,765.7)
Claims, reinsurers' share 51.4 34.7 53.3 278.3 399.4
Total claims incurred, net of reinsurance (4,447.8) (4,269.0) (13,592.5) (12,866.0) (17,366.3)
Insurance-related operating expenses
Insurance-related administration expenses incl. commissions for received reinsurance and sales expenses
(955.7) (912.9) (2,871.0) (2,784.8) (3,748.3)
Received commission for ceded reinsurance and profit share 0.7 2.5 5.3 6.3 9.8
Total insurance-related operating expenses (955.0) (910.4) (2,865.7) (2,778.5) (3,738.5)
Technical profit/(loss) 1,811.4 1,478.5 4,352.9 3,753.7 4,880.0
Net income from investments
Income from investments in subsidiaries and joint ventures 6.5 6.5
Impairment losses of investments in subsidiaries and joint ventures
(6.4) (6.4) 5.6
Interest income and dividend etc. from financial assets 203.5 233.9 581.2 749.7 971.1
Changes in fair value on investments 174.3 (241.2) (97.1) (869.3) (271.4)
Realised gain and loss on investments (180.2) 529.9 925.9 280.5 480.6
Administration expenses related to investments, including interest expenses
(44.6) (34.4) (149.8) (115.0) (198.9)
Total net income from investments 153.0 488.2 1,260.3 45.9 987.1
Other income 0.6 0.5 1.7 4.4 4.9
Other expenses (10.1) (6.4) (29.0) (25.4) (31.7)
Profit/(loss) of non-technical account 143.5 482.3 1,232.9 24.8 960.4
Profit/(loss) before tax expense 1,954.9 1,960.8 5,585.8 3,778.5 5,840.4
Tax expense (524.1) (485.5) (1,272.4) (975.5) (1,350.7)
Profit/(loss) before other comprehensive income 1,430.9 1,475.2 4,313.4 2,802.9 4,489.7
Other comprehensive income
Other comprehensive income that will not be reclassified to profit or loss
Changes in estimates related to defined benefit plans 86.7 100.1 (55.0) (109.6)
Tax on other comprehensive income that will not be reclassified to profit or loss
(21.7) (25.0) 13.8 27.4
Total other comprehensive income that will not be reclassified to profit or loss
65.0 75.1 (41.3) (82.2)
Other comprehensive income that may be reclassified to profit or loss
Exchange differences from foreign operations (47.3) 98.0 (239.8) 626.0 334.9
Tax on other comprehensive income that may be reclassified 9.4 (20.3) 50.3 (124.0) (64.9)
Total other comprehensive income that may be reclassified (37.9) 77.7 (189.5) 502.0 270.0
Comprehensive income 1,392.9 1,617.9 4,199.0 3,263.7 4,677.5
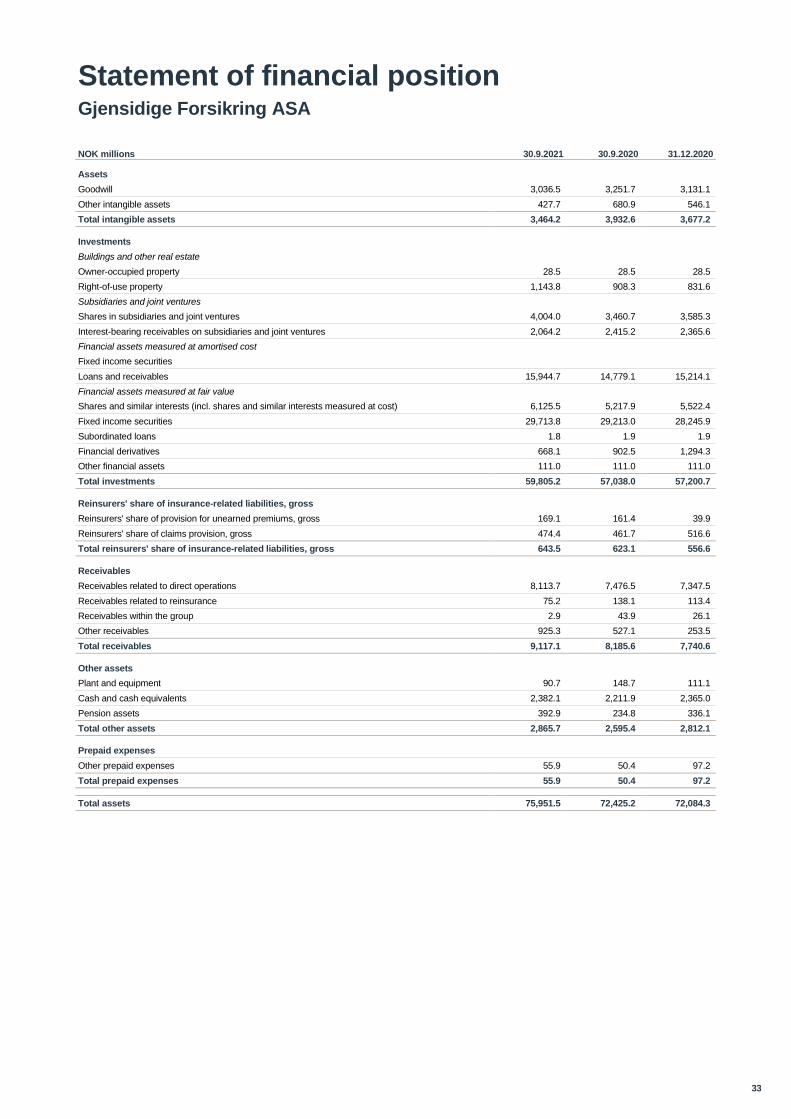
33
Statement of financial position Gjensidige Forsikring ASA
NOK millions 30.9.2021 30.9.2020 31.12.2020
Assets
Goodwill 3,036.5 3,251.7 3,131.1
Other intangible assets 427.7 680.9 546.1
Total intangible assets 3,464.2 3,932.6 3,677.2
Investments
Buildings and other real estate
Owner-occupied property 28.5 28.5 28.5
Right-of-use property 1,143.8 908.3 831.6
Subsidiaries and joint ventures
Shares in subsidiaries and joint ventures 4,004.0 3,460.7 3,585.3
Interest-bearing receivables on subsidiaries and joint ventures 2,064.2 2,415.2 2,365.6
Financial assets measured at amortised cost
Fixed income securities
Loans and receivables 15,944.7 14,779.1 15,214.1
Financial assets measured at fair value
Shares and similar interests (incl. shares and similar interests measured at cost) 6,125.5 5,217.9 5,522.4
Fixed income securities 29,713.8 29,213.0 28,245.9
Subordinated loans 1.8 1.9 1.9
Financial derivatives 668.1 902.5 1,294.3
Other financial assets 111.0 111.0 111.0
Total investments 59,805.2 57,038.0 57,200.7
Reinsurers' share of insurance-related liabilities, gross
Reinsurers' share of provision for unearned premiums, gross 169.1 161.4 39.9
Reinsurers' share of claims provision, gross 474.4 461.7 516.6
Total reinsurers' share of insurance-related liabilities, gross 643.5 623.1 556.6
Receivables
Receivables related to direct operations 8,113.7 7,476.5 7,347.5
Receivables related to reinsurance 75.2 138.1 113.4
Receivables within the group 2.9 43.9 26.1
Other receivables 925.3 527.1 253.5
Total receivables 9,117.1 8,185.6 7,740.6
Other assets
Plant and equipment 90.7 148.7 111.1
Cash and cash equivalents 2,382.1 2,211.9 2,365.0
Pension assets 392.9 234.8 336.1
Total other assets 2,865.7 2,595.4 2,812.1
Prepaid expenses
Other prepaid expenses 55.9 50.4 97.2
Total prepaid expenses 55.9 50.4 97.2
Total assets 75,951.5 72,425.2 72,084.3
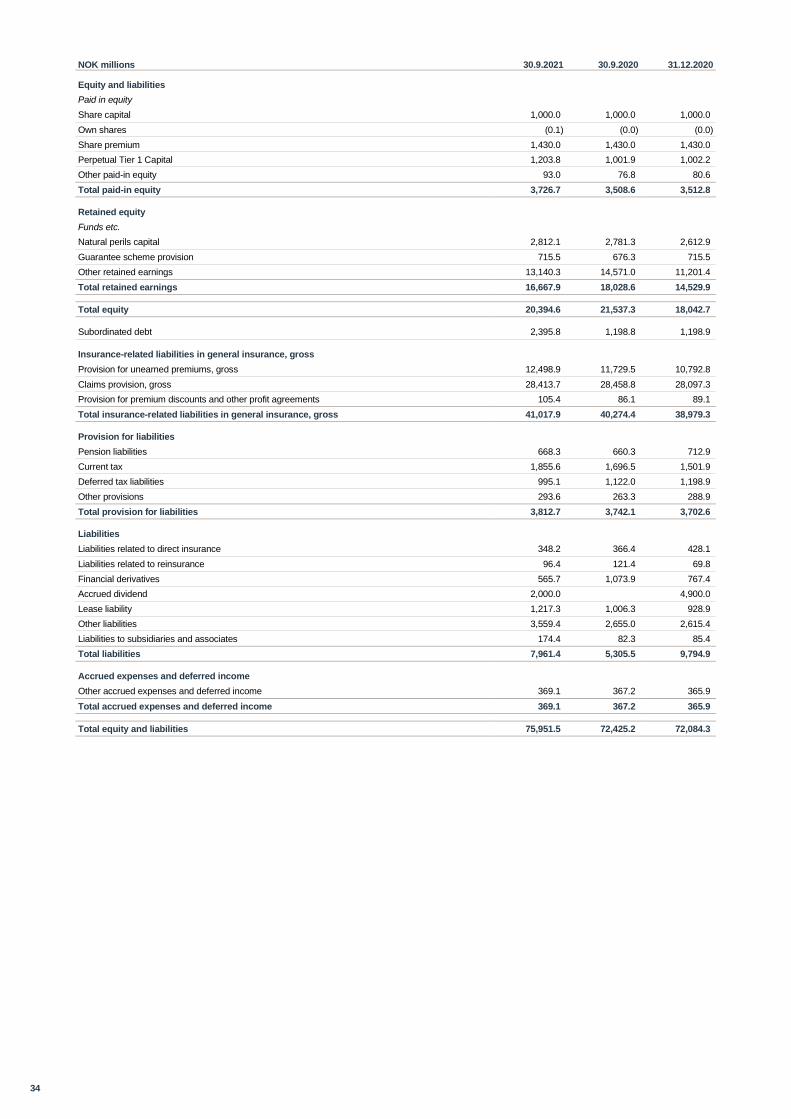
34
NOK millions 30.9.2021 30.9.2020 31.12.2020
Equity and liabilities
Paid in equity
Share capital 1,000.0 1,000.0 1,000.0
Own shares (0.1) (0.0) (0.0)
Share premium 1,430.0 1,430.0 1,430.0
Perpetual Tier 1 Capital 1,203.8 1,001.9 1,002.2
Other paid-in equity 93.0 76.8 80.6
Total paid-in equity 3,726.7 3,508.6 3,512.8
Retained equity
Funds etc.
Natural perils capital 2,812.1 2,781.3 2,612.9
Guarantee scheme provision 715.5 676.3 715.5
Other retained earnings 13,140.3 14,571.0 11,201.4
Total retained earnings 16,667.9 18,028.6 14,529.9
Total equity 20,394.6 21,537.3 18,042.7
Subordinated debt 2,395.8 1,198.8 1,198.9
Insurance-related liabilities in general insurance, gross
Provision for unearned premiums, gross 12,498.9 11,729.5 10,792.8
Claims provision, gross 28,413.7 28,458.8 28,097.3
Provision for premium discounts and other profit agreements 105.4 86.1 89.1
Total insurance-related liabilities in general insurance, gross 41,017.9 40,274.4 38,979.3
Provision for liabilities
Pension liabilities 668.3 660.3 712.9
Current tax 1,855.6 1,696.5 1,501.9
Deferred tax liabilities 995.1 1,122.0 1,198.9
Other provisions 293.6 263.3 288.9
Total provision for liabilities 3,812.7 3,742.1 3,702.6
Liabilities
Liabilities related to direct insurance 348.2 366.4 428.1
Liabilities related to reinsurance 96.4 121.4 69.8
Financial derivatives 565.7 1,073.9 767.4
Accrued dividend 2,000.0 4,900.0
Lease liability 1,217.3 1,006.3 928.9
Other liabilities 3,559.4 2,655.0 2,615.4
Liabilities to subsidiaries and associates 174.4 82.3 85.4
Total liabilities 7,961.4 5,305.5 9,794.9
Accrued expenses and deferred income
Other accrued expenses and deferred income 369.1 367.2 365.9
Total accrued expenses and deferred income 369.1 367.2 365.9
Total equity and liabilities 75,951.5 72,425.2 72,084.3
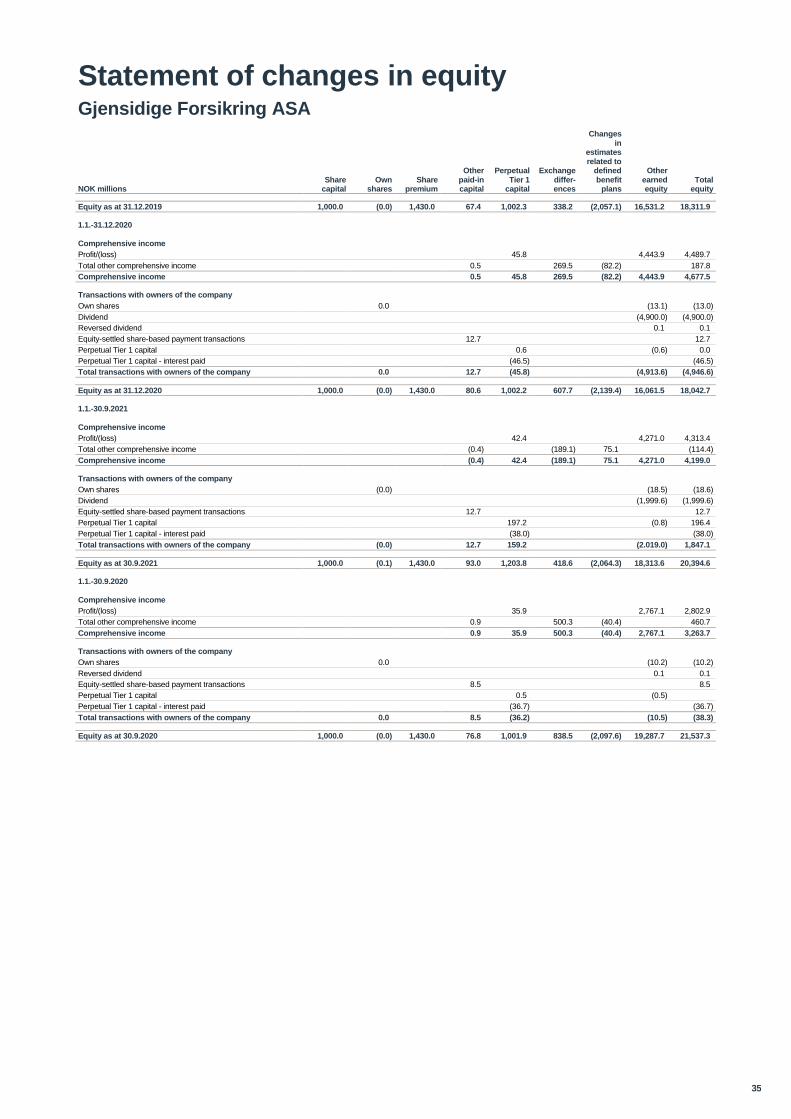
35
Statement of changes in equity Gjensidige Forsikring ASA
NOK millions Share
capital Own
shares Share
premium
Other paid-in capital
Perpetual Tier 1
capital
Exchange differ- ences
Changes in
estimates related to
defined benefit
plans
Other earned equity
Total equity
Equity as at 31.12.2019 1,000.0 (0.0) 1,430.0 67.4 1,002.3 338.2 (2,057.1) 16,531.2 18,311.9
1.1.-31.12.2020
Comprehensive income
Profit/(loss) 45.8 4,443.9 4,489.7
Total other comprehensive income 0.5 269.5 (82.2) 187.8
Comprehensive income 0.5 45.8 269.5 (82.2) 4,443.9 4,677.5
Transactions with owners of the company
Own shares 0.0 (13.1) (13.0)
Dividend (4,900.0) (4,900.0)
Reversed dividend 0.1 0.1
Equity-settled share-based payment transactions 12.7 12.7
Perpetual Tier 1 capital 0.6 (0.6) 0.0
Perpetual Tier 1 capital - interest paid (46.5) (46.5)
Total transactions with owners of the company 0.0 12.7 (45.8) (4,913.6) (4,946.6)
Equity as at 31.12.2020 1,000.0 (0.0) 1,430.0 80.6 1,002.2 607.7 (2,139.4) 16,061.5 18,042.7
1.1.-30.9.2021
Comprehensive income
Profit/(loss) 42.4 4,271.0 4,313.4
Total other comprehensive income (0.4) (189.1) 75.1 (114.4)
Comprehensive income (0.4) 42.4 (189.1) 75.1 4,271.0 4,199.0
Transactions with owners of the company
Own shares (0.0) (18.5) (18.6)
Dividend (1,999.6) (1,999.6)
Equity-settled share-based payment transactions 12.7 12.7
Perpetual Tier 1 capital 197.2 (0.8) 196.4
Perpetual Tier 1 capital - interest paid (38.0) (38.0)
Total transactions with owners of the company (0.0) 12.7 159.2 (2.019.0) 1,847.1
Equity as at 30.9.2021 1,000.0 (0.1) 1,430.0 93.0 1,203.8 418.6 (2,064.3) 18,313.6 20,394.6
1.1.-30.9.2020
Comprehensive income
Profit/(loss) 35.9 2,767.1 2,802.9
Total other comprehensive income 0.9 500.3 (40.4) 460.7
Comprehensive income 0.9 35.9 500.3 (40.4) 2,767.1 3,263.7
Transactions with owners of the company
Own shares 0.0 (10.2) (10.2)
Reversed dividend 0.1 0.1
Equity-settled share-based payment transactions 8.5 8.5
Perpetual Tier 1 capital 0.5 (0.5)
Perpetual Tier 1 capital - interest paid (36.7) (36.7)
Total transactions with owners of the company 0.0 8.5 (36.2) (10.5) (38.3)
Equity as at 30.9.2020 1,000.0 (0.0) 1,430.0 76.8 1,001.9 838.5 (2,097.6) 19,287.7 21,537.3

36