Embed Size (px)
Citation preview
4
Financial and Operating Information 2005-2009
Group information
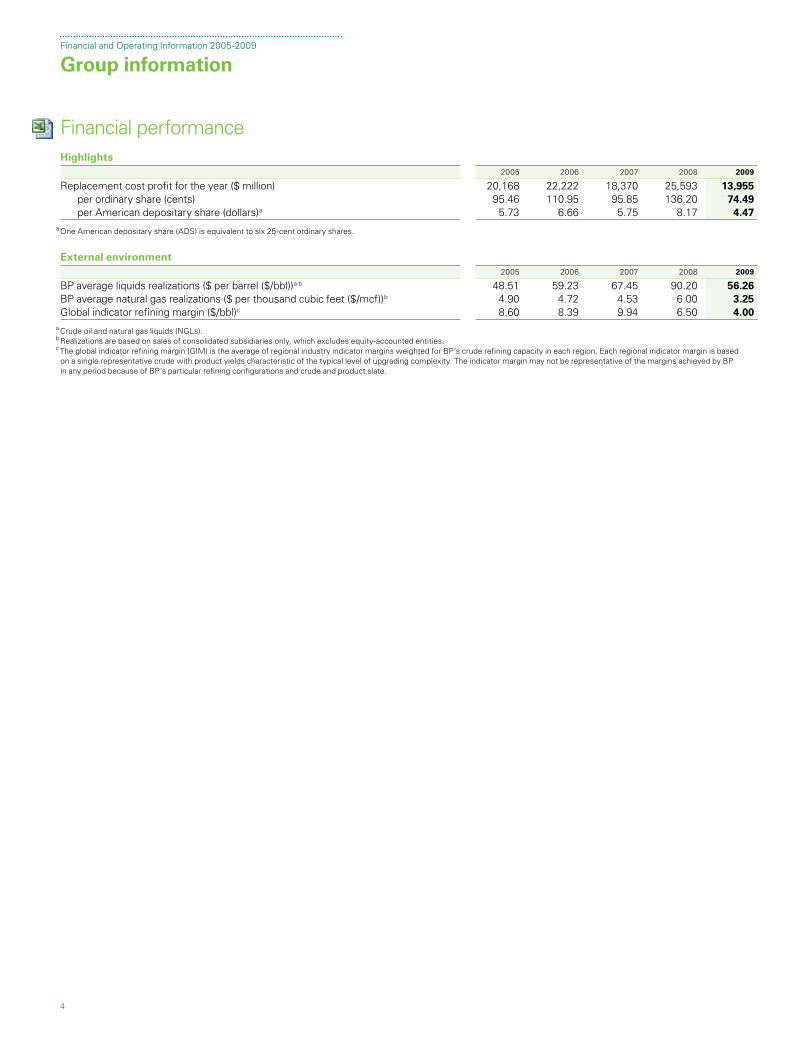
Financial performanceH ighlights 2005 2006 2007 2008 2009
Replacement cost profit for the year ($ million) 20,168 22,222 18,370 25,593 13,955 per ordinary share (cents) 95.46 110.95 95.85 136.20 74.49 per American depositary share (dollars)a 5.73 6.66 5.75 8.17 4.47 One American depositary share (ADS) is equivalent to six 25-cent ordinary shares.
External environment 2005 2006 2007 2008 2009
BP average liquids realizations ($ per barrel ($/bbl))a b 48.51 59.23 67.45 90.20 56.26BP average natural gas realizations ($ per thousand cubic feet ($/mcf))b 4.90 4.72 4.53 6.00 3.25Global indicator refining margin ($/bbl)c 8.60 8.39 9.94 6.50 4.00 Crude oil and natural gas liquids (NGLs).
b R ealizations are based on sales of consolidated subsidiaries only, which excludes equity-accounted entities.c T he global indicator refining margin (GIM) is the average of regional industry indicator margins weighted for BP’s crude refining capacity in each region. Each regional indicator margin is based
on a single representative crude with product yields characteristic of the typical level of upgrading complexity. The indicator margin may not be representative of the margins achieved by BP in any period because of BP’s particular refining configurations and crude and product slate.
a
a
5
Financial and Operating Information 2005-2009Group information
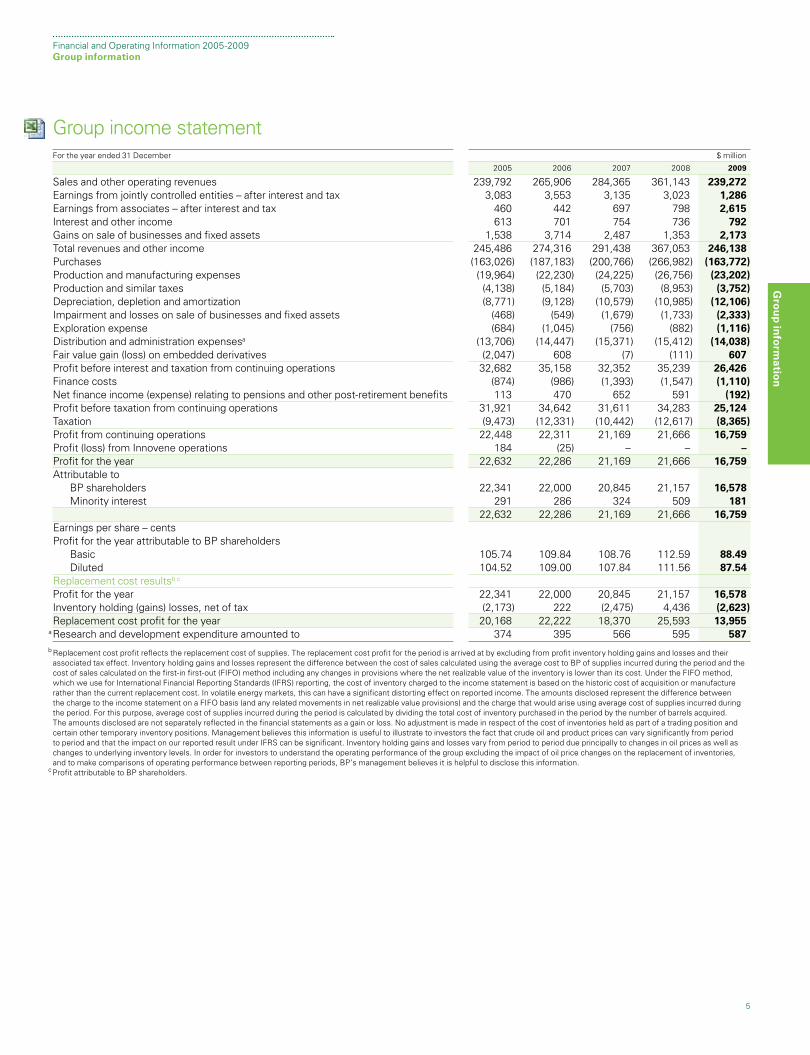
Group income statementF or the year ended 31 December $ million
2005 2006 2007 2008 2009
Sales and other operating revenues 239,792 265,906 284,365 361,143 239,272Earnings from jointly controlled entities – after interest and tax 3,083 3,553 3,135 3,023 1,286Earnings from associates – after interest and tax 460 442 697 798 2,615Interest and other income 613 701 754 736 792Gains on sale of businesses and fixed assets 1,538 3,714 2,487 1,353 2,173Total revenues and other income 245,486 274,316 291,438 367,053 246,138Purchases (163,026) (187,183) (200,766) (266,982) (163,772)Production and manufacturing expenses (19,964) (22,230) (24,225) (26,756) (23,202)Production and similar taxes (4,138) (5,184) (5,703) (8,953) (3,752)Depreciation, depletion and amortization (8,771) (9,128) (10,579) (10,985) (12,106)Impairment and losses on sale of businesses and fixed assets (468) (549) (1,679) (1,733) (2,333)Exploration expense (684) (1,045) (756) (882) (1,116)Distribution and administration expensesa (13,706) (14,447) (15,371) (15,412) (14,038)Fair value gain (loss) on embedded derivatives (2,047) 608 (7) (111) 607Profit before interest and taxation from continuing operations 32,682 35,158 32,352 35,239 26,426Finance costs (874) (986) (1,393) (1,547) (1,110)Net finance income (expense) relating to pensions and other post-retirement benefits 113 470 652 591 (192)Profit before taxation from continuing operations 31,921 34,642 31,611 34,283 25,124Taxation (9,473) (12,331) (10,442) (12,617) (8,365)Profit from continuing operations 22,448 22,311 21,169 21,666 16,759Profit (loss) from Innovene operations 184 (25) – – –Profit for the year 22,632 22,286 21,169 21,666 16,759Attributable to BP shareholders 22,341 22,000 20,845 21,157 16,578 Minority interest 291 286 324 509 181 22,632 22,286 21,169 21,666 16,759Earnings per share – centsProfit for the year attributable to BP shareholders Basic 105.74 109.84 108.76 112.59 88.49 Diluted 104.52 109.00 107.84 111.56 87.54Replacement cost resultsb c
Profit for the year 22,341 22,000 20,845 21,157 16,578Inventory holding (gains) losses, net of tax (2,173) 222 (2,475) 4,436 (2,623)Replacement cost profit for the year 20,168 22,222 18,370 25,593 13,955Research and development expenditure amounted to 374 395 566 595 587 Replacement cost profit reflects the replacement cost of supplies. The replacement cost profit for the period is arrived at by excluding from profit inventory holding gains and losses and their associated tax effect. Inventory holding gains and losses represent the difference between the cost of sales calculated using the average cost to BP of supplies incurred during the period and the cost of sales calculated on the first-in first-out (FIFO) method including any changes in provisions where the net realizable value of the inventory is lower than its cost. Under the FIFO method, which we use for International Financial Reporting Standards (IFRS) reporting, the cost of inventory charged to the income statement is based on the historic cost of acquisition or manufacture rather than the current replacement cost. In volatile energy markets, this can have a significant distorting effect on reported income. The amounts disclosed represent the difference between the charge to the income statement on a FIFO basis (and any related movements in net realizable value provisions) and the charge that would arise using average cost of supplies incurred during the period. For this purpose, average cost of supplies incurred during the period is calculated by dividing the total cost of inventory purchased in the period by the number of barrels acquired. The amounts disclosed are not separately reflected in the financial statements as a gain or loss. No adjustment is made in respect of the cost of inventories held as part of a trading position and certain other temporary inventory positions. Management believes this information is useful to illustrate to investors the fact that crude oil and product prices can vary significantly from period to period and that the impact on our reported result under IFRS can be significant. Inventory holding gains and losses vary from period to period due principally to changes in oil prices as well as changes to underlying inventory levels. In order for investors to understand the operating performance of the group excluding the impact of oil price changes on the replacement of inventories, and to make comparisons of operating performance between reporting periods, BP’s management believes it is helpful to disclose this information. Profit attributable to BP shareholders.
a
b
c
Gro
up
info
rmatio
n
6
Financial and Operating Information 2005-2009Group information
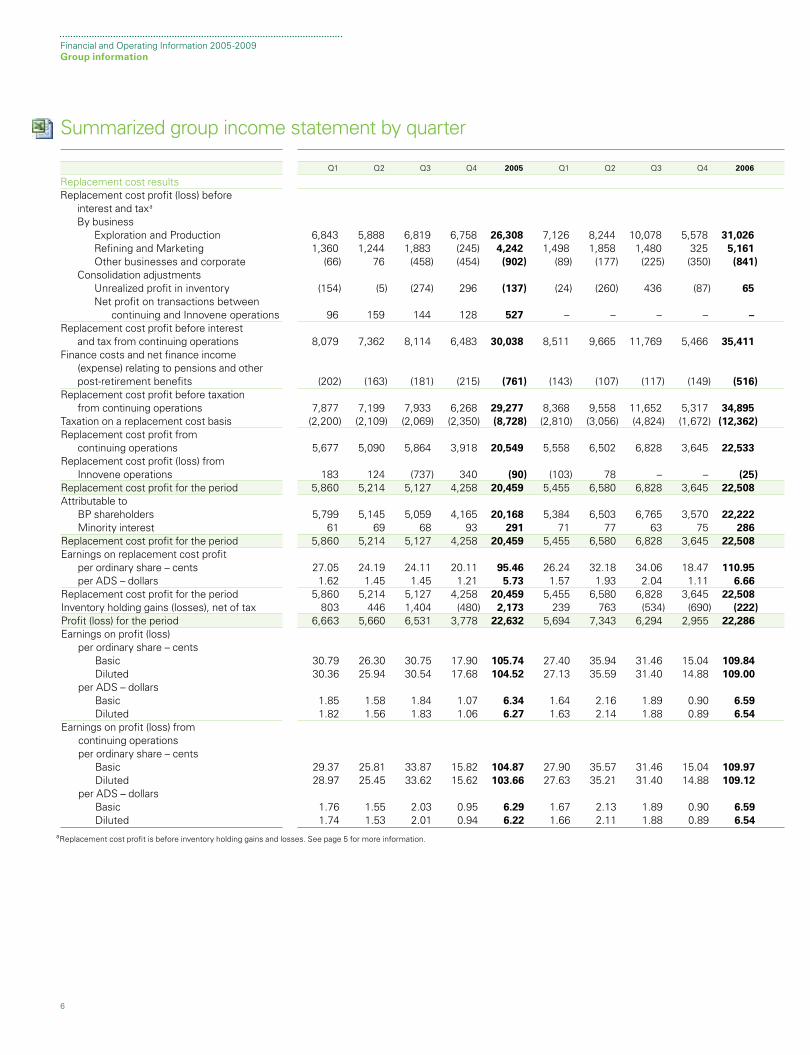
Summarized group income statement by quarter
Q1 Q2 Q3 Q4 2005 Q1 Q2 Q3 Q4 2006
Replacement cost resultsReplacement cost profit (loss) before interest and taxa
By business Exploration and Production 6,843 5,888 6,819 6,758 26,308 7,126 8,244 10,078 5,578 31,026 Refining and Marketing 1,360 1,244 1,883 (245) 4,242 1,498 1,858 1,480 325 5,161 Other businesses and corporate (66) 76 (458) (454) (902) (89) (177) (225) (350) (841) Consolidation adjustments Unrealized profit in inventory (154) (5) (274) 296 (137) (24) (260) 436 (87) 65 Net profit on transactions between continuing and Innovene operations 96 159 144 128 527 – – – – –Replacement cost profit before interest and tax from continuing operations 8,079 7,362 8,114 6,483 30,038 8,511 9,665 11,769 5,466 35,411 Finance costs and net finance income (expense) relating to pensions and other post-retirement benefits (202) (163) (181) (215) (761) (143) (107) (117) (149) (516)Replacement cost profit before taxation from continuing operations 7,877 7,199 7,933 6,268 29,277 8,368 9,558 11,652 5,317 34,895 Taxation on a replacement cost basis (2,200) (2,109) (2,069) (2,350) (8,728) (2,810) (3,056) (4,824) (1,672) (12,362)Replacement cost profit from continuing operations 5,677 5,090 5,864 3,918 20,549 5,558 6,502 6,828 3,645 22,533 Replacement cost profit (loss) from Innovene operations 183 124 (737) 340 (90) (103) 78 – – (25)Replacement cost profit for the period 5,860 5,214 5,127 4,258 20,459 5,455 6,580 6,828 3,645 22,508 Attributable to BP shareholders 5,799 5,145 5,059 4,165 20,168 5,384 6,503 6,765 3,570 22,222 Minority interest 61 69 68 93 291 71 77 63 75 286 Replacement cost profit for the period 5,860 5,214 5,127 4,258 20,459 5,455 6,580 6,828 3,645 22,508 Earnings on replacement cost profit per ordinary share – cents 27.05 24.19 24.11 20.11 95.46 26.24 32.18 34.06 18.47 110.95 per ADS – dollars 1.62 1.45 1.45 1.21 5.73 1.57 1.93 2.04 1.11 6.66 Replacement cost profit for the period 5,860 5,214 5,127 4,258 20,459 5,455 6,580 6,828 3,645 22,508 Inventory holding gains (losses), net of tax 803 446 1,404 (480) 2,173 239 763 (534) (690) (222)Profit (loss) for the period 6,663 5,660 6,531 3,778 22,632 5,694 7,343 6,294 2,955 22,286 Earnings on profit (loss) per ordinary share – cents Basic 30.79 26.30 30.75 17.90 105.74 27.40 35.94 31.46 15.04 109.84 Diluted 30.36 25.94 30.54 17.68 104.52 27.13 35.59 31.40 14.88 109.00 per ADS – dollars Basic 1.85 1.58 1.84 1.07 6.34 1.64 2.16 1.89 0.90 6.59 Diluted 1.82 1.56 1.83 1.06 6.27 1.63 2.14 1.88 0.89 6.54 Earnings on profit (loss) from continuing operations per ordinary share – cents Basic 29.37 25.81 33.87 15.82 104.87 27.90 35.57 31.46 15.04 109.97 Diluted 28.97 25.45 33.62 15.62 103.66 27.63 35.21 31.40 14.88 109.12 per ADS – dollars Basic 1.76 1.55 2.03 0.95 6.29 1.67 2.13 1.89 0.90 6.59 Diluted 1.74 1.53 2.01 0.94 6.22 1.66 2.11 1.88 0.89 6.54 aReplacement cost profit is before inventory holding gains and losses. See page 5 for more information.
7
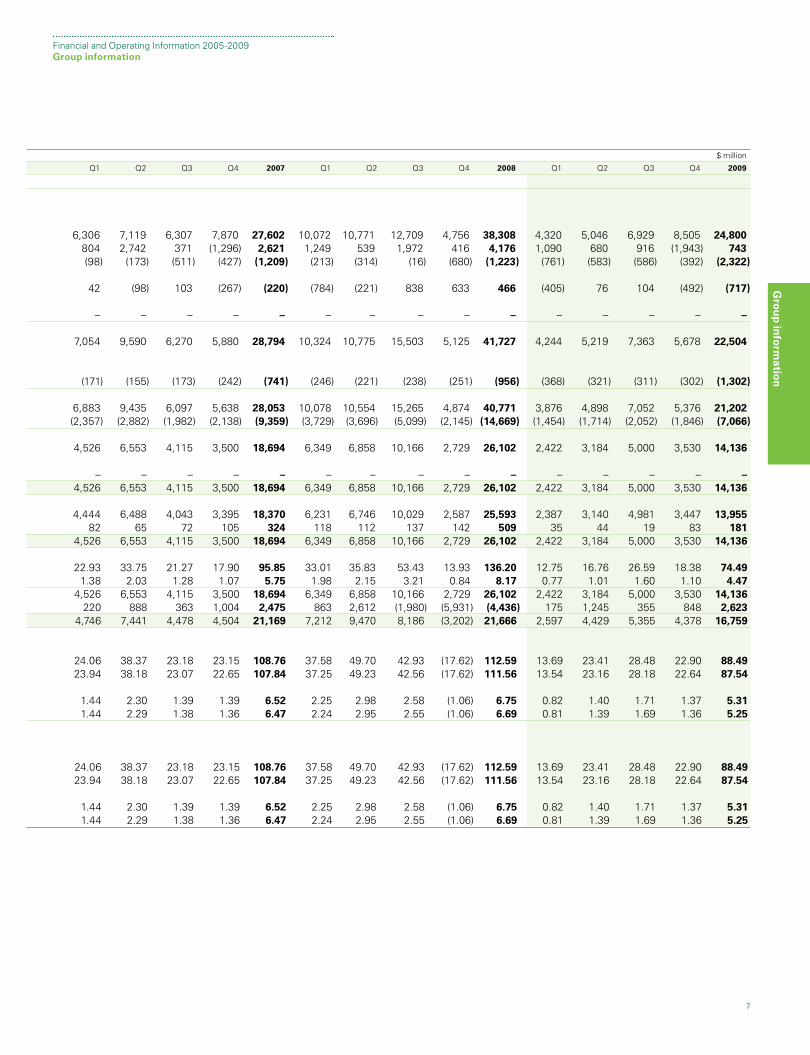
Financial and Operating Information 2005-2009Group information
$ million
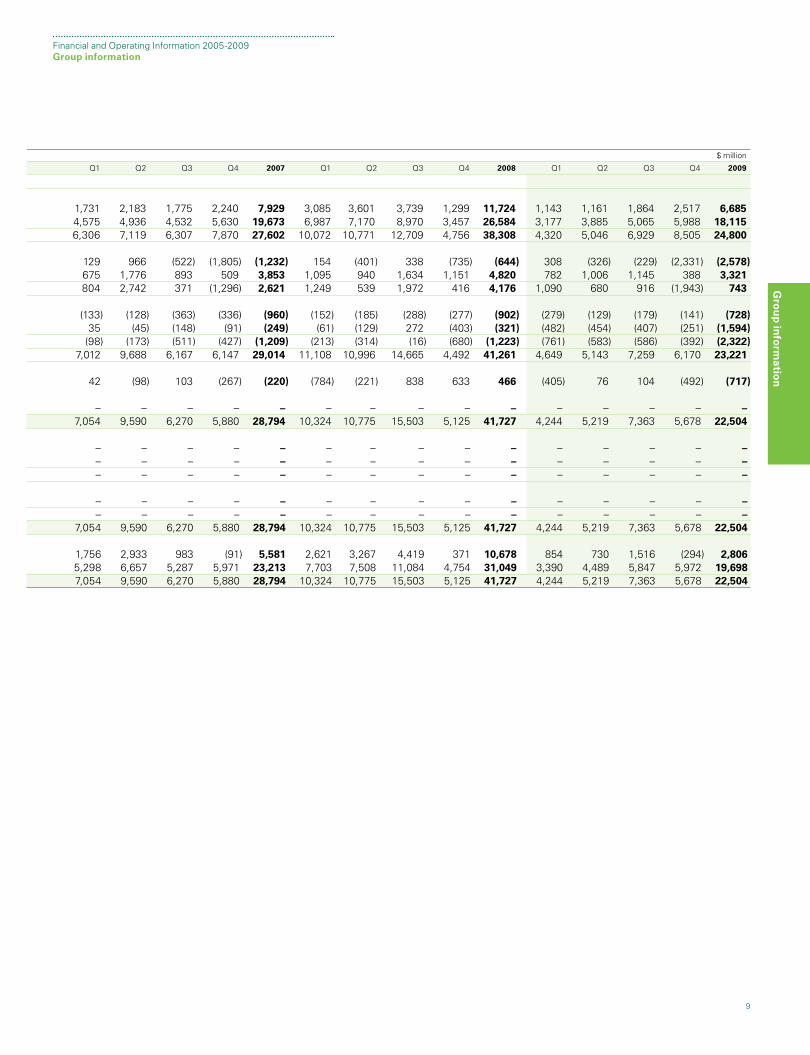
Q1 Q2 Q3 Q4 2007 Q1 Q2 Q3 Q4 2008 Q1 Q2 Q3 Q4 2009
6,306 7,119 6,307 7,870 27,602 10,072 10,771 12,709 4,756 38,308 4,320 5,046 6,929 8,505 24,800 804 2,742 371 (1,296) 2,621 1,249 539 1,972 416 4,176 1,090 680 916 (1,943) 743 (98) (173) (511) (427) (1,209) (213) (314) (16) (680) (1,223) (761) (583) (586) (392) (2,322) 42 (98) 103 (267) (220) (784) (221) 838 633 466 (405) 76 104 (492) (717) – – – – – – – – – – – – – – – 7,054 9,590 6,270 5,880 28,794 10,324 10,775 15,503 5,125 41,727 4,244 5,219 7,363 5,678 22,504
(171) (155) (173) (242) (741) (246) (221) (238) (251) (956) (368) (321) (311) (302) (1,302) 6,883 9,435 6,097 5,638 28,053 10,078 10,554 15,265 4,874 40,771 3,876 4,898 7,052 5,376 21,202 (2,357) (2,882) (1,982) (2,138) (9,359) (3,729) (3,696) (5,099) (2,145) (14,669) (1,454) (1,714) (2,052) (1,846) (7,066) 4,526 6,553 4,115 3,500 18,694 6,349 6,858 10,166 2,729 26,102 2,422 3,184 5,000 3,530 14,136 – – – – – – – – – – – – – – – 4,526 6,553 4,115 3,500 18,694 6,349 6,858 10,166 2,729 26,102 2,422 3,184 5,000 3,530 14,136 4,444 6,488 4,043 3,395 18,370 6,231 6,746 10,029 2,587 25,593 2,387 3,140 4,981 3,447 13,955 82 65 72 105 324 118 112 137 142 509 35 44 19 83 181 4,526 6,553 4,115 3,500 18,694 6,349 6,858 10,166 2,729 26,102 2,422 3,184 5,000 3,530 14,136 22.93 33.75 21.27 17.90 95.85 33.01 35.83 53.43 13.93 136.20 12.75 16.76 26.59 18.38 74.49 1.38 2.03 1.28 1.07 5.75 1.98 2.15 3.21 0.84 8.17 0.77 1.01 1.60 1.10 4.47 4,526 6,553 4,115 3,500 18,694 6,349 6,858 10,166 2,729 26,102 2,422 3,184 5,000 3,530 14,136 220 888 363 1,004 2,475 863 2,612 (1,980) (5,931) (4,436) 175 1,245 355 848 2,623 4,746 7,441 4,478 4,504 21,169 7,212 9,470 8,186 (3,202) 21,666 2,597 4,429 5,355 4,378 16,759
24.06 38.37 23.18 23.15 108.76 37.58 49.70 42.93 (17.62) 112.59 13.69 23.41 28.48 22.90 88.49 23.94 38.18 23.07 22.65 107.84 37.25 49.23 42.56 (17.62) 111.56 13.54 23.16 28.18 22.64 87.54 1.44 2.30 1.39 1.39 6.52 2.25 2.98 2.58 (1.06) 6.75 0.82 1.40 1.71 1.37 5.31 1.44 2.29 1.38 1.36 6.47 2.24 2.95 2.55 (1.06) 6.69 0.81 1.39 1.69 1.36 5.25
24.06 38.37 23.18 23.15 108.76 37.58 49.70 42.93 (17.62) 112.59 13.69 23.41 28.48 22.90 88.49 23.94 38.18 23.07 22.65 107.84 37.25 49.23 42.56 (17.62) 111.56 13.54 23.16 28.18 22.64 87.54
1.44 2.30 1.39 1.39 6.52 2.25 2.98 2.58 (1.06) 6.75 0.82 1.40 1.71 1.37 5.31 1.44 2.29 1.38 1.36 6.47 2.24 2.95 2.55 (1.06) 6.69 0.81 1.39 1.69 1.36 5.25
Gro
up
info
rmatio
n
8
Financial and Operating Information 2005-2009Group information
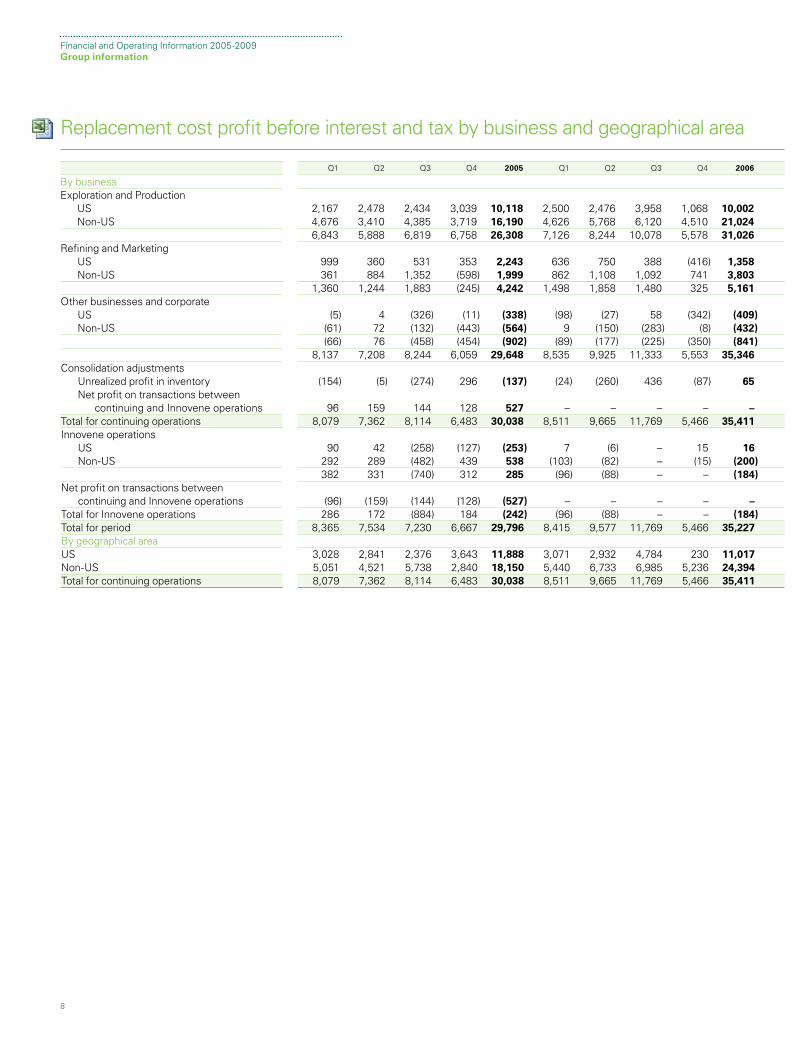
Replacement cost profit before interest and tax by business and geographical area
Q1 Q2 Q3 Q4 2005 Q1 Q2 Q3 Q4 2006
By businessExploration and Production US 2,167 2,478 2,434 3,039 10,118 2,500 2,476 3,958 1,068 10,002 Non-US 4,676 3,410 4,385 3,719 16,190 4,626 5,768 6,120 4,510 21,024 6,843 5,888 6,819 6,758 26,308 7,126 8,244 10,078 5,578 31,026Refining and Marketing US 999 360 531 353 2,243 636 750 388 (416) 1,358 Non-US 361 884 1,352 (598) 1,999 862 1,108 1,092 741 3,803 1,360 1,244 1,883 (245) 4,242 1,498 1,858 1,480 325 5,161Other businesses and corporate US (5) 4 (326) (11) (338) (98) (27) 58 (342) (409) Non-US (61) 72 (132) (443) (564) 9 (150) (283) (8) (432) (66) 76 (458) (454) (902) (89) (177) (225) (350) (841) 8,137 7,208 8,244 6,059 29,648 8,535 9,925 11,333 5,553 35,346Consolidation adjustments Unrealized profit in inventory (154) (5) (274) 296 (137) (24) (260) 436 (87) 65 Net profit on transactions between continuing and Innovene operations 96 159 144 128 527 – – – – – Total for continuing operations 8,079 7,362 8,114 6,483 30,038 8,511 9,665 11,769 5,466 35,411 Innovene operations US 90 42 (258) (127) (253) 7 (6) – 15 16 Non-US 292 289 (482) 439 538 (103) (82) – (15) (200) 382 331 (740) 312 285 (96) (88) – – (184)Net profit on transactions between continuing and Innovene operations (96) (159) (144) (128) (527) – – – – –Total for Innovene operations 286 172 (884) 184 (242) (96) (88) – – (184)Total for period 8,365 7,534 7,230 6,667 29,796 8,415 9,577 11,769 5,466 35,227By geographical area US 3,028 2,841 2,376 3,643 11,888 3,071 2,932 4,784 230 11,017Non-US 5,051 4,521 5,738 2,840 18,150 5,440 6,733 6,985 5,236 24,394Total for continuing operations 8,079 7,362 8,114 6,483 30,038 8,511 9,665 11,769 5,466 35,411
9
Financial and Operating Information 2005-2009Group information
$ million
Q1 Q2 Q3 Q4 2007 Q1 Q2 Q3 Q4 2008 Q1 Q2 Q3 Q4 2009
1,731 2,183 1,775 2,240 7,929 3,085 3,601 3,739 1,299 11,724 1,143 1,161 1,864 2,517 6,6854,575 4,936 4,532 5,630 19,673 6,987 7,170 8,970 3,457 26,584 3,177 3,885 5,065 5,988 18,1156,306 7,119 6,307 7,870 27,602 10,072 10,771 12,709 4,756 38,308 4,320 5,046 6,929 8,505 24,800
129 966 (522) (1,805) (1,232) 154 (401) 338 (735) (644) 308 (326) (229) (2,331) (2,578)675 1,776 893 509 3,853 1,095 940 1,634 1,151 4,820 782 1,006 1,145 388 3,321804 2,742 371 (1,296) 2,621 1,249 539 1,972 416 4,176 1,090 680 916 (1,943) 743
(133) (128) (363) (336) (960) (152) (185) (288) (277) (902) (279) (129) (179) (141) (728)
35 (45) (148) (91) (249) (61) (129) 272 (403) (321) (482) (454) (407) (251) (1,594)(98) (173) (511) (427) (1,209) (213) (314) (16) (680) (1,223) (761) (583) (586) (392) (2,322)
7,012 9,688 6,167 6,147 29,014 11,108 10,996 14,665 4,492 41,261 4,649 5,143 7,259 6,170 23,221
42 (98) 103 (267) (220) (784) (221) 838 633 466 (405) 76 104 (492) (717)
– – – – – – – – – – – – – – –7,054 9,590 6,270 5,880 28,794 10,324 10,775 15,503 5,125 41,727 4,244 5,219 7,363 5,678 22,504
– – – – – – – – – – – – – – –– – – – – – – – – – – – – – –– – – – – – – – – – – – – – –
– – – – – – – – – – – – – – –– – – – – – – – – – – – – – –
7,054 9,590 6,270 5,880 28,794 10,324 10,775 15,503 5,125 41,727 4,244 5,219 7,363 5,678 22,504
1,756 2,933 983 (91) 5,581 2,621 3,267 4,419 371 10,678 854 730 1,516 (294) 2,8065,298 6,657 5,287 5,971 23,213 7,703 7,508 11,084 4,754 31,049 3,390 4,489 5,847 5,972 19,6987,054 9,590 6,270 5,880 28,794 10,324 10,775 15,503 5,125 41,727 4,244 5,219 7,363 5,678 22,504
Gro
up
info
rmatio
n
10
Financial and Operating Information 2005-2009Group information
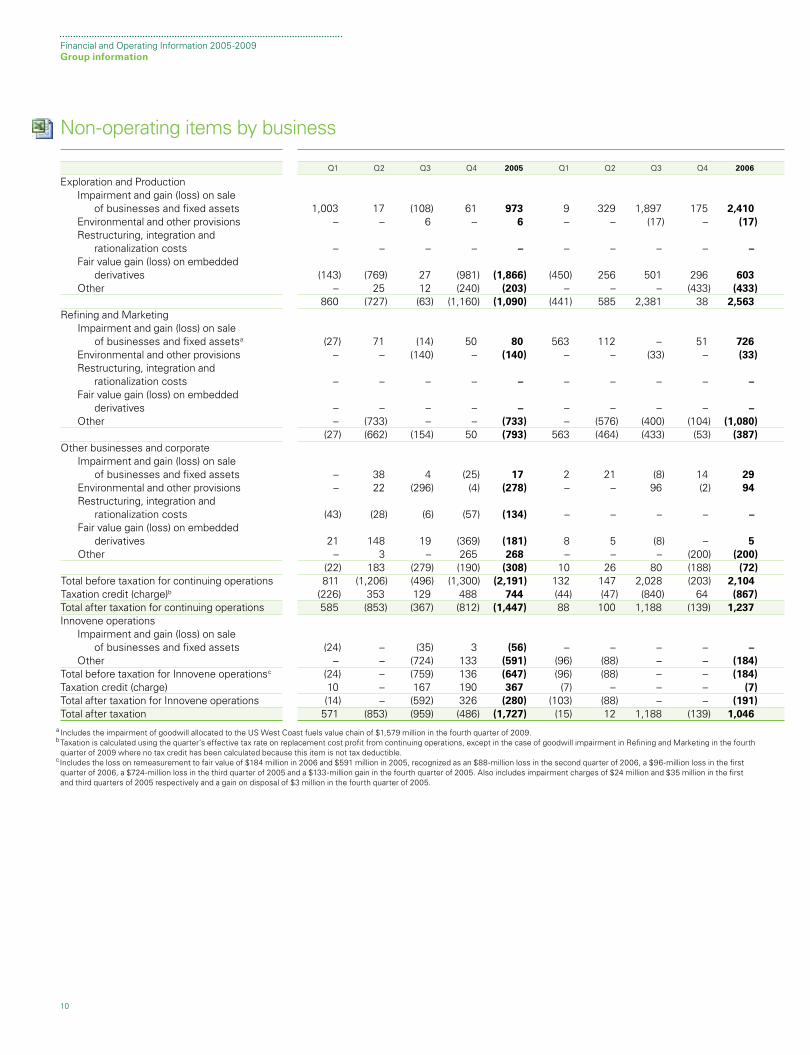
Non-operating items by business
Q1 Q2 Q3 Q4 2005 Q1 Q2 Q3 Q4 2006
Exploration and Production Impairment and gain (loss) on sale of businesses and fixed assets 1,003 17 (108) 61 973 9 329 1,897 175 2,410 Environmental and other provisions – – 6 – 6 – – (17) – (17) Restructuring, integration and rationalization costs – – – – – – – – – – Fair value gain (loss) on embedded derivatives (143) (769) 27 (981) (1,866) (450) 256 501 296 603 Other – 25 12 (240) (203) – – – (433) (433) 860 (727) (63) (1,160) (1,090) (441) 585 2,381 38 2,563 Refining and Marketing Impairment and gain (loss) on sale of businesses and fixed assetsa (27) 71 (14) 50 80 563 112 – 51 726 Environmental and other provisions – – (140) – (140) – – (33) – (33) Restructuring, integration and rationalization costs – – – – – – – – – – Fair value gain (loss) on embedded derivatives – – – – – – – – – – Other – (733) – – (733) – (576) (400) (104) (1,080) (27) (662) (154) 50 (793) 563 (464) (433) (53) (387)Other businesses and corporate Impairment and gain (loss) on sale of businesses and fixed assets – 38 4 (25) 17 2 21 (8) 14 29 Environmental and other provisions – 22 (296) (4) (278) – – 96 (2) 94 Restructuring, integration and rationalization costs (43) (28) (6) (57) (134) – – – – – Fair value gain (loss) on embedded derivatives 21 148 19 (369) (181) 8 5 (8) – 5 Other – 3 – 265 268 – – – (200) (200) (22) 183 (279) (190) (308) 10 26 80 (188) (72)Total before taxation for continuing operations 811 (1,206) (496) (1,300) (2,191) 132 147 2,028 (203) 2,104 Taxation credit (charge)b (226) 353 129 488 744 (44) (47) (840) 64 (867)Total after taxation for continuing operations 585 (853) (367) (812) (1,447) 88 100 1,188 (139) 1,237 Innovene operations Impairment and gain (loss) on sale of businesses and fixed assets (24) – (35) 3 (56) – – – – – Other – – (724) 133 (591) (96) (88) – – (184)Total before taxation for Innovene operationsc (24) – (759) 136 (647) (96) (88) – – (184)Taxation credit (charge) 10 – 167 190 367 (7) – – – (7)Total after taxation for Innovene operations (14) – (592) 326 (280) (103) (88) – – (191)Total after taxation 571 (853) (959) (486) (1,727) (15) 12 1,188 (139) 1,046 a Includes the impairment of goodwill allocated to the US West Coast fuels value chain of $1,579 million in the fourth quarter of 2009.
b T axation is calculated using the quarter’s effective tax rate on replacement cost profit from continuing operations, except in the case of goodwill impairment in Refining and Marketing in the fourth quarter of 2009 where no tax credit has been calculated because this item is not tax deductible. c Includes the loss on remeasurement to fair value of $184 million in 2006 and $591 million in 2005, recognized as an $88-million loss in the second quarter of 2006, a $96-million loss in the first quarter of 2006, a $724-million loss in the third quarter of 2005 and a $133-million gain in the fourth quarter of 2005. Also includes impairment charges of $24 million and $35 million in the first and third quarters of 2005 respectively and a gain on disposal of $3 million in the fourth quarter of 2005.
11
Financial and Operating Information 2005-2009Group information
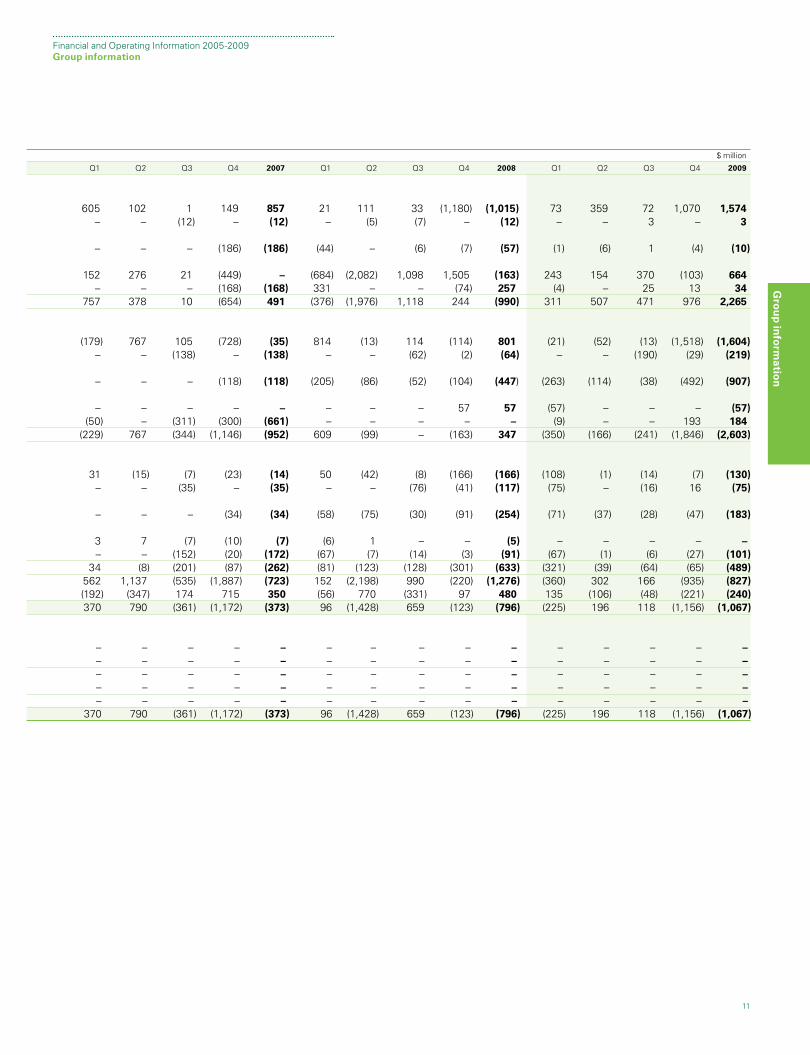
$ million
Q1 Q2 Q3 Q4 2007 Q1 Q2 Q3 Q4 2008 Q1 Q2 Q3 Q4 2009
605 102 1 149 857 21 111 33 (1,180) (1,015) 73 359 72 1,070 1,574– – (12) – (12) – (5) (7) – (12) – – 3 – 3
– – – (186) (186) (44) – (6) (7) (57) (1) (6) 1 (4) (10)
152 276 21 (449) – (684) (2,082) 1,098 1,505 (163) 243 154 370 (103) 664– – – (168) (168) 331 – – (74) 257 (4) – 25 13 34
757 378 10 (654) 491 (376) (1,976) 1,118 244 (990) 311 507 471 976 2,265
(179) 767 105 (728) (35) 814 (13) 114 (114) 801 (21) (52) (13) (1,518) (1,604)– – (138) – (138) – – (62) (2) (64) – – (190) (29) (219)
– – – (118) (118) (205) (86) (52) (104) (447) (263) (114) (38) (492) (907)
– – – – – – – – 57 57 (57) – – – (57)(50) – (311) (300) (661) – – – – – (9) – – 193 184
(229) 767 (344) (1,146) (952) 609 (99) – (163) 347 (350) (166) (241) (1,846) (2,603)
31 (15) (7) (23) (14) 50 (42) (8) (166) (166) (108) (1) (14) (7) (130)– – (35) – (35) – – (76) (41) (117) (75) – (16) 16 (75)
– – – (34) (34) (58) (75) (30) (91) (254) (71) (37) (28) (47) (183)
3 7 (7) (10) (7) (6) 1 – – (5) – – – – –– – (152) (20) (172) (67) (7) (14) (3) (91) (67) (1) (6) (27) (101)
34 (8) (201) (87) (262) (81) (123) (128) (301) (633) (321) (39) (64) (65) (489)562 1,137 (535) (1,887) (723) 152 (2,198) 990 (220) (1,276) (360) 302 166 (935) (827)(192) (347) 174 715 350 (56) 770 (331) 97 480 135 (106) (48) (221) (240)370 790 (361) (1,172) (373) 96 (1,428) 659 (123) (796) (225) 196 118 (1,156) (1,067)
– – – – – – – – – – – – – – –– – – – – – – – – – – – – – –– – – – – – – – – – – – – – –– – – – – – – – – – – – – – –– – – – – – – – – – – – – – –
370 790 (361) (1,172) (373) 96 (1,428) 659 (123) (796) (225) 196 118 (1,156) (1,067)
Gro
up
info
rmatio
n
12
Financial and Operating Information 2005-2009Group information
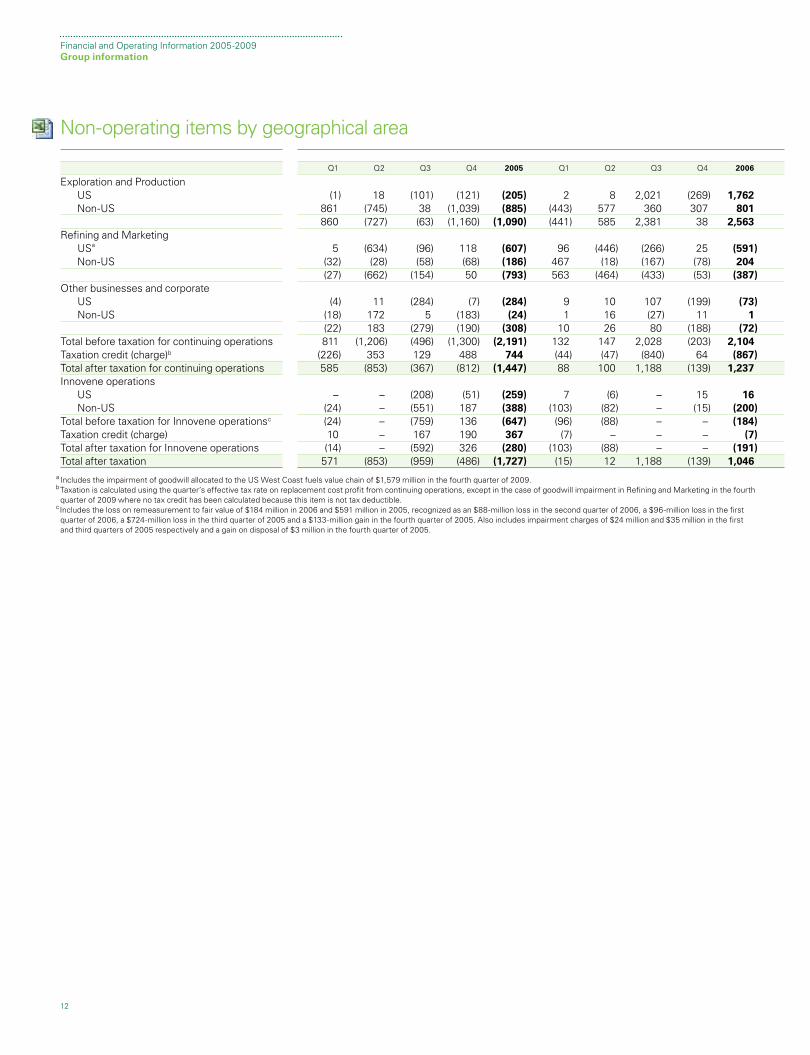
Non-operating items by geographical area
Q1 Q2 Q3 Q4 2005 Q1 Q2 Q3 Q4 2006
Exploration and Production US (1) 18 (101) (121) (205) 2 8 2,021 (269) 1,762 Non-US 861 (745) 38 (1,039) (885) (443) 577 360 307 801 860 (727) (63) (1,160) (1,090) (441) 585 2,381 38 2,563Refining and Marketing USa 5 (634) (96) 118 (607) 96 (446) (266) 25 (591) Non-US (32) (28) (58) (68) (186) 467 (18) (167) (78) 204 (27) (662) (154) 50 (793) 563 (464) (433) (53) (387)Other businesses and corporate US (4) 11 (284) (7) (284) 9 10 107 (199) (73) Non-US (18) 172 5 (183) (24) 1 16 (27) 11 1 (22) 183 (279) (190) (308) 10 26 80 (188) (72)Total before taxation for continuing operations 811 (1,206) (496) (1,300) (2,191) 132 147 2,028 (203) 2,104Taxation credit (charge)b (226) 353 129 488 744 (44) (47) (840) 64 (867)Total after taxation for continuing operations 585 (853) (367) (812) (1,447) 88 100 1,188 (139) 1,237Innovene operations US – – (208) (51) (259) 7 (6) – 15 16 Non-US (24) – (551) 187 (388) (103) (82) – (15) (200)Total before taxation for Innovene operationsc (24) – (759) 136 (647) (96) (88) – – (184)Taxation credit (charge) 10 – 167 190 367 (7) – – – (7)Total after taxation for Innovene operations (14) – (592) 326 (280) (103) (88) – – (191)Total after taxation 571 (853) (959) (486) (1,727) (15) 12 1,188 (139) 1,046 a Includes the impairment of goodwill allocated to the US West Coast fuels value chain of $1,579 million in the fourth quarter of 2009.
b T axation is calculated using the quarter’s effective tax rate on replacement cost profit from continuing operations, except in the case of goodwill impairment in Refining and Marketing in the fourth quarter of 2009 where no tax credit has been calculated because this item is not tax deductible. c Includes the loss on remeasurement to fair value of $184 million in 2006 and $591 million in 2005, recognized as an $88-million loss in the second quarter of 2006, a $96-million loss in the first quarter of 2006, a $724-million loss in the third quarter of 2005 and a $133-million gain in the fourth quarter of 2005. Also includes impairment charges of $24 million and $35 million in the first and third quarters of 2005 respectively and a gain on disposal of $3 million in the fourth quarter of 2005.
13
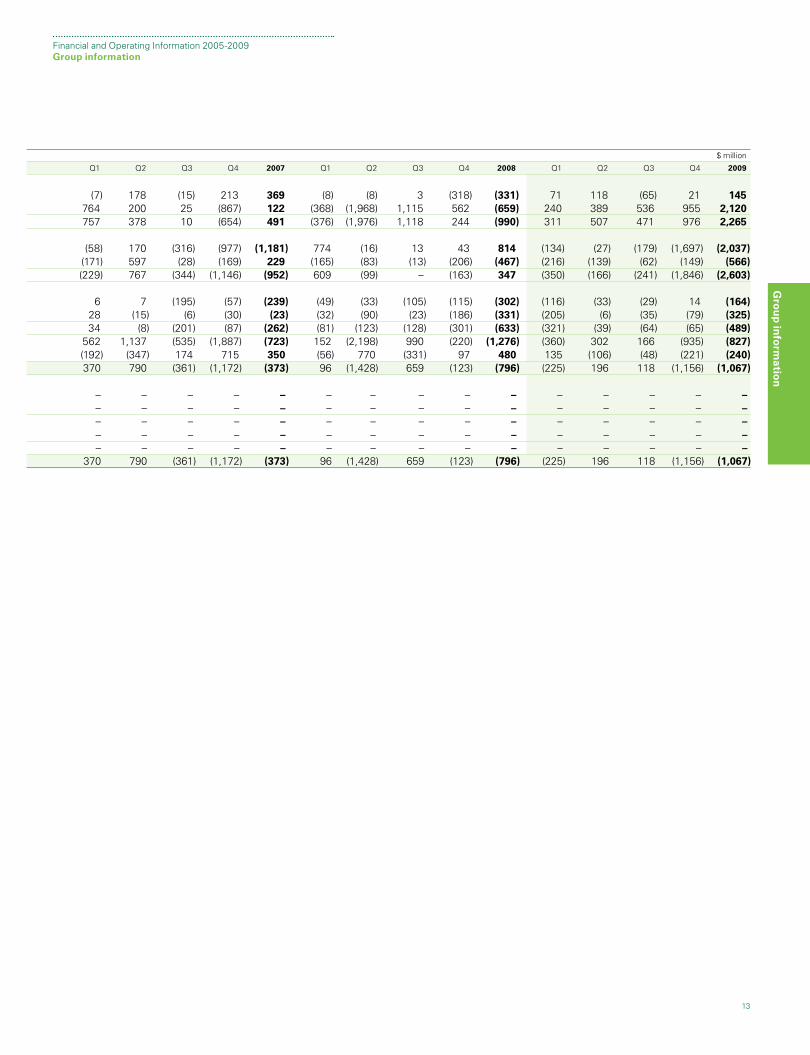
Financial and Operating Information 2005-2009Group information
$ million
Q1 Q2 Q3 Q4 2007 Q1 Q2 Q3 Q4 2008 Q1 Q2 Q3 Q4 2009
(7) 178 (15) 213 369 (8) (8) 3 (318) (331) 71 118 (65) 21 145764 200 25 (867) 122 (368) (1,968) 1,115 562 (659) 240 389 536 955 2,120757 378 10 (654) 491 (376) (1,976) 1,118 244 (990) 311 507 471 976 2,265
(58) 170 (316) (977) (1,181) 774 (16) 13 43 814 (134) (27) (179) (1,697) (2,037)(171) 597 (28) (169) 229 (165) (83) (13) (206) (467) (216) (139) (62) (149) (566)(229) 767 (344) (1,146) (952) 609 (99) – (163) 347 (350) (166) (241) (1,846) (2,603)
6 7 (195) (57) (239) (49) (33) (105) (115) (302) (116) (33) (29) 14 (164)28 (15) (6) (30) (23) (32) (90) (23) (186) (331) (205) (6) (35) (79) (325)34 (8) (201) (87) (262) (81) (123) (128) (301) (633) (321) (39) (64) (65) (489)
562 1,137 (535) (1,887) (723) 152 (2,198) 990 (220) (1,276) (360) 302 166 (935) (827)(192) (347) 174 715 350 (56) 770 (331) 97 480 135 (106) (48) (221) (240)370 790 (361) (1,172) (373) 96 (1,428) 659 (123) (796) (225) 196 118 (1,156) (1,067)
– – – – – – – – – – – – – – –– – – – – – – – – – – – – – –– – – – – – – – – – – – – – –– – – – – – – – – – – – – – –– – – – – – – – – – – – – – –
370 790 (361) (1,172) (373) 96 (1,428) 659 (123) (796) (225) 196 118 (1,156) (1,067)
Gro
up
info
rmatio
n
14
Financial and Operating Information 2005-2009Group information
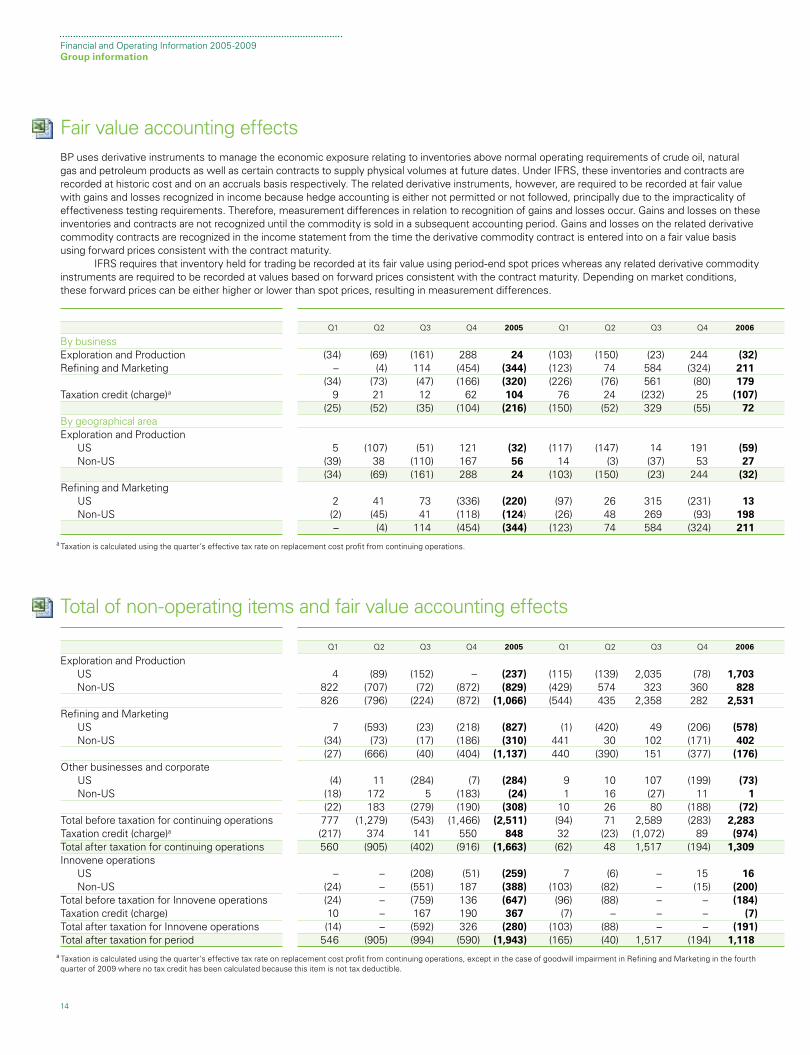
Fair value accounting effectsBP uses derivative instruments to manage the economic exposure relating to inventories above normal operating requirements of crude oil, natural gas and petroleum products as well as certain contracts to supply physical volumes at future dates. Under IFRS, these inventories and contracts are recorded at historic cost and on an accruals basis respectively. The related derivative instruments, however, are required to be recorded at fair value with gains and losses recognized in income because hedge accounting is either not permitted or not followed, principally due to the impracticality of effectiveness testing requirements. Therefore, measurement differences in relation to recognition of gains and losses occur. Gains and losses on these inventories and contracts are not recognized until the commodity is sold in a subsequent accounting period. Gains and losses on the related derivative commodity contracts are recognized in the income statement from the time the derivative commodity contract is entered into on a fair value basis using forward prices consistent with the contract maturity. IFRS requires that inventory held for trading be recorded at its fair value using period-end spot prices whereas any related derivative commodity instruments are required to be recorded at values based on forward prices consistent with the contract maturity. Depending on market conditions, these forward prices can be either higher or lower than spot prices, resulting in measurement differences.
Q1 Q2 Q3 Q4 2005 Q1 Q2 Q3 Q4 2006
By businessExploration and Production (34) (69) (161) 288 24 (103) (150) (23) 244 (32)Refining and Marketing – (4) 114 (454) (344) (123) 74 584 (324) 211 (34) (73) (47) (166) (320) (226) (76) 561 (80) 179Taxation credit (charge)a 9 21 12 62 104 76 24 (232) 25 (107) (25) (52) (35) (104) (216) (150) (52) 329 (55) 72 By geographical areaExploration and Production US 5 (107) (51) 121 (32) (117) (147) 14 191 (59) Non-US (39) 38 (110) 167 56 14 (3) (37) 53 27 (34) (69) (161) 288 24 (103) (150) (23) 244 (32)Refining and Marketing US 2 41 73 (336) (220) (97) 26 315 (231) 13 Non-US (2) (45) 41 (118) (124) (26) 48 269 (93) 198 – (4) 114 (454) (344) (123) 74 584 (324) 211 a Taxation is calculated using the quarter’s effective tax rate on replacement cost profit from continuing operations.
Total of non-operating items and fair value accounting effects
Q1 Q2 Q3 Q4 2005 Q1 Q2 Q3 Q4 2006
Exploration and Production US 4 (89) (152) – (237) (115) (139) 2,035 (78) 1,703 Non-US 822 (707) (72) (872) (829) (429) 574 323 360 828 826 (796) (224) (872) (1,066) (544) 435 2,358 282 2,531Refining and Marketing US 7 (593) (23) (218) (827) (1) (420) 49 (206) (578) Non-US (34) (73) (17) (186) (310) 441 30 102 (171) 402 (27) (666) (40) (404) (1,137) 440 (390) 151 (377) (176)Other businesses and corporate US (4) 11 (284) (7) (284) 9 10 107 (199) (73) Non-US (18) 172 5 (183) (24) 1 16 (27) 11 1 (22) 183 (279) (190) (308) 10 26 80 (188) (72)Total before taxation for continuing operations 777 (1,279) (543) (1,466) (2,511) (94) 71 2,589 (283) 2,283 Taxation credit (charge)a (217) 374 141 550 848 32 (23) (1,072) 89 (974)Total after taxation for continuing operations 560 (905) (402) (916) (1,663) (62) 48 1,517 (194) 1,309 Innovene operations US – – (208) (51) (259) 7 (6) – 15 16 Non-US (24) – (551) 187 (388) (103) (82) – (15) (200)Total before taxation for Innovene operations (24) – (759) 136 (647) (96) (88) – – (184)Taxation credit (charge) 10 – 167 190 367 (7) – – – (7)Total after taxation for Innovene operations (14) – (592) 326 (280) (103) (88) – – (191)Total after taxation for period 546 (905) (994) (590) (1,943) (165) (40) 1,517 (194) 1,118 a Taxation is calculated using the quarter’s effective tax rate on replacement cost profit from continuing operations, except in the case of goodwill impairment in Refining and Marketing in the fourth quarter of 2009 where no tax credit has been calculated because this item is not tax deductible.
15
Financial and Operating Information 2005-2009Group information
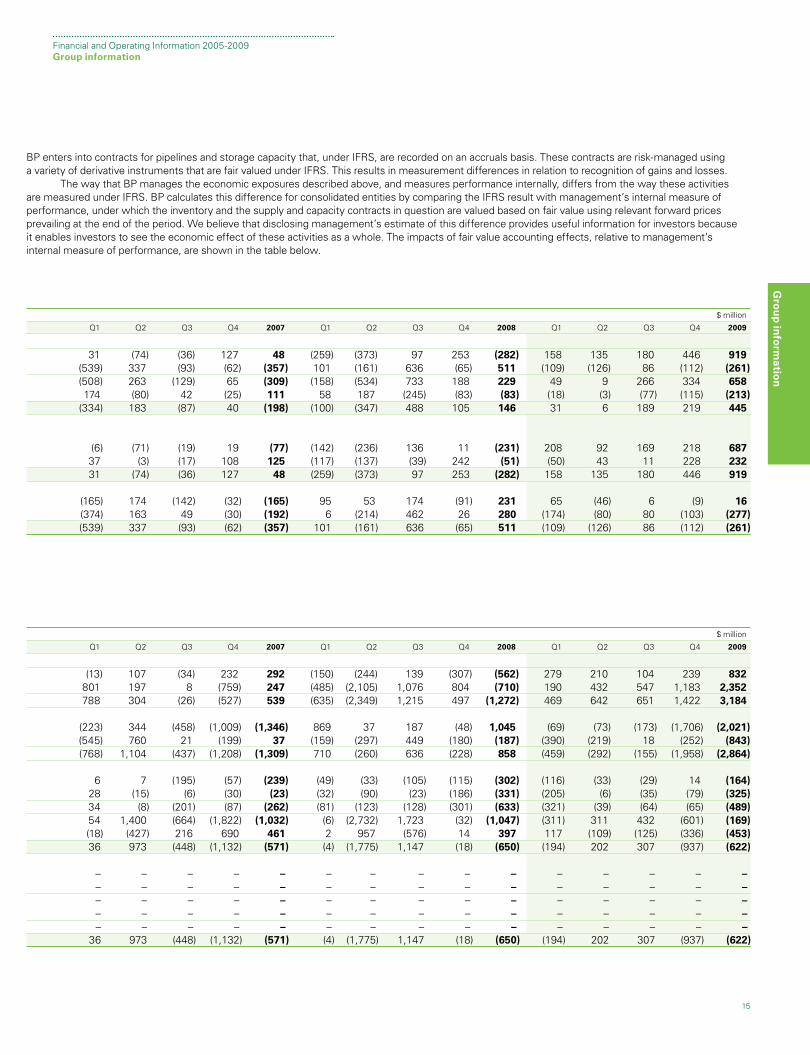
BP enters into contracts for pipelines and storage capacity that, under IFRS, are recorded on an accruals basis. These contracts are risk-managed using a variety of derivative instruments that are fair valued under IFRS. This results in measurement differences in relation to recognition of gains and losses. The way that BP manages the economic exposures described above, and measures performance internally, differs from the way these activities are measured under IFRS. BP calculates this difference for consolidated entities by comparing the IFRS result with management’s internal measure of performance, under which the inventory and the supply and capacity contracts in question are valued based on fair value using relevant forward prices prevailing at the end of the period. We believe that disclosing management’s estimate of this difference provides useful information for investors because it enables investors to see the economic effect of these activities as a whole. The impacts of fair value accounting effects, relative to management’s internal measure of performance, are shown in the table below.
$ million
Q1 Q2 Q3 Q4 2007 Q1 Q2 Q3 Q4 2008 Q1 Q2 Q3 Q4 2009
31 (74) (36) 127 48 (259) (373) 97 253 (282) 158 135 180 446 919 (539) 337 (93) (62) (357) 101 (161) 636 (65) 511 (109) (126) 86 (112) (261)(508) 263 (129) 65 (309) (158) (534) 733 188 229 49 9 266 334 658 174 (80) 42 (25) 111 58 187 (245) (83) (83) (18) (3) (77) (115) (213)
(334) 183 (87) 40 (198) (100) (347) 488 105 146 31 6 189 219 445
(6) (71) (19) 19 (77) (142) (236) 136 11 (231) 208 92 169 218 687 37 (3) (17) 108 125 (117) (137) (39) 242 (51) (50) 43 11 228 232 31 (74) (36) 127 48 (259) (373) 97 253 (282) 158 135 180 446 919
(165) 174 (142) (32) (165) 95 53 174 (91) 231 65 (46) 6 (9) 16 (374) 163 49 (30) (192) 6 (214) 462 26 280 (174) (80) 80 (103) (277)(539) 337 (93) (62) (357) 101 (161) 636 (65) 511 (109) (126) 86 (112) (261)
$ million
Q1 Q2 Q3 Q4 2007 Q1 Q2 Q3 Q4 2008 Q1 Q2 Q3 Q4 2009
(13) 107 (34) 232 292 (150) (244) 139 (307) (562) 279 210 104 239 832 801 197 8 (759) 247 (485) (2,105) 1,076 804 (710) 190 432 547 1,183 2,352 788 304 (26) (527) 539 (635) (2,349) 1,215 497 (1,272) 469 642 651 1,422 3,184
(223) 344 (458) (1,009) (1,346) 869 37 187 (48) 1,045 (69) (73) (173) (1,706) (2,021)(545) 760 21 (199) 37 (159) (297) 449 (180) (187) (390) (219) 18 (252) (843)(768) 1,104 (437) (1,208) (1,309) 710 (260) 636 (228) 858 (459) (292) (155) (1,958) (2,864)
6 7 (195) (57) (239) (49) (33) (105) (115) (302) (116) (33) (29) 14 (164)28 (15) (6) (30) (23) (32) (90) (23) (186) (331) (205) (6) (35) (79) (325)34 (8) (201) (87) (262) (81) (123) (128) (301) (633) (321) (39) (64) (65) (489)54 1,400 (664) (1,822) (1,032) (6) (2,732) 1,723 (32) (1,047) (311) 311 432 (601) (169)(18) (427) 216 690 461 2 957 (576) 14 397 117 (109) (125) (336) (453)36 973 (448) (1,132) (571) (4) (1,775) 1,147 (18) (650) (194) 202 307 (937) (622)
– – – – – – – – – – – – – – – – – – – – – – – – – – – – – – – – – – – – – – – – – – – – – – – – – – – – – – – – – – – – – – – – – – – – – – – – – – –
36 973 (448) (1,132) (571) (4) (1,775) 1,147 (18) (650) (194) 202 307 (937) (622)
Gro
up
info
rmatio
n
16
Financial and Operating Information 2005-2009Group information
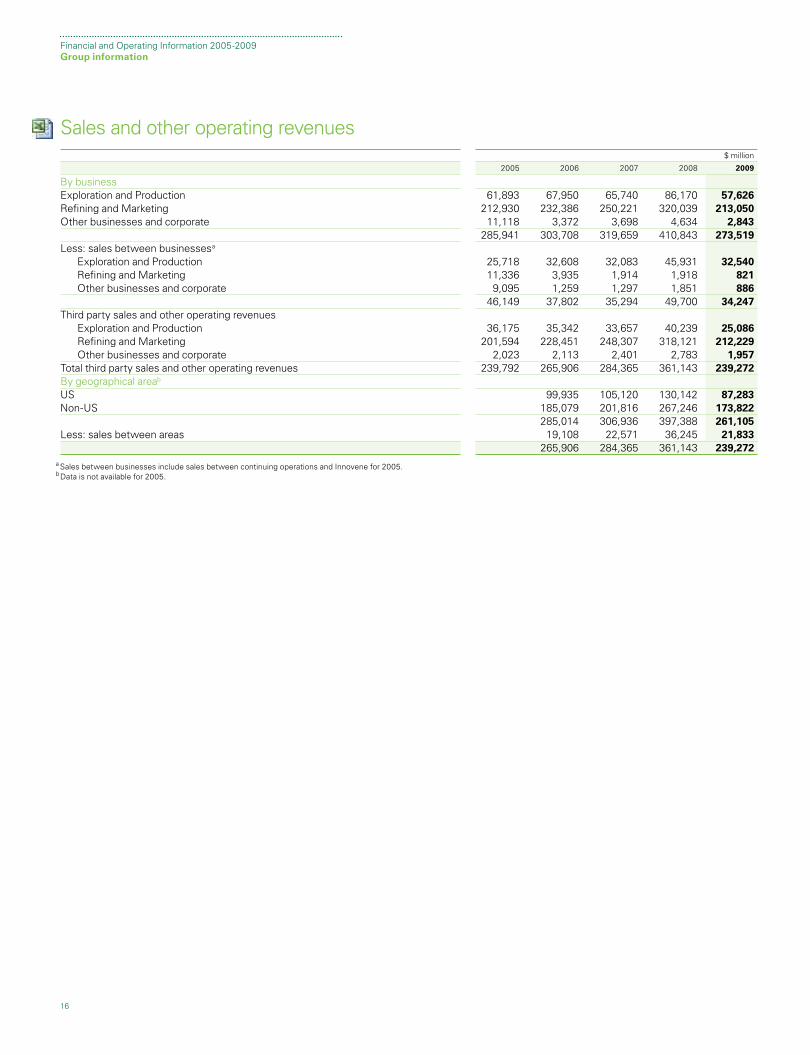
Sales and other operating revenues $ million
2005 2006 2007 2008 2009
By businessExploration and Production 61,893 67,950 65,740 86,170 57,626Refining and Marketing 212,930 232,386 250,221 320,039 213,050Other businesses and corporate 11,118 3,372 3,698 4,634 2,843 285,941 303,708 319,659 410,843 273,519Less: sales between businessesa
Exploration and Production 25,718 32,608 32,083 45,931 32,540 Refining and Marketing 11,336 3,935 1,914 1,918 821 Other businesses and corporate 9,095 1,259 1,297 1,851 886 46,149 37,802 35,294 49,700 34,247Third party sales and other operating revenues Exploration and Production 36,175 35,342 33,657 40,239 25,086 Refining and Marketing 201,594 228,451 248,307 318,121 212,229 Other businesses and corporate 2,023 2,113 2,401 2,783 1,957Total third party sales and other operating revenues 239,792 265,906 284,365 361,143 239,272By geographical areab
US 99,935 105,120 130,142 87,283Non-US 185,079 201,816 267,246 173,822 285,014 306,936 397,388 261,105Less: sales between areas 19,108 22,571 36,245 21,833 265,906 284,365 361,143 239,272
a S ales between businesses include sales between continuing operations and Innovene for 2005. b Data is not available for 2005.
17
Financial and Operating Information 2005-2009Group information
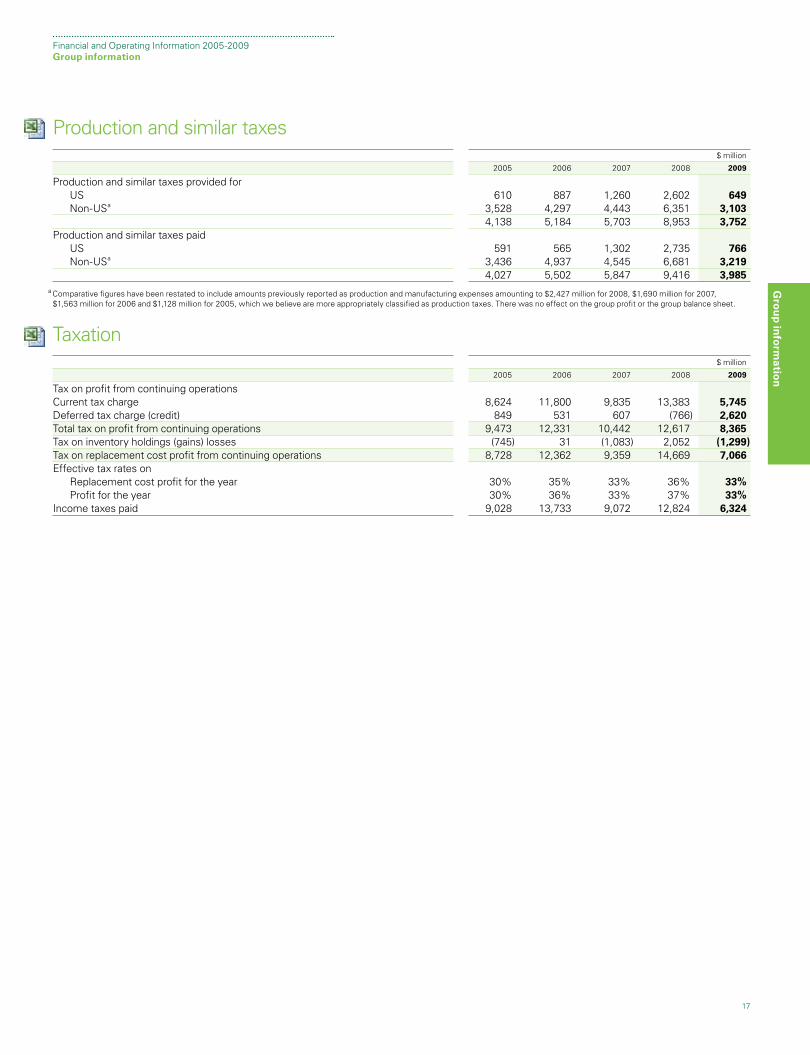
Production and similar taxes $ million
2005 2006 2007 2008 2009
Production and similar taxes provided for US 610 887 1,260 2,602 649 Non-USa 3,528 4,297 4,443 6,351 3,103 4,138 5,184 5,703 8,953 3,752Production and similar taxes paid US 591 565 1,302 2,735 766 Non-USa 3,436 4,937 4,545 6,681 3,219 4,027 5,502 5,847 9,416 3,985
a C omparative figures have been restated to include amounts previously reported as production and manufacturing expenses amounting to $2,427 million for 2008, $1,690 million for 2007, $1,563 million for 2006 and $1,128 million for 2005, which we believe are more appropriately classified as production taxes. There was no effect on the group profit or the group balance sheet.
Taxation $ million
2005 2006 2007 2008 2009
Tax on profit from continuing operationsCurrent tax charge 8,624 11,800 9,835 13,383 5,745Deferred tax charge (credit) 849 531 607 (766) 2,620Total tax on profit from continuing operations 9,473 12,331 10,442 12,617 8,365Tax on inventory holdings (gains) losses (745) 31 (1,083) 2,052 (1,299)Tax on replacement cost profit from continuing operations 8,728 12,362 9,359 14,669 7,066Effective tax rates on Replacement cost profit for the year 30% 35% 33% 36% 33% Profit for the year 30% 36% 33% 37% 33%Income taxes paid 9,028 13,733 9,072 12,824 6,324
Gro
up
info
rmatio
n
18
Financial and Operating Information 2005-2009Group information
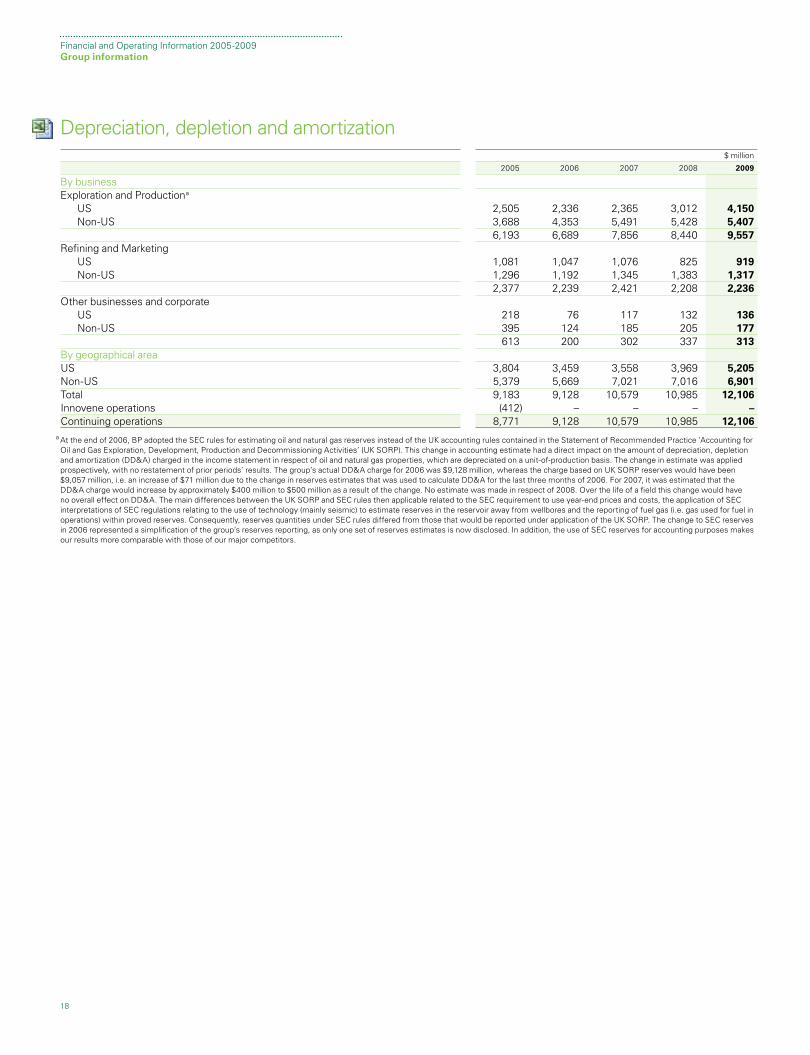
Depreciation, depletion and amortization $ million
2005 2006 2007 2008 2009
By businessExploration and Productiona
US 2,505 2,336 2,365 3,012 4,150 Non-US 3,688 4,353 5,491 5,428 5,407 6,193 6,689 7,856 8,440 9,557Refining and Marketing US 1,081 1,047 1,076 825 919 Non-US 1,296 1,192 1,345 1,383 1,317 2,377 2,239 2,421 2,208 2,236Other businesses and corporate US 218 76 117 132 136 Non-US 395 124 185 205 177 613 200 302 337 313By geographical area US 3,804 3,459 3,558 3,969 5,205Non-US 5,379 5,669 7,021 7,016 6,901Total 9,183 9,128 10,579 10,985 12,106 Innovene operations (412) – – – –Continuing operations 8,771 9,128 10,579 10,985 12,106 a At the end of 2006, BP adopted the SEC rules for estimating oil and natural gas reserves instead of the UK accounting rules contained in the Statement of Recommended Practice ‘Accounting for Oil and Gas Exploration, Development, Production and Decommissioning Activities’ (UK SORP). This change in accounting estimate had a direct impact on the amount of depreciation, depletion and amortization (DD&A) charged in the income statement in respect of oil and natural gas properties, which are depreciated on a unit-of-production basis. The change in estimate was applied prospectively, with no restatement of prior periods’ results. The group’s actual DD&A charge for 2006 was $9,128 million, whereas the charge based on UK SORP reserves would have been $9,057 million, i.e. an increase of $71 million due to the change in reserves estimates that was used to calculate DD&A for the last three months of 2006. For 2007, it was estimated that the DD&A charge would increase by approximately $400 million to $500 million as a result of the change. No estimate was made in respect of 2008. Over the life of a field this change would have no overall effect on DD&A. The main differences between the UK SORP and SEC rules then applicable related to the SEC requirement to use year-end prices and costs, the application of SEC interpretations of SEC regulations relating to the use of technology (mainly seismic) to estimate reserves in the reservoir away from wellbores and the reporting of fuel gas (i.e. gas used for fuel in operations) within proved reserves. Consequently, reserves quantities under SEC rules differed from those that would be reported under application of the UK SORP. The change to SEC reserves in 2006 represented a simplification of the group’s reserves reporting, as only one set of reserves estimates is now disclosed. In addition, the use of SEC reserves for accounting purposes makes our results more comparable with those of our major competitors.
19
Financial and Operating Information 2005-2009Group information
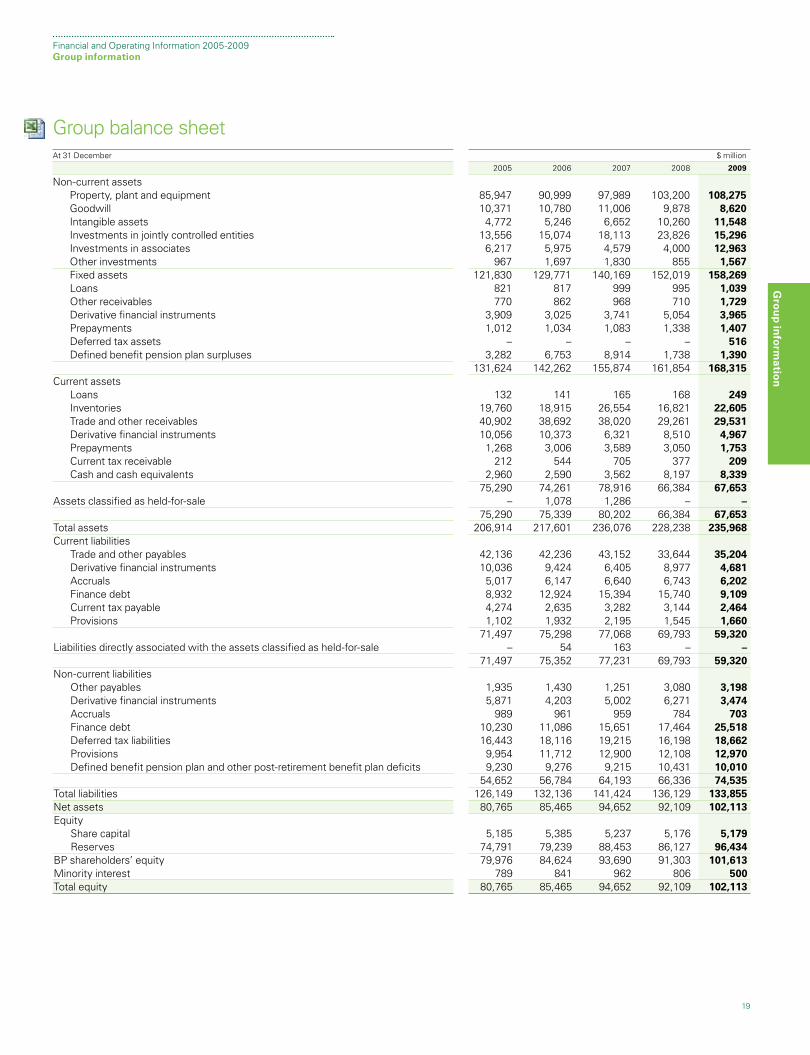
Group balance sheetA t 31 December $ million
2005 2006 2007 2008 2009
Non-current assets Property, plant and equipment 85,947 90,999 97,989 103,200 108,275 Goodwill 10,371 10,780 11,006 9,878 8,620 Intangible assets 4,772 5,246 6,652 10,260 11,548 Investments in jointly controlled entities 13,556 15,074 18,113 23,826 15,296 Investments in associates 6,217 5,975 4,579 4,000 12,963 Other investments 967 1,697 1,830 855 1,567 Fixed assets 121,830 129,771 140,169 152,019 158,269 Loans 821 817 999 995 1,039 Other receivables 770 862 968 710 1,729 Derivative financial instruments 3,909 3,025 3,741 5,054 3,965 Prepayments 1,012 1,034 1,083 1,338 1,407 Deferred tax assets – – – – 516 Defined benefit pension plan surpluses 3,282 6,753 8,914 1,738 1,390 131,624 142,262 155,874 161,854 168,315Current assets Loans 132 141 165 168 249 Inventories 19,760 18,915 26,554 16,821 22,605 Trade and other receivables 40,902 38,692 38,020 29,261 29,531 Derivative financial instruments 10,056 10,373 6,321 8,510 4,967 Prepayments 1,268 3,006 3,589 3,050 1,753 Current tax receivable 212 544 705 377 209 Cash and cash equivalents 2,960 2,590 3,562 8,197 8,339 75,290 74,261 78,916 66,384 67,653Assets classified as held-for-sale – 1,078 1,286 – – 75,290 75,339 80,202 66,384 67,653Total assets 206,914 217,601 236,076 228,238 235,968Current liabilities Trade and other payables 42,136 42,236 43,152 33,644 35,204 Derivative financial instruments 10,036 9,424 6,405 8,977 4,681 Accruals 5,017 6,147 6,640 6,743 6,202 Finance debt 8,932 12,924 15,394 15,740 9,109 Current tax payable 4,274 2,635 3,282 3,144 2,464 Provisions 1,102 1,932 2,195 1,545 1,660 71,497 75,298 77,068 69,793 59,320Liabilities directly associated with the assets classified as held-for-sale – 54 163 – – 71,497 75,352 77,231 69,793 59,320Non-current liabilities Other payables 1,935 1,430 1,251 3,080 3,198 Derivative financial instruments 5,871 4,203 5,002 6,271 3,474 Accruals 989 961 959 784 703 Finance debt 10,230 11,086 15,651 17,464 25,518 Deferred tax liabilities 16,443 18,116 19,215 16,198 18,662 Provisions 9,954 11,712 12,900 12,108 12,970 Defined benefit pension plan and other post-retirement benefit plan deficits 9,230 9,276 9,215 10,431 10,010 54,652 56,784 64,193 66,336 74,535Total liabilities 126,149 132,136 141,424 136,129 133,855Net assets 80,765 85,465 94,652 92,109 102,113 Equity Share capital 5,185 5,385 5,237 5,176 5,179 Reserves 74,791 79,239 88,453 86,127 96,434BP shareholders’ equity 79,976 84,624 93,690 91,303 101,613Minority interest 789 841 962 806 500Total equity 80,765 85,465 94,652 92,109 102,113
Gro
up
info
rmatio
n
20
Financial and Operating Information 2005-2009Group information
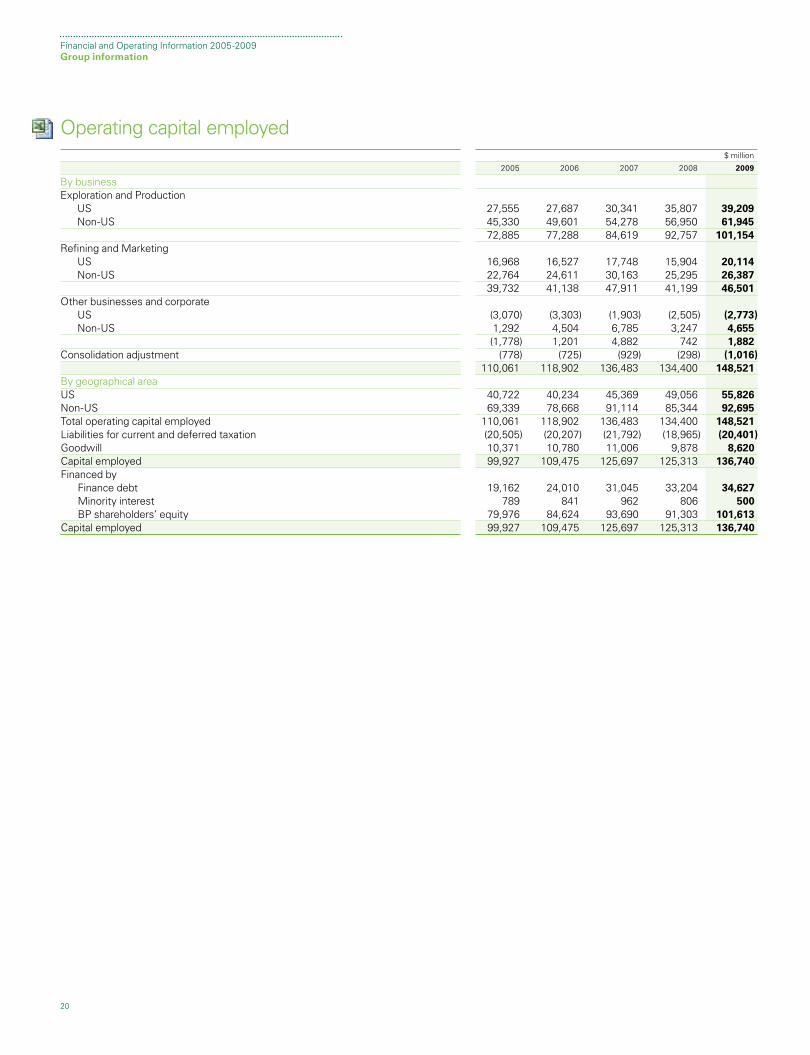
Operating capital employed $ million
2005 2006 2007 2008 2009
By businessExploration and Production US 27,555 27,687 30,341 35,807 39,209 Non-US 45,330 49,601 54,278 56,950 61,945 72,885 77,288 84,619 92,757 101,154 Refining and Marketing US 16,968 16,527 17,748 15,904 20,114 Non-US 22,764 24,611 30,163 25,295 26,387 39,732 41,138 47,911 41,199 46,501 Other businesses and corporate US (3,070) (3,303) (1,903) (2,505) (2,773) Non-US 1,292 4,504 6,785 3,247 4,655 (1,778) 1,201 4,882 742 1,882 Consolidation adjustment (778) (725) (929) (298) (1,016) 110,061 118,902 136,483 134,400 148,521 By geographical areaUS 40,722 40,234 45,369 49,056 55,826 Non-US 69,339 78,668 91,114 85,344 92,695 Total operating capital employed 110,061 118,902 136,483 134,400 148,521 Liabilities for current and deferred taxation (20,505) (20,207) (21,792) (18,965) (20,401)Goodwill 10,371 10,780 11,006 9,878 8,620 Capital employed 99,927 109,475 125,697 125,313 136,740 Financed by Finance debt 19,162 24,010 31,045 33,204 34,627 Minority interest 789 841 962 806 500 BP shareholders’ equity 79,976 84,624 93,690 91,303 101,613 Capital employed 99,927 109,475 125,697 125,313 136,740
21
Financial and Operating Information 2005-2009Group information
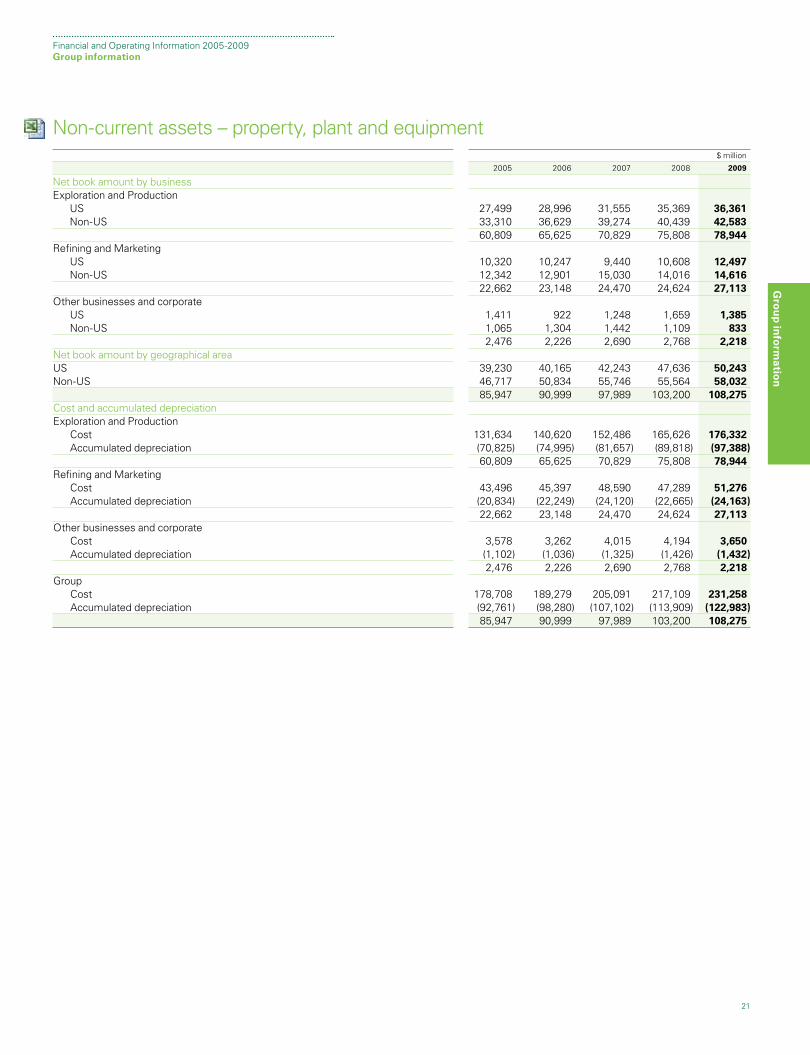
Non-current assets – property, plant and equipment $ million
2005 2006 2007 2008 2009
Net book amount by businessExploration and Production US 27,499 28,996 31,555 35,369 36,361 Non-US 33,310 36,629 39,274 40,439 42,583 60,809 65,625 70,829 75,808 78,944Refining and Marketing US 10,320 10,247 9,440 10,608 12,497 Non-US 12,342 12,901 15,030 14,016 14,616 22,662 23,148 24,470 24,624 27,113Other businesses and corporate US 1,411 922 1,248 1,659 1,385 Non-US 1,065 1,304 1,442 1,109 833 2,476 2,226 2,690 2,768 2,218Net book amount by geographical areaUS 39,230 40,165 42,243 47,636 50,243Non-US 46,717 50,834 55,746 55,564 58,032 85,947 90,999 97,989 103,200 108,275Cost and accumulated depreciationExploration and Production Cost 131,634 140,620 152,486 165,626 176,332 Accumulated depreciation (70,825) (74,995) (81,657) (89,818) (97,388) 60,809 65,625 70,829 75,808 78,944Refining and Marketing Cost 43,496 45,397 48,590 47,289 51,276 Accumulated depreciation (20,834) (22,249) (24,120) (22,665) (24,163) 22,662 23,148 24,470 24,624 27,113Other businesses and corporate Cost 3,578 3,262 4,015 4,194 3,650 Accumulated depreciation (1,102) (1,036) (1,325) (1,426) (1,432) 2,476 2,226 2,690 2,768 2,218Group Cost 178,708 189,279 205,091 217,109 231,258 Accumulated depreciation (92,761) (98,280) (107,102) (113,909) (122,983) 85,947 90,999 97,989 103,200 108,275
Gro
up
info
rmatio
n
22
Financial and Operating Information 2005-2009Group information
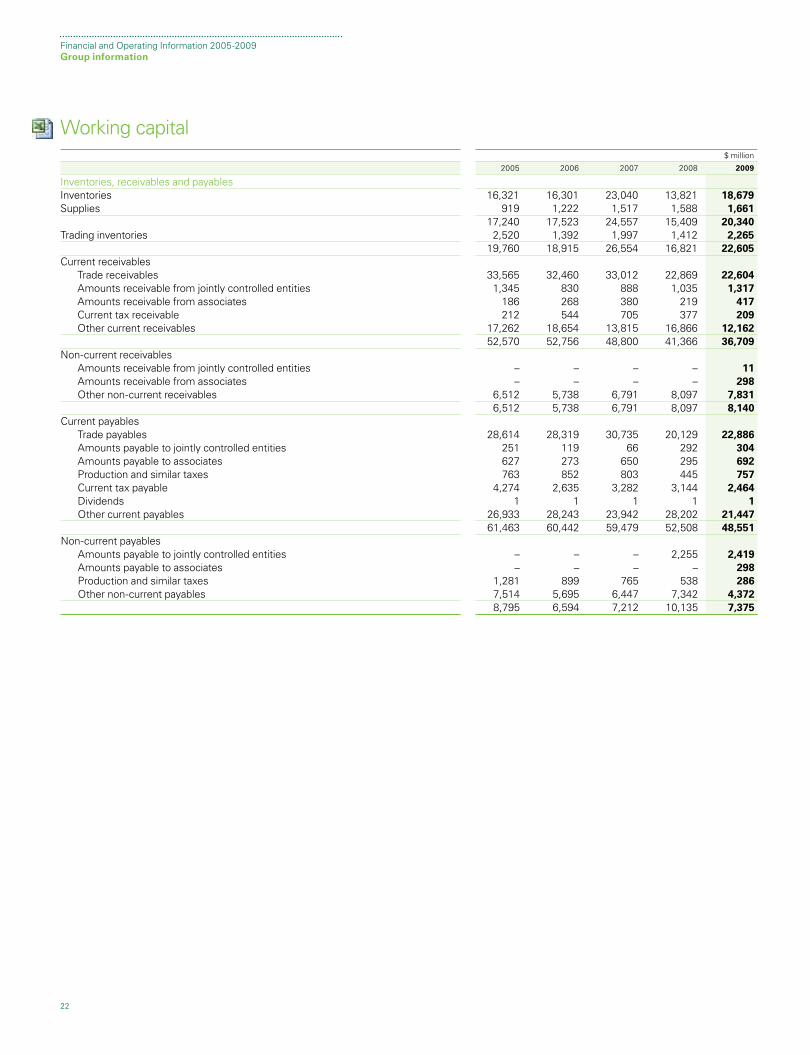
Working capital $ million
2005 2006 2007 2008 2009
Inventories, receivables and payablesInventories 16,321 16,301 23,040 13,821 18,679 Supplies 919 1,222 1,517 1,588 1,661 17,240 17,523 24,557 15,409 20,340 Trading inventories 2,520 1,392 1,997 1,412 2,265 19,760 18,915 26,554 16,821 22,605 Current receivables Trade receivables 33,565 32,460 33,012 22,869 22,604 Amounts receivable from jointly controlled entities 1,345 830 888 1,035 1,317 Amounts receivable from associates 186 268 380 219 417 Current tax receivable 212 544 705 377 209 Other current receivables 17,262 18,654 13,815 16,866 12,162 52,570 52,756 48,800 41,366 36,709 Non-current receivables Amounts receivable from jointly controlled entities – – – – 11 Amounts receivable from associates – – – – 298 Other non-current receivables 6,512 5,738 6,791 8,097 7,831 6,512 5,738 6,791 8,097 8,140 Current payables Trade payables 28,614 28,319 30,735 20,129 22,886 Amounts payable to jointly controlled entities 251 119 66 292 304 Amounts payable to associates 627 273 650 295 692 Production and similar taxes 763 852 803 445 757 Current tax payable 4,274 2,635 3,282 3,144 2,464 Dividends 1 1 1 1 1 Other current payables 26,933 28,243 23,942 28,202 21,447 61,463 60,442 59,479 52,508 48,551 Non-current payables Amounts payable to jointly controlled entities – – – 2,255 2,419 Amounts payable to associates – – – – 298 Production and similar taxes 1,281 899 765 538 286 Other non-current payables 7,514 5,695 6,447 7,342 4,372 8,795 6,594 7,212 10,135 7,375
23
Financial and Operating Information 2005-2009Group information
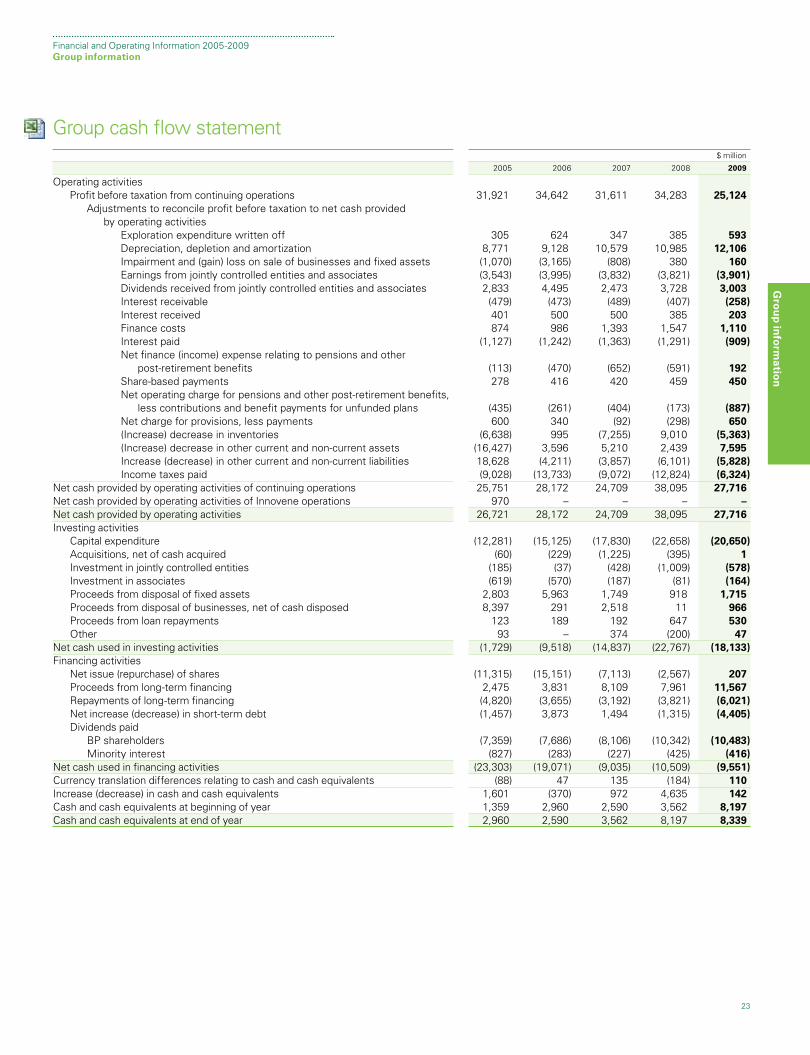
Group cash flow statement $ million
2005 2006 2007 2008 2009
Operating activities Profit before taxation from continuing operations 31,921 34,642 31,611 34,283 25,124 Adjustments to reconcile profit before taxation to net cash provided by operating activities Exploration expenditure written off 305 624 347 385 593 Depreciation, depletion and amortization 8,771 9,128 10,579 10,985 12,106 Impairment and (gain) loss on sale of businesses and fixed assets (1,070) (3,165) (808) 380 160 Earnings from jointly controlled entities and associates (3,543) (3,995) (3,832) (3,821) (3,901) Dividends received from jointly controlled entities and associates 2,833 4,495 2,473 3,728 3,003 Interest receivable (479) (473) (489) (407) (258) Interest received 401 500 500 385 203 Finance costs 874 986 1,393 1,547 1,110 Interest paid (1,127) (1,242) (1,363) (1,291) (909) Net finance (income) expense relating to pensions and other post-retirement benefits (113) (470) (652) (591) 192 Share-based payments 278 416 420 459 450 Net operating charge for pensions and other post-retirement benefits, less contributions and benefit payments for unfunded plans (435) (261) (404) (173) (887) Net charge for provisions, less payments 600 340 (92) (298) 650 (Increase) decrease in inventories (6,638) 995 (7,255) 9,010 (5,363) (Increase) decrease in other current and non-current assets (16,427) 3,596 5,210 2,439 7,595 Increase (decrease) in other current and non-current liabilities 18,628 (4,211) (3,857) (6,101) (5,828) Income taxes paid (9,028) (13,733) (9,072) (12,824) (6,324)Net cash provided by operating activities of continuing operations 25,751 28,172 24,709 38,095 27,716Net cash provided by operating activities of Innovene operations 970 – – – –Net cash provided by operating activities 26,721 28,172 24,709 38,095 27,716Investing activities Capital expenditure (12,281) (15,125) (17,830) (22,658) (20,650) Acquisitions, net of cash acquired (60) (229) (1,225) (395) 1 Investment in jointly controlled entities (185) (37) (428) (1,009) (578) Investment in associates (619) (570) (187) (81) (164) Proceeds from disposal of fixed assets 2,803 5,963 1,749 918 1,715 Proceeds from disposal of businesses, net of cash disposed 8,397 291 2,518 11 966 Proceeds from loan repayments 123 189 192 647 530 Other 93 – 374 (200) 47Net cash used in investing activities (1,729) (9,518) (14,837) (22,767) (18,133)Financing activities Net issue (repurchase) of shares (11,315) (15,151) (7,113) (2,567) 207 Proceeds from long-term financing 2,475 3,831 8,109 7,961 11,567 Repayments of long-term financing (4,820) (3,655) (3,192) (3,821) (6,021) Net increase (decrease) in short-term debt (1,457) 3,873 1,494 (1,315) (4,405) Dividends paid BP shareholders (7,359) (7,686) (8,106) (10,342) (10,483) Minority interest (827) (283) (227) (425) (416)Net cash used in financing activities (23,303) (19,071) (9,035) (10,509) (9,551)Currency translation differences relating to cash and cash equivalents (88) 47 135 (184) 110Increase (decrease) in cash and cash equivalents 1,601 (370) 972 4,635 142Cash and cash equivalents at beginning of year 1,359 2,960 2,590 3,562 8,197Cash and cash equivalents at end of year 2,960 2,590 3,562 8,197 8,339
Gro
up
info
rmatio
n
24
Financial and Operating Information 2005-2009Group information
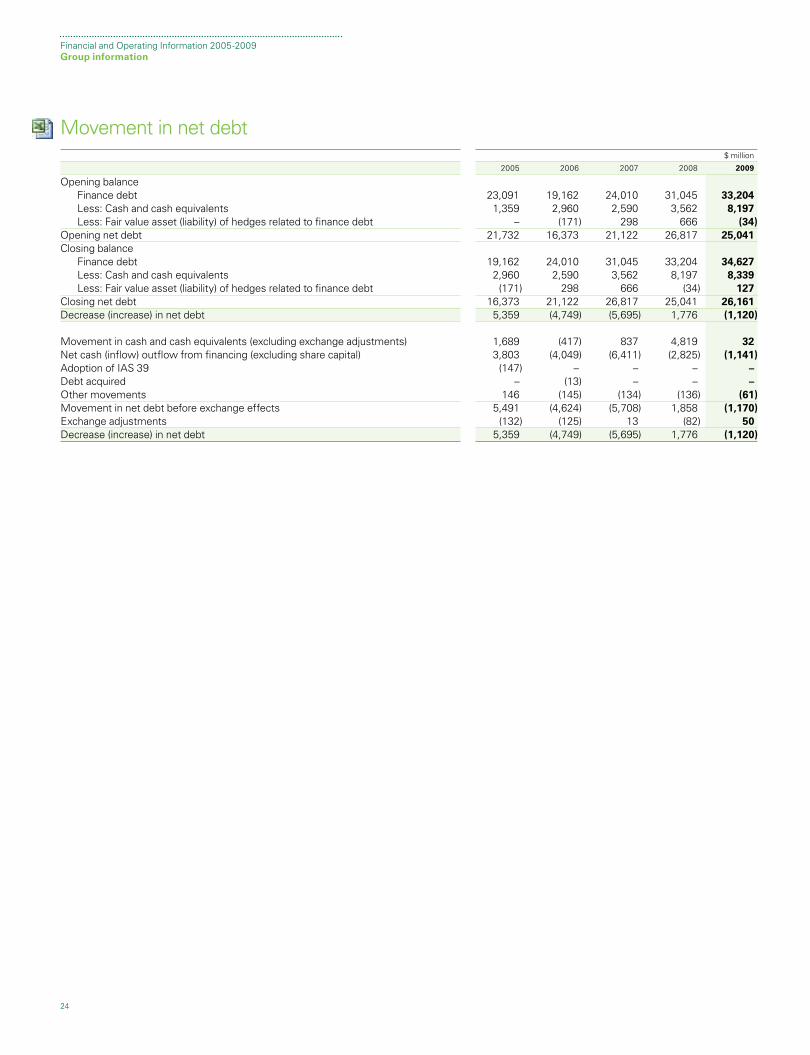
Movement in net debt $ million
2005 2006 2007 2008 2009
Opening balance Finance debt 23,091 19,162 24,010 31,045 33,204 Less: Cash and cash equivalents 1,359 2,960 2,590 3,562 8,197 Less: Fair value asset (liability) of hedges related to finance debt – (171) 298 666 (34)Opening net debt 21,732 16,373 21,122 26,817 25,041 Closing balance Finance debt 19,162 24,010 31,045 33,204 34,627 Less: Cash and cash equivalents 2,960 2,590 3,562 8,197 8,339 Less: Fair value asset (liability) of hedges related to finance debt (171) 298 666 (34) 127 Closing net debt 16,373 21,122 26,817 25,041 26,161 Decrease (increase) in net debt 5,359 (4,749) (5,695) 1,776 (1,120) Movement in cash and cash equivalents (excluding exchange adjustments) 1,689 (417) 837 4,819 32 Net cash (inflow) outflow from financing (excluding share capital) 3,803 (4,049) (6,411) (2,825) (1,141)Adoption of IAS 39 (147) – – – – Debt acquired – (13) – – – Other movements 146 (145) (134) (136) (61)Movement in net debt before exchange effects 5,491 (4,624) (5,708) 1,858 (1,170)Exchange adjustments (132) (125) 13 (82) 50 Decrease (increase) in net debt 5,359 (4,749) (5,695) 1,776 (1,120)
25
Financial and Operating Information 2005-2009Group information
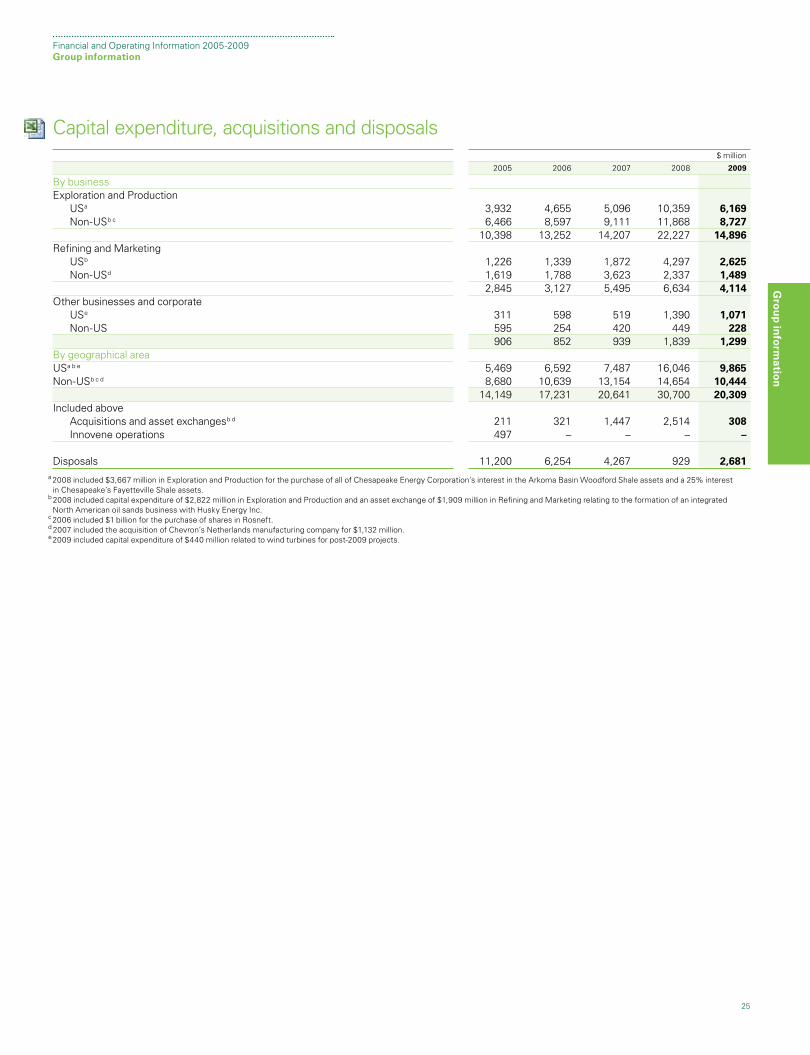
Capital expenditure, acquisitions and disposals $ million
2005 2006 2007 2008 2009
By businessExploration and Production USa 3,932 4,655 5,096 10,359 6,169 Non-USb c 6,466 8,597 9,111 11,868 8,727 10,398 13,252 14,207 22,227 14,896Refining and Marketing USb 1,226 1,339 1,872 4,297 2,625 Non-USd 1,619 1,788 3,623 2,337 1,489 2,845 3,127 5,495 6,634 4,114Other businesses and corporate USe 311 598 519 1,390 1,071 Non-US 595 254 420 449 228 906 852 939 1,839 1,299By geographical areaUSa b e 5,469 6,592 7,487 16,046 9,865Non-USb c d 8,680 10,639 13,154 14,654 10,444 14,149 17,231 20,641 30,700 20,309Included above Acquisitions and asset exchangesb d 211 321 1,447 2,514 308 Innovene operations 497 – – – –
Disposals 11,200 6,254 4,267 929 2,681
a 2 008 included $3,667 million in Exploration and Production for the purchase of all of Chesapeake Energy Corporation’s interest in the Arkoma Basin Woodford Shale assets and a 25% interest in Chesapeake’s Fayetteville Shale assets.
b 2008 included capital expenditure of $2,822 million in Exploration and Production and an asset exchange of $1,909 million in Refining and Marketing relating to the formation of an integrated North American oil sands business with Husky Energy Inc.
c 2 006 included $1 billion for the purchase of shares in Rosneft.d 2007 included the acquisition of Chevron’s Netherlands manufacturing company for $1,132 million.e 2 009 included capital expenditure of $440 million related to wind turbines for post-2009 projects.
Gro
up
info
rmatio
n
26
Financial and Operating Information 2005-2009Group information
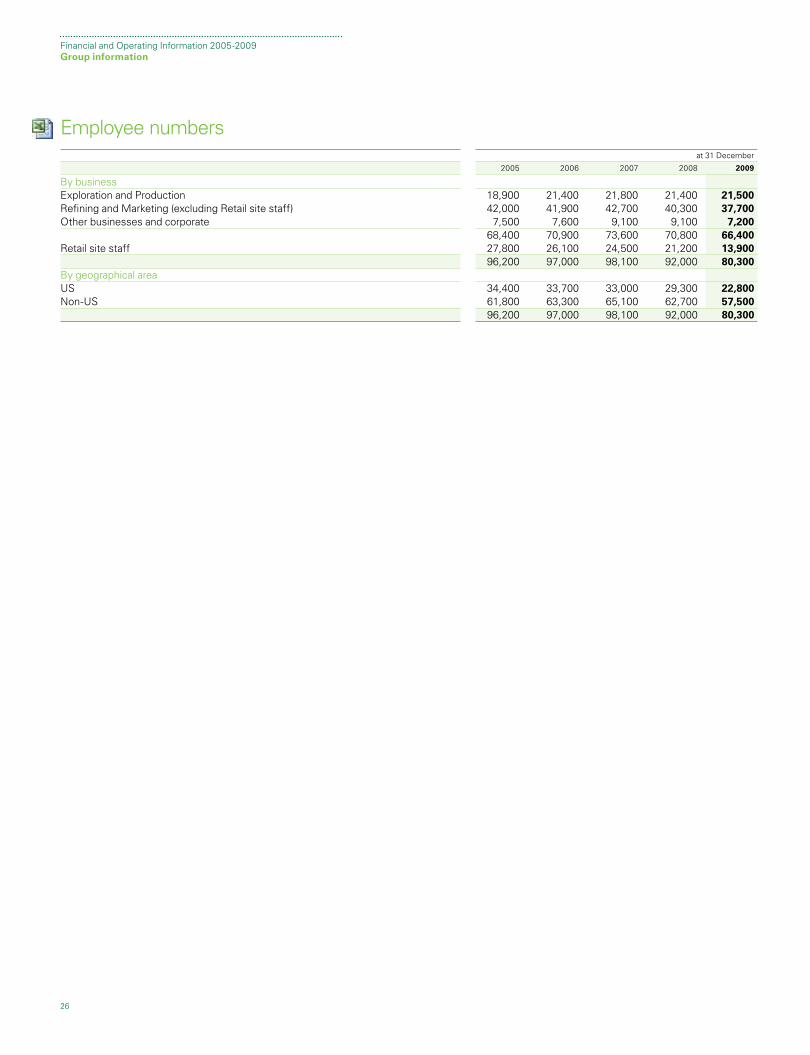
Employee numbers at 31 December
2005 2006 2007 2008 2009
By businessExploration and Production 18,900 21,400 21,800 21,400 21,500 Refining and Marketing (excluding Retail site staff) 42,000 41,900 42,700 40,300 37,700 Other businesses and corporate 7,500 7,600 9,100 9,100 7,200 68,400 70,900 73,600 70,800 66,400 Retail site staff 27,800 26,100 24,500 21,200 13,900 96,200 97,000 98,100 92,000 80,300 By geographical areaUS 34,400 33,700 33,000 29,300 22,800 Non-US 61,800 63,300 65,100 62,700 57,500 96,200 97,000 98,100 92,000 80,300
27
Financial and Operating Information 2005-2009Group information
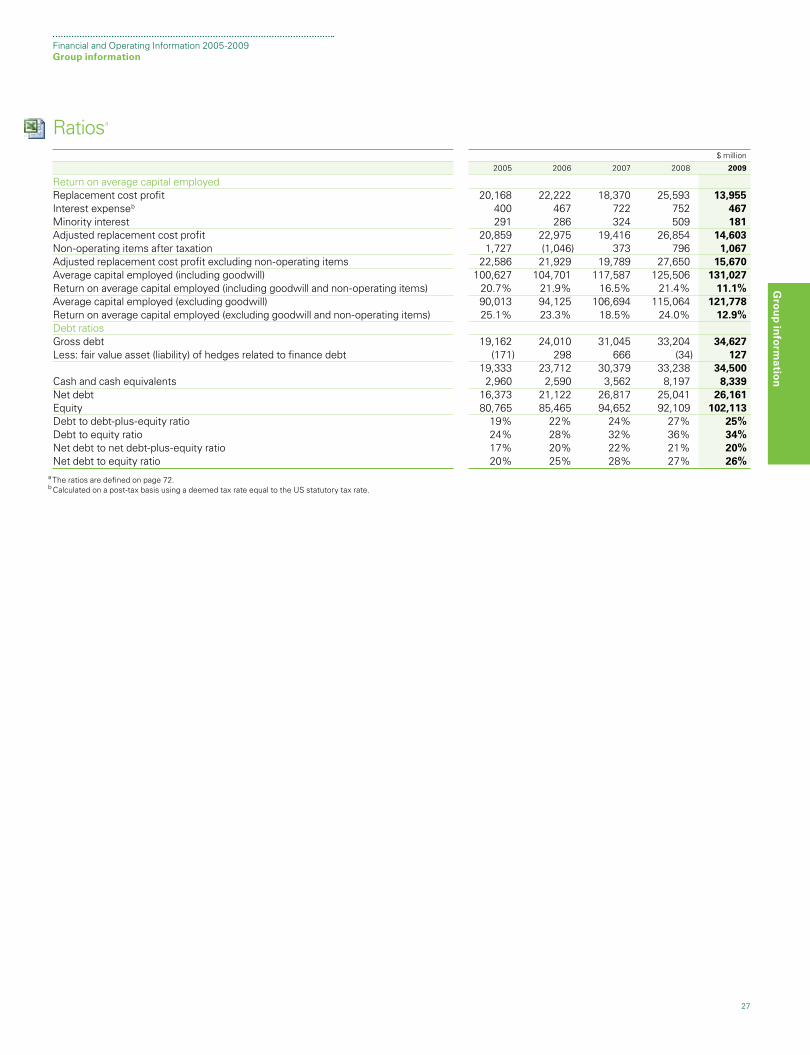
Ratiosa
$ million
2005 2006 2007 2008 2009
Return on average capital employedReplacement cost profit 20,168 22,222 18,370 25,593 13,955Interest expenseb 400 467 722 752 467Minority interest 291 286 324 509 181Adjusted replacement cost profit 20,859 22,975 19,416 26,854 14,603Non-operating items after taxation 1,727 (1,046) 373 796 1,067Adjusted replacement cost profit excluding non-operating items 22,586 21,929 19,789 27,650 15,670Average capital employed (including goodwill) 100,627 104,701 117,587 125,506 131,027Return on average capital employed (including goodwill and non-operating items) 20.7% 21.9% 16.5% 21.4% 11.1%Average capital employed (excluding goodwill) 90,013 94,125 106,694 115,064 121,778Return on average capital employed (excluding goodwill and non-operating items) 25.1% 23.3% 18.5% 24.0% 12.9%Debt ratiosGross debt 19,162 24,010 31,045 33,204 34,627Less: fair value asset (liability) of hedges related to finance debt (171) 298 666 (34) 127 19,333 23,712 30,379 33,238 34,500Cash and cash equivalents 2,960 2,590 3,562 8,197 8,339Net debt 16,373 21,122 26,817 25,041 26,161Equity 80,765 85,465 94,652 92,109 102,113Debt to debt-plus-equity ratio 19% 22% 24% 27% 25%Debt to equity ratio 24% 28% 32% 36% 34%Net debt to net debt-plus-equity ratio 17% 20% 22% 21% 20%Net debt to equity ratio 20% 25% 28% 27% 26%
a T he ratios are defined on page 72.b Calculated on a post-tax basis using a deemed tax rate equal to the US statutory tax rate.
Gro
up
info
rmatio
n

28
Financial and Operating Information 2005-2009Group information
BP shareholding informationRegister of members holding BP ordinary shares as at 31 December 2009 Percentage Percentage Number of of total of total ordinary ordinary ordinary share- share- Range of holdings holders holders capital
1–200 57,927 18.43 0.02 201–1,000 116,624 37.11 0.30 1,001–10,000 126,034 40.10 1.83 10,001–100,000 11,867 3.77 1.17 100,001–1,000,000 1,065 0.34 1.85 Over 1,000,000a 777 0.25 94.83 Totals 314,294 100.00 100.00
a I ncludes JPMorgan Chase Bank holding 27.74% of the total ordinary issued share capital (excluding shares held in treasury) as the approved depositary for ADSs, a breakdown of which is shown in the table below.
Register of holders of American depositary shares (ADSs) as at 31 December 2009a Percentage Number of total Percentage of ADS ADS of total Range of holdings holders holders ADSs
1–200 72,272 54.22 0.48 201–1,000 37,695 28.28 2.08 1,001–10,000 21,893 16.42 6.80 10,001–100,000 1,417 1.06 2.81 100,001–1,000,000 22 0.02 0.43 Over 1,000,000b 1 0.00 87.40 Totals 133,300 100.00 100.00
a O ne ADS represents six 25-cent ordinary shares.b One of the holders of ADSs represents some 698,373 underlying shareholders.
As at 31 December 2009, there were also 1,660 preference shareholders.
Beneficial owners as at 31 December 2009a b
Percentage of shares in issue
By principal area Institutions Individuals Total
UK 33 7 40 US 25 14 39 Rest of Europe 10 – 10 Rest of World 7 – 7 Miscellaneousc 4 – 4 79 21 100
a R eflects the beneficial (underlying) ownership of the shares.b Represents BP’s best efforts to determine the domicile of the beneficial (underlying) owners of the group’s shares, based on analysis of the year-end share register. Note that institutions include
custodians, market makers, delivery by value, brokerage, stocklending, clearing and non-American depositary receipt arbitrage. c M iscellaneous represents shareholders below the 100,000-share threshold and unidentified shares. Unidentified shares represent holdings that are awaiting confirmation of the identity of the
beneficial holder and the nature of their interest in the shares following enquiries made under Section 793 of the Companies Act 2006.
share
29
Financial and Operating Information 2005-2009Group information
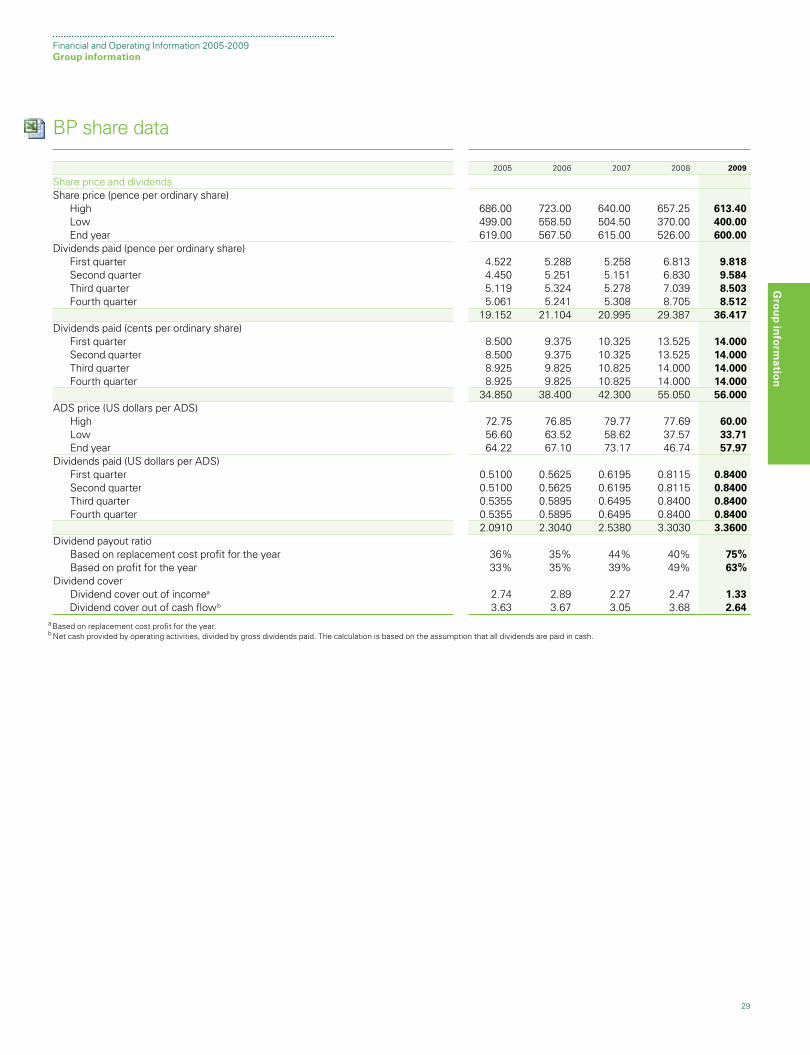
BP share data
2005 2006 2007 2008 2009
Share price and dividendsShare price (pence per ordinary share) High 686.00 723.00 640.00 657.25 613.40 Low 499.00 558.50 504.50 370.00 400.00 End year 619.00 567.50 615.00 526.00 600.00Dividends paid (pence per ordinary share) First quarter 4.522 5.288 5.258 6.813 9.818 Second quarter 4.450 5.251 5.151 6.830 9.584 Third quarter 5.119 5.324 5.278 7.039 8.503 Fourth quarter 5.061 5.241 5.308 8.705 8.512 19.152 21.104 20.995 29.387 36.417Dividends paid (cents per ordinary share) First quarter 8.500 9.375 10.325 13.525 14.000 Second quarter 8.500 9.375 10.325 13.525 14.000 Third quarter 8.925 9.825 10.825 14.000 14.000 Fourth quarter 8.925 9.825 10.825 14.000 14.000 34.850 38.400 42.300 55.050 56.000ADS price (US dollars per ADS) High 72.75 76.85 79.77 77.69 60.00 Low 56.60 63.52 58.62 37.57 33.71 End year 64.22 67.10 73.17 46.74 57.97 Dividends paid (US dollars per ADS) First quarter 0.5100 0.5625 0.6195 0.8115 0.8400 Second quarter 0.5100 0.5625 0.6195 0.8115 0.8400 Third quarter 0.5355 0.5895 0.6495 0.8400 0.8400 Fourth quarter 0.5355 0.5895 0.6495 0.8400 0.8400 2.0910 2.3040 2.5380 3.3030 3.3600 Dividend payout ratio Based on replacement cost profit for the year 36% 35% 44% 40% 75% Based on profit for the year 33% 35% 39% 49% 63%Dividend cover Dividend cover out of incomea 2.74 2.89 2.27 2.47 1.33 Dividend cover out of cash flowb 3.63 3.67 3.05 3.68 2.64
a B ased on replacement cost profit for the year. b Net cash provided by operating activities, divided by gross dividends paid. The calculation is based on the assumption that all dividends are paid in cash.
Gro
up
info
rmatio
n
30
Financial and Operating Information 2005-2009Group information
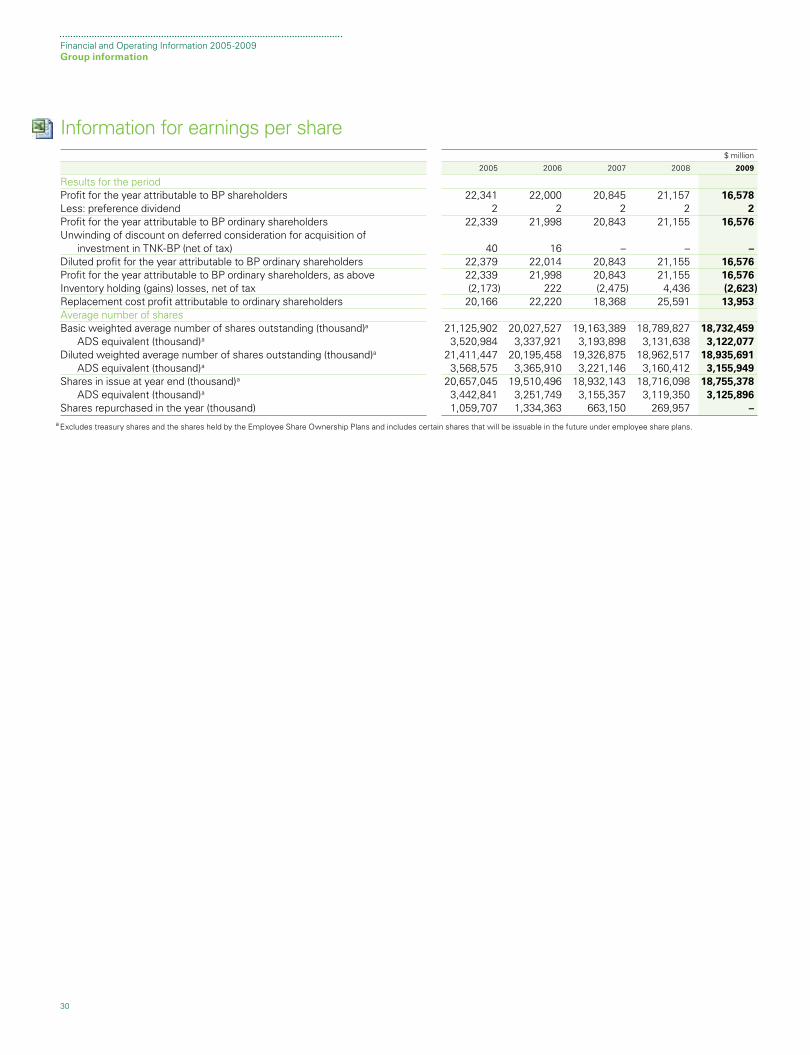
Information for earnings per share $ million
2005 2006 2007 2008 2009
Results for the periodProfit for the year attributable to BP shareholders 22,341 22,000 20,845 21,157 16,578 Less: preference dividend 2 2 2 2 2 Profit for the year attributable to BP ordinary shareholders 22,339 21,998 20,843 21,155 16,576 Unwinding of discount on deferred consideration for acquisition of investment in TNK-BP (net of tax) 40 16 – – – Diluted profit for the year attributable to BP ordinary shareholders 22,379 22,014 20,843 21,155 16,576 Profit for the year attributable to BP ordinary shareholders, as above 22,339 21,998 20,843 21,155 16,576 Inventory holding (gains) losses, net of tax (2,173) 222 (2,475) 4,436 (2,623)Replacement cost profit attributable to ordinary shareholders 20,166 22,220 18,368 25,591 13,953 Average number of sharesBasic weighted average number of shares outstanding (thousand)a 21,125,902 20,027,527 19,163,389 18,789,827 18,732,459 ADS equivalent (thousand)a 3,520,984 3,337,921 3,193,898 3,131,638 3,122,077 Diluted weighted average number of shares outstanding (thousand)a 21,411,447 20,195,458 19,326,875 18,962,517 18,935,691 ADS equivalent (thousand)a 3,568,575 3,365,910 3,221,146 3,160,412 3,155,949 Shares in issue at year end (thousand)a 20,657,045 19,510,496 18,932,143 18,716,098 18,755,378 ADS equivalent (thousand)a 3,442,841 3,251,749 3,155,357 3,119,350 3,125,896Shares repurchased in the year (thousand) 1,059,707 1,334,363 663,150 269,957 –
a E xcludes treasury shares and the shares held by the Employee Share Ownership Plans and includes certain shares that will be issuable in the future under employee share plans.