Embed Size (px)
Citation preview
Group Presentation 6M/Q2 2018 August 10, 2018
Construction site of BAUER Spezialtiefbau GmbH, Germany
© BAUER AG, D-86529 Schrobenhausen 18-08-10 IR-Presentation_Q2_2018 2
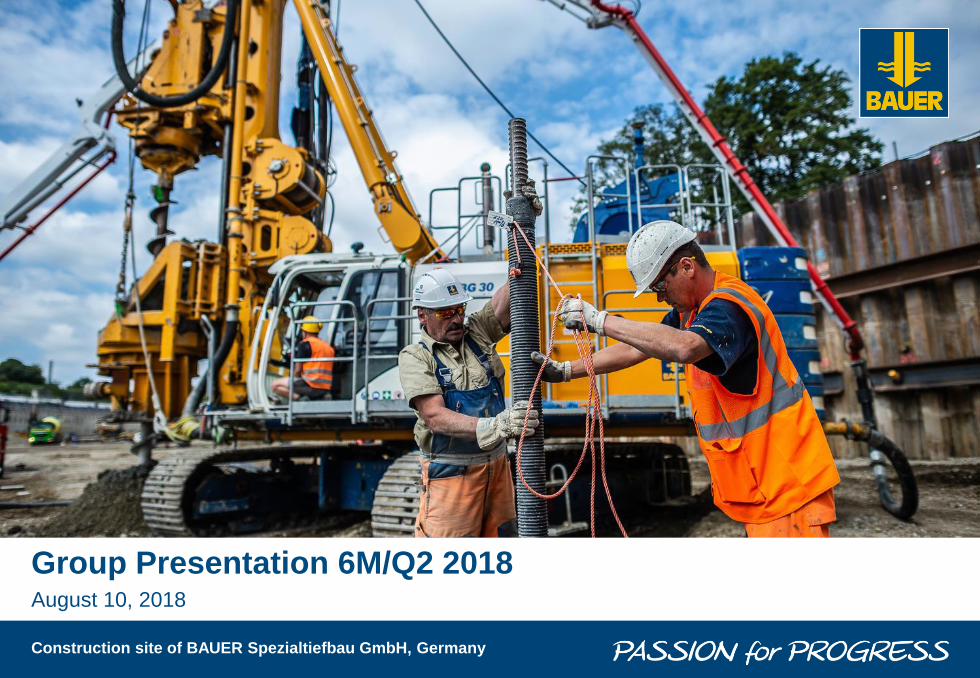
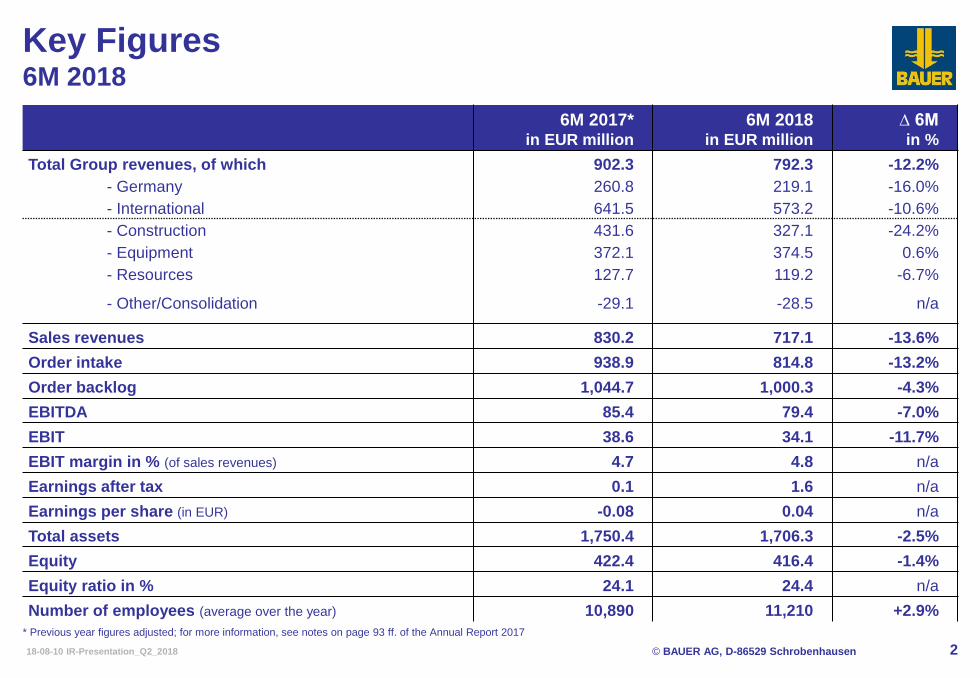
Key Figures 6M 2018
6M 2017* in EUR million
6M 2018 in EUR million
∆ 6M in %
Total Group revenues, of which
- Germany
- International
- Construction
- Equipment
- Resources
- Other/Consolidation
902.3
260.8
641.5
431.6
372.1
127.7
-29.1
792.3
219.1
573.2
327.1
374.5
119.2
-28.5
-12.2%
-16.0%
-10.6%
-24.2%
0.6%
-6.7%
n/a
Sales revenues 830.2 717.1 -13.6%
Order intake 938.9 814.8 -13.2%
Order backlog 1,044.7 1,000.3 -4.3%
EBITDA 85.4 79.4 -7.0%
EBIT 38.6 34.1 -11.7%
EBIT margin in % (of sales revenues) 4.7 4.8 n/a
Earnings after tax 0.1 1.6 n/a
Earnings per share (in EUR) -0.08 0.04 n/a
Total assets 1,750.4 1,706.3 -2.5%
Equity 422.4 416.4 -1.4%
Equity ratio in % 24.1 24.4 n/a
Number of employees (average over the year) 10,890 11,210 +2.9%
* Previous year figures adjusted; for more information, see notes on page 93 ff. of the Annual Report 2017

© BAUER AG, D-86529 Schrobenhausen 18-08-10 IR-Presentation_Q2_2018 3
Total Group revenues decreased by 12.2% to EUR 792.3 million
(6M 2017: EUR 902.3 million).
Sales revenues decreased by 13.6% to EUR 717.1 million
(6M 2017: EUR 830.2 million).
The financial year in the Equipment segment remains positive, the
Construction segment performed below the exceptionally strong start of
the previous year as expected. The Resources segment was able to again
increase revenues in the second quarter.
EBIT decreased from EUR 38.6 million to EUR 34.1 million.
Earnings after tax were EUR 1.6 million (6M 2017: EUR 0.1 million).
Negative effects of currency fluctuations were significantly smaller than
the previous year, which correspondingly improved the financial result.
Order backlog of the Group decreased by 4.3% to EUR 1,000.3 million
(6M 2017: EUR 1,044.7 million). Order intake decreased by 13.2% to
EUR 814.8 million (6M 2017: EUR 938.9 million).
Total assets declined by 2.5% to EUR 1,706.3 million (6M 2017:
EUR 1,750.4 million). Net debt decreased by 4.8% to EUR 677.8 million
(Q1 2017: EUR 712.0 million).
Forecast 2018: total Group revenues of around EUR 1.8 billion, EBIT of
about EUR 90 million and significantly higher earnings after tax.
Highlights 6M 2018 – BAUER Group
BAUER MC 96 with BC 40 cutter system
© BAUER AG, D-86529 Schrobenhausen 18-08-10 IR-Presentation_Q2_2018 4
Table of Content
BAUER Group – Strategy, Chances & Markets
Appendix
Financials 6M/Q2 2018 & Guidance

© BAUER AG, D-86529 Schrobenhausen 18-08-10 IR-Presentation_Q2_2018 5
The BAUER Group is a leading provider of services, equipment &
products dealing with ground and groundwater.
Mission
Strategy
The world is our market.
Global network organization with flexible, decentralized management.
Three forward-looking segments providing high level of synergies:
Construction, Equipment, Resources
World market leadership for foundation technology.
Powerful development of drilling applications and services
for related markets.
Highly innovative products and services related to water, environment
and natural resources.
Diaphragm wall for excavation pit – Germany
BAUER Group Mission & Strategy
EUR 1.8 billion total Group revenues
EUR 89.6 million EBIT
5.4% EBIT margin
25.9% equity ratio
10,913
employees FY 2017
Key targets
Revenue growth: 3 - 8% per year
EBIT margin: 7 - 9%
Equity ratio: > 30%
© BAUER AG, D-86529 Schrobenhausen 18-08-10 IR-Presentation_Q2_2018 6
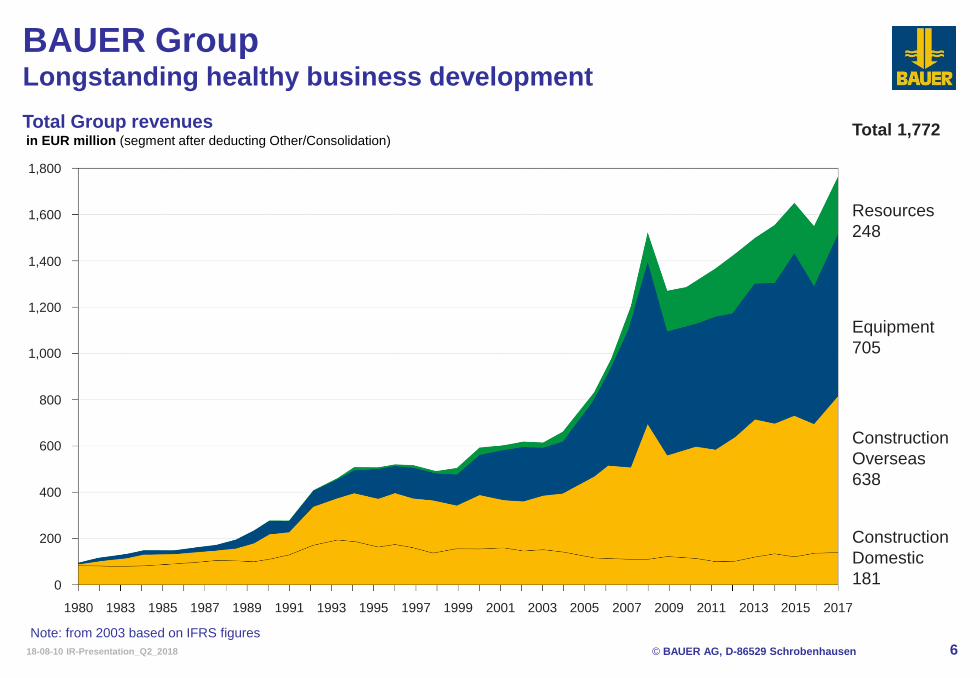
Note: from 2003 based on IFRS figures
BAUER Group Longstanding healthy business development
Total Group revenues in EUR million (segment after deducting Other/Consolidation)
1,600
Equipment
705
Construction
Overseas
638
Total 1,772
Construction
Domestic
181
1,000
1,400
800
600
200
0
1980 1983 1985 1987 1997 1999 2001 2003 2005 2007
Resources
248
1991 1989 1993 1995 2009 2011 2013 2015
1,200
400
1,800
2017

© BAUER AG, D-86529 Schrobenhausen 18-08-10 IR-Presentation_Q2_2018
835
1,033
1,291
1,097 1,132 1,220
1,344 1,402 1,376 1,379 1,397
1,668
0
300
600
900
1,200
1,500
1,800
2006 2007 2008 2009 2010 2011 2012 2013 2014 2015 2016 2017
980
1,208
1,527
1,278 1,304 1,372 1,436 1,504 1,560 1,656
1,555
1,772
0
300
600
900
1,200
1,500
1,800
2,100
2006 2007 2008 2009 2010 2011 2012 2013 2014 2015 2016 2017
Sales revenues in EUR million
Total Group revenues in EUR million
7
CAGR
5.5%
BAUER Group Longstanding healthy business development
CAGR
6.5%

© BAUER AG, D-86529 Schrobenhausen 18-08-10 IR-Presentation_Q2_2018 8
Worldwide network More than 110 subsidiaries in about 70 countries
Schrobenhausen
Kuala Lumpur Tianjin
Permanent Offices:
Construction
Equipment sales
Resources
Equipment production
Conroe

© BAUER AG, D-86529 Schrobenhausen 18-08-10 IR-Presentation_Q2_2018 9
BAUER Group Chances
Construction Equipment Resources
Growth potential in new markets
and with specialized machines.
Strong position as a lot of efforts
were made regarding quality,
efficiency and noise reduction
Manufacture of customized deep
drilling solutions in the joint
venture with Schlumberger.
Powerful duty-cycle crane series,
which entered new markets.
Innovative offshore equipment for
the foundation of wind farms and
tidal turbines.
Growing construction markets
worldwide.
Huge pent-up demand in
developed countries and in
emerging markets.
Specialist foundation grows
somewhat stronger than
construction markets.
Construction segment with
considerable number of major
projects currently under
construction and tendered for
worldwide.
Full-service provider for products
and solutions related to water.
Ground-breaking projects in the
field of cleaning drinking and
process water, e.g. a biological
water treatment plant in Oman.
Promising opportunities due to
its focus on growth markets
water, environment and natural
resources.
High expertise in exploration and
mining services for natural
resources.

© BAUER AG, D-86529 Schrobenhausen 18-08-10 IR-Presentation_Q2_2018 10
World construction markets Bauer market potential
USA / Canada:
big need for infrastructure
investments; individual
large projects in USA
+
Other Americas:
several chances in
Central America
Africa:
little construction
activities; some special
projects; demand for
water and resources is
slightly better
o
Far East:
positive development in
most markets, especially
China, Malaysia, Indonesia
and Philippines;
+
Western Europe:
recovery in most
of the markets
+
Germany:
good market;
infrastructure
budget raised
++ Eastern Europe:
slow positive
development
Russia:
still remains weak
Middle East:
ongoing uncertainty as a result
of oil price; Qatar uncertain
Central Asia:
good market potentials;
small upswing in India
+
-- weak - slightly weak o stable + growing ++ strong growth
o -
-
Last update: August 2018
o

© BAUER AG, D-86529 Schrobenhausen 18-08-10 IR-Presentation_Q2_2018
2017 2018
Global economic situation IMF projection of the real annual GDP growth in %
Source: International Monetary Fund, World Economic Outlook Database, April 2018 * CIS = Commonwealth of Independent States (incl. Georgia; excl. Russia)
United States
Brazil
CIS*
Germany
Middle East &
North Africa
Sub-Saharan Africa
World Advanced
Economies
Emerging Markets &
Develop. Economies
Russia
Australia
Developing Asia
Latin America
Europe
China
11
2018 2019
2018 2019 2018 2019 2018 2019
2018 2019
2018 2019
2018 2019
2018 2019
2.5 2.2 3.9 3.9
2018 2019 4.9 5.1
2.0 2.8
2.2 2.1 2018 2019
6.5 6.6
1.7 1.5
6.6 6.4
3.0 3.1
2018 2019
2.9 2.7
2.3 2.5
2018 2019
2018 2019 2.4 2.0
2.5 2.0
2018 2019
3.4 3.7 2018 2019
3.2 3.6

© BAUER AG, D-86529 Schrobenhausen 18-08-10 IR-Presentation_Q2_2018 12
Africa 63 (3 %)
Americas 228 (13 %)
Asia-Pacific,
Far East & Australia
426 (24 %)
Middle East
& Central Asia 201 (11 %)
Germany 478 (27 %)
EU excl. Germany
258 (15 %)
Europe (other)
118 (7 %)
Africa 30 (4 %)
Americas 74 (9 %)
Asia-Pacific,
Far East & Australia
233 (30 %)
Middle East
& Central Asia 51 (6 %)
Germany 219 (28 %)
EU excl. Germany 128 (16 %)
Europe (other)
57 (7 %)
Regional breakdown Total Group revenues 6M 2018 – Group
Total 792 in EUR million
Total 1,772
in EUR million
Full year 2017
© BAUER AG, D-86529 Schrobenhausen 18-08-10 IR-Presentation_Q2_2018 13
Africa 23 (7 %)
Americas 19 (6 %)
Asia-Pacific,
Far East
& Australia
109 (34 %)
Middle East
& Central Asia 23 (7 %)
Germany 91 (29 %)
EU excl. Germany
45 (14 %)
Europe
(other)
9 (3 %)
Africa 2 (1 %)
Americas 51 (14 %)
Asia-Pacific,
Far East & Australia
124 (35 %)
Middle East
& Central Asia 12 (3 %)
Germany 62 (18 %)
EU excl.
Germany
74 (21 %)
Europe
(other)
29 (8 %)
Africa 5 (4 %)
Americas 4 (3 %)
Asia-Pacific,
Far East & Australia 0 (0 %)
Middle East & Central Asia
16 (13 %)
Germany 66 (56 %)
EU excl.
Germany
9 (8 %)
Europe (other)
19 (16 %)
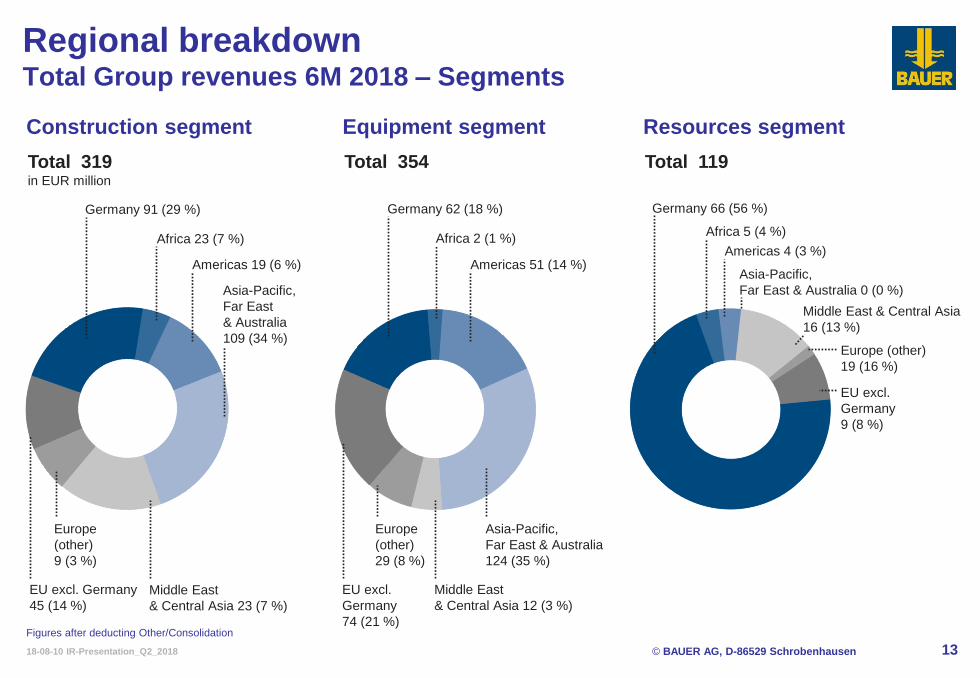
Regional breakdown Total Group revenues 6M 2018 – Segments
Total 319 in EUR million
Total 354 Total 119
Construction segment Equipment segment Resources segment
Figures after deducting Other/Consolidation

© BAUER AG, D-86529 Schrobenhausen 18-08-10 IR-Presentation_Q2_2018 14
Table of Content
BAUER Group – Strategy, Chances & Markets
Appendix
Financials 6M/Q2 2018 & Guidance

© BAUER AG, D-86529 Schrobenhausen 18-08-10 IR-Presentation_Q2_2018
996 1,008 978 1,045
1,000
0
300
600
900
1,200
2015 2016 2017 6M 2017 6M 2018
494 379 484 429
405381
454386
550
396
409
362
411
394
2015 2016 2017 2018
90.7
70.3
89.6
38.6 34.129.0
14.4
3.7 0.1 1.60
20
40
60
80
100
2015 2016 2017 6M 2017 6M 2018
1,6561,555
1,772
902792
1,379 1,397
1,668
830717
0
400
800
1,200
1,600
2,000
2015 2016 2017 6M 2017 6M 2018
15
Q1
Q2
Q3
Q4
Financials Revenues, earnings & orders – Group
Revenues
Earnings
Order backlog
Order intake
in EUR million
in EUR million in EUR million
in EUR million Total Group revenues Sales revenues
EBIT Earnings after tax
1,811
1,567
-4.3%
-13.2%
-11.7%
∆ 6M 1,741
-12.2%
-13.6%
∆ 6M

© BAUER AG, D-86529 Schrobenhausen 18-08-10 IR-Presentation_Q2_2018
221176
432
327
526 50712.4
2.1
13.3
4.8
Financials Construction segment – Highlights 6M 2018
Construction
Global provider for specialist
foundation engineering services
Focus on complex, international
projects
~ 50/50 infrastructure / industrial Total Group revenues in EUR million
Order backlog in EUR million
EBIT in EUR million
Total Group revenues were EUR 327.1 million, down 24.2% (previous year:
EUR 431.6 million). 6M 2017 figures were at an unusually high level. This decline in
revenues this year is due to a weaker utilization in Germany and postponement of
large projects in the Middle East and other individual projects.
EBIT decreased from EUR 13.4 million to EUR 4.8 million. Earnings after tax lies at
EUR -4.1 million, which is the same as the EUR -4.2 million in 2017, since the
negative effects of currency fluctuations were significantly smaller than last year.
Order backlog fell to EUR 507.2 million (previous year: EUR 526.4 million) due to
lower order intake, which totaled EUR 341.6 million and was 8.3% below the
previous year's figure of EUR 372.7 million. The order book lasts for 7.3 months.
We expect revenues to catch up in the coming half year, with a corresponding
development of earnings. This is based on the order backlog in Germany, England
and the Far East, and additional project opportunities.
16
-24.2% -3.6%
2017 2018 2017 2018 2017 2018
Full year 2017:
46% of total Group revenues
EBIT margin: 2.5%
Key targets:
~ 40% of total Group revenues (TGR)
EBIT margin: 4 - 6%
Key figures to be considered:
TGR, order backlog, EBIT
6M
Q2
-64.4%

© BAUER AG, D-86529 Schrobenhausen 18-08-10 IR-Presentation_Q2_2018
153
193 197 199178 177
187 183193
176195
178156
171185
201211 221 227
177
151
176
0
50
100
150
200
250
Q1/13 Q2/13 Q3/13 Q4/13 Q1/14 Q2/14 Q3/14 Q4/14 Q1/15 Q2/15 Q3/15 Q4/15 Q1/16 Q2/16 Q3/16 Q4/16 Q1/17 Q2/17 Q3/17 Q4/17 Q1/18 Q2/18
513 531498 499
436477 472 455
513551 584 591 585 575 578 585 578
526 516 493 511 507
0
125
250
375
500
625
Q1/13 Q2/13 Q3/13 Q4/13 Q1/14 Q2/14 Q3/14 Q4/14 Q1/15 Q2/15 Q3/15 Q4/15 Q1/16 Q2/16 Q3/16 Q4/16 Q1/17 Q2/17 Q3/17 Q4/17 Q1/18 Q2/18
Financials Construction segment – Revenues and order development
Order backlog in EUR million
Total Group revenues in EUR million
Construction
17
-20.1%
-3.6%

© BAUER AG, D-86529 Schrobenhausen 18-08-10 IR-Presentation_Q2_2018
186 174
312 302 430397
16.0
22.223.9
36.3
Financials Equipment segment – Highlights 6M 2018
Market leader in specialist
foundation equipment
New products for mining, deep
drilling and offshore drilling
About 80% of sales abroad Sales revenues in EUR million
Order intake in EUR million
EBIT in EUR million
Equipment
Total Group revenues with EUR 374.5 million increased by 0.6% against the
previous year (EUR 372.1 million). Sales revenues decreased slightly by 3.2% from
EUR 312.3 million to EUR 302.2 million. It has to be considered, that in 2017 the
exceptional sale of two deep drilling rigs was included in this figure. In 2018, the
sales of special foundation equipment increased well.
EBIT increased significantly from EUR 23.9 million to EUR 36.3 million. Earnings
after tax improved considerably from EUR 6.6 million to EUR 16.1 million. This is
attributable to high sales levels and continued good delivery figures for equipment.
Once again, the segment benefited from continued growth in global construction
markets.
Order intake decreased by 14.9% from EUR 429.7 million to EUR 396.7 million and
order backlog from EUR 201.7 million to EUR 171.6 million.
18
-3.2% -7.7% Full year 2017:
40% of total Group revenues
EBIT margin: 12.2%
Key targets:
~ 40% of total Group revenues
EBIT margin: 10 - 12%
Key figures to be considered:
Sales revenues, order intake, EBIT 2017 2018 2017 2018 2017 2018
6M
Q2 +51.8%

© BAUER AG, D-86529 Schrobenhausen 18-08-10 IR-Presentation_Q2_2018
104125 128
205
103115
143
171
100
137 129
181
108 115 123
197
127
186169
180
129
174
0
50
100
150
200
250
Q1/13 Q2/13 Q3/13 Q4/13 Q1/14 Q2/14 Q3/14 Q4/14 Q1/15 Q2/15 Q3/15 Q4/15 Q1/16 Q2/16 Q3/16 Q4/16 Q1/17 Q2/17 Q3/17 Q4/17 Q1/18 Q2/18
165185
154
127
165 163187
162177
155166
152 161 159 160171
212 218
148
182
227
170
0
50
100
150
200
250
Q1/13 Q2/13 Q3/13 Q4/13 Q1/14 Q2/14 Q3/14 Q4/14 Q1/15 Q2/15 Q3/15 Q4/15 Q1/16 Q2/16 Q3/16 Q4/16 Q1/17 Q2/17 Q3/17 Q4/17 Q1/18 Q2/18
Financials Equipment segment – Revenues and order development
Order intake in EUR million
Sales revenues in EUR million
Equipment
19
-6.5%
-19.6%
© BAUER AG, D-86529 Schrobenhausen 18-08-10 IR-Presentation_Q2_2018
186163 159
133 130
162
0
50
100
150
200
2012 2013 2014 2015 2016 2017
521562 545 548
543
661
0
175
350
525
700
2012 2013 2014 2015 2016 2017
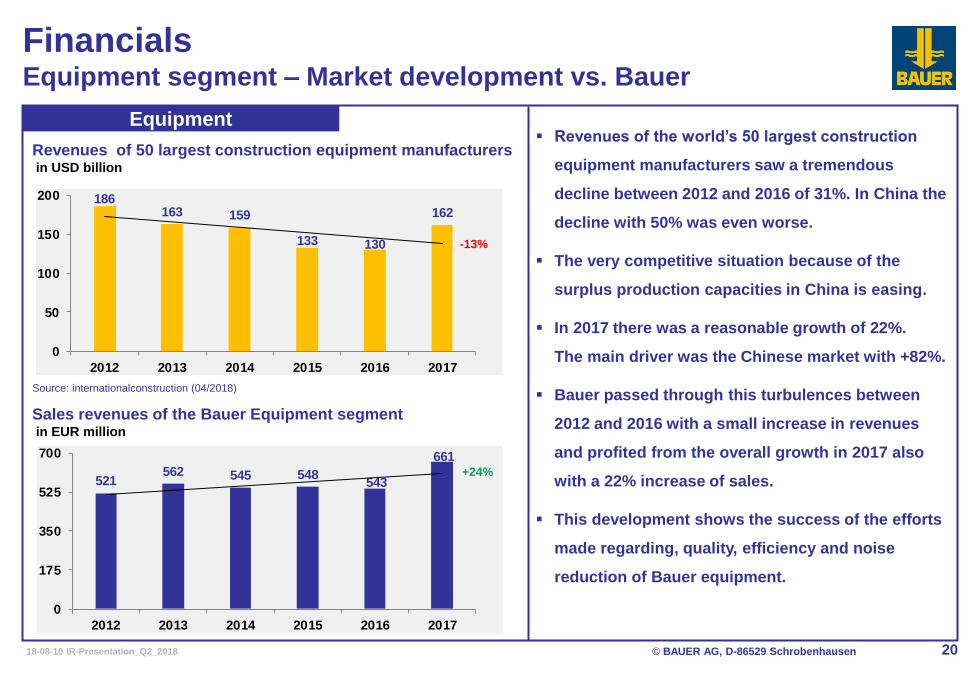
Financials Equipment segment – Market development vs. Bauer
Sales revenues of the Bauer Equipment segment in EUR million
Revenues of 50 largest construction equipment manufacturers in USD billion
Equipment
Source: internationalconstruction (04/2018)
Revenues of the world’s 50 largest construction
equipment manufacturers saw a tremendous
decline between 2012 and 2016 of 31%. In China the
decline with 50% was even worse.
The very competitive situation because of the
surplus production capacities in China is easing.
In 2017 there was a reasonable growth of 22%.
The main driver was the Chinese market with +82%.
Bauer passed through this turbulences between
2012 and 2016 with a small increase in revenues
and profited from the overall growth in 2017 also
with a 22% increase of sales.
This development shows the success of the efforts
made regarding, quality, efficiency and noise
reduction of Bauer equipment.
20
-13%
+24%

© BAUER AG, D-86529 Schrobenhausen 18-08-10 IR-Presentation_Q2_2018
65 68
128119 317 321
0.9
-1.0
0.8
-6.7
Financials Resources segment – Highlights 6M 2018
Products & services related to water,
environment and natural resources.
Competence areas: water treatment,
environmental remediation, waste
management, drilling technologies
and constructed wetlands
Total Group revenues in EUR million
Order backlog in EUR million
EBIT in EUR million
Resources
Total Group revenues decreased by 6.7% to EUR 119.2 million against the previous
year of EUR 127.7 million.
EBIT decreased from EUR -0.8 million to EUR -6.7 million and earnings after tax
from EUR -4.0 million to EUR -9.2 million.
The Resources segment remains in a reorganization phase, which we are
continuing to drive onward actively. The environmental and water treatment
businesses are working with positive results. Our subsidiary in Jordan, whose
drilling capacity is not been exhausted, continues to have the main negative
impact.
Order backlog was 1.5% up to EUR 321.5 million, mainly due to the large project for
the expansion of the reed bed treatment plant in Oman. With EUR 104.9 million,
order intake was significantly lower than in the previous year (EUR 165.6 million).
The order book lasts for 15.5 months.
21
-6.7% +1.5% Full year 2017:
14% of total Group revenues
EBIT margin: n/a
Key targets:
~ 20% of total Group revenues (TGR)
EBIT margin: 6 - 8%
Key figures to be considered:
TGR, order backlog, EBIT 2017 2018 2017 2018 2017 2018
6M
Q2

© BAUER AG, D-86529 Schrobenhausen 18-08-10 IR-Presentation_Q2_2018
39
55 53
4248
5360
92
5448
75
44
7167 66
5763 65 65
55 52
68
0
20
40
60
80
100
Q1/13 Q2/13 Q3/13 Q4/13 Q1/14 Q2/14 Q3/14 Q4/14 Q1/15 Q2/15 Q3/15 Q4/15 Q1/16 Q2/16 Q3/16 Q4/16 Q1/17 Q2/17 Q3/17 Q4/17 Q1/18 Q2/18
165183 177
150173 169 172
153173 174
274 276 287 294 290 279297
317 308336 330 321
0
75
150
225
300
375
Q1/13 Q2/13 Q3/13 Q4/13 Q1/14 Q2/14 Q3/14 Q4/14 Q1/15 Q2/15 Q3/15 Q4/15 Q1/16 Q2/16 Q3/16 Q4/16 Q1/17 Q2/17 Q3/17 Q4/17 Q1/18 Q2/18
Financials Resources segment – Revenues and order development
Order backlog in EUR million
Total Group revenues in EUR million
Resources
22
+4.5%
+1.5%

© BAUER AG, D-86529 Schrobenhausen 18-08-10 IR-Presentation_Q2_2018
1,436 1,504 1,560 1,656 1,555
1,772
611 672 646 665 677 594
0
360
720
1,080
1,440
1,800
2012 2013 2014 2015 2016 2017
580 605 604 629 608 549
611 672 646 665 677
594
0
150
300
450
600
750
2012 2013 2014 2015 2016 2017
23
Financials Working capital & net debt – requirements and development
Total Group revenues / net debt in EUR million
Net debt Working capital
Net debt Total Group revenues
Bauer’s business model requires considerably more
working capital than other construction companies.
Current development:
- Net debt fell very sharply by 12.3% to EUR 593.7
million (FY 2017). Inventories, finished goods and
receivables were significantly reduced thanks to
additional sales growth as well as our own measures.
Construction segment:
- Construction contracts with short duration need
approx. 2 - 3 months pre-financing
(no advance payments, no front-loading of prices
possible, comparably long time needed for final
account settlement).
- On some jobs collection of money takes long time
due to disputes with the customer. Bad payment is
frequently used by customers to achieve reductions
in final payments. This can cause law cases.
Comparison with main contractor: they can finance
their company by a positive cash flow from jobs.
+23.4%
-2.8%
∆ 2012/2017
Group
Working capital / net debt in EUR million

© BAUER AG, D-86529 Schrobenhausen 18-08-10 IR-Presentation_Q2_2018 24
Building construction
positive cash contribution
Specialist foundation engineering
pre-financing need
Financials Working capital needs & cash flow
EUR
12 24 months
Positive cash
contribution
Negative cash
contribution
Co
ntr
ac
t va
lue
EUR
Negative cash
contribution
12 24 months
Co
ntr
ac
t va
lue
Equipment segment:
- Due to very special parts being installed, parts need
to be pre-ordered well in advance
approx. 3 months pre-financing of equipment
during production.
- Spare parts store is needed for large customer base.
- A relatively large rental fleet is needed for different
contract types (e.g. rental purchase).
Resources segment:
- A mixture of the Construction and Equipment
segments.
Group

© BAUER AG, D-86529 Schrobenhausen 18-08-10 IR-Presentation_Q2_2018
686721 717
605
711 720 736
604
726 701 700629
672709 684
608674 646 628
549 576624
0
160
320
480
640
800
Q1/13 Q2/13 Q3/13 Q4/13 Q1/14 Q2/14 Q3/14 Q4/14 Q1/15 Q2/15 Q3/15 Q4/15 Q1/16 Q2/16 Q3/16 Q4/16 Q1/17 Q2/17 Q3/17 Q4/17 Q1/18 Q2/18
724 777 781672
773 776 778
646
779 752 749
665743 762 736
677740 712 686
594639
678
0
160
320
480
640
800
Q1/13 Q2/13 Q3/13 Q4/13 Q1/14 Q2/14 Q3/14 Q4/14 Q1/15 Q2/15 Q3/15 Q4/15 Q1/16 Q2/16 Q3/16 Q4/16 Q1/17 Q2/17 Q3/17 Q4/17 Q1/18 Q2/18
25
Financials Working capital & net debt are lower year-end than during the year
Net debt (excl. pensions) in EUR million
Working capital in EUR million -3.4%
-4.8%
Group

© BAUER AG, D-86529 Schrobenhausen 18-08-10 IR-Presentation_Q2_2018
Financials Working capital & net debt – Financing of future revenues
Inventory
• Distribution on business segments
• Construction: raw materials for construction sites (concrete, steel, etc.)
• Equipment: 1) Finished machines with a long-term value needed to deliver equipment to customers in time
2) Spare parts and drilling tools in a number of service centers all over the world for high customer service
3) Rental fleet Quite some machines for rental and rental-purchase contracts are strategically important
• Resources: finished goods (water business) and raw materials for construction sites (environmental business)
Receivables
• Distribution on business segments
• Construction: 1) Receivables on construction projects (PoC) – including litigations
2) No large valuation adjustments on receivables in the last years (less than 4% of receivables in average p.a.)
• Equipment: receivables on outstanding customer payments
• Resources: outstanding customer payments (water business) and receivables on projects (environmental & drilling business)
Working capital has a solid and long-term value
Net debt is needed to finance the future revenues of the company
75-80% 15-20% ~5%
Construction Equipment Resources
is needed
to finance
Working capital mainly consists of inventory
and receivables
20-25% 55-60% 15-20%
Construction Equipment Resources
Net debt non-current & current debt –
mainly liabilities to banks
Group
26

© BAUER AG, D-86529 Schrobenhausen 18-08-10 IR-Presentation_Q2_2018 27
Financials Income statement 6M 2018
in EUR '000 6M 2017* 6M 2018 ∆ in %
Sales revenues (P&L) 830,242 717,104 -13.6%
Consolidated revenues (P&L) 861,283 765,890 -11.1%
Cost of materials -468,492 -393,561 -16.0%
Personel expenses -191,082 -190,076 -0.5%
Other operation expenses -116,278 -102,839 -11.6%
EBITDA 85,431 79,414 -7.0%
Depreciation of fixed assets -39,640 -37,948 -4.3%
Write-downs of inventories due to use -7,145 -7,357 3.0%
EBIT 38,646 34,109 -11.7%
Financial income 19,633 17,104 -12.9%
Financial expenses -46,856 -35,427 -24.4%
Share of profit/loss of associated companies (equity method) 1,054 -207 n/a
Earnings before tax (EBT) 12,477 15,579 24.9%
Income tax expense -12,345 -13,932 12.9%
Earnings after tax 132 1,647 n/a
of which attributable to shareholders of BAUER AG -1,303 741 n/a
of which attributable to non-controlling interests 1,435 906 -36.9%
* Previous year figures adjusted; for more information, see notes on page 93 ff. of the Annual Report 2017

© BAUER AG, D-86529 Schrobenhausen 18-08-10 IR-Presentation_Q2_2018 28
Financials Balance sheet June 30, 2018
in EUR '000 June 30, 2017* June 30, 2018 ∆ in %
Assets 1,750,356 1,706,252 -2.5%
Non-current assets 637,655 634,191 -0.5%
Intangible assets 23,190 19,237 -17.0%
Property, plant and equipment and investment property 412,679 408,581 -1.0%
Investments accounted for using the equity method 123,638 119,288 -3.5%
Participations 9,746 11,299 15.9%
Other non-current assets & deferred tax assets 68,402 75,786 10.8%
Current assets 1,112,701 1,072,061 -3.7%
Inventories 447,205 484,760 8.4%
Less advances received on inventories -26,184 -20,155 -23.0%
421,021 464,605 10.4%
Receivables and other assets 643,948 562,038 -12.7%
Effective income tax refund claims 4,730 4,560 -3.6%
Cash and cash equivalents 43,002 40,858 -5.0%
Equity and liabilities 1,750,356 1,706,252 -2.5%
Equity 422,386 416,378 -1.4%
Non-current debt 621,515 525,803 -15.4%
Provisions for pensions 122,332 128,552 5.1%
Non-current liabilities & deferred tax liabilities 499,183 397,251 -20.4%
Current debt 706,455 764,071 8.2%
Financial liabilities 289,612 352,580 21.7%
Other current liabilities 389,722 379,418 -2.6%
Effective income tax obligations 7,849 16,889 n/a
Provisions 19,272 15,184 -21.2%
* Previous year figures adjusted; for more information, see notes on page 93 ff. of the Annual Report 2017

© BAUER AG, D-86529 Schrobenhausen 18-08-10 IR-Presentation_Q2_2018 29
Financials Cash flow statement 6M 2018
in EUR '000 6M 2017* 6M 2018 ∆ in %
Cash flow from operational activity -1,607 -29,648 n/a
Cash flow from investment activity -27,719 -29,910 n/a
Cash flow from financing activity 40,153 52,961 31.9%
Free Cash Flow -29,326 -59,558 n/a
Changes in liquid funds affecting payments 10,827 -6,597 n/a
Influence of exchange rate movements on cash -1,288 189 n/a
Total change in liquid funds 9,539 -6,408 n/a
Cash and cash equivalents at beginning of reporting period 33,463 47,266 41.2%
Cash and cash equivalents at end of reporting period 43,002 40,858 -5.0%
* Previous year figures adjusted; for more information, see notes on page 93 ff. of the Annual Report 2017

© BAUER AG, D-86529 Schrobenhausen 18-08-10 IR-Presentation_Q2_2018 30
Financials Forecast 2018
2017 final
Total Group Revenues 1,772 EUR million ~ 1,800 EUR million
Revenue growth +14.0% 3 - 8 %
EBIT 89.6 EUR million ~ 90 EUR million
EBIT margin 5.4% 7 - 9 %
Earnings after tax 3.7 EUR million significantly higher than 2017
Equity ratio 25.9% > 30 %
2018 forecast Long-term goal
Tunnel under Suez Canal – Egypt Soil replacement – Hersbruck, Germany In-house exhibition 2017

© BAUER AG, D-86529 Schrobenhausen 18-08-10 IR-Presentation_Q2_2018 31
Investor Relations
BAUER Aktiengesellschaft
BAUER-Straße 1
86529 Schrobenhausen
Germany
Tel.: +49 8252 97-1218
Fax: +49 8252 97-2900
www.bauer.de
Annual Report 2017 April 12, 2018
Annual Press Conference April 12, 2018
Analyst Conference April 12, 2018
Quarterly Statement Q1 2018 May 14, 2018
Annual General Meeting June 28, 2018
Half-Year Interim Report to June 30, 2018 August 10, 2018
Quarterly Statement 9M/Q3 2018 November 13, 2018
Listing CDAX
Classic All Share
Prime All Share
ISIN DE0005168108
Reuters B5AG.DE
Bloomberg B5A GR
www.youtube.com/Bauergruppe www.facebook.com/BauerAGgroup
Investor Relations Financial calendar & contact

© BAUER AG, D-86529 Schrobenhausen 18-08-10 IR-Presentation_Q2_2018 32
Table of Content
BAUER Group – Strategy, Chances & Markets
Appendix
Financials 6M/Q2 2018 & Guidance

© BAUER AG, D-86529 Schrobenhausen 18-08-10 IR-Presentation_Q2_2018 33
1790 · 1900 · 1902 · 1928 · 1948 · 1956 · 1958 · 1967 · 1969 · 1972 · 1975 · 1976 · 1984 · 1990 · 1992 · 1994 · 1998 · 2001 · 2017
BAUER Group The history – Two centuries of experience
End of 1970’s:
Start of
internationalisation
Early 1990’s:
Build up of
specialist construction/
environmental business
FY 2017:
Total Group
revenues
EUR 1.772
billion,
10,913
employees
4. Jul 2006:
IPO
Early 1970’s:
Start of equipment
manufacturing
Company founded as
copper forge
After WW II (1950's):
Start of construction
business
Early 1980’s:
Selling of equipment to
third parties
1790 1900-1970 1980-1990 2000-2017

© BAUER AG, D-86529 Schrobenhausen 18-08-10 IR-Presentation_Q2_2018 34
BAUER Group The three segments
34 © BAUER AG, D-86529 Schrobenhausen
Target: ~ 40 % of
total Group revenues
Market leader in
specialist foundation
equipment
New products for
mining, deep drilling
and offshore drilling
80 % of revenues
from sales abroad
Multi-branding
strategy
Target: ~ 40 % of total Group revenues
Global provider for specialist foundation engineering services
Specialist construction services
Focus on complex, international projects
Target: ~ 20 % of
total Group revenues
Activities in
environmental
technology, deep
drilling, well
construction,
materials

© BAUER AG, D-86529 Schrobenhausen 18-08-10 IR-Presentation_Q2_2018 35
What is specialist foundation? Building an excavation pit
Permeation Grouting
Mixed-In-Place Method
Injection
Anchor
Diaphragm and
Cut-off Wall
Pile Foundation
Piling Retaining
Wall

© BAUER AG, D-86529 Schrobenhausen 18-08-10 IR-Presentation_Q2_2018 36
What is specialist foundation used for? Applications for projects
Foundations Cut-off walls Excavation pits
Buildings Infrastructure Water – Energy Industry
Ground improvement

© BAUER AG, D-86529 Schrobenhausen 18-08-10 IR-Presentation_Q2_2018 37
BAUER Group Challenges of the world provide chances for the company
Urbanization Infrastructure Water
Environment Energy / Oil & Gas Values
The megatrend urbanization leads to
more complex inner-city solutions
High demand for new infrastructure and
for restoration of existing structures
Changing social values influence the
working and corporate environment
The pollution and contamination of soil
require innovative purification solutions
Energy and resource scarcity provide
chances for underwater and deep drilling
The shortage of clean drinking water
is one of the worlds biggest problems

© BAUER AG, D-86529 Schrobenhausen 18-08-10 IR-Presentation_Q2_2018 38
Construction St. Petersburg, Russia – Foundation works for Lakhta Center

© BAUER AG, D-86529 Schrobenhausen 18-08-10 IR-Presentation_Q2_2018 39
Construction York, UK – Shaft sinking for Woodsmith Mine

© BAUER AG, D-86529 Schrobenhausen 18-08-10 IR-Presentation_Q2_2018 40
Equipment Product range: Drilling rigs (BG series) – PremiumLine
BG 55 BG 39 PremiumLine
The Premium Line stands, for the one part,
for very modern kelly drilling rigs and on the
other hand for multifunction equipment for a
variety of foundation construction systems.
Specific highlights of the BG PremiumLine
are:
High safety standards
Environmental sustainability, economic
efficiency and performance
Easy to transport and short rigging time
High quality standard
Long lifetime and excellent resale value

© BAUER AG, D-86529 Schrobenhausen 18-08-10 IR-Presentation_Q2_2018 41
Equipment Product range: Drilling rigs (BG series) – ValueLine
BG 26 ValueLine
If kelly drilling is your task, then the BG
ValueLine is the solution. The machines of
the ValueLine are specifically adapted to no
other purpose than kelly drilling – and that
perfectly.
Specific highlights of the BG ValueLine are:
Long mast for increased drilling depth
Enlarged drill axis distance for larger
drilling diameter
High winch traction forces
Increased torque
Fuel-efficient diesel engine

© BAUER AG, D-86529 Schrobenhausen 18-08-10 IR-Presentation_Q2_2018 42
Equipment Product range: Duty-cycle cranes (MC series)
MC 128 MC 96 MC 76

© BAUER AG, D-86529 Schrobenhausen 18-08-10 IR-Presentation_Q2_2018 43
Equipment Product range: Deep Drilling
Joint Venture
of Bauer & Schlumberger
In order to meet the upcoming market challenges, out-of-the-box thinking
is necessary and therefore integrated drilling and rig solutions are of
growing importance.
Based on more than 40 years of experience in engineering and
manufacturing of drilling rigs, NeoRig develops and manufactures
modern drilling solutions which set new standards of safety, efficiency,
productivity and ease of service in the deep drilling business.
© BAUER AG, D-86529 Schrobenhausen 18-08-10 IR-Presentation_Q2_2018 44
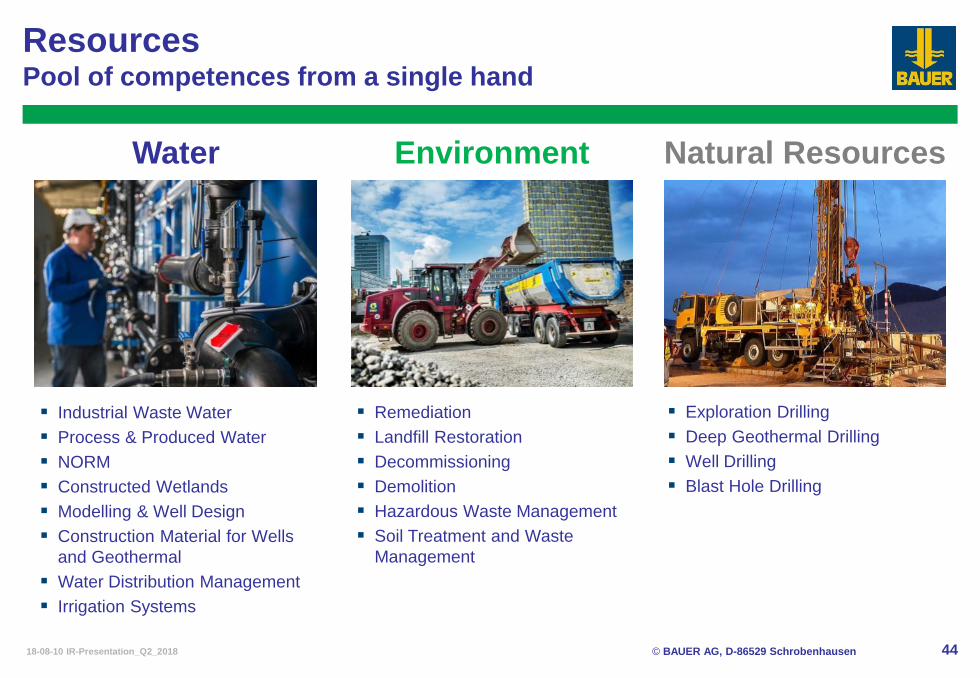
Resources Pool of competences from a single hand
Industrial Waste Water
Process & Produced Water
NORM
Constructed Wetlands
Modelling & Well Design
Construction Material for Wells
and Geothermal
Water Distribution Management
Irrigation Systems
Remediation
Landfill Restoration
Decommissioning
Demolition
Hazardous Waste Management
Soil Treatment and Waste
Management
Exploration Drilling
Deep Geothermal Drilling
Well Drilling
Blast Hole Drilling
Environment Water Natural Resources

© BAUER AG, D-86529 Schrobenhausen 18-08-10 IR-Presentation_Q2_2018 45
Resources Water – Process Water & Water Distribution Management
© BAUER AG, D-86529 Schrobenhausen 18-08-10 IR-Presentation_Q2_2018 46
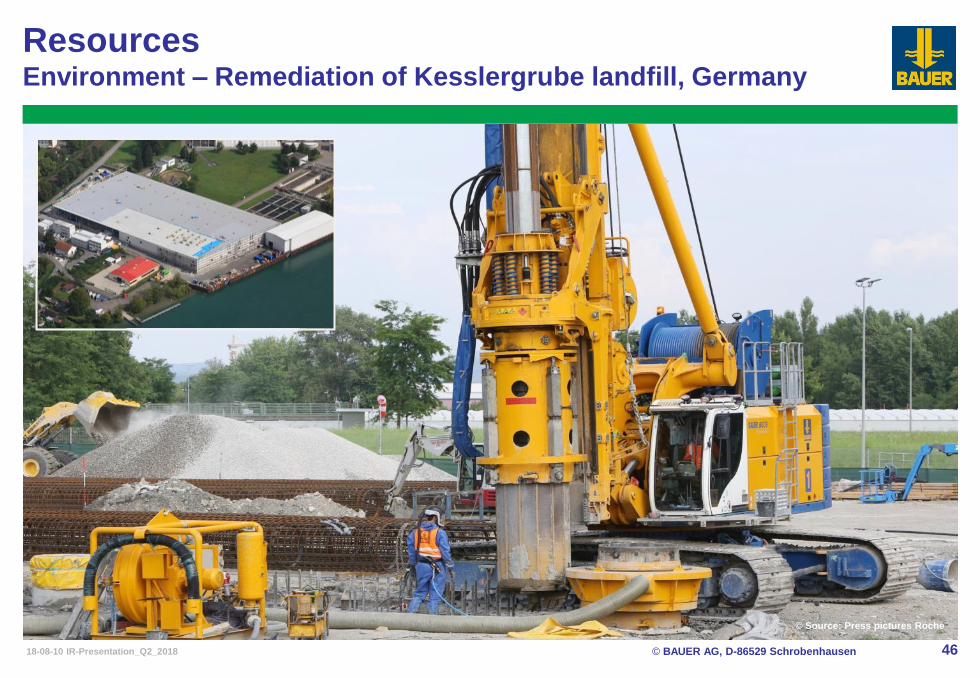
Resources Environment – Remediation of Kesslergrube landfill, Germany
© Source: Press pictures Roche

© BAUER AG, D-86529 Schrobenhausen 18-08-10 IR-Presentation_Q2_2018 47
Market environment – Germany German construction market
Source: Federal Statistical Office, Statistical Office Bavaria
in EUR billion
Germany
2017
Employees (in 1,000)
Revenues 76.9
Building construction 43.1
Foundation engineering 33.8
Orders received *
in EUR billion
Housebuilding 16.0
Industrial building 29.4
Public sector
of which
public buildings 4.8
road building 12.6
underground structures 9.4
*) only companies > 20 employees
5.9
8.5
9.8
10.0
-2.3
5.3
7.8
4.8
7.5
7.8
5.0
6.9
11.4
May 20182017/ Jan-May
2016 2018/2017
in %
11.4
26.8
72.3
442.0
7.0
4.0
6.6 7.5
7.2
6.8
4.9
4.8

© BAUER AG, D-86529 Schrobenhausen 18-08-10 IR-Presentation_Q2_2018 48
BAUER share Facts & Figures
Bauer family
Free float
51.81 %
Listed on Frankfurt stock exchange,
Prime Standard, since July 4, 2006
Share capital EUR 73,001,420.45
Shares issued 17,131,000
Issue price EUR 16.75
Shareholder structure
Share performance (01/2017 – 08/2018)
48.19 %
in EUR 2014 2015 2016 2017 2018
Earnings per share 0.85 1.73 0.66 0.16 ---
Share price year end 13.35 17.40 11.40 30.00 ---
Share price highest 20.04 19.20 17.16 30.96 31.25
Share price lowest 11.75 13.85 9.45 11.72 17.42
Market Cap (in EUR million)
228.7 298.1 195.3 513.9 ~320

© BAUER AG, D-86529 Schrobenhausen 18-08-10 IR-Presentation_Q2_2018 49
BAUER share Dividend policy
Dividend payment Dividend policy founded on a reasonable
balance between shareholders and
company
fair participation of shareholders
continuity over the years
safeguarding of the equity base
All shareholders shall participate in the
success of the business.
In turbulent times such as the financial crisis
our goal of strategic and safe growth of the
company led to higher profit retention for the
last years.
To secure an adequate equity ratio is an
important aim of the company’s management.
With this we intend to safeguard the long-term
success of the Group.
in EUR per share
0.50
1.00 1.00
0.60 0.60
0.50
0.30
0.15 0.15 0.10 0.10
0.00
0.30
0.60
0.90
1.20
2006 2007 2008 2009 2010 2011 2012 2013 2014 2015 2016 2017
0.00

© BAUER AG, D-86529 Schrobenhausen 18-08-10 IR-Presentation_Q2_2018 50
Key Figures Time Line FY 2008 – Q2 2018
In all three segments, total Group revenues and EBIT figures of Q4 2015 and FY 2015 were influenced by exceptional earnings.
Quarters and FY’s of 2016 and 2017 were adjusted.
Total Group revenues 2008 2009 2010 2011 2012 2013 2014 Q1 15 Q2 15 Q3 15 Q4 15 2015 Q1 16 Q2 16 Q3 16 Q4 16 2016 Q1 17 Q2 17 Q3 17 Q4 17 2017 Q1 18 Q2 18
(in EUR million)
BAUER Group 1,527.2 1,275.8 1,304.0 1,371.8 1,435.8 1,504.2 1,560.2 409.1 371.3 414.5 461.5 1,656.4 374.0 372.0 387.3 421.3 1,554.7 448.2 454.1 476.6 393.1 1,772.0 370.8 421.5
Construction 700.9 570.0 615.4 606.6 655.2 741.7 725.6 193.5 176.4 194.5 178.5 742.9 156.3 171.3 185.0 200.6 713.1 211.0 220.5 226.9 176.6 835.0 150.9 176.2
Equipment 780.1 608.5 581.7 636.5 589.1 628.6 639.2 173.8 159.6 163.2 256.5 753.1 159.6 146.7 150.8 177.3 634.4 186.7 185.3 196.6 185.9 754.5 180.9 193.6
Resources 135.1 174.3 177.7 211.5 262.8 188.9 252.8 54.3 47.8 75.1 44.4 221.6 71.4 67.4 66.4 57.4 262.4 63.0 64.7 65.1 55.4 248.2 51.7 67.6
Sales revenues 2008 2009 2010 2011 2012 2013 2014 Q1 15 Q2 15 Q3 15 Q4 15 2015 Q1 16 Q2 16 Q3 16 Q4 16 2016 Q1 17 Q2 17 Q3 17 Q4 17 2017 Q1 18 Q2 18
(in EUR million)
BAUER Group 1,290.8 1,096.5 1,131.7 1,219.6 1,344.4 1,402.2 1,375.7 299.6 342.4 376.8 360.2 1,379.0 317.6 332.2 342.8 404.3 1,396.9 378.9 451.2 435.4 402.2 1,667.9 318.4 398.7
Construction 584.3 487.9 505.8 506.2 579.1 657.5 646.6 156.0 163.9 179.4 151.5 650.8 143.6 154.9 162.7 153.3 614.5 196.6 206.4 214.5 166.3 783.8 143.2 164.2
Equipment 601.2 456.5 469.3 511.4 520.6 561.6 532.7 100.5 137.4 129.3 180.8 548.0 107.8 115.2 123.0 196.7 542.7 126.6 185.7 168.5 180.1 660.9 128.6 173.6
Resources 105.1 152.0 156.4 201.5 244.3 182.6 195.9 42.9 40.9 67.9 27.6 179.3 65.9 61.6 56.7 54.0 238.2 55.3 57.7 53.2 55.3 221.5 46.3 60.5
EBIT 2008 2009 2010 2011 2012 2013 2014 Q1 15 Q2 15 Q3 15 Q4 15 2015 Q1 16 Q2 16 Q3 16 Q4 16 2016 Q1 17 Q2 17 Q3 17 Q4 17 2017 Q1 18 Q2 18
(in EUR million)
BAUER Group 167.5 84.4 88.4 82.3 72.0 30.1 76.4 1.2 14.8 20.4 54.3 90.7 9.8 13.3 21.3 25.9 70.3 8.5 30.2 27.7 23.2 89.6 11.1 23.1
Construction 46.3 25.7 28.8 17.9 22.0 21.2 26.0 4.9 5.5 2.0 1.5 13.9 4.8 2.6 10.4 12.0 29.7 0.9 12.4 8.1 -1.8 19.6 2.7 2.1
Equipment 118.3 51.3 48.3 53.0 34.0 32.2 36.0 -0.9 9.3 16.2 74.8 99.4 5.8 8.8 8.0 15.8 38.4 8.0 16.0 24.9 31.7 80.6 14.2 22.2
Resources 4.0 6.0 8.1 10.9 15.2 -24.0 15.9 -2.9 -0.3 2.0 -18.6 -19.8 -1.1 1.3 3.5 -7.6 -3.7 -0.1 0.9 -5.3 -5.5 -10.0 -5.7 -1.0
EBIT margin 2008 2009 2010 2011 2012 2013 2014 Q1 15 Q2 15 Q3 15 Q4 15 2015 Q1 16 Q2 16 Q3 16 Q4 16 2016 Q1 17 Q2 17 Q3 17 Q4 17 2017 Q1 18 Q2 18
(in %)
BAUER Group 13.0% 7.7% 7.8% 6.7% 5.4% 2.1% 5.6% 0.4% 4.3% 5.4% 15.1% 6.6% 3.1% 4.0% 6.2% 6.4% 5.0% 2.2% 6.7% 6.4% 5.8% 5.4% 3.5% 5.8%
Construction 7.9% 5.3% 5.7% 3.5% 3.8% 3.2% 4.0% 3.1% 3.4% 1.1% 1.0% 2.1% 3.3% 1.7% 6.4% 7.8% 4.8% 0.5% 6.0% 3.8% -1.1% 2.5% 1.9% 1.3%
Equipment 19.7% 11.2% 10.3% 10.4% 6.5% 5.7% 6.8% -0.9% 6.8% 12.5% 41.4% 18.1% 5.4% 7.6% 6.5% 8.0% 7.1% 6.4% 8.6% 14.8% 17.6% 12.2% 11.0% 12.8%
Resources 3.8% 3.9% 5.2% 5.4% 6.2% -13.1% 8.1% -6.8% -0.7% 2.9% -67.4% -11.0% -1.7% 2.1% 6.2% -14.1% -1.6% -0.2% 1.5% -10.0% -9.9% -4.5% -12.3% -1.6%

© BAUER AG, D-86529 Schrobenhausen 18-08-10 IR-Presentation_Q2_2018 51
Disclaimer
This presentation contains forward-looking statements. Forward-looking statements
are statements that are not historical facts, including statements about our beliefs,
intentions, expectations, predictions and the assumptions underlying them.
These statements are based on factors as they are currently available to the
management of BAUER AG and therefore speak only as of the date they are made.
We assume no liability to update publicly or conform any of them to future events or
future developments.
Forward-looking information is subject to various known and unknown risks and un-
certainties, which could lead to material differences between the actual future results,
financial situation, development or performance of the BAUER Group and those
factors contained in any forward-looking statement. In view of these uncertainties, no
assurance can be given that these forward-looking statements will prove accurate
and correct, or that anticipated and projected future results will be achieved and we
caution you not to place undue reliance on these forward-looking statements.