Embed Size (px)
Citation preview
1
Rethinking Sampling Strategies for UnsupervisedPerson Re-identification
Xumeng Han†, Xuehui Yu†, Guorong Li, Jian Zhao, Gang Pan, Qixiang Ye,Jianbin Jiao, and Zhenjun Han‡
Abstract—Unsupervised person re-identification (re-ID) re-mains a challenging task. While extensive research has focused onthe framework design or loss function, we show in this paper thatsampling strategy plays an equally important role. We analyzethe reasons for differences in performance between varioussampling strategies under the same framework and loss function.We suggest that deteriorated over-fitting is an important factorcausing poor performance, and enhancing statistical stabilitycan rectify this issue. Inspired by that, a simple yet effectiveapproach is proposed, known as group sampling, which gathersgroups of samples from the same class into a mini-batch. Themodel is thereby trained using normalized group samples, whichhelps to alleviate the effects associated with a single sample.Group sampling updates the pipeline of pseudo label generationby guaranteeing that samples are more efficiently divided intothe correct classes. Group sampling regulates the representationlearning process, which enhances statistical stability for featurerepresentation in a progressive fashion. Qualitative and quan-titative experiments on Market-1501, DukeMTMC-reID, andMSMT17 show that group sampling improves upon state-of-the-art methods by between 3.3% ∼ 6.1%. Code has been availableat https://github.com/ucas-vg/GroupSampling.
Index Terms—Person Re-identification, Unsupervised Learn-ing, Group Sampling, Representation Learning.
I. INTRODUCTION
UNSUPERVISED person re-identification (re-ID) aimsto learn inter-class discriminative representations and
intra-class affinities for person identification using unlabeleddatasets. By reducing the amount of human effort required fordata annotation, unsupervised person re-ID has the potentialto be extended to practical applications. Existing methodsfor unsupervised person re-ID can be roughly divided intounsupervised domain adaptation (UDA) methods [1], [2], [3],[4], [5], [6], [7], [8], [9], [10], [11], [12], [13], [14], [15]and fully unsupervised methods [16], [17], [18], [19], [20],[21], [22], [23], [24], [25], [26], [27]. Fully unsupervisedmethods use features to generate pseudo labels as supervisedinformation. These pseudo label methods estimate labels foreach sample by mining feature-wise similarities and thenutilize the estimated pseudo labels to fine-tune the network.
† Equal contribution.‡ Corresponding author: Zhenjun Han.X. Han, X. Yu, G. Li, Q. Ye, J. Jiao and Z. Han are with Univer-
sity of Chinese Academic of Sciences (UCAS), Beijing, 101408 China.E-mail: {hanxumeng19, yuxuehui17}@mails.ucas.ac.cn, {liguorong, qxye,jiaojb, hanzhj}@ucas.ac.cn.
J. Zhao is with Institute of North Electronic Equipment, Beijing, China.Homepage: https://zhaoj9014.github.io/. E-mail: [email protected].
G. Pan is with Tianjin University, Tianjin, 300350 China. E-mail: [email protected].
At present, pseudo label methods have achieved comparableperformance to UDA methods without using labeled data.
During unsupervised person re-ID research, most worksfocus on the training framework design [6], [24], [25], [26]or loss function [17], [22], [23]. In this paper, we show thatthe process of sample selection plays an equally importantrole. For example, different sampling strategies can createsubstantially different results under the same framework andloss function. The representative pseudo label method SpCL[25] is adopted as the baseline framework. Unexpectedly, usingthis framework, the most commonly used random samplingleads to training collapse, while triplet sampling [28], [29],[30] originally used in the baseline can greatly alleviate thisproblem. In order to address this anomaly, we analyze thesampling differences, and show why triplet sampling worksand random sampling does not.
When using random sampling for training, the randomnessof a single sample and its own trend may affect the overalltrend of the class, causing in the features expressed by the classto shift, which is called deteriorated over-fitting. For tripletsampling, samples in the same class are selected within amini-batch, which is called a grouping operation. Our analysissuggests that this grouping operation reduces the impact ofa single sample, thereby strengthening statistical stability,overall. This appears to hold across the class and suppressesdeteriorated over-fitting. However, triplet loss [28], [29] is notused in our baseline framework, so the application of tripletsampling is not necessary in this framework and also causesa number of disadvantages. Therefore, this paper proposesa novel group sampling for pseudo-label-based unsupervisedperson re-ID, which utilizes the grouping operation and solvesthe shortcomings in triplet sampling. Grouping samples helpsto optimize the model in a direction consistent with the trendof the whole class and to reduce the impact of a single sample,which facilitates similarity structure maintenance within eachclass. At the same time, using the overall trend of the classalso helps to maintain discrimination between classes, therebypreventing many classes from being merged, which inhibitsthe model from deteriorated over-fitting. In this way, themodel has access to exploit more subtle differences from theexisting similarity structure so as to extract the unique identitysimilarity. Extensive experiments have been conducted, andthe results demonstrate the effectiveness of group samplingon maintaining statistical stability and improving feature rep-resentation capability of the model.
The contributions of this paper are summarized as follows:• We provide evidence that sampling strategy plays an
arX
iv:2
107.
0302
4v2
[cs
.CV
] 2
8 A
ug 2
021
2
important role in the training process of unsupervisedperson re-ID, and investigate the mechanism of whyrandom sampling leads to training collapse and whytriplet sampling works.
• We highlight the shortcomings involved in triplet sam-pling, and further propose a novel group sampling strat-egy for unsupervised person re-ID, which addresses thenegative effect of deteriorated over-fitting and enhancesstatistical stability related to the unsupervised model.
• Group sampling achieves mAP of 79.2% and 69.1%on Market-1501 [31] and DukeMTMC-reID [32], signif-icantly outperforming the state-of-the-art [25] by 6.1%and 3.8%. Group sampling also achieves competitiveperformance on the challenging MSMT17 V2 [33].
II. RELATED WORK
A. Unsupervised Person re-ID
Unsupervised person re-ID aims to learn effective featuresfor unlabeled person image datasets. Existing unsupervisedperson re-ID methods can be roughly categorized into trans-ferring knowledge from the labeled source domain to theunlabeled target domain [1], [2], [3], [4], [5], [6], [7], [8],[9], [10], [11], [12], [13], [14], [15], and using representationfeatures to estimate pseudo-labels [16], [17], [18], [19], [20],[21], [22], [23], [24], [25], [26], [27]. The transfer-basedmethods follow the UDA strategy, which transfers knowledgelearned from the source domain dataset as model initializationto the target domain or uses the style transfer method totransfer labeled images to the target domain.
Recently, researchers have paid more attention to pseudo-label methods that do not require source domain data. Pseudolabels can be generated by a pseudo label generator or bymining soft label information from feature similarities. In thisway, pseudo labels are used to fine-tune the re-ID model.MMT [6] proposed to generate more robust soft labels viamutual mean-teaching. HCT [24] combined hierarchical clus-tering with hard-batch triplet loss to improve the quality ofpseudo labels. MMCL [23] formulated unsupervised person re-ID as a multi-label classification task to progressively seek truelabels. SpCL [25] adopted the self-paced contrastive learningstrategy to form more reliable clusters.
In contrast, our method attempts to boost the performanceof unsupervised person re-ID on the unlabeled dataset withoutany source domain data or source domain pre-trained model.The pseudo-label-based strategy is adopted, combining withthe training method of contrastive learning. Here, a morereasonable sampling strategy is proposed, which achievesbetter performance than existing methods.
B. Sampling Strategy
Sampling is a basic operation for reducing bias duringmodel learning [34], and it has been studied for stochasticoptimization [35] with the goal of accelerating convergenceto the same global loss function. A commonly used wayis random sampling [36], [37]. In the literature, differentsampling methods are proposed to facilitate the learning ofvarious loss functions. For contrastive loss, it is common to
select randomly from all possible pairs [38], [39], [37], andsometimes with hard negative mining [40]. For triplet loss,the semi-hard negative mining method was first utilized inFaceNet [28] and is now widely adopted [41], [42]. For theperson re-ID task, triplet sampling [29], [30] is widely usedfor learning with triplet loss. For each training batch, a certainnumber of identities are randomly selected, and then severalimages are sampled from each selected identity. This samplingstrategy guarantees informative positive and negative mining.In this paper, we study the impact of sampling strategy onunsupervised person re-ID learning, and further propose a newsampling strategy, termed group sampling, to ensure modelconvergence and to improve performance.
C. Unsupervised Feature Learning
Unsupervised feature learning usually focuses on selectingappropriate self-supervised pretext tasks, whose targets areautomatically generated without manual labeling. The perfor-mance of this invented task is usually not crucial, but thelearned intermediate representation is concerned, which is ex-pected to carry good semantic or structural meanings and canbe beneficial to practical downstream tasks. Recently, state-of-the-art methods on unsupervised feature learning are basedon contrastive learning [43], [44], [45], [46], [47]. They adopta specific pretext task for instance discrimination by treatingevery image as a distinct class, which demonstrates betterperformance than other pretext tasks. However, the strategyfor instance discrimination is not suitable for unsupervisedperson re-ID, because this task requires measuring the inter-class affinities. Similar to DeepCluster [48], our frameworkutilizes feature clustering and pseudo label optimization as itspretext task.
III. HOW IMPORTANT IS SAMPLING?
In this section, we investigate the importance of samplingstrategies for unsupervised person re-ID. In Sec. III-A, we firstbriefly introduce the baseline framework. Then, in Sec. III-Band III-C, we illustrate how important sampling is froman experimental point of view. The experiment settings andimplementation details are described in Sec. VI-A and VI-B.
A. Baseline Framework
We adopt the person re-ID contrastive learning frameworkproposed in SpCL [25] as our baseline framework, whichcombines the self-supervised contrastive learning method [43],[45], [46], [47] and the pseudo-label-based unsupervised per-son re-ID strategy [6], [24], [23] to achieve state-of-the-artperformance. It consists of a CNN-based encoder fθ with pa-rameters θ and a feature memory bankM. The encoder mapsthe unlabeled person re-ID dataset X = {x1, x2, . . . , xn} toobtain a feature set V = {v1,v2, . . . ,vn}, i.e.,
V = fθ(X ). (1)
The memory bank is utilized to store instance features ex-tracted from the encoder. In self-supervised contrastive learn-ing, each instance is treated as a distinct class. Nevertheless,
3
Algorithm 1 Baseline FrameworkRequire: Unlabeled training set X ;Require: Initialize fθ with ImageNet-pretrained ResNet-50;Require: Initialize M with features extracted by fθ;Require: Pseudo label generator G;
1: while max epochs not reached do2: Y = G(M)3: S = Sampling(X ,Y)4: for each mini-batch {xi,yi} in S do5: vi = fθ(xi)6: Compute Lv by Eq. (3) and update the encoder fθ;7: Update the memory bank M with vi and m by Eq. (4);8: end for9: end while
the difference is that in our baseline framework, followingthe pseudo-label-based unsupervised person re-ID strategy, thefeatures in the memory bank are clustered by a pseudo labelgenerator G. Adopting G, the feature set V is divided into anoutliers set O and a cluster set C. The outlier set containsthe samples which are classified separately, and the cluster setcontains Nc clusters,
C = {C1, C2, . . . , CNc}, (2)
in which each cluster Ck contains at least two samples. Eachinstance in outliers set O is assigned a pseudo label, andinstances in cluster Ck are set with the same pseudo label.After being assigned a pseudo label, the instance is used toconstruct the unified contrastive loss. The unified contrastiveloss function in [25] is defined as,
Lv = − logexp(
⟨v, c+
⟩/τ)∑Nc
k=1 exp(〈v, ck〉 /τ) +∑Nok=1 exp(〈v,ok〉 /τ)
, (3)
where c+ indicates the positive class prototype correspondingto v, the temperature τ is empirically set as 0.05, 〈·, ·〉 denotesthe inner product between two feature vectors to measure theirsimilarity, Nc is the number of clusters and No is the numberof outliers. More specifically, if v is a clustered instance,c+ = ck is the centroid of the cluster Ck that v belongsto. If v is an un-clustered outlier, we would have c+ = ok asthe outlier instance feature corresponding to v. When unifiedcontrastive calculating the loss, ck is calculated from thefeatures belonging to the cluster Ck stored in the memorybank M, and ok is the feature directly retrieved from M.The training process includes two steps: (1) using the featuresin the memory bank to cluster the training set samples, and (2)optimizing the encoder with the unified contrastive loss anddynamically updating the memory bank with encoded features,where the update formula is defined as,
M[x]← m · M[x] + (1−m) · v, (4)
where m ∈ [0, 1] is the momentum coefficient for updatingthe sample features in memory bank is empirically set as 0.2.Alg. 1 shows the implementation process of the person re-IDcontrastive learning framework.
†Unless otherwise specified, the parameter K of triplet sampling in thispaper adopts the default value of 4. Moreover, triplet sampling does not meanthat triplet loss is used. We uniformly use the unified contrastive loss [25].
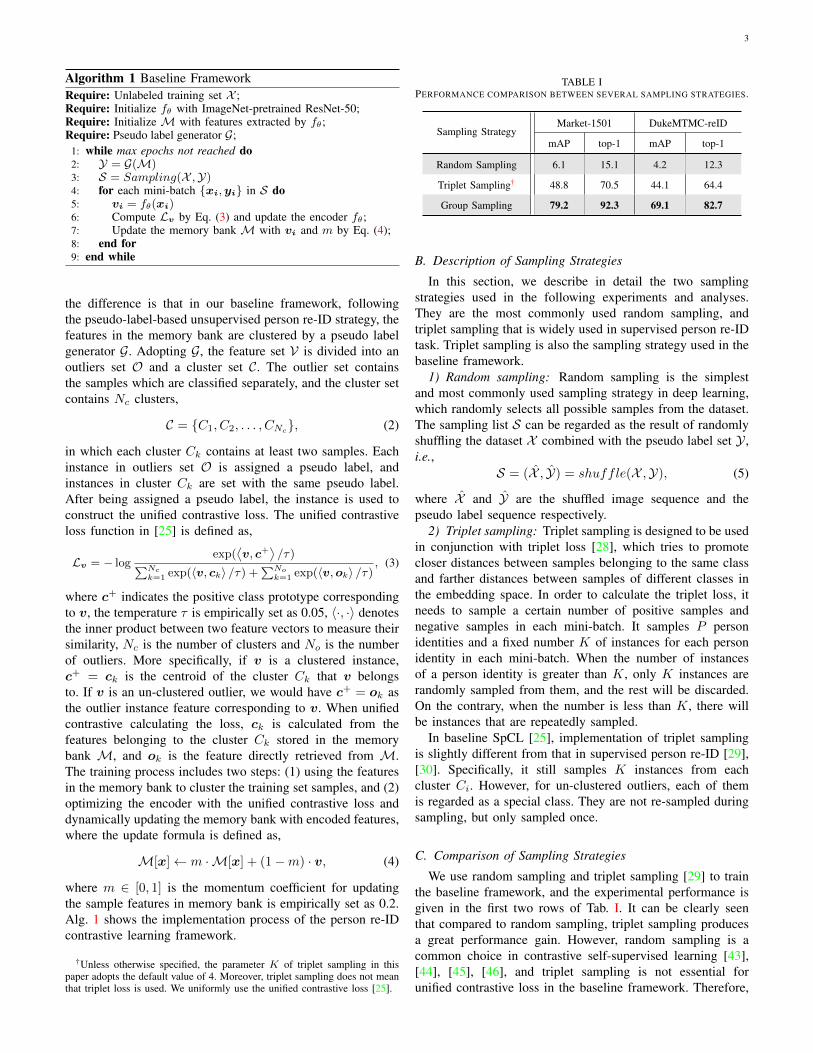
TABLE IPERFORMANCE COMPARISON BETWEEN SEVERAL SAMPLING STRATEGIES.
Sampling StrategyMarket-1501 DukeMTMC-reID
mAP top-1 mAP top-1
Random Sampling 6.1 15.1 4.2 12.3
Triplet Sampling† 48.8 70.5 44.1 64.4
Group Sampling 79.2 92.3 69.1 82.7
B. Description of Sampling Strategies
In this section, we describe in detail the two samplingstrategies used in the following experiments and analyses.They are the most commonly used random sampling, andtriplet sampling that is widely used in supervised person re-IDtask. Triplet sampling is also the sampling strategy used in thebaseline framework.
1) Random sampling: Random sampling is the simplestand most commonly used sampling strategy in deep learning,which randomly selects all possible samples from the dataset.The sampling list S can be regarded as the result of randomlyshuffling the dataset X combined with the pseudo label set Y ,i.e.,
S = (X , Y) = shuffle(X ,Y), (5)
where X and Y are the shuffled image sequence and thepseudo label sequence respectively.
2) Triplet sampling: Triplet sampling is designed to be usedin conjunction with triplet loss [28], which tries to promotecloser distances between samples belonging to the same classand farther distances between samples of different classes inthe embedding space. In order to calculate the triplet loss, itneeds to sample a certain number of positive samples andnegative samples in each mini-batch. It samples P personidentities and a fixed number K of instances for each personidentity in each mini-batch. When the number of instancesof a person identity is greater than K, only K instances arerandomly sampled from them, and the rest will be discarded.On the contrary, when the number is less than K, there willbe instances that are repeatedly sampled.
In baseline SpCL [25], implementation of triplet samplingis slightly different from that in supervised person re-ID [29],[30]. Specifically, it still samples K instances from eachcluster Ci. However, for un-clustered outliers, each of themis regarded as a special class. They are not re-sampled duringsampling, but only sampled once.
C. Comparison of Sampling Strategies
We use random sampling and triplet sampling [29] to trainthe baseline framework, and the experimental performance isgiven in the first two rows of Tab. I. It can be clearly seenthat compared to random sampling, triplet sampling producesa great performance gain. However, random sampling is acommon choice in contrastive self-supervised learning [43],[44], [45], [46], and triplet sampling is not essential forunified contrastive loss in the baseline framework. Therefore,
4
why random sampling leads to training collapse, and whytriplet sampling can be used to address training collapse toa certain extent is counter-intuitive, and is discussed in thelatter sections.
IV. WHY TRIPLET SAMPLING WORKS?
In this section, we study why random sampling causesour baseline framework to fail to converge, and why tripletsampling can alleviate training collapse and ensure goodperformance. In Sec. IV-A, we proposed a concept calleddeteriorated over-fitting, and explained that the reason for thetraining collapse caused by random sampling is the deterio-rated over-fitting in the pseudo label class. Then, in Sec. IV-B,we propose a corresponding concept called statistical stability,and explain that statistical stability is an important factorto restrict deteriorated over-fitting. Finally, in Sec. IV-C, weexplained and analyzed that the grouping operation in tripletsampling helps to maintain statistical stability, which is whytriplet sampling can suppress training collapse.
A. Deteriorated Over-fitting
1) Description of deteriorated over-fitting: Pseudo labelmethods utilize feature similarity and difference betweensamples to divide samples into different classes, and assigna pseudo label to each class. However, due to inadequatefeature representation capabilities of the model and insufficientsemantic information associated with features extracted fromsamples, noise is inevitable in the generated pseudo labels[25], [24], [7]. When using such pseudo labels as supervisioninformation for model training, the model cannot be trainedto complete convergence. Instead, new pseudo labels areregenerated after a certain number of iterations to continuetraining [25]. Therefore, under this training policy, the updateof samples in the feature space has strong randomness.
One characteristic of the classes generated by the pseudolabel method is that they can be roughly divided into strongand weak classes. The characteristic of the strong class is thatthe samples are more compact in the feature space and thenumber of samples is relatively large, which means that it has amore stable structure. On the contrary, the sample compositionof the weak class is looser, which means that its structure isnot stable and easy to be broken.
Due to the randomness of sample feature expression andthe personality of each sample, during the training process,the sample will have a chance to break away from theoriginal class and merge into another class. According to thecharacteristics of the strong and the weak class, we believe thatthe samples in the weak class are more likely to be separatedfrom the class and then be swallowed by the strong class.When the strong class continues to swallow the weak classor other scattered samples, the group gradually grows in size.There are various samples with different ground-truth labelsmixed in a class, and the overall feature expression of theclass is more general and rough. We call this phenomenondeteriorated over-fitting.
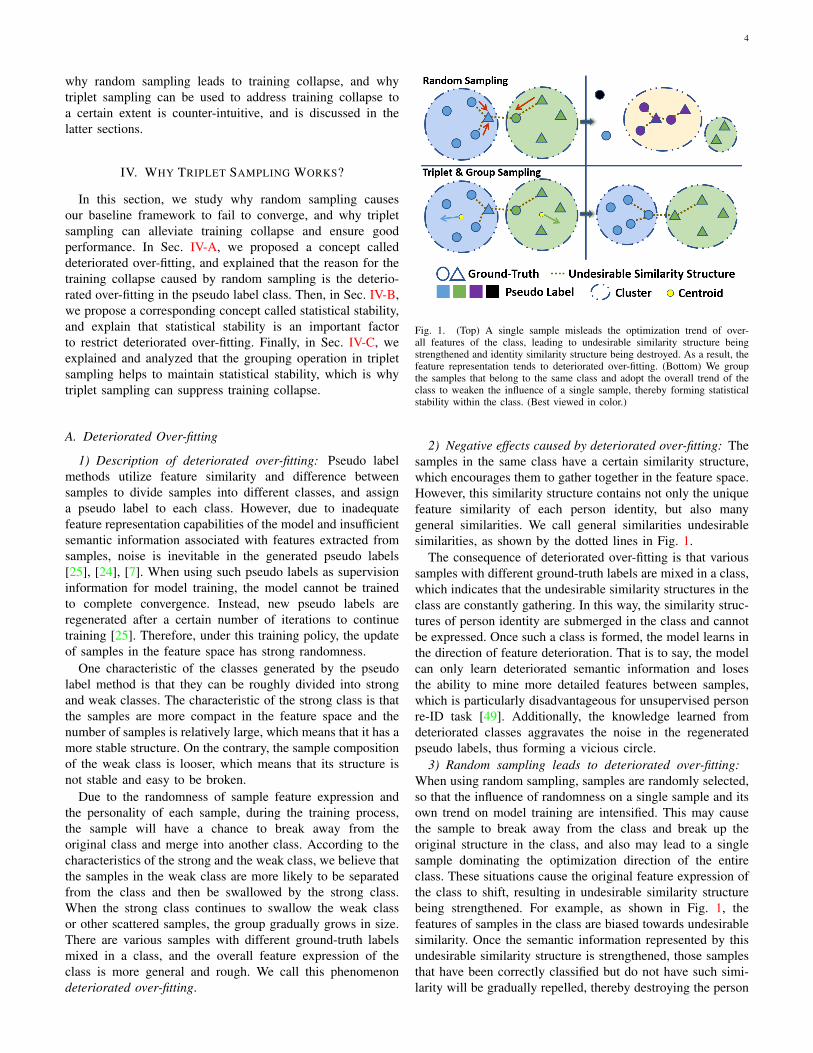
Fig. 1. (Top) A single sample misleads the optimization trend of over-all features of the class, leading to undesirable similarity structure beingstrengthened and identity similarity structure being destroyed. As a result, thefeature representation tends to deteriorated over-fitting. (Bottom) We groupthe samples that belong to the same class and adopt the overall trend of theclass to weaken the influence of a single sample, thereby forming statisticalstability within the class. (Best viewed in color.)
2) Negative effects caused by deteriorated over-fitting: Thesamples in the same class have a certain similarity structure,which encourages them to gather together in the feature space.However, this similarity structure contains not only the uniquefeature similarity of each person identity, but also manygeneral similarities. We call general similarities undesirablesimilarities, as shown by the dotted lines in Fig. 1.
The consequence of deteriorated over-fitting is that varioussamples with different ground-truth labels are mixed in a class,which indicates that the undesirable similarity structures in theclass are constantly gathering. In this way, the similarity struc-tures of person identity are submerged in the class and cannotbe expressed. Once such a class is formed, the model learns inthe direction of feature deterioration. That is to say, the modelcan only learn deteriorated semantic information and losesthe ability to mine more detailed features between samples,which is particularly disadvantageous for unsupervised personre-ID task [49]. Additionally, the knowledge learned fromdeteriorated classes aggravates the noise in the regeneratedpseudo labels, thus forming a vicious circle.
3) Random sampling leads to deteriorated over-fitting:When using random sampling, samples are randomly selected,so that the influence of randomness on a single sample and itsown trend on model training are intensified. This may causethe sample to break away from the class and break up theoriginal structure in the class, and also may lead to a singlesample dominating the optimization direction of the entireclass. These situations cause the original feature expression ofthe class to shift, resulting in undesirable similarity structurebeing strengthened. For example, as shown in Fig. 1, thefeatures of samples in the class are biased towards undesirablesimilarity. Once the semantic information represented by thisundesirable similarity structure is strengthened, those samplesthat have been correctly classified but do not have such simi-larity will be gradually repelled, thereby destroying the person
5
identity similarity structure within the class. Simultaneously,structural discrimination between different classes will notbe maintained, which leads to similarity structure in manyclasses being destroyed, many weak classes being swallowed,and undesirable similarities accumulating within classes. Thisultimately results in the deterioration of semantic information.The direct manifestation of this result is that the noise in thepseudo labels will increase, that is, the quality of the pseudolabel will continue to decrease. This is the reason for trainingcollapse caused by random sampling.
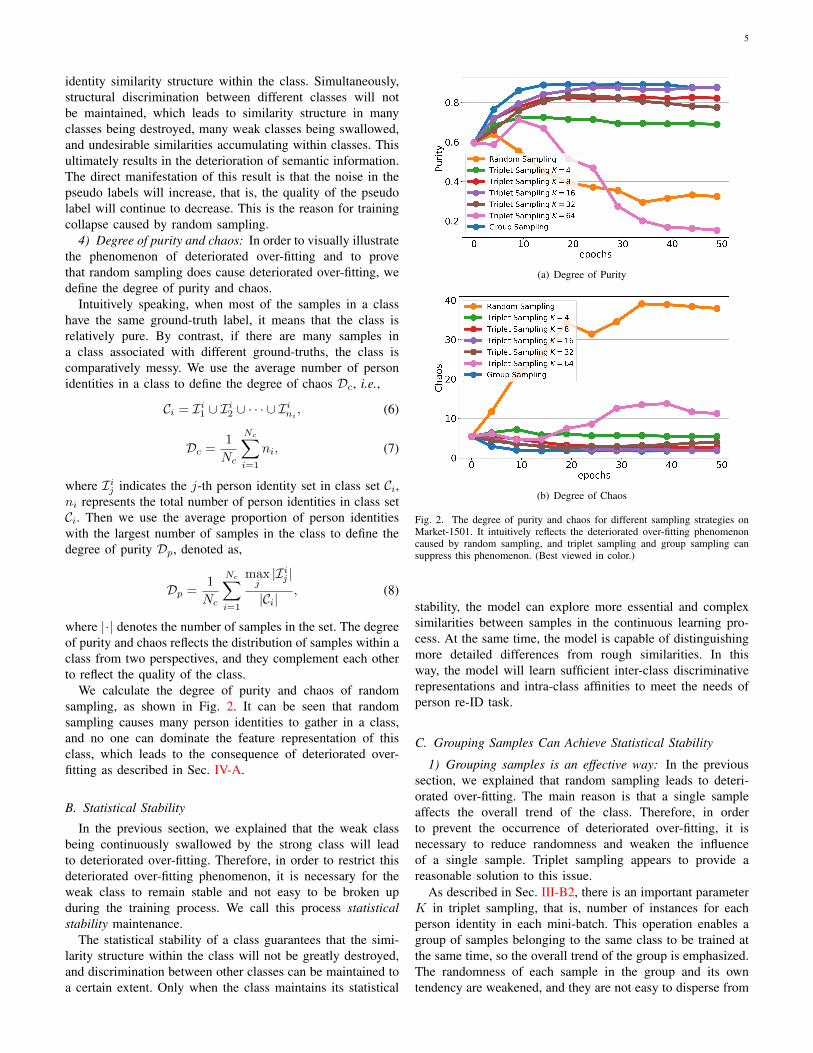
4) Degree of purity and chaos: In order to visually illustratethe phenomenon of deteriorated over-fitting and to provethat random sampling does cause deteriorated over-fitting, wedefine the degree of purity and chaos.
Intuitively speaking, when most of the samples in a classhave the same ground-truth label, it means that the class isrelatively pure. By contrast, if there are many samples ina class associated with different ground-truths, the class iscomparatively messy. We use the average number of personidentities in a class to define the degree of chaos Dc, i.e.,
Ci = Ii1 ∪ Ii2 ∪ · · · ∪ Iini, (6)
Dc =1
Nc
Nc∑i=1
ni, (7)
where Iij indicates the j-th person identity set in class set Ci,ni represents the total number of person identities in class setCi. Then we use the average proportion of person identitieswith the largest number of samples in the class to define thedegree of purity Dp, denoted as,
Dp =1
Nc
Nc∑i=1
maxj|Iij |
|Ci|, (8)
where |·| denotes the number of samples in the set. The degreeof purity and chaos reflects the distribution of samples within aclass from two perspectives, and they complement each otherto reflect the quality of the class.
We calculate the degree of purity and chaos of randomsampling, as shown in Fig. 2. It can be seen that randomsampling causes many person identities to gather in a class,and no one can dominate the feature representation of thisclass, which leads to the consequence of deteriorated over-fitting as described in Sec. IV-A.
B. Statistical Stability
In the previous section, we explained that the weak classbeing continuously swallowed by the strong class will leadto deteriorated over-fitting. Therefore, in order to restrict thisdeteriorated over-fitting phenomenon, it is necessary for theweak class to remain stable and not easy to be broken upduring the training process. We call this process statisticalstability maintenance.
The statistical stability of a class guarantees that the simi-larity structure within the class will not be greatly destroyed,and discrimination between other classes can be maintained toa certain extent. Only when the class maintains its statistical
(a) Degree of Purity
(b) Degree of Chaos
Fig. 2. The degree of purity and chaos for different sampling strategies onMarket-1501. It intuitively reflects the deteriorated over-fitting phenomenoncaused by random sampling, and triplet sampling and group sampling cansuppress this phenomenon. (Best viewed in color.)
stability, the model can explore more essential and complexsimilarities between samples in the continuous learning pro-cess. At the same time, the model is capable of distinguishingmore detailed differences from rough similarities. In thisway, the model will learn sufficient inter-class discriminativerepresentations and intra-class affinities to meet the needs ofperson re-ID task.
C. Grouping Samples Can Achieve Statistical Stability
1) Grouping samples is an effective way: In the previoussection, we explained that random sampling leads to deteri-orated over-fitting. The main reason is that a single sampleaffects the overall trend of the class. Therefore, in orderto prevent the occurrence of deteriorated over-fitting, it isnecessary to reduce randomness and weaken the influenceof a single sample. Triplet sampling appears to provide areasonable solution to this issue.
As described in Sec. III-B2, there is an important parameterK in triplet sampling, that is, number of instances for eachperson identity in each mini-batch. This operation enables agroup of samples belonging to the same class to be trained atthe same time, so the overall trend of the group is emphasized.The randomness of each sample in the group and its owntendency are weakened, and they are not easy to disperse from
6
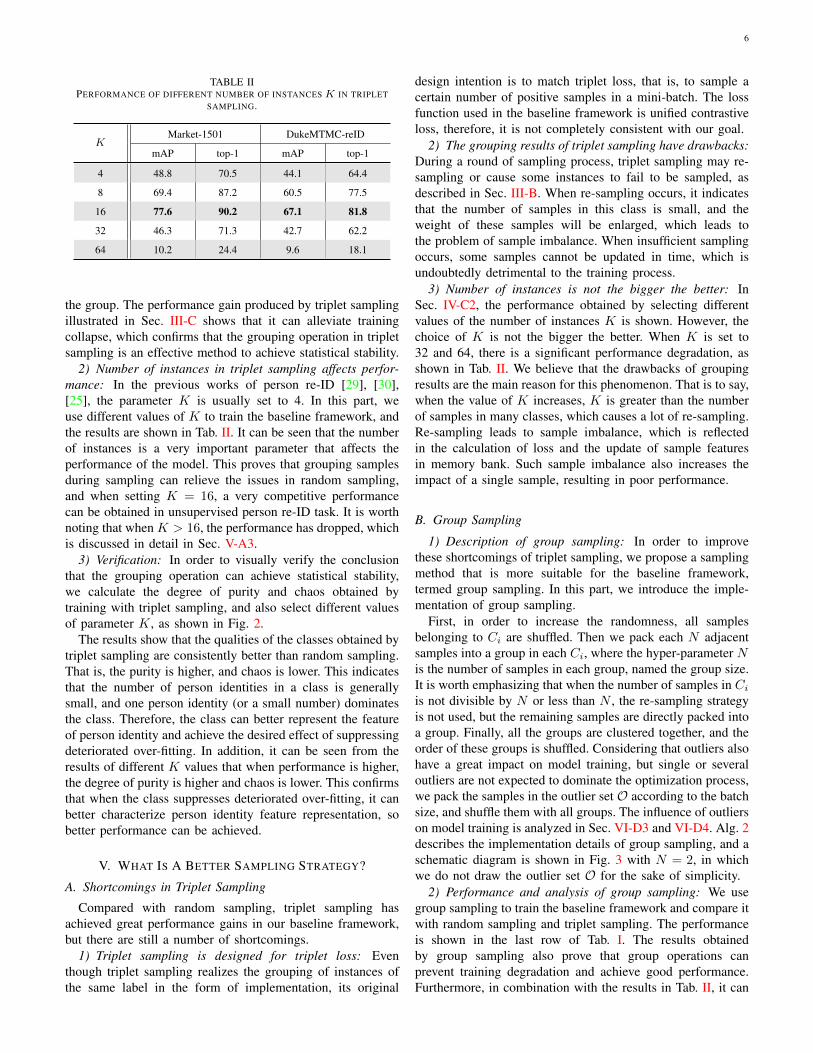
TABLE IIPERFORMANCE OF DIFFERENT NUMBER OF INSTANCES K IN TRIPLET
SAMPLING.
KMarket-1501 DukeMTMC-reID
mAP top-1 mAP top-1
4 48.8 70.5 44.1 64.4
8 69.4 87.2 60.5 77.5
16 77.6 90.2 67.1 81.8
32 46.3 71.3 42.7 62.2
64 10.2 24.4 9.6 18.1
the group. The performance gain produced by triplet samplingillustrated in Sec. III-C shows that it can alleviate trainingcollapse, which confirms that the grouping operation in tripletsampling is an effective method to achieve statistical stability.
2) Number of instances in triplet sampling affects perfor-mance: In the previous works of person re-ID [29], [30],[25], the parameter K is usually set to 4. In this part, weuse different values of K to train the baseline framework, andthe results are shown in Tab. II. It can be seen that the numberof instances is a very important parameter that affects theperformance of the model. This proves that grouping samplesduring sampling can relieve the issues in random sampling,and when setting K = 16, a very competitive performancecan be obtained in unsupervised person re-ID task. It is worthnoting that when K > 16, the performance has dropped, whichis discussed in detail in Sec. V-A3.
3) Verification: In order to visually verify the conclusionthat the grouping operation can achieve statistical stability,we calculate the degree of purity and chaos obtained bytraining with triplet sampling, and also select different valuesof parameter K, as shown in Fig. 2.
The results show that the qualities of the classes obtained bytriplet sampling are consistently better than random sampling.That is, the purity is higher, and chaos is lower. This indicatesthat the number of person identities in a class is generallysmall, and one person identity (or a small number) dominatesthe class. Therefore, the class can better represent the featureof person identity and achieve the desired effect of suppressingdeteriorated over-fitting. In addition, it can be seen from theresults of different K values that when performance is higher,the degree of purity is higher and chaos is lower. This confirmsthat when the class suppresses deteriorated over-fitting, it canbetter characterize person identity feature representation, sobetter performance can be achieved.
V. WHAT IS A BETTER SAMPLING STRATEGY?
A. Shortcomings in Triplet Sampling
Compared with random sampling, triplet sampling hasachieved great performance gains in our baseline framework,but there are still a number of shortcomings.
1) Triplet sampling is designed for triplet loss: Eventhough triplet sampling realizes the grouping of instances ofthe same label in the form of implementation, its original
design intention is to match triplet loss, that is, to sample acertain number of positive samples in a mini-batch. The lossfunction used in the baseline framework is unified contrastiveloss, therefore, it is not completely consistent with our goal.
2) The grouping results of triplet sampling have drawbacks:During a round of sampling process, triplet sampling may re-sampling or cause some instances to fail to be sampled, asdescribed in Sec. III-B. When re-sampling occurs, it indicatesthat the number of samples in this class is small, and theweight of these samples will be enlarged, which leads tothe problem of sample imbalance. When insufficient samplingoccurs, some samples cannot be updated in time, which isundoubtedly detrimental to the training process.
3) Number of instances is not the bigger the better: InSec. IV-C2, the performance obtained by selecting differentvalues of the number of instances K is shown. However, thechoice of K is not the bigger the better. When K is set to32 and 64, there is a significant performance degradation, asshown in Tab. II. We believe that the drawbacks of groupingresults are the main reason for this phenomenon. That is to say,when the value of K increases, K is greater than the numberof samples in many classes, which causes a lot of re-sampling.Re-sampling leads to sample imbalance, which is reflectedin the calculation of loss and the update of sample featuresin memory bank. Such sample imbalance also increases theimpact of a single sample, resulting in poor performance.
B. Group Sampling
1) Description of group sampling: In order to improvethese shortcomings of triplet sampling, we propose a samplingmethod that is more suitable for the baseline framework,termed group sampling. In this part, we introduce the imple-mentation of group sampling.
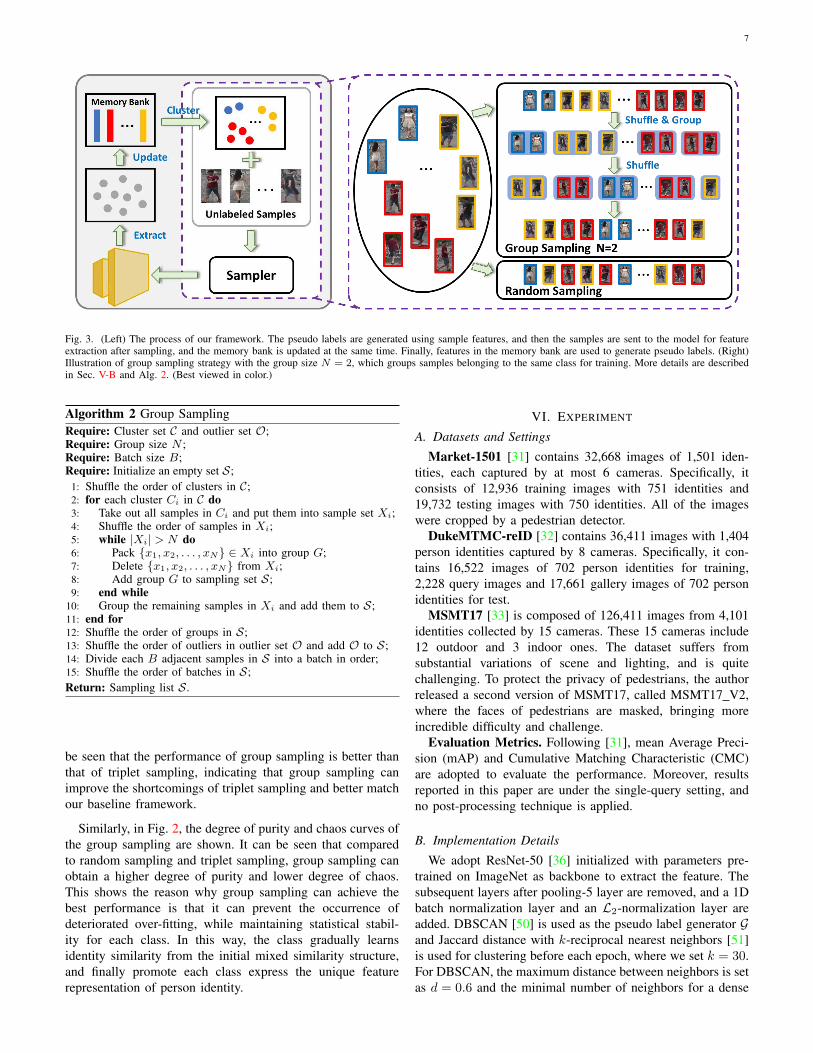
First, in order to increase the randomness, all samplesbelonging to Ci are shuffled. Then we pack each N adjacentsamples into a group in each Ci, where the hyper-parameter Nis the number of samples in each group, named the group size.It is worth emphasizing that when the number of samples in Ciis not divisible by N or less than N , the re-sampling strategyis not used, but the remaining samples are directly packed intoa group. Finally, all the groups are clustered together, and theorder of these groups is shuffled. Considering that outliers alsohave a great impact on model training, but single or severaloutliers are not expected to dominate the optimization process,we pack the samples in the outlier set O according to the batchsize, and shuffle them with all groups. The influence of outlierson model training is analyzed in Sec. VI-D3 and VI-D4. Alg. 2describes the implementation details of group sampling, and aschematic diagram is shown in Fig. 3 with N = 2, in whichwe do not draw the outlier set O for the sake of simplicity.
2) Performance and analysis of group sampling: We usegroup sampling to train the baseline framework and compare itwith random sampling and triplet sampling. The performanceis shown in the last row of Tab. I. The results obtainedby group sampling also prove that group operations canprevent training degradation and achieve good performance.Furthermore, in combination with the results in Tab. II, it can
7
Fig. 3. (Left) The process of our framework. The pseudo labels are generated using sample features, and then the samples are sent to the model for featureextraction after sampling, and the memory bank is updated at the same time. Finally, features in the memory bank are used to generate pseudo labels. (Right)Illustration of group sampling strategy with the group size N = 2, which groups samples belonging to the same class for training. More details are describedin Sec. V-B and Alg. 2. (Best viewed in color.)
Algorithm 2 Group SamplingRequire: Cluster set C and outlier set O;Require: Group size N ;Require: Batch size B;Require: Initialize an empty set S;
1: Shuffle the order of clusters in C;2: for each cluster Ci in C do3: Take out all samples in Ci and put them into sample set Xi;4: Shuffle the order of samples in Xi;5: while |Xi| > N do6: Pack {x1, x2, . . . , xN} ∈ Xi into group G;7: Delete {x1, x2, . . . , xN} from Xi;8: Add group G to sampling set S;9: end while
10: Group the remaining samples in Xi and add them to S;11: end for12: Shuffle the order of groups in S;13: Shuffle the order of outliers in outlier set O and add O to S;14: Divide each B adjacent samples in S into a batch in order;15: Shuffle the order of batches in S;Return: Sampling list S.
be seen that the performance of group sampling is better thanthat of triplet sampling, indicating that group sampling canimprove the shortcomings of triplet sampling and better matchour baseline framework.
Similarly, in Fig. 2, the degree of purity and chaos curves ofthe group sampling are shown. It can be seen that comparedto random sampling and triplet sampling, group sampling canobtain a higher degree of purity and lower degree of chaos.This shows the reason why group sampling can achieve thebest performance is that it can prevent the occurrence ofdeteriorated over-fitting, while maintaining statistical stabil-ity for each class. In this way, the class gradually learnsidentity similarity from the initial mixed similarity structure,and finally promote each class express the unique featurerepresentation of person identity.
VI. EXPERIMENT
A. Datasets and Settings
Market-1501 [31] contains 32,668 images of 1,501 iden-tities, each captured by at most 6 cameras. Specifically, itconsists of 12,936 training images with 751 identities and19,732 testing images with 750 identities. All of the imageswere cropped by a pedestrian detector.
DukeMTMC-reID [32] contains 36,411 images with 1,404person identities captured by 8 cameras. Specifically, it con-tains 16,522 images of 702 person identities for training,2,228 query images and 17,661 gallery images of 702 personidentities for test.
MSMT17 [33] is composed of 126,411 images from 4,101identities collected by 15 cameras. These 15 cameras include12 outdoor and 3 indoor ones. The dataset suffers fromsubstantial variations of scene and lighting, and is quitechallenging. To protect the privacy of pedestrians, the authorreleased a second version of MSMT17, called MSMT17 V2,where the faces of pedestrians are masked, bringing moreincredible difficulty and challenge.
Evaluation Metrics. Following [31], mean Average Preci-sion (mAP) and Cumulative Matching Characteristic (CMC)are adopted to evaluate the performance. Moreover, resultsreported in this paper are under the single-query setting, andno post-processing technique is applied.
B. Implementation Details
We adopt ResNet-50 [36] initialized with parameters pre-trained on ImageNet as backbone to extract the feature. Thesubsequent layers after pooling-5 layer are removed, and a 1Dbatch normalization layer and an L2-normalization layer areadded. DBSCAN [50] is used as the pseudo label generator Gand Jaccard distance with k-reciprocal nearest neighbors [51]is used for clustering before each epoch, where we set k = 30.For DBSCAN, the maximum distance between neighbors is setas d = 0.6 and the minimal number of neighbors for a dense
8
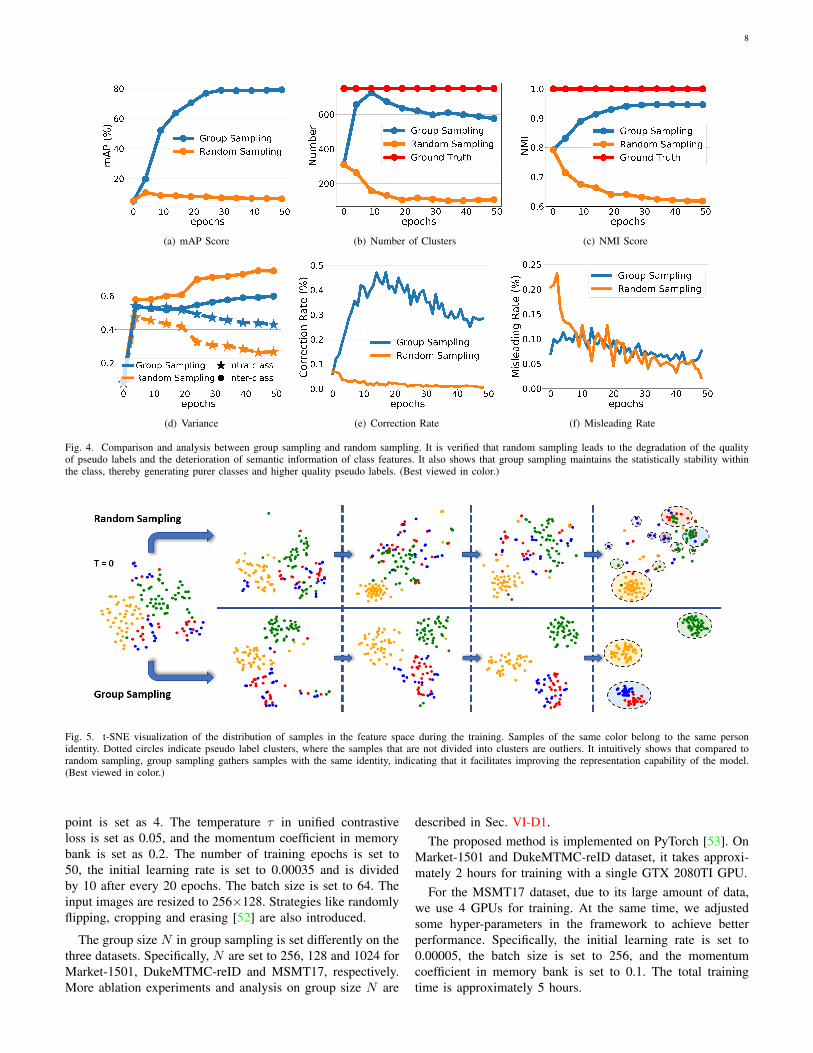
(a) mAP Score (b) Number of Clusters (c) NMI Score
(d) Variance (e) Correction Rate (f) Misleading Rate
Fig. 4. Comparison and analysis between group sampling and random sampling. It is verified that random sampling leads to the degradation of the qualityof pseudo labels and the deterioration of semantic information of class features. It also shows that group sampling maintains the statistically stability withinthe class, thereby generating purer classes and higher quality pseudo labels. (Best viewed in color.)
Fig. 5. t-SNE visualization of the distribution of samples in the feature space during the training. Samples of the same color belong to the same personidentity. Dotted circles indicate pseudo label clusters, where the samples that are not divided into clusters are outliers. It intuitively shows that compared torandom sampling, group sampling gathers samples with the same identity, indicating that it facilitates improving the representation capability of the model.(Best viewed in color.)
point is set as 4. The temperature τ in unified contrastiveloss is set as 0.05, and the momentum coefficient in memorybank is set as 0.2. The number of training epochs is set to50, the initial learning rate is set to 0.00035 and is dividedby 10 after every 20 epochs. The batch size is set to 64. Theinput images are resized to 256×128. Strategies like randomlyflipping, cropping and erasing [52] are also introduced.
The group size N in group sampling is set differently on thethree datasets. Specifically, N are set to 256, 128 and 1024 forMarket-1501, DukeMTMC-reID and MSMT17, respectively.More ablation experiments and analysis on group size N are
described in Sec. VI-D1.The proposed method is implemented on PyTorch [53]. On
Market-1501 and DukeMTMC-reID dataset, it takes approxi-mately 2 hours for training with a single GTX 2080TI GPU.
For the MSMT17 dataset, due to its large amount of data,we use 4 GPUs for training. At the same time, we adjustedsome hyper-parameters in the framework to achieve betterperformance. Specifically, the initial learning rate is set to0.00005, the batch size is set to 256, and the momentumcoefficient in memory bank is set to 0.1. The total trainingtime is approximately 5 hours.
9
C. AnalysisIn Sec. IV and V, we describe the feature deterioration
caused by random sampling and the statistical stability ofgroup sampling. In this section, we further analyze and com-pare the deteriorated over-fitting phenomenon and statisticalstability in four perspectives: number of clusters and Nor-malized Mutual Information (NMI) score, intra-class varianceand inter-class variance, and correction rate and misleadingrate, and feature visualization. All experiments are conductedwith unsupervised person re-ID setting on Market-1501. Theperformance in terms of mAP using random sampling andgroup sampling is shown in Fig. 4(a).
1) Number of clusters and NMI score: The number ofclusters generated by clustering and NMI score can intuitivelyreflect the quality of pseudo labels. Fig. 4(b) and 4(c) showthe curves of the number of clusters and NMI score usingrandom sampling and group sampling. It can be seen thatrandom sampling results in a sharp decrease in the numberof clusters and NMI score. Fig. 4(b) illustrates that randomsampling results in fewer clusters, indicating the samples aregrouped in large-scale clusters, where components are messier.NMI score further shows that the reliability of the pseudolabels generated by random sampling is very low. By contrast,the number of clusters obtained by group sampling is closer toground-truth identities of the dataset, and NMI score graduallyincreases, eventually reaching 0.95, showing higher reliabilityof the clusters and the effectiveness of group sampling.
2) Intra-class and inter-class variance: The intra-classvariance of samples within a class and the inter-class variancebetween classes are calculated to quantitatively analyze thedegree of aggregation and dispersion of samples in the featurespace. Fig. 4(d) shows the curves for intra-class and inter-classvariance during training. It can be seen that as the trainingprogresses, the intra-class variance is constantly decreasing,and the inter-class variance is increasing. It shows that samplesin the feature space are gradually grouped into compactclusters from a relatively dispersed state at the beginning, andthe distance between clusters is constantly increasing.
However, when comparing the variance curves of groupsampling and random sampling, it can be seen that the intra-class variance of group sampling is larger and the inter-class variance is smaller. As previously mentioned, due toincorrectly assigned pseudo labels, random sampling makesthe samples in each cluster tighter and the different clustersare more dispersed, resulting in incorrectly labeled samplesbeing categorized into the wrong cluster and samples withthe same ground-truth being scattered. Group sampling makeseach cluster looser and the distance between adjacent clusterscloser, so as to achieve relatively soft margin. The sampleswith wrong pseudo labels have more chances to break awayfrom the wrong class and be classified into the correct class. Inthis way, the reliability of pseudo labels is improved by groupsampling, and then the model’s representation capability isimproved iteratively.
3) Correction rate and misleading rate: In this part, wedefine the correction rate and misleading rate to further analyzethe difference between random sampling and group sampling.We find out the person identity set Iij∗ with the largest
proportion in each class Ci, as shown in Eq. (8), and then usej∗ to represent the principal identity of this class. If a sample’sperson identity j is consistent with the principal identity j∗ ofthe class to which the sample belongs, we subjectively definethat the sample is classified correctly.
We compare the classification results of samples in twoadjacent epochs. If the incorrectly classified sample in theprevious epoch is classified correctly in this epoch, we call itcorrection. On the contrary, if the correctly classified samplein the previous epoch is incorrectly classified in this epoch, wecall it misleading. The curves of correction rate and misleadingrate are shown in Fig. 4(e) and 4(f).
It illustrates that random sampling causes the correctionrate remains low during the training process, which makesthe initial misclassification of samples almost impossible torectify. At the same time, in the early stage of training,the misleading rate is relatively high, which causes an in-creasing number of errors to accumulate. This makes theoverall semantic information of the class to deviate and leadsto deteriorated over-fitting. This phenomenon confirms thedescription in Sec. IV-A. The decrease in the misleading ratein the latter stage of training is because the overall structure ofa class has been formed, and there are few sample interactionsbetween classes. In contrast, group sampling has a highercorrection rate, indicating that samples which are initiallymisclassified have more chances to be corrected, which helpsto gradually improve the quality of pseudo labels. At the sametime, the misleading rate is always within a reasonable range,which indicates that group sampling inhibits the degradationof semantic information of classes.
4) Visualization analysis of features: We randomly selectsamples for four person identities, and visualize the distribu-tion of these samples in the feature space during the trainingprocess, as shown in Fig. 5. For random sampling, the samplesof these four person identities are divided into clusters, eachof which contains multiple identity samples. It is worth notingthat the number of clusters produced by random sampling ismore than that observed in group sampling, which seems tobe contrary to statistical results in Sec. VI-C1 which suggeststhat random sampling results in fewer clusters. In fact, this isbecause the samples of each person identities are scattered inmany classes, as illustrated in Fig. 2(a) and 2(b), and there aremany samples of other person identities in each cluster whichare not drawn in the figure.
In contrast, it is obvious that group sampling can distinguishsamples with different person identities, and samples withthe same person identity can be correctly clustered. Althoughthere are two person identities (red and blue points) whichare classified into the same cluster, the samples are not mixedtogether and are still distinguishable. It is worth noting thateach pseudo label cluster contains only the samples shown inthe figure, and there are no samples with other identities.
Visualization results further validate that group samplingcan prevent samples with the same ground-truth identityfrom being misclassified into different classes, while avoidingdeteriorated over-fitting. Simultaneously, during the trainingprocess, the identity similarity structure is not destroyed,which helps the model gradually learn the characteristics of
10
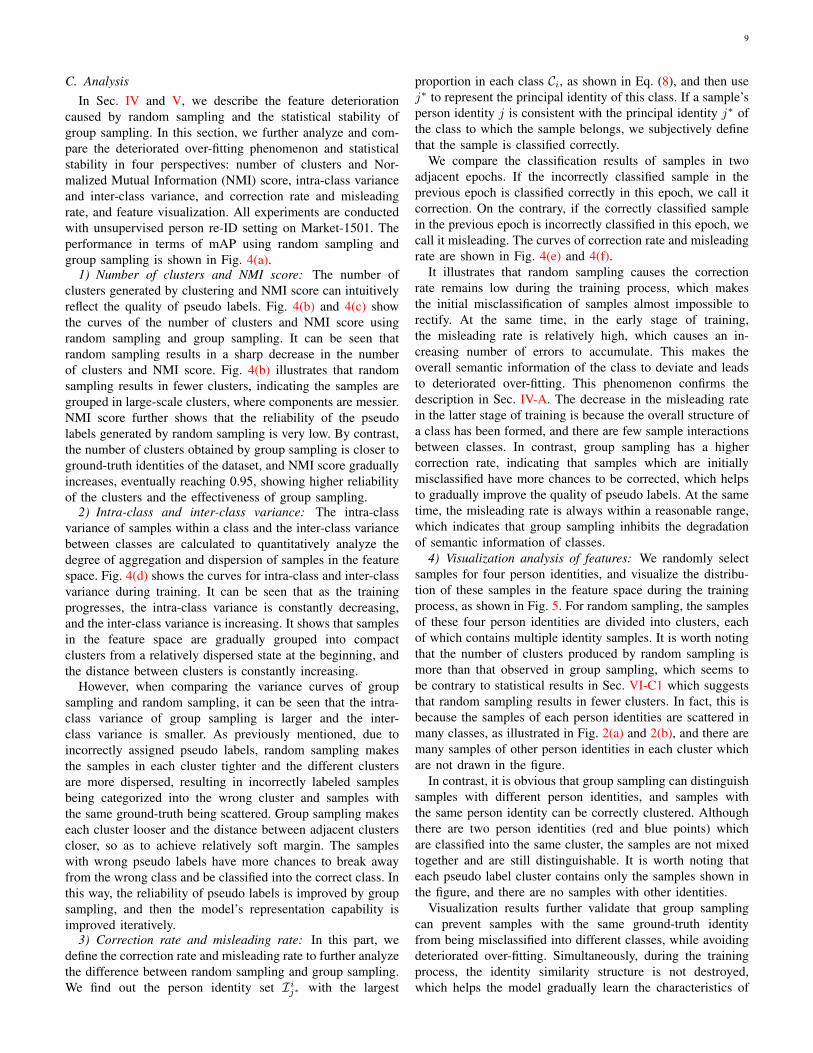
TABLE IIIABLATION STUDY ON PARAMETER N IN GROUP SAMPLING.
NMarket-1501 DukeMTMC-reID
mAP top-1 mAP top-1
1 6.1 15.1 4.2 12.32 13.1 28.2 5.6 12.24 20.2 37.4 8.0 16.78 44.6 66.4 15.1 26.0
16 64.5 82.9 54.3 72.032 76.7 90.2 66.8 81.664 78.1 90.7 68.7 83.1128 78.5 91.5 69.1 82.7256 79.2 92.3 68.9 82.0512 78.9 91.9 68.4 82.0
1024 79.1 91.6 69.1 82.5
TABLE IVABLATION STUDY ON SHUFFLING DEGREE ON MARKET-1501.
M mAP Number of Clusters NMI Score
1 79.2 607 0.954 65.0 436 0.79
16 16.6 210 0.8164 5.9 106 0.66all 6.1 104 0.62
each identity, thereby verifying the importance of statisticalstability described in Sec. IV-B.
D. Ablation Study
1) Group size N in group sampling: Tab. III reports theanalysis of group size N in group sampling. As discussed inSec. V-B, N is the number of samples in each group, whichplays an important role in affecting the optimization trend ofthe entire group. When N is small, a small number of samplesare grouped together, which does not enable the avoidanceof consequences related to deteriorated over-fitting. When Ngradually increases, the group can better guide the overalltrend of the class, which avoids the destruction of the similaritystructure and maintains statistical stability to a certain extent,leading to better performance.
Our ablation experiments are conducted on Market-1501and DukeMTMC-reID datasets. For the characteristics of thesetwo datasets, when N ≥ 64, the performance no longersignificantly changes, and fluctuation remains at around about1%. This shows that at that time each group has enoughsamples to represent the overall class trend, and increasingthe number of samples in the group will not increase the per-formance significantly. We believe that for different datasets,the selection of N may be different. Because of the differentnumber of images in the dataset, the number of samples ineach class is not the same. Therefore, the value of N needs tobe set according to a specific dataset. Samples in each groupneed to be able to characterize the overall trend of the entireclass, so it is also feasible to set N to be large enough to packall samples in the class into one group.
TABLE VABLATION STUDY ON INFLUENCE OF OUTLIERS. CLUSTERS: ONLY
CLUSTERED INSTANCES ARE USED FOR TRAINING. CLUSTERS +OUTLIERS: INCLUDING UN-CLUSTERED OUTLIERS INTO TRAINING DATA.
MethodMarket-1501 DukeMTMC-reID
mAP top-1 mAP top-1
Clusters 9.7 23.2 4.1 9.6
Clusters + Outliers 79.2 92.3 69.1 82.7
TABLE VIABLATION STUDY ON OUTLIER TREATMENT IN SAMPLING. TRE. I: THEOUTLIER SET INCLUDING ALL THE OUTLIERS IS TREATED AS A GROUP.
TRE. II: EACH OUTLIER IS TREATED AS AN INDEPENDENT GROUP.
Outliers SamplingMarket-1501 DukeMTMC-reID
mAP top-1 mAP top-1
Tre. ITriplet K = 4 52.9 75.3 46.7 65.5
Triplet K = 16 76.0 90.2 66.9 81.3
Group 79.2 92.3 69.1 82.7
Tre. IITriplet K = 4 48.8 70.5 44.1 64.4
Triplet K = 16 77.6 90.2 67.1 81.8
Group 64.2 81.1 62.8 79.3
2) Shuffling degree: In Sec. VI-C, experimental analysisshows that random sampling has a negative impact on thereliability of pseudo labels and the generalization performanceof the model, which indicates that it is unfavorable to shufflesamples with different labels during sampling. In this section,we show how shuffling impacts on the reliability of pseudolabels and performance. On the basis of group sampling, wepacked samples in adjacent M mini-batches into a set, andthen shuffle the samples in each set. When M is larger, theshuffling degree is higher. Obviously, M = 1 is equivalentto group sampling, and when all mini-batches are packed forshuffling, denoted as M = all, it is equivalent to randomsampling. We take M = {1, 4, 16, 64, all}, and the mAPscores, number of clusters and NMI scores are shown inTab. IV. This shows that with the increase of the shufflingdegree, performance decreases. In addition, the greater thedifference between the number of clusters and ground-truth,the lower the NMI score. Therefore, we argue that shuffling isnot conducive to the feature learning, and increased shufflingcreates an increased number of deficiencies.
3) Influence of outliers: We also investigated the impactof outliers on feature learning during training. Tab. V showsexperimental results when only clustered instances are usedfor training and when un-clustered outliers are included. Itcan be seen from the experimental results that the performanceobtained by only training using the samples in clusters is poor,which shows that outliers play a vital role in feature learningduring the training process.
Poor performance is mainly due to the clustering processwhich is performed on features stored in the memory bank,and the memory bank requires all entries to be continu-ously updated. When outliers are discarded, their featurescannot be updated and only a few samples take part in the
11
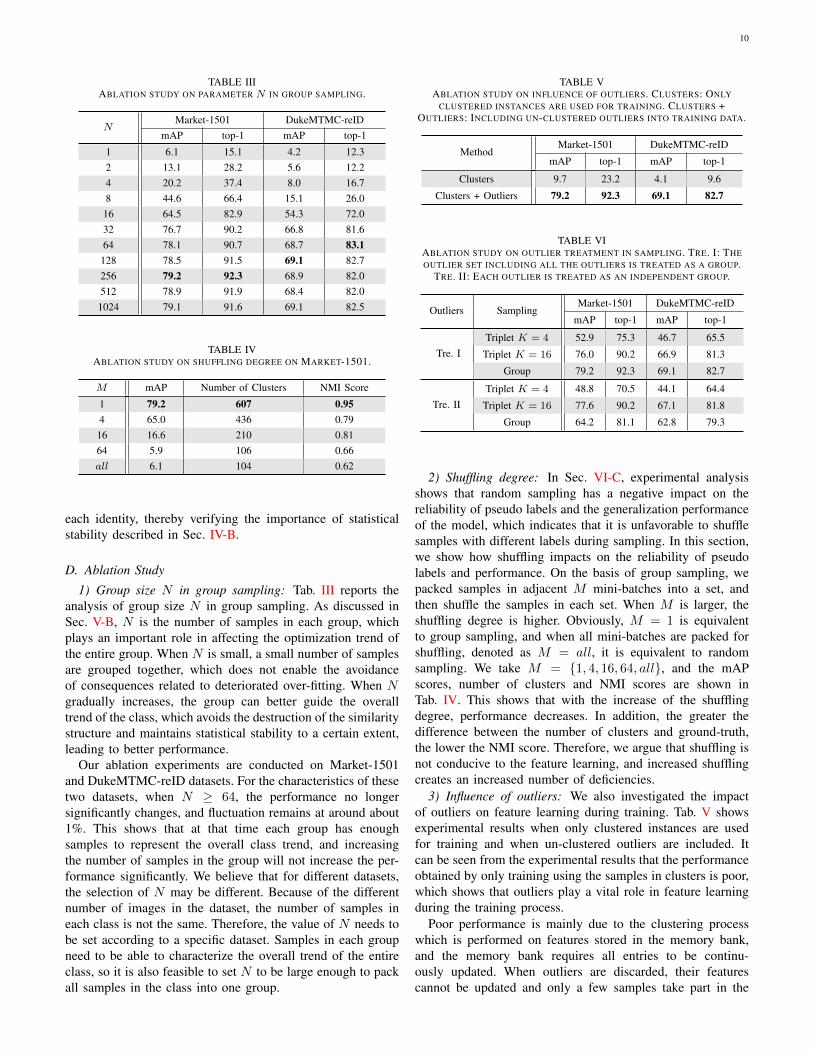
TABLE VIICOMPARISON OF THE STATE-OF-THE-ART UNSUPERVISED PERSON RE-ID METHODS WITH A RESNET-50 BACKBONE ON MARKET-1501,
DUKEMTMC-REID AND MSMT17. BOLD INDICATES THE BEST PERFORMANCE, AND UNDERLINE INDICATES THE SECOND BEST PERFORMANCE.
MethodMarket-1501 DukeMTMC-reID MSMT17
mAP top-1 top-5 top-10 mAP top-1 top-5 top-10 mAP top-1 top-5 top-10
LOMO [54] CVPR’15 8.0 27.2 41.6 49.1 4.8 12.3 21.3 26.6 - - - -
BOW [31] ICCV’15 14.8 35.8 52.4 60.3 8.3 17.1 28.8 34.9 - - - -
OIM [55] CVPR’17 14.0 38.0 58.0 66.3 11.3 24.5 38.8 46.0 - - - -
BUC [18] AAAI’19 38.3 66.2 79.6 84.5 27.5 47.4 62.6 68.4 - - - -
DBC [19] BMVC’19 41.3 69.1 83.0 87.8 30.0 51.5 64.6 70.1 - - - -
SSL [22] CVPR’20 37.8 71.7 83.8 87.4 28.6 52.5 63.5 68.9 - - - -
Y. Lin [21] TIP’20 38.0 73.7 84.0 87.9 30.6 56.1 66.7 71.5 9.9 31.4 41.4 45.7
MMCL [23] CVPR’20 45.5 80.3 89.4 92.3 40.2 65.2 75.9 80.0 11.2 35.4 44.8 49.8
JVCT [8] ECCV’20 41.8 72.9 84.2 88.7 42.2 67.6 78.0 81.6 15.1 39.0 50.9 56.8
JVCT+ [8] ECCV’20 47.5 79.5 89.2 91.9 50.7 74.6 82.9 85.3 17.3 43.1 53.8 59.4
HCT [24] CVPR’20 56.4 80.0 91.6 95.2 50.7 69.6 83.4 87.4 - - - -
SpCL [25] NeurIPS’20 73.1 88.1 95.1 97.0 65.3 81.2 90.3 92.2 19.1 42.3 55.6 61.2
DSCE [26] CVPR’21 61.7 83.9 92.3 - 53.8 73.8 84.2 - 15.5 35.2 48.3 -
GCL [27] CVPR’21 66.8 87.3 93.5 95.5 62.8 82.9 87.1 88.5 21.3 45.7 58.6 64.5
Ours 79.2 92.3 96.6 97.8 69.1 82.7 91.1 93.5 24.6 56.2 67.3 71.5
training, undoubtedly leading to training collapse. Note thatprevious unsupervised person re-ID methods [18], [24] whichabandoned outliers did not fail, since they did not utilize acontinuously updated memory bank.
4) Outlier treatment in sampling: Sec. V-B1 introduces aform of outlier treatment during group sampling, that is, alloutliers are placed into the outlier set O, and then treat O as agroup, denoted as Tre. I. Similarly, Sec. III-B2 introduces theway that triplet sampling handles outliers, that is, each outlieris treated as an independent group, denoted as Tre. II. Thispart uses triplet sampling and group sampling, while adoptingthese two outlier treatment approaches to conduct comparativeexperiments, as shown in Tab. VI.
It can be seen that when outlier treatment in triplet sam-pling is replaced with Tre. I, higher performance cannotbe achieved. This indicates that the outlier treatment is notthe factor inhibiting triplet sampling performance. When aspecific outlier treatment in group sampling is replaced withTre. II, performance drops significantly, which indicates thatthis treatment is unsuitable for group sampling. We suggestthat this treatment causes un-clustered outliers and clusteredinstances to be sampled in the same mini-batch. Therefore,when there are few samples in a cluster, the cluster is easilyaffected by outliers in the mini-batch. In this case, re-samplingclustered instances in triplet sampling alleviates the impact ofthe outliers to a certain extent, which is confirmed by theperformance of K = 16 in the penultimate row of Tab. VI.Conversely, Tre. II ensures that there are only un-clusteredoutliers or only clustered instances in a mini-batch, whichreduces the mutual influence of them, and is more suitablefor group sampling strategy.
E. Comparison with the State-of-the-art Methods
We compare the proposed method with the state-of-the-art unsupervised person re-ID methods [54], [31], [55], [18],[19], [22], [23], [24], [25] on Market-1501 [31], DukeMTMC-reID [32] and MSMT17 [33]. Following conventional settings,we use the same backbone, i.e. ResNet-50, as other methods.Results are reported in Tab. VII. Note that the method listedin this table do not use the labeled source dataset.
As shown in Tab. VII, we observe our method is com-petitive with all the state-of-the-art methods. For example, itoutperforms the current state-of-the-art (SpCL [25]) by 6.1%of mAP and 4.2% of rank-1 accuracy on Market-1501. OnDukeMTMC-reID, our method is also 3.8% higher than SpCLin terms of mAP. In addition, we use the latest MSMT17 V2dataset version for training and testing, which is more difficultand challenging than MSMT17 V1. On MSMT17 V2, ourmethod is also effective and achieves a high performance of24.6% in mAP and 56.2% in rank-1 accuracy.
VII. CONCLUSION
In this paper, we give an in-depth analysis of samplingstrategies and reveal that they play an important role in the taskof unsupervised person re-ID. The new concepts introducedinclude deteriorated over-fitting and statistical stability. Differ-ent sampling strategies applied to the same framework obtainvery different performance, e.g., random sampling easily leadsto training collapse due to the deteriorated over-fitting, whiletriplet sampling obtains relatively good performance. In addi-tion, inspired by the fact that grouping samples can effectivelymaintain statistical stability to against deterioration, we furtherpropose a novel group sampling strategy for pseudo-label-based unsupervised person re-ID. Group sampling rectifies the
12
shortcomings of previous sampling strategies, and effectivelyalleviates the negative effect of a single sample for statisti-cal stability of unsupervised models. Extensive experimentalresults illustrate that the proposed method achieves state-of-the-art performance on Market-1501, DukeMTMC-reID andMSMT17 without introducing any additional costs.
REFERENCES
[1] W. Deng, L. Zheng, Q. Ye, G. Kang, Y. Yang, and J. Jiao, “Image-image domain adaptation with preserved self-similarity and domain-dissimilarity for person re-identification,” in CVPR, 2018, pp. 994–1003.
[2] W. Deng, L. Zheng, Q. Ye, Y. Yang, and J. Jiao, “Similarity-preservingimage-image domain adaptation for person re-identification,” arXivpreprint arXiv:1811.10551, 2018.
[3] Z. Zhong, L. Zheng, S. Li, and Y. Yang, “Generalizing a person retrievalmodel hetero-and homogeneously,” in ECCV, 2018, pp. 172–188.
[4] Y. Zhai, Q. Ye, S. Lu, M. Jia, R. Ji, and Y. Tian, “Multiple expertbrainstorming for domain adaptive person re-identification,” in ECCV.Springer, 2020, pp. 594–611.
[5] Y. Chen, X. Zhu, and S. Gong, “Instance-guided context rendering forcross-domain person re-identification,” in ICCV, 2019, pp. 232–242.
[6] Y. Ge, D. Chen, and H. Li, “Mutual mean-teaching: Pseudo labelrefinery for unsupervised domain adaptation on person re-identification,”in ICLR, 2019.
[7] Y. Zhai, S. Lu, Q. Ye, X. Shan, J. Chen, R. Ji, and Y. Tian, “Ad-cluster: Augmented discriminative clustering for domain adaptive personre-identification,” in CVPR, 2020, pp. 9021–9030.
[8] J. Li and S. Zhang, “Joint visual and temporal consistency for unsuper-vised domain adaptive person re-identification,” in ECCV. Springer,2020, pp. 483–499.
[9] F. Zhao, S. Liao, G.-S. Xie, J. Zhao, K. Zhang, and L. Shao, “Unsuper-vised domain adaptation with noise resistible mutual-training for personre-identification,” in ECCV. Springer, 2020, pp. 526–544.
[10] Y. Zou, X. Yang, Z. Yu, B. Kumar, and J. Kautz, “Joint disentanglingand adaptation for cross-domain person re-identification,” in ECCV.Springer, 2020, pp. 87–104.
[11] Y. Tang, X. Yang, N. Wang, B. Song, and X. Gao, “Cgan-tm: A noveldomain-to-domain transferring method for person re-identification,” TIP,vol. 29, pp. 5641–5651, 2020.
[12] K. Jiang, T. Zhang, Y. Zhang, F. Wu, and Y. Rui, “Self-supervised agentlearning for unsupervised cross-domain person re-identification,” TIP,vol. 29, pp. 8549–8560, 2020.
[13] S. Lin, C.-T. Li, and A. C. Kot, “Multi-domain adversarial featuregeneralization for person re-identification,” TIP, vol. 30, pp. 1596–1607,2020.
[14] H. Feng, M. Chen, J. Hu, D. Shen, H. Liu, and D. Cai, “Complemen-tary pseudo labels for unsupervised domain adaptation on person re-identification,” TIP, vol. 30, pp. 2898–2907, 2021.
[15] Y. Dai, J. Liu, Y. Bai, Z. Tong, and L.-Y. Duan, “Dual-refinement: Jointlabel and feature refinement for unsupervised domain adaptive personre-identification,” TIP, 2021.
[16] Y. Fu, Y. Wei, G. Wang, Y. Zhou, H. Shi, and T. S. Huang, “Self-similarity grouping: A simple unsupervised cross domain adaptationapproach for person re-identification,” in ICCV, 2019, pp. 6112–6121.
[17] H.-X. Yu, W.-S. Zheng, A. Wu, X. Guo, S. Gong, and J.-H. Lai,“Unsupervised person re-identification by soft multilabel learning,” inCVPR, 2019, pp. 2148–2157.
[18] Y. Lin, X. Dong, L. Zheng, Y. Yan, and Y. Yang, “A bottom-up clusteringapproach to unsupervised person re-identification,” in AAAI, vol. 33,no. 01, 2019, pp. 8738–8745.
[19] G. Ding, S. H. Khan, Z. Tang, J. Zhang, and F. Porikli, “Dispersionbased clustering for unsupervised person re-identification.” in BMVC,vol. 2, no. 7, 2019, p. 8.
[20] M. Ye, J. Li, A. J. Ma, L. Zheng, and P. C. Yuen, “Dynamic graph co-matching for unsupervised video-based person re-identification,” TIP,vol. 28, no. 6, pp. 2976–2990, 2019.
[21] Y. Lin, Y. Wu, C. Yan, M. Xu, and Y. Yang, “Unsupervised person re-identification via cross-camera similarity exploration,” TIP, vol. 29, pp.5481–5490, 2020.
[22] Y. Lin, L. Xie, Y. Wu, C. Yan, and Q. Tian, “Unsupervised personre-identification via softened similarity learning,” in CVPR, 2020, pp.3390–3399.
[23] D. Wang and S. Zhang, “Unsupervised person re-identification via multi-label classification,” in CVPR, 2020, pp. 10 981–10 990.
[24] K. Zeng, M. Ning, Y. Wang, and Y. Guo, “Hierarchical clustering withhard-batch triplet loss for person re-identification,” in CVPR, 2020, pp.13 657–13 665.
[25] Y. Ge, F. Zhu, D. Chen, R. Zhao, and H. Li, “Self-paced contrastivelearning with hybrid memory for domain adaptive object re-id,” inNeurIPS, 2020.
[26] F. Yang, Z. Zhong, Z. Luo, Y. Cai, S. Li, and S. Nicu, “Joint noise-tolerant learning and meta camera shift adaptation for unsupervisedperson re-identification,” in CVPR, 2021, pp. 4855–4864.
[27] H. Chen, Y. Wang, B. Lagadec, A. Dantcheva, and F. Bremond,“Joint generative and contrastive learning for unsupervised person re-identification,” in CVPR, 2021, pp. 2004–2013.
[28] F. Schroff, D. Kalenichenko, and J. Philbin, “Facenet: A unified embed-ding for face recognition and clustering,” in CVPR, 2015, pp. 815–823.
[29] A. Hermans*, L. Beyer*, and B. Leibe, “In defense of the triplet lossfor person re-identification,” arXiv preprint arXiv:1703.07737, 2017.
[30] H. Luo, W. Jiang, Y. Gu, F. Liu, X. Liao, S. Lai, and J. Gu, “A strongbaseline and batch normalization neck for deep person re-identification,”TMM, vol. 22, no. 10, pp. 2597–2609, 2019.
[31] L. Zheng, L. Shen, L. Tian, S. Wang, J. Wang, and Q. Tian, “Scalableperson re-identification: A benchmark,” in ICCV, 2015, pp. 1116–1124.
[32] E. Ristani, F. Solera, R. Zou, R. Cucchiara, and C. Tomasi, “Performancemeasures and a data set for multi-target, multi-camera tracking,” inECCV. Springer, 2016, pp. 17–35.
[33] L. Wei, S. Zhang, W. Gao, and Q. Tian, “Person transfer gan to bridgedomain gap for person re-identification,” in CVPR, 2018, pp. 79–88.
[34] C.-Y. Wu, R. Manmatha, A. J. Smola, and P. Krahenbuhl, “Samplingmatters in deep embedding learning,” in ICCV, 2017, pp. 2840–2848.
[35] P. Zhao and T. Zhang, “Stochastic optimization with importance sam-pling for regularized loss minimization,” in ICML, 2015.
[36] K. He, X. Zhang, S. Ren, and J. Sun, “Deep residual learning for imagerecognition,” in CVPR, 2016, pp. 770–778.
[37] S. Bell and K. Bala, “Learning visual similarity for product design withconvolutional neural networks,” ACM transactions on graphics (TOG),vol. 34, no. 4, pp. 1–10, 2015.
[38] S. Chopra, R. Hadsell, and Y. LeCun, “Learning a similarity metricdiscriminatively, with application to face verification,” in CVPR, vol. 1,2005, pp. 539–546.
[39] R. Hadsell, S. Chopra, and Y. LeCun, “Dimensionality reduction bylearning an invariant mapping,” in CVPR, vol. 2, 2006, pp. 1735–1742.
[40] E. Simo-Serra, E. Trulls, L. Ferraz, I. Kokkinos, P. Fua, and F. Moreno-Noguer, “Discriminative learning of deep convolutional feature pointdescriptors,” in ICCV, 2015, pp. 118–126.
[41] O. M. Parkhi, A. Vedaldi, and A. Zisserman, “Deep face recognition,”2015.
[42] H. Oh Song, Y. Xiang, S. Jegelka, and S. Savarese, “Deep metriclearning via lifted structured feature embedding,” in CVPR, 2016.
[43] Z. Wu, Y. Xiong, S. X. Yu, and D. Lin, “Unsupervised feature learningvia non-parametric instance discrimination,” in CVPR, 2018, pp. 3733–3742.
[44] A. v. d. Oord, Y. Li, and O. Vinyals, “Representation learning withcontrastive predictive coding,” arXiv preprint arXiv:1807.03748, 2018.
[45] Y. Tian, D. Krishnan, and P. Isola, “Contrastive multiview coding,” arXivpreprint arXiv:1906.05849, 2019.
[46] K. He, H. Fan, Y. Wu, S. Xie, and R. Girshick, “Momentum contrastfor unsupervised visual representation learning,” in CVPR, 2020, pp.9729–9738.
[47] T. Chen, S. Kornblith, M. Norouzi, and G. Hinton, “A simple frameworkfor contrastive learning of visual representations,” in Internationalconference on machine learning. PMLR, 2020, pp. 1597–1607.
[48] M. Caron, P. Bojanowski, A. Joulin, and M. Douze, “Deep clustering forunsupervised learning of visual features,” in ECCV, 2018, pp. 132–149.
[49] M. Ye, J. Shen, G. Lin, T. Xiang, L. Shao, and S. C. Hoi, “Deep learningfor person re-identification: A survey and outlook,” TPAMI, 2021.
[50] M. Ester, H. P. Kriegel, J. Sander, and X. Xu, “A density-based algorithmfor discovering clusters in large spatial databases with noise,” in KDD,vol. 96, no. 34, 1996, pp. 226–231.
[51] Z. Zhong, L. Zheng, D. Cao, and S. Li, “Re-ranking person re-identification with k-reciprocal encoding,” in CVPR, 2017, pp. 1318–1327.
[52] Z. Zhong, L. Zheng, G. Kang, S. Li, and Y. Yang, “Random erasingdata augmentation,” in AAAI, vol. 34, no. 07, 2020, pp. 13 001–13 008.
[53] A. Paszke, S. Gross, F. Massa, A. Lerer, J. Bradbury, G. Chanan,T. Killeen, Z. Lin, N. Gimelshein, L. Antiga et al., “Pytorch: Animperative style, high-performance deep learning library,” NeurIPS,vol. 32, pp. 8026–8037, 2019.
13
[54] S. Liao, Y. Hu, X. Zhu, and S. Z. Li, “Person re-identification by localmaximal occurrence representation and metric learning,” in CVPR, 2015,pp. 2197–2206.
[55] T. Xiao, S. Li, B. Wang, L. Lin, and X. Wang, “Joint detection andidentification feature learning for person search,” in CVPR, 2017, pp.3415–3424.
Xumeng Han received the B.E. degree in elec-tronic and information engineering from Universityof Electronic Science and Technology of China,China, in 2019. He is currently pursuing the M.S.degree in electronic and communication engineeringwith University of Chinese Academy of Sciences.His research interests include machine learning andcomputer vision.
Xuehui Yu received the B.E. degree in softwareengineering from Tianjin University, China, in 2017.He is currently pursuing the Ph.D. degree in signaland information processing with University of Chi-nese Academy of Sciences. His research interestsinclude machine learning and computer vision.
Guorong Li received her B.S. degree in technologyof computer application from Renmin University ofChina, in 2006 and Ph.D. degree in technology ofcomputer application from the Graduate Universityof the Chinese Academy of Sciences in 2012.
Now, she is an associate professor at the Univer-sity of Chinese Academy of Sciences. Her researchinterests include object tracking, video analysis, pat-tern recognition, and cross-media analysis.
Jian Zhao received the Bachelors degree fromBeihang University in 2012, the Masters degree fromNational University of Defense Technology in 2014,and the Ph.D. degree from National University ofSingapore in 2019. He is currently an AssistantProfessor with Institute of North Electronic Equip-ment, Beijing, China. His main research interestsinclude deep learning, pattern recognition, computervision and multimedia analysis. He has publishedover 40 cutting-edge papers. He has received ”2020-2022 Youth Talent Promotion Project” from China
Association for Science and Technology in 2021 and “2021-2023 BeijingYouth Talent Promotion Project” from Beijing Association for Science andTechnology in 2020. He has won the Lee Hwee Kuan Award (Gold Award)on PREMIA 2019, the “Best Student Paper Award on ACM MM 2018, andthe top-3 awards several times on world-wide competitions. He is the SACof VALSE, the committee member of CSIG-BVD, and the member of theboard of directors of BSIG. He has served as the invited reviewer of NSFC,T-PAMI, IJCV, NeurIPS (one of the top 30% highest-scoring reviewers ofNeurIPS 2018), CVPR, etc.
Gang Pan received the B.S., M.S. and Ph.D. degreesin School of Computer Software and School ofComputer Science from Tianjin University, China, in2006, 2008 and 2013, respectively. He was a visitingstudent with Department of Computing, Universityof Alberta, Canada, from 2009 to 2010. Now he is anassociate professor with the College of Intelligenceand Computing, Tianjin University. His research in-terests include computer vision and image synthesis,especially in the fields of industrial robot and cultureheritage.
Qixiang Ye (M’10-SM’15) received the B.S. andM.S. degrees in mechanical and electrical engineer-ing from Harbin Institute of Technology, China, in1999 and 2001, respectively, and the Ph.D. degreefrom the Institute of Computing Technology, Chi-nese Academy of Sciences in 2006. He has been aprofessor with the University of Chinese Academyof Sciences since 2009, and was a visiting assistantprofessor with the Institute of Advanced ComputerStudies (UMIACS), University of Maryland, CollegePark until 2013. His research interests include image
processing, visual object detection and machine learning. He pioneered theKernel SVM based pyrolysis output prediction software which was putinto practical application by SINOPEC in 2012. He developed two kindsof piecewise linear SVM methods which were successfully applied intovisual object detection. He has published more than 100 papers in refereedconferences and journals including IEEE CVPR, ICCV, ECCV and PAMI,and received the Sony Outstanding Paper Award.
Jianbin Jiao received the B.S., M.S., and Ph.D.degrees in mechanical and electronic engineeringfrom Harbin Institute of Technology (HIT), Harbin,China, in 1989, 1992, and 1995, respectively. From1997 to 2005, he was an Associate Professor withHIT. Since 2006, he has been a Professor with theSchool of Electronic, Electrical, and CommunicationEngineering, University of the Chinese Academy ofSciences, Beijing, China. His current research inter-ests include image processing, pattern recognition,and intelligent surveillance.
Zhenjun Han received the B.S. degree in soft-ware engineering from Tianjin University, Tianjin,China, in 2006 and the M.S. and Ph.D. degreesfrom University of Chinese Academy of Sciences,Beijing, China, in 2009 and 2012, respectively. Since2013, he has been an Associate Professor with theSchool of Electronic, Electrical, and CommunicationEngineering, University of Chinese Academy of Sci-ences. His research interests include object trackingand detection.


![mangye,andyjhma,jwli,pcyuen @comp.hkbu.edu.hk ... · arXiv:1709.09297v1 [cs.CV] 27 Sep 2017 Dynamic Label Graph Matching for Unsupervised Video Re-Identification Mang Ye 1 , Andy](https://img.pdfslide.net/doc/110x75/5fc0937663d0495e7b03c64b/mangyeandyjhmajwlipcyuen-comphkbueduhk-arxiv170909297v1-cscv-27.jpg)